Indigo Shire - renewable energy mapping - Indigo Shire Council
Indigo Shire - renewable energy mapping - Indigo Shire Council
Indigo Shire - renewable energy mapping - Indigo Shire Council
You also want an ePaper? Increase the reach of your titles
YUMPU automatically turns print PDFs into web optimized ePapers that Google loves.
Earth Systems<br />
Tables<br />
Mapping and Brokering Local Energy Solutions in <strong>Indigo</strong> <strong>Shire</strong><br />
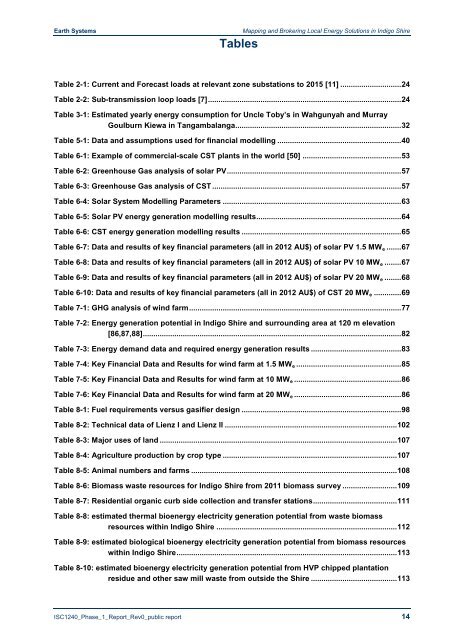
Table 2-1: Current and Forecast loads at relevant zone substations to 2015 [11] ............................. 24<br />
Table 2-2: Sub-transmission loop loads [7] ............................................................................................ 24<br />
Table 3-1: Estimated yearly <strong>energy</strong> consumption for Uncle Toby’s in Wahgunyah and Murray<br />
Goulburn Kiewa in Tangambalanga............................................................................... 32<br />
Table 5-1: Data and assumptions used for financial modelling ........................................................... 40<br />
Table 6-1: Example of commercial-scale CST plants in the world [50] ............................................... 53<br />
Table 6-2: Greenhouse Gas analysis of solar PV ................................................................................... 57<br />
Table 6-3: Greenhouse Gas analysis of CST .......................................................................................... 57<br />
Table 6-4: Solar System Modelling Parameters ..................................................................................... 63<br />
Table 6-5: Solar PV <strong>energy</strong> generation modelling results ..................................................................... 64<br />
Table 6-6: CST <strong>energy</strong> generation modelling results ............................................................................ 65<br />
Table 6-7: Data and results of key financial parameters (all in 2012 AU$) of solar PV 1.5 MW e ....... 67<br />
Table 6-8: Data and results of key financial parameters (all in 2012 AU$) of solar PV 10 MW e ........ 67<br />
Table 6-9: Data and results of key financial parameters (all in 2012 AU$) of solar PV 20 MW e ........ 68<br />
Table 6-10: Data and results of key financial parameters (all in 2012 AU$) of CST 20 MW e ............. 69<br />
Table 7-1: GHG analysis of wind farm ..................................................................................................... 77<br />
Table 7-2: Energy generation potential in <strong>Indigo</strong> <strong>Shire</strong> and surrounding area at 120 m elevation<br />
[86,87,88] ........................................................................................................................... 82<br />
Table 7-3: Energy demand data and required <strong>energy</strong> generation results ........................................... 83<br />
Table 7-4: Key Financial Data and Results for wind farm at 1.5 MW e .................................................. 85<br />
Table 7-5: Key Financial Data and Results for wind farm at 10 MW e ................................................... 86<br />
Table 7-6: Key Financial Data and Results for wind farm at 20 MW e ................................................... 86<br />
Table 8-1: Fuel requirements versus gasifier design ............................................................................ 98<br />
Table 8-2: Technical data of Lienz I and Lienz II .................................................................................. 102<br />
Table 8-3: Major uses of land ................................................................................................................. 107<br />
Table 8-4: Agriculture production by crop type ................................................................................... 107<br />
Table 8-5: Animal numbers and farms .................................................................................................. 108<br />
Table 8-6: Biomass waste resources for <strong>Indigo</strong> <strong>Shire</strong> from 2011 biomass survey .......................... 109<br />
Table 8-7: Residential organic curb side collection and transfer stations ........................................ 111<br />
Table 8-8: estimated thermal bio<strong>energy</strong> electricity generation potential from waste biomass<br />
resources within <strong>Indigo</strong> <strong>Shire</strong> ...................................................................................... 112<br />
Table 8-9: estimated biological bio<strong>energy</strong> electricity generation potential from biomass resources<br />
within <strong>Indigo</strong> <strong>Shire</strong> ......................................................................................................... 113<br />
Table 8-10: estimated bio<strong>energy</strong> electricity generation potential from HVP chipped plantation<br />
residue and other saw mill waste from outside the <strong>Shire</strong> ......................................... 113<br />
ISC1240_Phase_1_Report_Rev0_public report 14


