- Page 2 and 3:
Pro ASP.NET MVC 5 Adam Freeman 2
- Page 4 and 5:
Dedicated to my lovely wife, Jacqui
- Page 6 and 7:
Contents About the Author About the
- Page 8 and 9:
Preparing the Example Project Defin
- Page 10 and 11:
Chapter 9: SportsStore: Completing
- Page 12 and 13:
Constraining Routes Constraining a
- Page 14 and 15:
Using Other Filter Features Filteri
- Page 16 and 17:
Creating the Ajax Form Understandin
- Page 18 and 19:
Index 18
- Page 20 and 21:
About the Technical Reviewer Fabio
- Page 22 and 23:
What Is Wrong with ASP.NET Web Form
- Page 24 and 25:
storage and querying language for s
- Page 26 and 27:
There are some good reasons for car
- Page 28 and 29:
Where Can I Get the Example Code? Y
- Page 30 and 31:
Figure 2-1. The Visual Studio ASP.N
- Page 32 and 33:
Figure 2-3. The initial file and fo
- Page 34 and 35:
Figure 2-6. Adding a controller to
- Page 36 and 37:
} } } return View(); A good way of
- Page 38 and 39:
Figure 2-9. The MVC Framework tryin
- Page 40 and 41:
Visual Studio will create a file ca
- Page 42 and 43:
Afternoon"; } } } return View(); I
- Page 44 and 45:
Figure 2-14. Adding to the view HTM
- Page 46 and 47:
public class HomeController : Contr
- Page 48 and 49:
} Will you attend? @Html.DropDown
- Page 50 and 51:
Figure 2-18. Setting the default st
- Page 52 and 53:
type without needing to qualify the
- Page 54 and 55:
[Required(ErrorMessage = "Please en
- Page 56 and 57:
Figure 2-21. The validation summary
- Page 58 and 59:
Tip You can drag JavaScript and CSS
- Page 60 and 61:
expect files to be in certain locat
- Page 62 and 63:
RSVP @using (Html.BeginForm()) {
- Page 64 and 65:
Thanks body { background-colo
- Page 66 and 67:
CHAPTER 3 The MVC Pattern Before I
- Page 68 and 69:
ASP.NET MVC doesn’t apply any con
- Page 70 and 71:
as thinly disguised Smart UI applic
- Page 72 and 73:
this case PasswordResetHelper. I do
- Page 74 and 75:
Web server and database. Integratio
- Page 76 and 77:
public class AdminControllerTests {
- Page 78 and 79:
The drawback of TDD is that it requ
- Page 80 and 81:
} } } return "Navigate to a URL to
- Page 82 and 83:
namespace LanguageFeatures.Controll
- Page 84 and 85:
} set { name = value; } } } public
- Page 86 and 87:
The listing demonstrates how to con
- Page 88 and 89:
using System.Collections; using Sys
- Page 90 and 91:
using System.Collections.Generic; n
- Page 92 and 93:
public static IEnumerable FilterByC
- Page 94 and 95:
Products = new List { new Product {
- Page 96 and 97:
... In this example, myAnonType is
- Page 98 and 99:
public string Index() { return "Nav
- Page 100 and 101:
Max Min Returns the largest or smal
- Page 102 and 103:
usiness while the background work i
- Page 104 and 105:
natural syntax, but they do not cha
- Page 106 and 107:
} Defining the Controller I am goin
- Page 108 and 109:
Note Notice that I declare the view
- Page 110 and 111:
Figure 5-4. Creating a new layout S
- Page 112 and 113:
Figure 5-5. The Effect of Applying
- Page 114 and 115:
Figure 5-6. Adding a view that reli
- Page 116 and 117:
Figure 5-9. The content in the layo
- Page 118 and 119:
public ActionResult DemoExpression(
- Page 120 and 121:
The containing element has data at
- Page 122 and 123:
Price@Model.Price Stock Level @sw
- Page 124 and 125:
} else { @ViewBag.ProductCount }
- Page 126 and 127:
Figure 5-13. Generating elements us
- Page 128 and 129:
CHAPTER 6 Essential Tools for MVC I
- Page 130 and 131:
LinqValueCalculator to determine th
- Page 132 and 133:
In the sections that follow, I expl
- Page 134 and 135:
just fine with MVC 5. I have used t
- Page 136 and 137:
namespace EssentialTools.Infrastruc
- Page 138 and 139:
Figure 6-2. The effect of running t
- Page 140 and 141:
I can configure the objects that Ni
- Page 142 and 143:
} } The FlexibleDiscountHelper clas
- Page 144 and 145:
public object GetService(Type servi
- Page 146 and 147:
Figure 6-4. Creating the unit test
- Page 148 and 149:
} } } // assert Assert.AreEqual(tot
- Page 150 and 151:
wrong"); wrong"); wrong"); } Assert
- Page 152 and 153:
} } } Testing and Fixing the Code I
- Page 154 and 155:
Listing 6-31. The Contents of the L
- Page 156 and 157:
Price = 48.95M}, new Product {Name
- Page 158 and 159:
To summarize the example, the Objec
- Page 160 and 161:
This is the same behavior used in t
- Page 162 and 163:
CHAPTER 7 SportsStore: A Real Appli
- Page 164 and 165:
e included in new projects are exce
- Page 166 and 167:
public class NinjectDependencyResol
- Page 168 and 169:
Figure 7-4. Creating the Product cl
- Page 170 and 171:
IProductRepository interface with t
- Page 172 and 173:
Figure 7-5. Adding the Views/Produc
- Page 174 and 175:
Figure 7-6. Viewing the basic appli
- Page 176 and 177:
Figure 7-8. Setting up the SportsSt
- Page 178 and 179:
Visual Studio will display a design
- Page 180 and 181:
Creating the Entity Framework Conte
- Page 182 and 183:
private EFDbContext context = new E
- Page 184 and 185:
public class ProductController : Co
- Page 186 and 187:
A view model is not part of the dom
- Page 188 and 189:
... ... Every namespac
- Page 190 and 191:
(ProductsListViewModel)controller.L
- Page 192 and 193:
Figure 7-14. Displaying page naviga
- Page 194 and 195:
Figure 7-15. The new URL scheme dis
- Page 196 and 197:
} @foreach (var p in Model.Products
- Page 198 and 199:
Figure 7-18. Creating a partial vie
- Page 200 and 201:
Summary In this chapter, I built mo
- Page 202 and 203:
using System.Collections.Generic; u
- Page 204 and 205:
Assert.AreEqual(pageInfo.TotalPages
- Page 206 and 207:
); "", new { controller = "Product"
- Page 208 and 209:
} } public string Menu() { return "
- Page 210 and 211:
has the effect of declaring a depen
- Page 212 and 213:
Figure 8-3. The category links High
- Page 214 and 215:
Now that I am providing information
- Page 216 and 217:
} ... CurrentCategory = category };
- Page 218 and 219:
Continue Shopping button to return
- Page 220 and 221:
Arrange - create a new cart Cart ta
- Page 222 and 223:
@Model.Name @Model.Price.ToString("
- Page 224 and 225:
For the AddToCart and RemoveFromCar
- Page 226 and 227:
and the total cost for the cart. Th
- Page 228 and 229:
CHAPTER 9 SportsStore: Completing t
- Page 230 and 231:
using System.Linq; using System.Web
- Page 232 and 233:
public void Adding_Product_To_Cart_
- Page 234 and 235:
shopping I added a new column to e
- Page 236 and 237:
@ViewBag.Title SPORTS STORE @
- Page 238 and 239:
. . . This change generates a link
- Page 240 and 241:
@Html.TextBoxFor(x => x.Zip, new {@
- Page 242 and 243:
} ViewBag.Title = "SportStore: Chec
- Page 244 and 245:
public string Country { get; set; }
- Page 246 and 247:
if (emailSettings.WriteAsFile) { sm
- Page 248 and 249:
} } } I created an EmailSettings ob
- Page 250 and 251:
ViewResult result = target.Checkout
- Page 252 and 253:
of the SportsStore.WebUI project an
- Page 254 and 255:
Thanks! Thanks for placing your ord
- Page 256 and 257:
Figure 10-1. Displaying the SportsS
- Page 258 and 259:
waking moment. My advice is to acce
- Page 260 and 261:
case, however, I hide the standard
- Page 262 and 263:
Bootstrap that the div element shou
- Page 264 and 265:
.Select(x => x.Category) .Distinct(
- Page 266 and 267:
@Html.ActionLink("Home", "List", "
- Page 268 and 269:
variations on the same basic theme.
- Page 270 and 271:
} This view uses a Razor foreach
- Page 272 and 273:
Figure 10-9. The effect of mobile-s
- Page 274 and 275:
public class AdminController : Cont
- Page 276 and 277:
Right-click on the Views/Admin fold
- Page 278 and 279:
Figure 11-3. Rendering the scaffold
- Page 280 and 281:
Figure 11-4. Rendering the modified
- Page 282 and 283:
Act Product p1 = target.Edit(1).Vie
- Page 284 and 285:
} } public string Category { get; s
- Page 286 and 287:
Figure 11-7. Displaying the editor
- Page 288 and 289:
Framework does know about and updat
- Page 290 and 291:
ActionResult result = target.Edit(p
- Page 292 and 293:
using System.ComponentModel.DataAnn
- Page 294 and 295:
Install-Package Microsoft.jQuery.Un
- Page 296 and 297: Listing 11-17. Explicitly Specifyin
- Page 298 and 299: Listing 11-19. Implementing Deletio
- Page 300 and 301: You can see the delete feature by c
- Page 302 and 303: Authentication is set
- Page 304 and 305: Figure 12-1. The effect of the Auth
- Page 306 and 307: namespace SportsStore.WebUI.Infrast
- Page 308 and 309: the menu, set the name to Login and
- Page 310 and 311: mock implementations of the IAuthPr
- Page 312 and 313: Figure 12-3. Adding columns to the
- Page 314 and 315: No Image } else { } @Html.Acti
- Page 316 and 317: } } I have added a new parameter to
- Page 318 and 319: [TestClass] public class ImageTests
- Page 320 and 321: Figure 12-4. Adding an image to a p
- Page 322 and 323: CHAPTER 13 Deployment The final, an
- Page 324 and 325: Figure 13-2. Creating a new web sit
- Page 326 and 327: Figure 13-4. The effect of creating
- Page 328 and 329: ); [ProductID] INT IDENTITY (1, 1)
- Page 330 and 331: Figure 13-8. The Publish Web dialog
- Page 332 and 333: Figure 13-10. Settings for the depl
- Page 334 and 335: Figure 13-12. Previewing the deploy
- Page 336 and 337: Figure 13-14. The SportsStore appli
- Page 338 and 339: Figure 14-1. Selecting the project
- Page 340 and 341: which packages are used by selectin
- Page 342 and 343: } Or you can disable any layout for
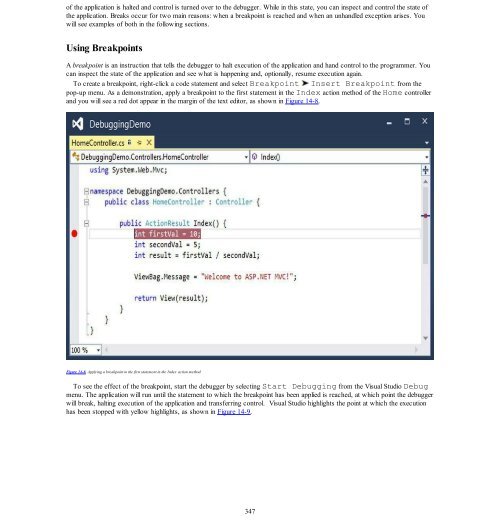
- Page 344 and 345: using System.Web.Mvc; namespace Deb
- Page 348 and 349: Figure 14-9. Hitting a breakpoint N
- Page 350 and 351: Figure 14-11. The effect of assigni
- Page 352 and 353: selecting Delete Breakpoint from th
- Page 354 and 355: Figure 14-15. Enabling Edit and Con
- Page 356 and 357: Figure 14-16. The effect of correct
- Page 358 and 359: Figure 14-18. Selecting multiple br
- Page 360 and 361: CHAPTER 15 URL Routing Before the i
- Page 362 and 363: public class HomeController : Contr
- Page 364 and 365: Figure 15-3. The segments in an exa
- Page 366 and 367: started, which leads to the RouteCo
- Page 368 and 369: namespace UrlsAndRoutes.Tests { [Te
- Page 370 and 371: TestRouteMatch and TestRouteFail co
- Page 372 and 373: Figure 15-5. Using default values t
- Page 374 and 375: In Listing 15-12, I defined a new r
- Page 376 and 377: Notice that, once again, I have pla
- Page 378 and 379: Figure 15-8. Displaying the value o
- Page 380 and 381: namespace UrlsAndRoutes { public cl
- Page 382 and 383: ... [TestMethod] public void TestIn
- Page 384 and 385: Figure 15-11. The error displayed w
- Page 386 and 387: "Home/{action}/{id}/{*catchall}", n
- Page 388 and 389: namespace UrlsAndRoutes { public cl
- Page 390 and 391: namespace UrlsAndRoutes { public cl
- Page 392 and 393: namespace UrlsAndRoutes.Infrastruct
- Page 394 and 395: Using Attribute Routing All of the
- Page 396 and 397:
Caution The Route attribute stops c
- Page 398 and 399:
} } public ActionResult List() { Vi
- Page 400 and 401:
... [Route("∼/Test")] ... Prefixi
- Page 402 and 403:
using System.Web.Routing; namespace
- Page 404 and 405:
Now, this may seem like a long path
- Page 406 and 407:
"Admin") @Html.ActionLink("This
- Page 408 and 409:
... Start the application again and
- Page 410 and 411:
ActionName The controller is: @Vi
- Page 412 and 413:
} For the routing in the example ap
- Page 414 and 415:
how outgoing URLs are generated. To
- Page 416 and 417:
and repeat the process. If the clas
- Page 418 and 419:
ActionName The controller is: @
- Page 420 and 421:
The MVC Framework supports organizi
- Page 422 and 423:
To demonstrate the way that areas i
- Page 424 and 425:
able to request /Admin/Home/Index a
- Page 426 and 427:
You do not need to take any special
- Page 428 and 429:
intercept requests for disk files b
- Page 430 and 431:
outes.Add(new Route("SayHello", new
- Page 432 and 433:
http://www.amazon.com/books/pro-asp
- Page 434 and 435:
CHAPTER 17 Controllers and Actions
- Page 436 and 437:
System.Web.Routing.RequestContext o
- Page 438 and 439:
namespace ControllersAndActions.Con
- Page 440 and 441:
Retrieve posted data from Request.F
- Page 442 and 443:
After a controller has finished pro
- Page 444 and 445:
public string Url { get; set; } pub
- Page 446 and 447:
RedirectToRouteResult Issues an HTT
- Page 448 and 449:
shown in this test method. using Sy
- Page 450 and 451:
You can send an object to the view
- Page 452 and 453:
Arrange - create the controller Exa
- Page 454 and 455:
Listing 17-20. Redirecting to a Lit
- Page 456 and 457:
Act - call the action method Redire
- Page 458 and 459:
Listing 17-24. Sending a Specific S
- Page 460 and 461:
CHAPTER 18 Filters Filters inject e
- Page 462 and 463:
} } To create the view that will ga
- Page 464 and 465:
} } public ViewResult Create() { //
- Page 466 and 467:
} } void OnAuthorization(Authorizat
- Page 468 and 469:
Figure 18-2. Re-prompting for crede
- Page 470 and 471:
[HttpPost] public ActionResult Logi
- Page 472 and 473:
} } public void OnAuthenticationCha
- Page 474 and 475:
using System.Web.Mvc; using System.
- Page 476 and 477:
IExceptionFilter { public void OnEx
- Page 478 and 479:
Figure 18-3. The default exception
- Page 480 and 481:
} } } } filterContext.ExceptionHand
- Page 482 and 483:
Figure 18-6. An exception thrown wh
- Page 484 and 485:
Table 18-9. HandleErrorInfo Propert
- Page 486 and 487:
using System.Web.Mvc; using Filters
- Page 488 and 489:
", } } } } string.Format("Action me
- Page 490 and 491:
execute the result. You can see how
- Page 492 and 493:
Figure 18-10. The effect of adding
- Page 494 and 495:
up manually with the Empty template
- Page 496 and 497:
I have already explained that filte
- Page 498 and 499:
Figure 18-14. Specifying the order
- Page 500 and 501:
Figure 18-15. The default filter be
- Page 502 and 503:
CHAPTER 19 Controller Extensibility
- Page 504 and 505:
} } } public ViewResult List() { re
- Page 506 and 507:
} public GetControllerSessionBehavi
- Page 508 and 509:
My implementations of the GetContro
- Page 510 and 511:
RouteConfig.RegisterRoutes(RouteTab
- Page 512 and 513:
} } You can see the effect of the c
- Page 514 and 515:
There are no action methods in this
- Page 516 and 517:
Figure 19-6. Using the method name
- Page 518 and 519:
[ActionName("Enumerate")] public Vi
- Page 520 and 521:
} } } }); I have used the ActionNam
- Page 522 and 523:
If you start the application and na
- Page 524 and 525:
Message: @Session["Message"] ... Th
- Page 526 and 527:
Data: @Model When you run the ap
- Page 528 and 529:
namespace ControllerExtensibility.C
- Page 530 and 531:
string viewName, string masterName,
- Page 532 and 533:
ModelState Returns information abou
- Page 534 and 535:
view) { } } public void ReleaseView
- Page 536 and 537:
Figure 20-2. Requesting an unsuppor
- Page 538 and 539:
Listing 20-10. The Contents of the
- Page 540 and 541:
Table 20-4. Razor View Engine Searc
- Page 542 and 543:
Figure 20-5. The effect of custom l
- Page 544 and 545:
Tip My custom view engine locations
- Page 546 and 547:
You can check to see if a view has
- Page 548 and 549:
I am going to start by creating a p
- Page 550 and 551:
@foreach (string str in Model) { @s
- Page 552 and 553:
"Pear"}) @Html.Action("Time") You c
- Page 554 and 555:
} In the Index action method, I pas
- Page 556 and 557:
Here is the message: @Model Inli
- Page 558 and 559:
Table 21-3. Useful Properties Defin
- Page 560 and 561:
troublesome string to the view as t
- Page 562 and 563:
Figure 21-3. Comparing how data val
- Page 564 and 565:
Figure 21-5. The effect of selectiv
- Page 566 and 567:
@model HelperMethods.Models.Person
- Page 568 and 569:
Note Using the helper methods to g
- Page 570 and 571:
Layout = "/Views/Shared/_Layout.csh
- Page 572 and 573:
} This produces the following form
- Page 574 and 575:
... Generating the Input Element fr
- Page 576 and 577:
} CreatePerson @using(Html.BeginRou
- Page 578 and 579:
CreatePerson label { display: i
- Page 580 and 581:
} public class Address { public str
- Page 582 and 583:
@{ ViewBag.Title = "CreatePerson";
- Page 584 and 585:
Notice that the elements for the Pe
- Page 586 and 587:
} return View((object)message); } }
- Page 588 and 589:
01/01/0001 00:00:00 Although the
- Page 590 and 591:
.editor-field input { height: 20px;
- Page 592 and 593:
The value of the property (0 in thi
- Page 594 and 595:
[Display(Name = "Birth Date")] publ
- Page 596 and 597:
Url Displays the data as a URL (usi
- Page 598 and 599:
} public string LastName { get; set
- Page 600 and 601:
Figure 22-10. Displaying a complex
- Page 602 and 603:
Views/Shared/EditorTemplates folder
- Page 604 and 605:
CHAPTER 23 URL and Ajax Helper Meth
- Page 606 and 607:
.editor-label { clear: left; } .edi
- Page 608 and 609:
action="GetPeople"}) This view co
- Page 610 and 611:
Figure 23-2. A simple synchronous f
- Page 612 and 613:
I am now ready to start applying un
- Page 614 and 615:
as shown in Listing 23-10. Listing
- Page 616 and 617:
Setting Ajax Options I can fine-tun
- Page 618 and 619:
ViewBag.Title = "GetPeople"; Layout
- Page 620 and 621:
Figure 23-6. Prompting the user bef
- Page 622 and 623:
I can address this using the AjaxOp
- Page 624 and 625:
ole}), } }) Url = Url.Action("Get
- Page 626 and 627:
Since I want to present the same da
- Page 628 and 629:
Figure 23-9. Working with JSON data
- Page 630 and 631:
using System; using System.Collecti
- Page 632 and 633:
@foreach (string role in Enum.GetNa
- Page 634 and 635:
public class Address { public strin
- Page 636 and 637:
Figure 24-1. A simple demonstration
- Page 638 and 639:
for the id parameter as follows: 1.
- Page 640 and 641:
Figure 24-4. The effect of using a
- Page 642 and 643:
This view renders a simple set of l
- Page 644 and 645:
Role:@Html.DisplayFor(m => m.Role)
- Page 646 and 647:
} Submit You can see the problem if
- Page 648 and 649:
using System.Web.Mvc; using MvcMode
- Page 650 and 651:
Listing 24-24. Using a Collection A
- Page 652 and 653:
... When the form is submitted, th
- Page 654 and 655:
Each of the classes listed in Table
- Page 656 and 657:
} } } if (ContainsPrefix(key)) { re
- Page 658 and 659:
Figure 24-10. The effect of the cus
- Page 660 and 661:
using System.Web; using System.Web.
- Page 662 and 663:
CHAPTER 25 Model Validation In the
- Page 664 and 665:
@ViewBag.Title .field-validati
- Page 666 and 667:
Listing 25-7. Explicitly Validating
- Page 668 and 669:
Figure 25-2. Errors result in highl
- Page 670 and 671:
... Please enter your name Please
- Page 672 and 673:
Figure 25-4. Displaying validation
- Page 674 and 675:
Figure 25-6. A validation message f
- Page 676 and 677:
RegularExpression Required [Require
- Page 678 and 679:
Figure 25-8. The error message from
- Page 680 and 681:
} } [MustBeTrue(ErrorMessage="You m
- Page 682 and 683:
name")); } if (DateTime.Now > Date)
- Page 684 and 685:
Both of these settings must be true
- Page 686 and 687:
The feedback is also immediate when
- Page 688 and 689:
} public JsonResult ValidateDate(st
- Page 690 and 691:
has provided is consistent with the
- Page 692 and 693:
namespace ClientFeatures.Models { p
- Page 694 and 695:
} function processResponse(appt) {
- Page 696 and 697:
Figure 26-2. Disabling the browser
- Page 698 and 699:
undles.Add(new StyleBundle("∼/Con
- Page 700 and 701:
... You won’t need to do this i
- Page 702 and 703:
Figure 26-4. Profiling with bundles
- Page 704 and 705:
CHAPTER 27 Web API and Single-page
- Page 706 and 707:
ReservationRepository.cs to the Mod
- Page 708 and 709:
} return RedirectToAction("Index");
- Page 710 and 711:
The view model for the partial vie
- Page 712 and 713:
elated actions, and makes creating
- Page 714 and 715:
This time, the Web API controller h
- Page 716 and 717:
using System.Collections.Generic; u
- Page 718 and 719:
}; function sendAjaxRequest(httpMet
- Page 720 and 721:
Underpinning the Ajax functions is
- Page 722 and 723:
Figure 27-3. Monitoring the connect
- Page 724 and 725:
... function removeItem(item) { sen
- Page 726 and 727:
Client Name Location Save }
- Page 728 and 729:
Simplify the Home Controller The Ho
- Page 730 and 731:
Remove Create Create Rese
- Page 732 and 733:
Index A Account Controller contents
- Page 734 and 735:
BeginForm and BeginRoute Form metho
- Page 736 and 737:
Custom dependency resolver contents
- Page 738 and 739:
table data script button SQL statem
- Page 740 and 741:
uilt-In form (see Built-in form hel
- Page 742 and 743:
Razor expression shared View Start
- Page 744 and 745:
PartyInvites routing system Solutio
- Page 746 and 747:
O OnActionExecuted method action fi
- Page 748 and 749:
accessing ways context objects acti
- Page 750 and 751:
summary, cart definition cart and c
- Page 752 and 753:
whole-model templated helpers Test-