OSU Economics 444: Elementary Econometrics Ch.3 Use ...
OSU Economics 444: Elementary Econometrics Ch.3 Use ...
OSU Economics 444: Elementary Econometrics Ch.3 Use ...

Create successful ePaper yourself
Turn your PDF publications into a flip-book with our unique Google optimized e-Paper software.
<strong>OSU</strong> <strong>Economics</strong> <strong>444</strong>: <strong>Elementary</strong> <strong>Econometrics</strong><br />
<strong>Ch.3</strong> <strong>Use</strong> Regression Analysis (in an empirical project)<br />
•• Steps in Applied Regression Analysis<br />
• Step 0: There is a purpose of doing an empirical project. The choice of the dependent variable in<br />
regression analysis is determined by the purpose of the project.<br />
• Step 1: Review the literature and develope the theoretical model.<br />
1) understand the topic you are studying;<br />
2) review the existing literature on the topic;<br />
3) Þnd out what other researchers have learned (if any);<br />
–- may follow their footsteps;<br />
–— or, develope a different approach (if not be convinced).<br />
• Step 2: Model (regression equation) speciÞcation: Select the independent variables and<br />
the functional form of the equation.<br />
1) The elements of speciÞcation shall be determined on the basis of economic theory (or reasoning).<br />
2) Select independent variables based on economic theory. An explanatory variable is selected because it<br />
is a theoretical determinant of the dependent variable.<br />
3) Explanatory variables that are suspected of having little effect shall not be included (except if they are<br />
in the center stage of an inquiry).<br />
For example, in a model that explains the demand of a consumption good, economic theory indicates<br />
that the price of the good, consumer income, as well as prices of complements and substitutes are important<br />
explanatory variables. The list of possible complements and substitutes may be determined by intuition,<br />
common sense, and experience. But the Þnal selection should be explained and justiÞed (and debated).<br />
• Step 3: Hypothesize the (expected) signs of the coefficients.<br />
1) Hypothesize the expected effects of expanatory variables based on the underlying theory.<br />
For example, the own price and the prices of completmentary goods are expected to be negative in<br />
a demand equation. Consumer income and the prices of substitute goods are expected to have positive<br />
coefficients.<br />
• Step 4: Obtain the needed data.<br />
1) The more observations are better. The excess of the number of observations over the number of parameters<br />
is called the degrees of freedom. More data provide more information.<br />
2) The units of measurement of the variables are unimportant because the coefficients will compensate for<br />
the change of the units of measurement. However, it is recommended to select units of measurement<br />
such that magnitudes of variables are similar (because of rounding error in computing).<br />
• Step 5: Estimate and Evaluate the Equation<br />
1) Choose the appropriate estimation method.<br />
2) The results should be checked for possible errors (e.g., due to data errors, theoretical reasoning, etc.)!<br />
• Step 6: Document (report) the Results<br />
1
1) For regression analysis, the estimated equation can be reported with the following format:<br />
Ŷ i =103.40+6.38x i<br />
(0.88)<br />
n=20, ¯R2 =0.73.<br />
The number in parenthesis is either the estimated standard error of the estimated coefficient or the<br />
t-statistics. n isthesamplesizeusedforestimation.<br />
2) Explain the model, the assumptions, the data used, and the estimation procedures. In principle, the<br />
reported results shall be replicated by readers or other researchers.<br />
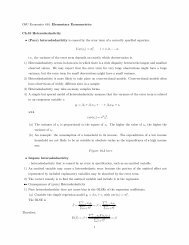
•• Different types of independent variables<br />
There are many different types of independent variables. The following types are common.<br />
1) Instantaneous independent variables<br />
An independent variable x t that comes from the same time period of the dependent variable y t is an<br />
instantaneous independent variable.<br />
2) Lagged independent variables<br />
It is possible that an independent variable may take time in order to have effect on the dependent<br />
variable. For example, the supply of an agricultural product might be determined by its price in the previous<br />
period.<br />
3) For example,<br />
C t = β 0 + β 1 PC t−1 + β 2 PL t + ² t ,<br />
where C t = the quantity of cotton supplied in year t, PC t−1 = the price of cotton in year t − 1, and<br />
PL t = the price of farm labor in year t.<br />
Here PL t , the price of farm labor, is an instantaneous independent variable. PC t−1 is a lagged independent<br />
variable. If cotton prices change, farmers won’t be able to react immediately because it takes a while<br />
for cotton to be planned and to grow.<br />
4) Dummy variables<br />
Some variables can be expressed only in a qualitative manner.<br />
a) A dummy variable takes on the values one or zero depending on whether some condition holds or<br />
not.<br />
For example,<br />
Y i = β o + β 1 X 1i + β 2 X 2i + ² i<br />
where X 1i = the number of years teaching experience of the ith teacher (high school teacher), and<br />
n 1 if the ith teacher has an M.A.,<br />
X 2i =<br />
0 otherwise.<br />
Here X 2i is a dummy variable.<br />
2
) When a dummy variable can only change the intercept of the regression, it is an intercept dummy<br />
variable.<br />
(Figure 3.3 here)<br />
c) One fewer dummy variable shall be constructed than conditions. An omitted condition shall form<br />
the basis against which the included conditions are compared. (avoid the dummy variables trap!)<br />
3