AXS-Alphaliner - AXSMarine
AXS-Alphaliner - AXSMarine
AXS-Alphaliner - AXSMarine

Create successful ePaper yourself
Turn your PDF publications into a flip-book with our unique Google optimized e-Paper software.
<strong>AXS</strong>-<strong>Alphaliner</strong><br />
Survey<br />
- <strong>AXS</strong>-<strong>Alphaliner</strong> -<br />
The worldwide reference in liner shipping<br />
Liner Market Shares<br />
2008<br />
Short version - For the full version, please contact us at commercial@axsmarine.com<br />
This survey examines the evolution of the global liner market<br />
shares of large carriers, based on the liner/container shipping fleet<br />
monitored by <strong>Alphaliner</strong> and published at www.axs-alphaliner.com.<br />
These market shares assessments provide benchmarks<br />
for the liner shipping industry.<br />
Extracts of this survey can be reproduced provided that the source is appropriately mentioned.<br />
In case of doubt, thanks to contact us.<br />
Web: www.axs-alphaliner.com | E-mail: data@alphaliner.com | MSN: support@axsmarine.com
April 2008<br />
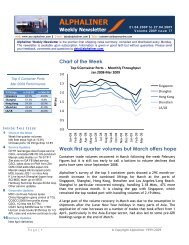
APM-Maersk to break the 2 million teu mark<br />
The A.P. Møller-Maersk operated fleet*, is to break the 2 million teu<br />
mark at the end of April 2008, according to figures compiled by<br />
<strong>Alphaliner</strong>. APM-M has thus doubled its fleet since it passed the One<br />
million teu mark in December 2004.<br />
After some difficult times during which it saw its global market share<br />
recede from 18.2% to 16.0% in the wake of the purchase of Royal<br />
P&O Nedlloyd, APM-Maersk is now bouncing back.<br />
During the first four months of 2008, its operated fleet grew by<br />
6.3%, which is the best growth rate achieved among the TOP 5<br />
carriers, as illustrated by the below table.<br />
TOP 5 fleet progression on latest 4 months – 1 st Jan-30 Apr 2008<br />
APM-Maersk * 6,3%<br />
MSC 4,2%<br />
CMA CGM Group * 2,0%<br />
Evergreen Line 1,1%<br />
Hapag-Lloyd 1,1%<br />
All five 3,9%<br />
Notes :<br />
• APM-Maersk includes Maersk Line, Safmarine and MCC Transport<br />
• CMA CGM Group includes CMA CGM, Delmas (with OTAL), ANL, US Lines, Cagema,<br />
Feeder Associate System, MacAndrews, Cheng Lie Navigation Co and CoMaNav<br />
Source : <strong>Alphaliner</strong><br />
This fleet growth allowed Maersk to regain market share, growing<br />
from just over 16.0% to 16.3% during the first four months of 2008.<br />
However, since the recent wave of deliveries came to an end in<br />
April, the carrier’s share is now expected to stagnate for a few<br />
months. It may even slide back again, unless high cargo volumes<br />
prompt the line to charter in additional ships.<br />
… / …<br />
Liner Market Shares Page 2 of 9 © <strong>Alphaliner</strong> 2008<br />
Web: www.axs-alphaliner.com | E-mail: data@alphaliner.com<br />
MSN: support@axsmarine.com
Liner Market Shares Page 3 of 9 © <strong>Alphaliner</strong> 2008<br />
Web: www.axs-alphaliner.com | E-mail: data@alphaliner.com<br />
MSN: support@axsmarine.com
Maersk’s remarkable comeback can be explained by a change in<br />
management and strategy as well as massive deliveries of newbuildings.<br />
During the first four months of 2008, no less than 20 newbuildings<br />
-owned or long term chartered- have joined the Maersk Line<br />
and Safmarine fleet, for a total capacity of 113,000 teu.<br />
Furthermore, Maersk has ceased to release or to sublet ships, except<br />
for a trio of 5,500 teu units to be released in mid-2008, for which<br />
the charters were not renewed. To the contrary, it is to recover at<br />
the end of April, the 4,546 teu HIJAZ (ex MAERSK DIADEMA – alias<br />
VIKTORIA WULFF), which has been sublet to UASC for the past 18<br />
months.<br />
Maersk has also been active again on the charter market, although<br />
exclusively for ships under 2,100 teu. During the first four months of<br />
2008, the carrier has either chartered in or extended some 40 ships.<br />
It has also exercized some ten options at advantageous rates, half of<br />
them in the 2,500-4,500 teu range.<br />
However, the line has been inactive on the ordering side for a while,<br />
although in this respect, it is far from alone. Carriers are obviously<br />
taking a breath after last year’s hectic ordering activity, with a total<br />
of 3.6 Mteu ordered for a contractual value of USD 53 bn, according<br />
to <strong>Alphaliner</strong> figures. Credit tightening and a bearish economic outlook<br />
presently weigh on the ordering decision process. Hardly<br />
350,000 teu have been ordered since 1 st January.<br />
With a declared orderbook reaching only 340,000 teu (end April),<br />
APM-Maersk is not in a position to maintain its market share over<br />
16% in the medium term (2009-2011), unless a vigorous chartering<br />
activity helps to keep the pace at which rivals MSC and CMA CGM<br />
are to grow, with unrivalled orderbooks hovering around the<br />
600,000 teu figure for each of them. However, perhaps APM-Maersk<br />
has hidden plans. Especially as the Odense shipyard is underloaded<br />
for the years 2009 and beyond.<br />
Liner Market Shares Page 4 of 9 © <strong>Alphaliner</strong> 2008<br />
Web: www.axs-alphaliner.com | E-mail: data@alphaliner.com<br />
MSN: support@axsmarine.com
<strong>AXS</strong>-<strong>Alphaliner</strong><br />
ANNUAL MARKET SHARE SURVEY<br />
AS AT 1 st JANUARY 2008<br />
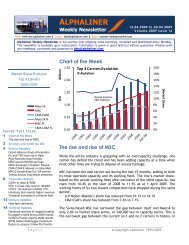
LEADING TRIO CONTROLS ONE THIRD OF LINER MARKET<br />
The global market share of the three world leading lines, Maersk<br />
Line, MSC and CMA CGM, has grown from 32.1% to 34.1% in<br />
terms of TEU capacity during the year 2007, according to the latest<br />
figures published by <strong>AXS</strong>-<strong>Alphaliner</strong>.<br />
Taking the eight-year old figures at 1 st January 2000 as a comparison,<br />
the three leading lines at the time, Maersk Sealand, Evergreen<br />
and P&O Nedlloyd, had a combined market share of 23.7%.<br />
However, the growth in 2007 has been far from being equally shared<br />
by the three leading lines, as Maersk Line continued to lose ground<br />
while MSC and CMA CGM continued to strengthen their positions, as<br />
reflected in the below table and graph.<br />
Quite remarkably, MSC and CMA CGM are among the very few<br />
carriers which are family businesses and thus do not have to bow to<br />
shareholder pressure. They are also the best placed to still increase<br />
their market share, with huge orderbooks dwarfing by far those of<br />
rivals.<br />
Market Share progression on 24 months – Jan 2006-Jan 2008<br />
Jan 06 Jan 07 Jan 08<br />
Maersk Line 18,2% 16,8% 16,1%<br />
MSC 8,6% 9,8% 10,4%<br />
CMA CGM Group 5,6% 6,5% 7,6%<br />
All three 32,4% 33,2% 34,1%<br />
Source : <strong>Alphaliner</strong><br />
Liner Market Shares Page 5 of 9 © <strong>Alphaliner</strong> 2008<br />
Web: www.axs-alphaliner.com | E-mail: data@alphaliner.com<br />
MSN: support@axsmarine.com
THE MARKET SHARE EVOLUTION DURING 2000-2008<br />
Between January 2000 and January 2008, the teu capacity deployed<br />
on liner trades has more than doubled. It has risen from 5,150,000<br />
teu to 11,696,000 teu, i.e. a 127% increase, according to <strong>AXS</strong>-<br />
<strong>Alphaliner</strong> data. This means that in order to simply keep their market<br />
shares stable during that period, carriers had to increase their<br />
fleet capacities by 127%. Those who failed to invest, or charter,<br />
enough to keep pace have lost market share.<br />
The graph next page illustrates the performances of a selection of<br />
carriers among the TOP 30 lines. It is based on the ratio between<br />
market shares at 1 st January 2000 and 1 st January 2008. For example,<br />
CSCL’s market share rose from 1.67% to 3.69%, i.e. an increase<br />
of 120.1%, as its fleet grew by 400% during the past 8 years<br />
(i.e. an average annual growth of 22.3%).<br />
Market shares are deducted from the existing on board teu capacities<br />
of carriers, compared to the total capacity effectively deployed<br />
on liner trades (these figures take into account cellular ships, multipurpose<br />
ships and roro ships which are effectively employed on<br />
regular liner services, and they DO NOT include ships which are<br />
operated OUTSIDE liner trades, even if these ships are teu-fitted).<br />
<strong>Alphaliner</strong> computes total market capacity and the carriers’ individual<br />
market shares on a daily basis. These figures are published online<br />
in our <strong>AXS</strong>-<strong>Alphaliner</strong> TOP 100 page, which is free to access.<br />
As clearly illustrated by our figures and the below graph, the three<br />
rising stars of this decade so far are CMA CGM, MSC and CSCL.<br />
This trio even deserves a particular mention as these lines grew<br />
mostly organically, although CMA CGM bought a few niche carriers.<br />
Fourth in the ranking comes Hapag-Lloyd. The carrier substantially<br />
raised its market share thanks to the 2005 purchase of CP Ships by<br />
its parent company TUI AG, for merging within the Hapag-Lloyd<br />
business.<br />
Liner Market Shares Page 6 of 9 © <strong>Alphaliner</strong> 2008<br />
Web: www.axs-alphaliner.com | E-mail: data@alphaliner.com<br />
MSN: support@axsmarine.com
ANALYSIS BY CARRIER<br />
The analysis by carrier is illustrated by a series of graphs showing the evolution<br />
of the fleets of 21 carriers since 1996 and of their market share since 1 st Jan<br />
2000, the date at which <strong>Alphaliner</strong> started to compile the latter figure on a<br />
regular basis. The full market share survey includes comments on the evolution<br />
of the market share of individual carriers, and assess how their current orderbook<br />
will affect their future positions. The full survey can be ordered from<br />
<strong>AXS</strong>Marine. Please contact us at commercial@axsmarine.com.<br />
Liner Market Shares Page 7 of 9 © <strong>Alphaliner</strong> 2008<br />
Web: www.axs-alphaliner.com | E-mail: data@alphaliner.com<br />
MSN: support@axsmarine.com
Liner Market Shares Page 8 of 9 © <strong>Alphaliner</strong> 2008<br />
Web: www.axs-alphaliner.com | E-mail: data@alphaliner.com<br />
MSN: support@axsmarine.com
<strong>Alphaliner</strong> is an independent consultancy providing an exhaustive and permanently<br />
updated inventory of all the world liner services, with their description,<br />
including detailed rotation and ships deployed. A full section is dedicated to the<br />
liner operators, with trading profiles, fleets and orderbook. Detailed descriptions<br />
of all the world containerships are provided, together with their commercial<br />
history and their current status.<br />
This data is available by subscription at www.axs-alphaliner.com, a website<br />
elaborated by <strong>AXS</strong>Marine to harbor <strong>Alphaliner</strong> data and providing sophisticated<br />
tools to handle this data.<br />
Liner Market Shares Page 9 of 9 © <strong>Alphaliner</strong> 2008<br />
Web: www.axs-alphaliner.com | E-mail: data@alphaliner.com<br />
MSN: support@axsmarine.com