2013-2014 Math Grade 7.pdf
2013-2014 Math Grade 7.pdf
2013-2014 Math Grade 7.pdf

You also want an ePaper? Increase the reach of your titles
YUMPU automatically turns print PDFs into web optimized ePapers that Google loves.
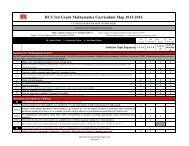
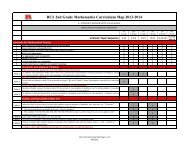
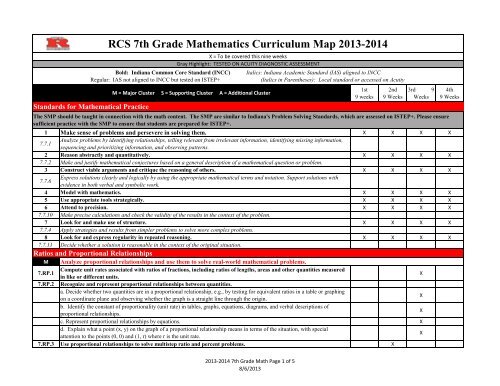
RCS 7th <strong>Grade</strong> <strong>Math</strong>ematics Curriculum Map <strong>2013</strong>-<strong>2014</strong><br />
Bold: Indiana Common Core Standard (INCC)<br />
Regular: IAS not aligned to INCC but tested on ISTEP+<br />
Standards for <strong>Math</strong>ematical Practice<br />
X = To be covered this nine weeks<br />
Gray Highlight: TESTED ON ACUITY DIAGNOSTIC ASSESSMENT<br />
M = Major Cluster S = Supporting Cluster A = Additional Cluster<br />
Italics: Indiana Academic Standard (IAS) aligned to INCC<br />
(Italics in Parentheses): Local standard or accessed on Acuity<br />
1st<br />
9 weeks<br />
2nd<br />
9 Weeks<br />
3rd 9<br />
Weeks<br />
The SMP should be taught in connection with the math content. The SMP are similar to Indiana's Problem Solving Standards, which are assessed on ISTEP+. Please ensure<br />
sufficient practice with the SMP to ensure that students are prepared for ISTEP+.<br />
1 Make sense of problems and persevere in solving them. X X X X<br />
7.7.1<br />
Analyze problems by identifying relationships, telling relevant from irrelevant information, identifying missing information,<br />
sequencing and prioritizing information, and observing patterns.<br />
2 Reason abstractly and quantitatively. X X X X<br />
7.7.2 Make and justify mathematical conjectures based on a general description of a mathematical question or problem.<br />
3 Construct viable arguments and critique the reasoning of others. X X X X<br />
7.7.6<br />
Express solutions clearly and logically by using the appropriate mathematical terms and notation. Support solutions with<br />
evidence in both verbal and symbolic work.<br />
4 Model with mathematics. X X X X<br />
5 Use appropriate tools strategically. X X X X<br />
6 Attend to precision. X X X X<br />
7.7.10 Make precise calculations and check the validity of the results in the context of the problem.<br />
7 Look for and make use of structure. X X X X<br />
7.7.4 Apply strategies and results from simpler problems to solve more complex problems.<br />
8 Look for and express regularity in repeated reasoning. X X X X<br />
7.7.11 Decide whether a solution is reasonable in the context of the original situation.<br />
Ratios and Proportional Relationships<br />
M<br />
7.RP.1<br />
Analyze proportional relationships and use them to solve real-world mathematical problems.<br />
Compute unit rates associated with ratios of fractions, including ratios of lengths, areas and other quantities measured<br />
in like or different units.<br />
X<br />
7.RP.2 Recognize and represent proportional relationships between quantities.<br />
a. Decide whether two quantities are in a proportional relationship, e.g., by testing for equivalent ratios in a table or graphing<br />
on a coordinate plane and observing whether the graph is a straight line through the origin.<br />
X<br />
b. Identify the constant of proportionality (unit rate) in tables, graphs, equations, diagrams, and verbal descriptions of<br />
proportional relationships.<br />
X<br />
c. Represent proportional relationships by equations. X<br />
d. Explain what a point (x, y) on the graph of a proportional relationship means in terms of the situation, with special<br />
attention to the points (0, 0) and (1, r) where r is the unit rate.<br />
X<br />
7.RP.3 Use proportional relationships to solve multistep ratio and percent problems. X<br />
4th<br />
9 Weeks<br />
<strong>2013</strong>-<strong>2014</strong> 7th <strong>Grade</strong> <strong>Math</strong> Page 1 of 5<br />
8/6/<strong>2013</strong>
7.2.2 Calculate the percentage increase and decrease of a quantity. X<br />
7.2.3 Solve problems that involve discounts, markups, and commissions. X<br />
The Number System<br />
M<br />
7.NS.1<br />
Apply and extend previous understandings of operations with fractions to add, subtract, multiply and divide rational numbers.<br />
Apply and extend previous understandings of addition and subtraction to add and subtract rational numbers; represent addition and subtraction on a horizontal or<br />
vertical number line diagram.<br />
a. Describe situations in which opposite quantities combine to make 0. For example, a hydrogen atom has 0 charge because<br />
its two constituents are oppositely charged.<br />
X X X X<br />
b. Understand p + q as the number located a distance |q| from p, in the positive or negative direction depending on whether q<br />
is positive or negative. Show that a number and its opposite have a sum of 0 (are additive inverses). Interpret sums of rational X X X X<br />
numbers by describing real-world contexts.<br />
c. Understand subtraction of rational numbers as adding the additive inverse, p – q = p + (-q). Show hat the distance between<br />
two rational numbers on the number line is the absolute value of their difference, and apply this principle in real-world<br />
X X X X<br />
contexts.<br />
d. Apply properties of operations as strategies to add and subtract rational numbers. X X X X<br />
7.NS.2 Apply and extend previous understandings of multiplication and division and of fractions to multiply and divide rational numbers.<br />
a. Understand that multiplication is extended from fractions to rational numbers by requiring that operations continue to<br />
satisfy the properties of operations, particularly the distributive property, leading to products such as (-1)(-1) = 1 and the rules X X X X<br />
for multiplying signed numbers. Interpret products of rational numbers by describing real-world contexts.<br />
b. Undstand that integers can be divided, provided that the divisor is not zero, and every quotient of integers (with non-zero<br />
divisor) is a rational number. If p and q are integers, then –(p/q) = (–p)/q = p/(–q). Interpret quotients of rational numbers by X X X X<br />
describing real-world contexts.<br />
c. Apply properties of operations as strategies to multiply and divide rational numbers. X X X X<br />
d. Convert a rational number to a decimal using long division; know that the decimal form of a rational number terminates in<br />
0s or eventually repeats.<br />
X X X X<br />
7.NS.3 Solve real-world and mathematical problems involving the four operations with rational numbers.<br />
7.2.1<br />
Solve addition, subtraction, multiplication, and division problems that use integers, fractions, decimals, and combinations of<br />
the four operations.<br />
X X X X<br />
7.1.2 Compare and order rational and common irrational numbers and place them on a number line. X X<br />
7.1.3 Identify rational and common irrational numbers from a list. X<br />
7.1.7 Convert terminating decimals into reduced fractions. X<br />
Expressions and Equations<br />
M<br />
7.EE.1<br />
7.EE.2<br />
M<br />
7.EE.3<br />
Use properties of operations to generate equivalent expressions.<br />
Apply properties of operations as strategies to add, subtract, factor, and expand linear expressions with rational<br />
coefficients.<br />
Understand that rewriting an expression in different forms in a problem context can shed light on the problem and how<br />
the quantities in it are related.<br />
Solve real-life and mathematical problems using numerical and algebraic expressions and equations.<br />
Solve multi-step real-life and mathematical problems posed with positive and negative rational numbers in any form<br />
(whole numbers, fractions, and decimals), using tools strategically. Apply properties of operations to calculate with<br />
numbers in any form; convert between forms as appropriate; and assess the reasonableness of answers using mental<br />
computation and estimation strategies.<br />
<strong>2013</strong>-<strong>2014</strong> 7th <strong>Grade</strong> <strong>Math</strong> Page 2 of 5<br />
8/6/<strong>2013</strong><br />
X X X<br />
X<br />
X
7.EE.4<br />
Use variables to represent quantities in a real-world or mathematical problem, and construct simple equations and inequalities to solve problems by reasoning about<br />
the quantities.<br />
a. Solve word problems leading to equations of the form px + q = r and p(x + q) = r, where p, q, and r are specific rational<br />
numbers. Solve equations of these forms fluently. Compare an algebraic solution to an arithmetic solution, identifying the<br />
X X<br />
sequence of the operations used in each approach.<br />
b. Solve word problems leading to inequalities of the form px + q > r or px + q < r, where p, q, and r are specific rational<br />
numbers. Graph the solution set of the inequality and interpret it in the context of the problem.<br />
X X<br />
7.3.1<br />
Use variables and appropriate operations to write an expression, a formula, an equation, or an inequality that represents a<br />
verbal description.<br />
X X X<br />
7.3.2 Write and solve two-step linear equations and inequalities in one variable and check the answers. X X X<br />
7.1.1 Read, write, compare, and solve problems using whole numbers in scientific notation. X<br />
7.1.4 Understand and compute whole number powers of whole numbers. X<br />
7.1.5 Find the prime factorization of whole numbers and write the results using exponents. X<br />
7.1.6 Understand and apply the concept of square root. X X<br />
7.3.3 Use correct algebraic terminology, such as variable, equation, term, coefficient*, inequality, expression, and constant. X<br />
Evaluate numerical expressions and simplify algebraic expressions by applying the correct order of operations and the<br />
7.3.4 properties of rational numbers* (e.g., identity, inverse, commutative*, associative*, distributive properties*). Justify each step X X X<br />
in the process.<br />
7.3.9 Identify functions as linear or nonlinear and examine their characteristics in tables, graphs, and equations. X<br />
7.3.10<br />
Identify and describe situations with constant or varying rates of change and know that a constant rate of change describes a<br />
linear function.<br />
X<br />
(7.3.7) (Find the slope of a line from its graph.) X<br />
(7.3.8) (Draw the graph of a line given the slope and one point on the line, or two points on the line.) X<br />
Geometry<br />
A<br />
7.G.1<br />
7.G.2<br />
7.G.3<br />
A<br />
7.G.4<br />
7.G.5<br />
7.G.6<br />
7.4.1<br />
Draw, construct, and describe geometrical figures and describe the relationship between them.<br />
Solve problems involving scale drawings of geometric figures, including computing actual lengths and areas from a<br />
scale drawing and reproducing a scale drawing at a different scale.<br />
Draw (freehand, with ruler and protractor, and with technology) geometric shapes with given conditions. Focus on<br />
constructing triangles from three measures of angles or sides, noticing when the conditions determine a unique triangle,<br />
more than one triangle, or no triangle.<br />
Describe the two-dimensional figures that result from slicing three-dimensional figures, as in plane<br />
sections of right rectangular prisms and right rectangular pyramids.<br />
Solve real-life and mathematical problems involving angle measure, area, surface area, and volume.<br />
Know the formulas for the area and circumference of a circle and use them to solve problems; give an informal<br />
derivation of the relationship between the circumference and area of a circle.<br />
Use facts about supplementary, complementary, vertical, and adjacent angles in a multi-step problem to write and solve<br />
simple equations for an unknown angle in a figure.<br />
Solve real-world and mathematical problems involving area, volume and surface area of two- and three-dimensional<br />
objects composed of triangles, quadrilaterals, polygons, cubes, and right prisms.<br />
Understand coordinate graphs and use them to plot simple shapes, find lengths and areas related to the shapes, and find images<br />
under translations (slides), rotations (turns), and reflections (flips).<br />
<strong>2013</strong>-<strong>2014</strong> 7th <strong>Grade</strong> <strong>Math</strong> Page 3 of 5<br />
8/6/<strong>2013</strong>
7.4.2<br />
Understand that transformations such as slides, turns, and flips preserve the length of segments, and that figures resulting from<br />
slides, turns, and flips are congruent* to the original figures.<br />
7.5.1 Compare lengths, areas, volumes, weights, capacities, times, and temperatures within measurement systems. X<br />
7.5.2 Use experimentation and modeling to visualize similarity problems. Solve problems using similarity. X<br />
7.5.3 Read and create drawings made to scale, construct scale models, and solve problems related to scale. X<br />
7.5.4<br />
Use formulas for finding the perimeter and area of basic two-dimensional shapes and the surface area and volume of basic<br />
three-dimensional shapes, including rectangles, parallelograms*, trapezoids*, triangles, circles, right prisms*, and cylinders.<br />
X<br />
X<br />
7.5.5 Estimate and compute the area of more complex or irregular two-dimensional shapes by dividing them into more basic shapes. X X<br />
Statistics and Probability<br />
S Use random sampling to draw inferences about a population.<br />
Understand that statistics can be used to gain information about a population by examining a sample of the population;<br />
7.SP.1 generalizations about a population from a sample are valid only if the sample is representative of that population.<br />
Understand that random sampling tends to produce representative samples and support valid inferences.<br />
Use data from a random sample to draw inferences about a population with an unknown characteristic of interest.<br />
7.SP.2<br />
Generate multiple samples (or simulated samples) of the same size to gauge the variation in estimates or predictions.<br />
7.6.2 Make predictions from statistical data.<br />
A Draw informal comparative inferences about two populations.<br />
Informally assess the degree of visual overlap of two numerical data distributions with similar variabilities, measuring<br />
7.SP.3<br />
the difference between the centers by expressing it as a multiple of a measure of variability.<br />
Use measures of center and measures of variability for numerical data from random samples to draw informal<br />
7.SP.4<br />
comparative inferences about two populations.<br />
S Investigate chance processes and develop, use, and evaluate probability models.<br />
Understand that the probability of a chance event is a number between 0 and 1 that expresses the likelihood of the event<br />
occurring. Larger numbers indicate greater likelihood. A probability near 0 indicates an unlikely event, a probability<br />
7.SP.5<br />
around 1/2 indicates an unlikely event, a probability around 1/2 indicates an event that is neither unlikely nor likely,<br />
and a probability near 1 indicates a likely event.<br />
7.SP.6<br />
7.SP.7<br />
7.SP.8<br />
Approximate the probability of a chance event by collecting data on the chance process that produces it and observing<br />
its long-run relative frequency, and predict the approximate relative frequency given the probability.<br />
Develop a probability model and use it to find probabilities of events. Compare probabilities from a model to observed<br />
frequencies; if the agreement is not good, explain possible sources of the discrepancy.<br />
a. Develop a uniform probability model by assigning equal probability to all outcomes, and use the model to determine<br />
probabilities of events.<br />
b. Develop a probability model (which may not be uniform) by observing frequencies in data generated from a chance process.<br />
Find probabilities of compound events using organized lists, tables, tree diagrams, and simulation.<br />
a. Understand that, just as with simple events, the probability of a compound event is the fraction of outcomes in the sample<br />
space for which the compound event occurs.<br />
b. Represent sample spaces for compound events using methods such as organized lists, tables and tree diagrams. For an event<br />
described in everyday language (e.g., "rolling double sixes"), identify the outcomes in the sample space which compose the<br />
event.<br />
<strong>2013</strong>-<strong>2014</strong> 7th <strong>Grade</strong> <strong>Math</strong> Page 4 of 5<br />
8/6/<strong>2013</strong>
c. Design and use a simulation to generate frequencies for compound events.<br />
7.6.7 Find the number of possible arrangements of several objects using a tree diagram.<br />
7.6.1<br />
Analyze, interpret, and display data in appropriate bar, line, and circle graphs and stem-and-leaf plots* and justify the choice<br />
of display.<br />
7.6.5 Know that if P is the probability of an event occurring, then 1 – P is the probability of that event not occurring.<br />
7.6.6<br />
Understand that the probability of either one or the other of two disjoint events occurring is the sum of the two individual<br />
probabilities.<br />
(7.6.4)<br />
(Analyze data displays, including ways that they can be misleading. Analyze ways in which the wording of questions can<br />
influence survey results.)<br />
<strong>2013</strong>-<strong>2014</strong> 7th <strong>Grade</strong> <strong>Math</strong> Page 5 of 5<br />
8/6/<strong>2013</strong>