2013-2014 Math Grade 7.pdf
2013-2014 Math Grade 7.pdf
2013-2014 Math Grade 7.pdf

You also want an ePaper? Increase the reach of your titles
YUMPU automatically turns print PDFs into web optimized ePapers that Google loves.
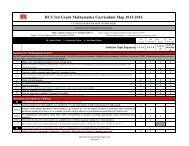
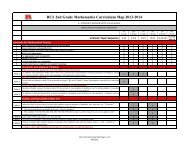
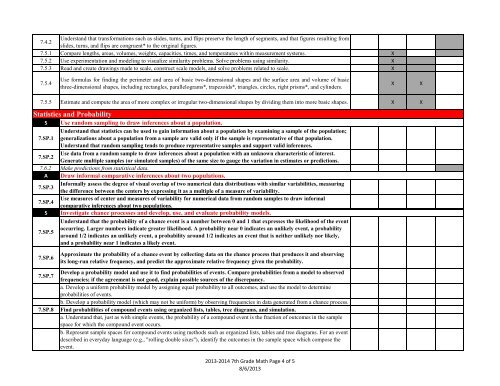
7.4.2<br />
Understand that transformations such as slides, turns, and flips preserve the length of segments, and that figures resulting from<br />
slides, turns, and flips are congruent* to the original figures.<br />
7.5.1 Compare lengths, areas, volumes, weights, capacities, times, and temperatures within measurement systems. X<br />
7.5.2 Use experimentation and modeling to visualize similarity problems. Solve problems using similarity. X<br />
7.5.3 Read and create drawings made to scale, construct scale models, and solve problems related to scale. X<br />
7.5.4<br />
Use formulas for finding the perimeter and area of basic two-dimensional shapes and the surface area and volume of basic<br />
three-dimensional shapes, including rectangles, parallelograms*, trapezoids*, triangles, circles, right prisms*, and cylinders.<br />
X<br />
X<br />
7.5.5 Estimate and compute the area of more complex or irregular two-dimensional shapes by dividing them into more basic shapes. X X<br />
Statistics and Probability<br />
S Use random sampling to draw inferences about a population.<br />
Understand that statistics can be used to gain information about a population by examining a sample of the population;<br />
7.SP.1 generalizations about a population from a sample are valid only if the sample is representative of that population.<br />
Understand that random sampling tends to produce representative samples and support valid inferences.<br />
Use data from a random sample to draw inferences about a population with an unknown characteristic of interest.<br />
7.SP.2<br />
Generate multiple samples (or simulated samples) of the same size to gauge the variation in estimates or predictions.<br />
7.6.2 Make predictions from statistical data.<br />
A Draw informal comparative inferences about two populations.<br />
Informally assess the degree of visual overlap of two numerical data distributions with similar variabilities, measuring<br />
7.SP.3<br />
the difference between the centers by expressing it as a multiple of a measure of variability.<br />
Use measures of center and measures of variability for numerical data from random samples to draw informal<br />
7.SP.4<br />
comparative inferences about two populations.<br />
S Investigate chance processes and develop, use, and evaluate probability models.<br />
Understand that the probability of a chance event is a number between 0 and 1 that expresses the likelihood of the event<br />
occurring. Larger numbers indicate greater likelihood. A probability near 0 indicates an unlikely event, a probability<br />
7.SP.5<br />
around 1/2 indicates an unlikely event, a probability around 1/2 indicates an event that is neither unlikely nor likely,<br />
and a probability near 1 indicates a likely event.<br />
7.SP.6<br />
7.SP.7<br />
7.SP.8<br />
Approximate the probability of a chance event by collecting data on the chance process that produces it and observing<br />
its long-run relative frequency, and predict the approximate relative frequency given the probability.<br />
Develop a probability model and use it to find probabilities of events. Compare probabilities from a model to observed<br />
frequencies; if the agreement is not good, explain possible sources of the discrepancy.<br />
a. Develop a uniform probability model by assigning equal probability to all outcomes, and use the model to determine<br />
probabilities of events.<br />
b. Develop a probability model (which may not be uniform) by observing frequencies in data generated from a chance process.<br />
Find probabilities of compound events using organized lists, tables, tree diagrams, and simulation.<br />
a. Understand that, just as with simple events, the probability of a compound event is the fraction of outcomes in the sample<br />
space for which the compound event occurs.<br />
b. Represent sample spaces for compound events using methods such as organized lists, tables and tree diagrams. For an event<br />
described in everyday language (e.g., "rolling double sixes"), identify the outcomes in the sample space which compose the<br />
event.<br />
<strong>2013</strong>-<strong>2014</strong> 7th <strong>Grade</strong> <strong>Math</strong> Page 4 of 5<br />
8/6/<strong>2013</strong>