2013-2014 Math Grade 7.pdf
2013-2014 Math Grade 7.pdf
2013-2014 Math Grade 7.pdf

Create successful ePaper yourself
Turn your PDF publications into a flip-book with our unique Google optimized e-Paper software.
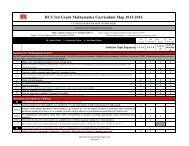
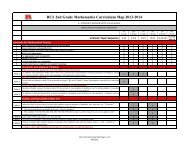
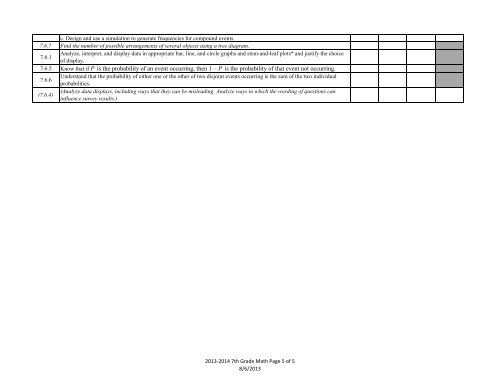
c. Design and use a simulation to generate frequencies for compound events.<br />
7.6.7 Find the number of possible arrangements of several objects using a tree diagram.<br />
7.6.1<br />
Analyze, interpret, and display data in appropriate bar, line, and circle graphs and stem-and-leaf plots* and justify the choice<br />
of display.<br />
7.6.5 Know that if P is the probability of an event occurring, then 1 – P is the probability of that event not occurring.<br />
7.6.6<br />
Understand that the probability of either one or the other of two disjoint events occurring is the sum of the two individual<br />
probabilities.<br />
(7.6.4)<br />
(Analyze data displays, including ways that they can be misleading. Analyze ways in which the wording of questions can<br />
influence survey results.)<br />
<strong>2013</strong>-<strong>2014</strong> 7th <strong>Grade</strong> <strong>Math</strong> Page 5 of 5<br />
8/6/<strong>2013</strong>