Food Security Atlas of Rural Bihar - WFP Remote Access Secure ...
Food Security Atlas of Rural Bihar - WFP Remote Access Secure ...
Food Security Atlas of Rural Bihar - WFP Remote Access Secure ...

Create successful ePaper yourself
Turn your PDF publications into a flip-book with our unique Google optimized e-Paper software.
Appendix II: <strong>Food</strong> <strong>Security</strong> Index (FSI) – A Methodological Note<br />
Appendix II: <strong>Food</strong> <strong>Security</strong> Index (FSI) – A Methodological Note<br />
At the outset we must state that the <strong>Food</strong> <strong>Security</strong> Index is calculated for rural areas only. All variables<br />
constructed in this section are for rural areas, unless otherwise specified.<br />
Here we have attempted to construct a <strong>Food</strong> <strong>Security</strong> Index (FSI) at the sub-state level, that is, the<br />
district level. The district having a higher index value is considered as relatively more food secure as<br />
compared to a district with a lower index value.<br />
Broadly, we have adopted Range Equalization Method (REM) approach, adopted by UNDP (HDR<br />
2005); and Principal Component Analysis (PCA). One <strong>of</strong> the objectives <strong>of</strong> the district FSI is to show<br />
the district’s position in various dimensions <strong>of</strong> food security.<br />
The FSI is a composite index covering three dimensions, i.e. Availability factors, <strong>Access</strong> factors, and<br />
Absorption factors. Besides these three groups <strong>of</strong> factors, an additional component i.e. public<br />
entitlement has been used to explain how this influences food security. But the public entitlement<br />
factor is not included in the indices <strong>of</strong> food security. The public entitlement policy is based on various<br />
parameters which are supposed to be directly linked with food insecurity; the lower the level <strong>of</strong> food<br />
security, the greater should be public intervention. In such a scenario, the direction <strong>of</strong> public<br />
interventions should run counter to the FSI, though it need not be so.<br />
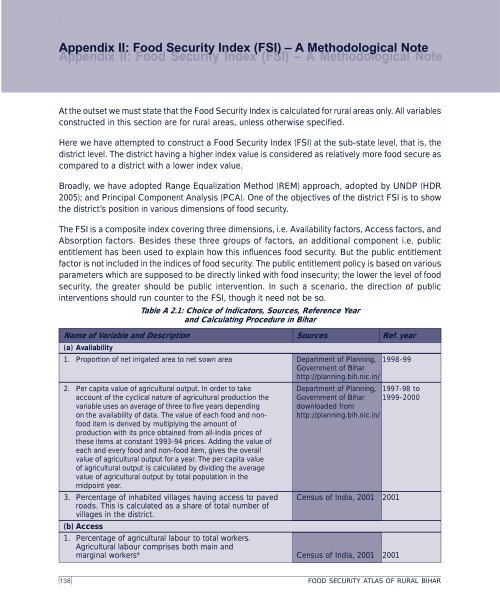
Table A 2.1: Choice <strong>of</strong> Indicators, Sources, Reference Year<br />
and Calculating Procedure in <strong>Bihar</strong><br />
Name <strong>of</strong> Variable and Description Sources Ref. year<br />
(a) Availability<br />
1. Proportion <strong>of</strong> net irrigated area to net sown area Department <strong>of</strong> Planning, 1998-99<br />
Government <strong>of</strong> <strong>Bihar</strong><br />
http://planning.bih.nic.in/<br />
2. Per capita value <strong>of</strong> agricultural output. In order to take Department <strong>of</strong> Planning, 1997-98 to<br />
account <strong>of</strong> the cyclical nature <strong>of</strong> agricultural production the Government <strong>of</strong> <strong>Bihar</strong> 1999-2000<br />
variable uses an average <strong>of</strong> three to five years depending downloaded from<br />
on the availability <strong>of</strong> data. The value <strong>of</strong> each food and non- http://planning.bih.nic.in/<br />
food item is derived by multiplying the amount <strong>of</strong><br />
production with its price obtained from all-India prices <strong>of</strong><br />
these items at constant 1993-94 prices. Adding the value <strong>of</strong><br />
each and every food and non-food item, gives the overall<br />
value <strong>of</strong> agricultural output for a year. The per capita value<br />
<strong>of</strong> agricultural output is calculated by dividing the average<br />
value <strong>of</strong> agricultural output by total population in the<br />
midpoint year.<br />
3. Percentage <strong>of</strong> inhabited villages having access to paved Census <strong>of</strong> India, 2001 2001<br />
roads. This is calculated as a share <strong>of</strong> total number <strong>of</strong><br />
villages in the district.<br />
(b) <strong>Access</strong><br />
1. Percentage <strong>of</strong> agricultural labour to total workers.<br />
Agricultural labour comprises both main and<br />
marginal workers* Census <strong>of</strong> India, 2001 2001<br />
138 FOOD SECURITY ATLAS OF RURAL BIHAR