Food Security Atlas of Rural Bihar - WFP Remote Access Secure ...
Food Security Atlas of Rural Bihar - WFP Remote Access Secure ...
Food Security Atlas of Rural Bihar - WFP Remote Access Secure ...

Create successful ePaper yourself
Turn your PDF publications into a flip-book with our unique Google optimized e-Paper software.
There is a very high rural population density in <strong>Bihar</strong> implying an intensive land use pattern. About 61<br />
per cent <strong>of</strong> the reporting area is cultivated in the state as compared to 51 per cent in the country as<br />
a whole. The area under forests has increased slightly. Marginal lands (culturable and unculturable<br />
wasteland under village commons, rivers and tank beds) have also been brought under cultivation.<br />
Vertical intensification is also high and cropping intensity is 143 per cent. This compares well with<br />
189 per cent in the Punjab, which has 94 per cent gross irrigated area as against 55 per cent in<br />
<strong>Bihar</strong> (Institute for Human Development, 2007).<br />
Somewhat more than 61 per cent <strong>of</strong> land resources <strong>of</strong> the state are locked into crop production.<br />
<strong>Food</strong>grain crops account for 87 per cent <strong>of</strong> the gross cropped area (GCA) in the state (Institute for<br />
Human Development, 2007). On the other hand, at the country level, only about 65 per cent area is<br />
occupied by foodgrain crops.<br />
2.3 Health and Nutritional Status<br />
A healthy person has a higher capacity to work. The health <strong>of</strong> an individual is directly related to his or<br />
her economic status. Health and nutritional status can be measured through a number <strong>of</strong> indicators.<br />
While mortality under age one (infant mortality) is an indicator <strong>of</strong> poor reproductive health facilities<br />
and antenatal care, mortality under age five is closely linked with health and nutrition services including<br />
A PROFILE OF THE STATE OF BIHAR<br />
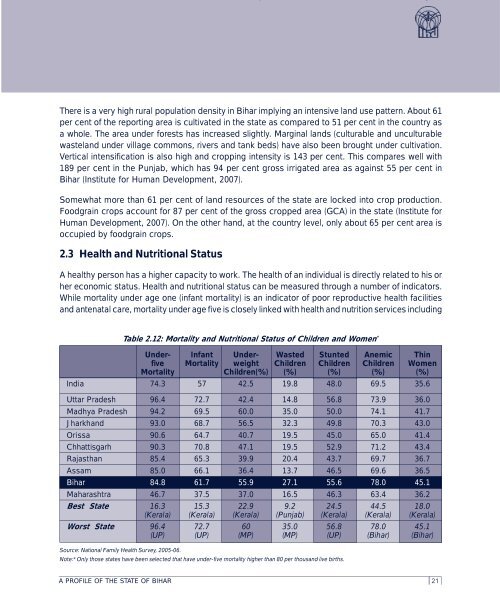
Table 2.12: Mortality and Nutritional Status <strong>of</strong> Children and Women *<br />
Under- Infant Under- Wasted Stunted Anemic Thin<br />
five Mortality weight Children Children Children Women<br />
Mortality Children(%) (%) (%) (%) (%)<br />
India 74.3 57 42.5 19.8 48.0 69.5 35.6<br />
Uttar Pradesh 96.4 72.7 42.4 14.8 56.8 73.9 36.0<br />
Madhya Pradesh 94.2 69.5 60.0 35.0 50.0 74.1 41.7<br />
Jharkhand 93.0 68.7 56.5 32.3 49.8 70.3 43.0<br />
Orissa 90.6 64.7 40.7 19.5 45.0 65.0 41.4<br />
Chhattisgarh 90.3 70.8 47.1 19.5 52.9 71.2 43.4<br />
Rajasthan 85.4 65.3 39.9 20.4 43.7 69.7 36.7<br />
Assam 85.0 66.1 36.4 13.7 46.5 69.6 36.5<br />
<strong>Bihar</strong> 84.8 61.7 55.9 27.1 55.6 78.0 45.1<br />
Maharashtra 46.7 37.5 37.0 16.5 46.3 63.4 36.2<br />
Best State 16.3 15.3 22.9 9.2 24.5 44.5 18.0<br />
(Kerala) (Kerala) (Kerala) (Punjab) (Kerala) (Kerala) (Kerala)<br />
Worst State 96.4 72.7 60 35.0 56.8 78.0 45.1<br />
(UP) (UP) (MP) (MP) (UP) (<strong>Bihar</strong>) (<strong>Bihar</strong>)<br />
Source: National Family Health Survey, 2005-06.<br />
Note:* Only those states have been selected that have under-five mortality higher than 80 per thousand live births.<br />
21