Food Security Atlas of Rural Bihar - WFP Remote Access Secure ...
Food Security Atlas of Rural Bihar - WFP Remote Access Secure ...
Food Security Atlas of Rural Bihar - WFP Remote Access Secure ...

Create successful ePaper yourself
Turn your PDF publications into a flip-book with our unique Google optimized e-Paper software.
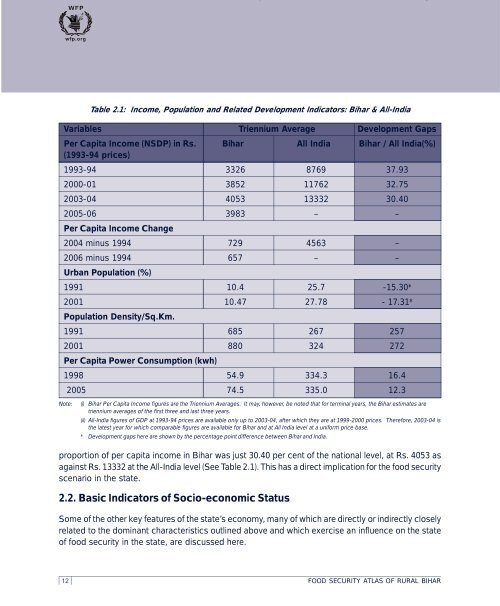
Table 2.1: Income, Population and Related Development Indicators: <strong>Bihar</strong> & All-India<br />
Variables Triennium Average Development Gaps<br />
Per Capita Income (NSDP) in Rs. <strong>Bihar</strong> All India <strong>Bihar</strong> / All India(%)<br />
(1993-94 prices)<br />
1993-94 3326 8769 37.93<br />
2000-01 3852 11762 32.75<br />
2003-04 4053 13332 30.40<br />
2005-06 3983 – –<br />
Per Capita Income Change<br />
2004 minus 1994 729 4563 –<br />
2006 minus 1994 657 – –<br />
Urban Population (%)<br />
1991 10.4 25.7 -15.30*<br />
2001 10.47 27.78 - 17.31*<br />
Population Density/Sq.Km.<br />
1991 685 267 257<br />
2001 880 324 272<br />
Per Capita Power Consumption (kwh)<br />
1998 54.9 334.3 16.4<br />
2005 74.5 335.0 12.3<br />
Note: (i) <strong>Bihar</strong> Per Capita Income figures are the Triennium Averages. It may, however, be noted that for terminal years, the <strong>Bihar</strong> estimates are<br />
triennium averages <strong>of</strong> the first three and last three years.<br />
(ii) All-India figures <strong>of</strong> GDP at 1993-94 prices are available only up to 2003-04, after which they are at 1999-2000 prices. Therefore, 2003-04 is<br />
the latest year for which comparable figures are available for <strong>Bihar</strong> and at All India level at a uniform price base.<br />
* Development gaps here are shown by the percentage point difference between <strong>Bihar</strong> and India.<br />
proportion <strong>of</strong> per capita income in <strong>Bihar</strong> was just 30.40 per cent <strong>of</strong> the national level, at Rs. 4053 as<br />
against Rs. 13332 at the All-India level (See Table 2.1). This has a direct implication for the food security<br />
scenario in the state.<br />
2.2. Basic Indicators <strong>of</strong> Socio-economic Status<br />
Some <strong>of</strong> the other key features <strong>of</strong> the state’s economy, many <strong>of</strong> which are directly or indirectly closely<br />
related to the dominant characteristics outlined above and which exercise an influence on the state<br />
<strong>of</strong> food security in the state, are discussed here.<br />
12 FOOD SECURITY ATLAS OF RURAL BIHAR