Processed feed pea and canola meal for blue shrimp diets
Processed feed pea and canola meal for blue shrimp diets
Processed feed pea and canola meal for blue shrimp diets

You also want an ePaper? Increase the reach of your titles
YUMPU automatically turns print PDFs into web optimized ePapers that Google loves.
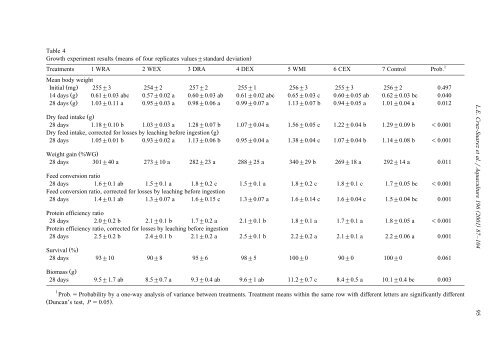
Table 4<br />
Growth experiment results Ž means of four replicates values"st<strong>and</strong>ard deviation.<br />
Treatments 1 WRA 2 WEX 3 DRA 4 DEX 5 WMI 6 CEX 7 Control Prob. 1<br />
Mean body weight<br />
Initial Ž mg.<br />
255"3 254"2 257"2 255"1 256"3 255"3 256"2 0.497<br />
14 days Ž. g 0.61"0.03 abc 0.57"0.02 a 0.60"0.03 ab 0.61"0.02 abc 0.65"0.03 c 0.60"0.05 ab 0.62"0.03 bc 0.040<br />
28 days Ž. g 1.03"0.11 a 0.95"0.03 a 0.98"0.06 a 0.99"0.07 a 1.13"0.07 b 0.94"0.05 a 1.01"0.04 a 0.012<br />
Dry <strong>feed</strong> intake Ž. g<br />
28 days 1.18"0.10 b 1.03"0.03 a 1.28"0.07 b 1.07"0.04 a 1.56"0.05 c 1.22"0.04 b 1.29"0.09 b -0.001<br />
Dry <strong>feed</strong> intake, corrected <strong>for</strong> losses by leaching be<strong>for</strong>e ingestion Ž. g<br />
28 days 1.05"0.01 b 0.93"0.02 a 1.13"0.06 b 0.95"0.04 a 1.38"0.04 c 1.07"0.04 b 1.14"0.08 b -0.001<br />
Ž .<br />
Weight gain %WG<br />
28 days 301"40 a 273"10 a 282"23 a 288"25 a 340"29 b 269"18 a 292"14 a 0.011<br />
Feed conversion ratio<br />
28 days 1.6"0.1 ab 1.5"0.1 a 1.8"0.2 c 1.5"0.1 a 1.8"0.2 c 1.8"0.1 c 1.7"0.05 bc -0.001<br />
Feed conversion ratio, corrected <strong>for</strong> losses by leaching be<strong>for</strong>e ingestion<br />
28 days 1.4"0.1 ab 1.3"0.07 a 1.6"0.15 c 1.3"0.07 a 1.6"0.14 c 1.6"0.04 c 1.5"0.04 bc 0.001<br />
Protein efficiency ratio<br />
28 days 2.0"0.2 b 2.1"0.1 b 1.7"0.2 a 2.1"0.1 b 1.8"0.1 a 1.7"0.1 a 1.8"0.05 a -0.001<br />
Protein efficiency ratio, corrected <strong>for</strong> losses by leaching be<strong>for</strong>e ingestion<br />
28 days 2.5"0.2 b 2.4"0.1 b 2.1"0.2 a 2.5"0.1 b 2.2"0.2 a 2.1"0.1 a 2.2"0.06 a 0.001<br />
Survival Ž %.<br />
28 days 93"10 90"8 95"6 98"5 100"0 90"0 100"0 0.061<br />
Biomass Ž. g<br />
28 days 9.5"1.7 ab 8.5"0.7 a 9.3"0.4 ab 9.6"1 ab 11.2"0.7 c 8.4"0.5 a 10.1"0.4 bc 0.003<br />
1 Prob.sProbability by a one-way analysis of variance between treatments. Treatment means within the same row with different letters are significantly different<br />
Ž .<br />
Duncan’s test, P s0.05 .<br />
L.E. Cruz-Suarez et al.rAquaculture 196 ( 2001 ) 87–104 95