Feed Peas in diets for shrimp tilapia and milkfish - Northern Pulse ...
Feed Peas in diets for shrimp tilapia and milkfish - Northern Pulse ...
Feed Peas in diets for shrimp tilapia and milkfish - Northern Pulse ...

You also want an ePaper? Increase the reach of your titles
YUMPU automatically turns print PDFs into web optimized ePapers that Google loves.
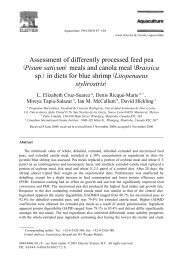
F<strong>in</strong>al Project ReportTitle:Utilization of feed peas (Pisum sativum) as alternative prote<strong>in</strong> sources <strong>in</strong> <strong>diets</strong> <strong>for</strong><strong>shrimp</strong>, <strong>tilapia</strong>, <strong>and</strong> <strong>milkfish</strong>.Implement<strong>in</strong>g Personnel <strong>and</strong> Agencies:Southeast Asian Fisheries Development Center, Aquaculture DepartmentClarissa L. Marte, PhD, Head, SEAFDEC Research Division (clmarte@aqd.seafdec.org.ph)Myrna B. Teruel, Study leader, Shrimp (mbt@aqd.seafdec.org.ph)Corazon B. Santiago, PhD, Study leader, Tilapia (csantiago@aqd.seafdec.org.ph)Ilda G. Borlongan, Study leader, Milkfish (igb@aqd.seafdec.org.ph)Perla S. Eusebio, Study leader, Digestibility experiments (pse@aqd.seafdec.org.ph)USA Dry Pea <strong>and</strong> Lentil CouncilTimothy Welsh, Southeast Asia Representative (agsource@lox<strong>in</strong>fo.co.th)Fund<strong>in</strong>g:US Department of Agriculture, Emerg<strong>in</strong>g Markets ProgramUSA Dry Pea <strong>and</strong> Lentil CouncilTrial Period: July, 2001 through March, 2002
Table of ContentsSUMMARY ............................................................................................................................................................1-2STUDY 1. SHRIMP (PENAEUS MONODON, FABRICIUS)............................................................................................... 1STUDY 2. TILAPIA (OREOCHROMIS NILOTICUS L.)..................................................................................................... 1STUDY 3. MILKFISH (CHANOS CHANOS, FORSSKAL)................................................................................................. 2GENERAL CONCLUSIONS ............................................................................................................................................ 2Utilization Of <strong>Feed</strong> Pea, Pisum Sativum Meal, As An Alternative Prote<strong>in</strong> SourceIn Practical Diets For Juvenile Tiger Shrimp, Penaeus Monodon Fabricius......................................................3-10ABSTRACT................................................................................................................................................................... 3INTRODUCTION............................................................................................................................................................ 3MATERIALS AND METHODS........................................................................................................................................ 4RESULTS...................................................................................................................................................................... 5DISCUSSION................................................................................................................................................................. 5ACKNOWLEDGEMENT ................................................................................................................................................. 9REFERENCES: .............................................................................................................................................................. 9<strong>Feed</strong> Pea (Pisum Sativum) As An Alternative Prote<strong>in</strong> SourceIn The Diets Of Nile Tilapia, Oreochromis Niloticus (L.) ................................................................................11-19ABSTRACT................................................................................................................................................................. 11INTRODUCTION.......................................................................................................................................................... 11MATERIALS AND METHODS...................................................................................................................................... 11RESULTS.................................................................................................................................................................... 13DISCUSSION............................................................................................................................................................... 14ACKNOWLEDGEMENTS ............................................................................................................................................. 18REFERENCES.............................................................................................................................................................. 18Potential Of <strong>Feed</strong> Pea (Pisum Sativum) As An Alternative Prote<strong>in</strong> SourceIn Practical Diets For Milkfish (Chanos Chanos Forsskal)...............................................................................20-26ABSTRACT................................................................................................................................................................. 20INTRODUCTION.......................................................................................................................................................... 20MATERIALS AND METHODS...................................................................................................................................... 20RESULTS.................................................................................................................................................................... 22DISCUSSION............................................................................................................................................................... 22ACKNOWLEDGEMENT ............................................................................................................................................... 26REFERENCES.............................................................................................................................................................. 26
SUMMARYThis report summarizes the results of experiments conducted to test the efficacy of feed pea meal (Pisumsativum) as an alternative prote<strong>in</strong> source <strong>in</strong> the <strong>diets</strong> <strong>for</strong> <strong>tilapia</strong>, <strong>milkfish</strong>, <strong>and</strong> <strong>shrimp</strong>. All <strong>for</strong>mulations werebased on the known nutrient requirements (e.g., prote<strong>in</strong>, fat, carbohydrate, prote<strong>in</strong>:energy ratio,<strong>in</strong>dispensable am<strong>in</strong>o acids) of the species specified.Study 1. Shrimp (Penaeus monodon, Fabricius)The potential of feed pea meal as an alternative prote<strong>in</strong> source <strong>in</strong> practical <strong>diets</strong> <strong>for</strong> juvenile tiger <strong>shrimp</strong>was assessed <strong>in</strong> a 12-week feed<strong>in</strong>g trial. Formulated <strong>diets</strong> were made isonitrogenous (40% crude prote<strong>in</strong>)<strong>and</strong> isocaloric (14.5 kJ g –1 ). The control diet conta<strong>in</strong>ed fish meal, soybean meal, squid meal, <strong>shrimp</strong> meal,<strong>shrimp</strong> head meal as prote<strong>in</strong> sources. Prote<strong>in</strong> from feed pea meal replaced 0, 20, 40, 60, 80, <strong>and</strong> 100% ofthe prote<strong>in</strong> from defatted soybean meal <strong>in</strong> the <strong>diets</strong>. These values were equivalent to 0, 5, 10, 15, 20, 25%,respectively, of the total prote<strong>in</strong> <strong>in</strong> the diet. A negative control with no prote<strong>in</strong> sources was added to thetreatment. Twelve <strong>shrimp</strong> post-larvae with an average weight of 0.02±0.01g were r<strong>and</strong>omly assigned <strong>in</strong> 35,60-l oval tanks equipped with a flow-through seawater system. The <strong>shrimp</strong> were fed the <strong>for</strong>mulated <strong>diets</strong> ata daily feed<strong>in</strong>g rate of 20-25% body weight <strong>in</strong> 5 replicate samples.Results showed no significant differences <strong>in</strong> % weight ga<strong>in</strong> (WG)(5162 to 5839); specific growth rate (SGR)(4.4-4.6); feed conversion ratio (FCR) (1.2-1.9); prote<strong>in</strong> efficiency ratio (PER) (1.2-1.7); survival (SURV)(75-100) of <strong>shrimp</strong> fed <strong>diets</strong> with 0 up to the highest level of replacement. Weight ga<strong>in</strong> of <strong>shrimp</strong> fed thenegative control (364) was significantly lower (P>0.05) compared to the rest of the treatments.The apparent dry matter (ADMD) <strong>and</strong> prote<strong>in</strong> (APD) digestibilities of the dry feed pea <strong>in</strong> P. monodon werehigh at 73.38±4.98% <strong>and</strong> 92.74±2.62%, respectively. Digestibility coefficients <strong>for</strong> dry matter (71-77%) <strong>and</strong>prote<strong>in</strong> (83-88%) <strong>for</strong> the feed pea meal-based <strong>diets</strong> <strong>in</strong>creased with <strong>in</strong>creas<strong>in</strong>g level of feed peareplacement.The results <strong>in</strong>dicate that whole feed pea meal can be an alternative prote<strong>in</strong> source <strong>for</strong> <strong>shrimp</strong>. It cansubstitute even up to 100% of the prote<strong>in</strong> from defatted soybean meal, which is equivalent to 25% of thetotal prote<strong>in</strong> <strong>in</strong> the diet. An <strong>in</strong>clusion level of up to 42% <strong>in</strong> the juvenile <strong>shrimp</strong> practical diet did not manifestany adverse effects on growth, feed efficiency, survival, body composition, <strong>and</strong> digestibility coefficients <strong>for</strong>dry matter <strong>and</strong> prote<strong>in</strong> of the <strong>shrimp</strong>.Study 2. Tilapia (Oreochromis niloticus L.)The <strong>tilapia</strong> experiments made use of fish meal-based (experiment 1) <strong>and</strong> plant-based (experiment 2) <strong>diets</strong>to allow maximum level of feed pea as a prote<strong>in</strong> source. In both experiments, all test <strong>diets</strong> were madeisonitrogenous (30% crude prote<strong>in</strong>) <strong>and</strong> isocaloric (14 kJ g –1 ). Water temperature dur<strong>in</strong>g the feed<strong>in</strong>g trialsranged from 22-27°CExperiment 1. Fish meal supplied about 28% prote<strong>in</strong> <strong>in</strong> the <strong>diets</strong>. <strong>Feed</strong> peas (12.7-63.3% of the diet)substituted up to 50% of fish meal prote<strong>in</strong>. Manually sexed male Nile <strong>tilapia</strong>, each weigh<strong>in</strong>g 32-39g atstock<strong>in</strong>g, were used. The fish were reared <strong>in</strong> polyethylene tanks (58x37x27 cm) with aeration undercontrolled conditions. Water was static <strong>and</strong> was partially replaced once a day. Fish were allowed to feed tosatiation twice daily.The various <strong>in</strong>clusion levels of feed peas did not affect body weight, feed<strong>in</strong>g activity, <strong>and</strong> feed efficiency ofthe <strong>tilapia</strong>. Weight ga<strong>in</strong> after 9 weeks (range: 21.7±5.6 to 34.0±9.3g) did not differ significantly amongtreatments (P>0.05). Survival rates were highly variable (40-75%) <strong>and</strong> not significantly different. Mortalitywas not related to treatment. FCR (3.2 to 4.2) <strong>and</strong> PER (0.8 to 1.0) were not significantly different amongtreatments.Experiment 2. <strong>Feed</strong> peas <strong>in</strong> the <strong>diets</strong> ranged from 5.9-41%. <strong>Feed</strong> peas substituted up to 35% of the plantprote<strong>in</strong> (or up to about 30% of total dietary prote<strong>in</strong>). The control diet conta<strong>in</strong>ed fish meal, soybean meal,<strong>and</strong> copra meal as pr<strong>in</strong>cipal prote<strong>in</strong> sources. Separate feed<strong>in</strong>g trials were conducted on two stra<strong>in</strong>s of allmale<strong>tilapia</strong> (CLSU <strong>and</strong> BFAR stra<strong>in</strong>s) under controlled conditions us<strong>in</strong>g the same test <strong>diets</strong> <strong>and</strong> biggertanks (90x78x43 cm).There were no significant differences <strong>in</strong> weight ga<strong>in</strong> among treatments after 12 weeks of feed<strong>in</strong>g (45.5-±7.8to 57.4±12.4g <strong>for</strong> the CLSU stra<strong>in</strong>; 52.5±4.4 to 74.1±9.2g <strong>for</strong> the BFAR stra<strong>in</strong>). Moreover, FCR (3.2 to 4.0)or PER (0.9 to 1.0) were not significantly different among treatments. Survival was 100% <strong>in</strong> all tanks <strong>in</strong>both trials.1
Digestibility Experiments. As <strong>in</strong>gredient <strong>in</strong> <strong>tilapia</strong> diet, feed pea has apparent dry matter digestibility(ADMD) of 69.3+1.8% <strong>and</strong> apparent prote<strong>in</strong> digestibility (APD) of 87.2±2.0%. The digestibility of some ofthe <strong>diets</strong> used <strong>in</strong> experiments 1 <strong>and</strong> 2 was also determ<strong>in</strong>ed <strong>in</strong> separate feed<strong>in</strong>g trials. The ADMD of the<strong>diets</strong> <strong>in</strong>creased as feed pea <strong>in</strong>clusion level <strong>in</strong>creased. The APD of the fishmeal-based <strong>diets</strong> or the plantbased<strong>diets</strong> were all high, exceed<strong>in</strong>g 90%.Overall, feed pea meal may substitute up to 50% of fish meal prote<strong>in</strong> (equivalent to 63.3% feed pea) <strong>and</strong>35% of the plant prote<strong>in</strong>s (41% feed pea) <strong>in</strong> the <strong>diets</strong> of Nile <strong>tilapia</strong> without any adverse effect on fishgrowth <strong>and</strong> survival.Study 3. Milkfish (Chanos chanos, Forsskal)The efficacy of feed pea meal as an alternative prote<strong>in</strong> source <strong>for</strong> <strong>milkfish</strong> was tested <strong>in</strong> a 12-week feed<strong>in</strong>gtrial. All test <strong>diets</strong> were made isonitrogenous (30% crude prote<strong>in</strong>) <strong>and</strong> isocaloric (15.7 kJ g –1 ). The controldiet conta<strong>in</strong>ed fish meal, soybean meal, meat <strong>and</strong> bone meal, <strong>and</strong> copra meal as prote<strong>in</strong> sources. <strong>Feed</strong>pea meal was substituted at 0, 5, 10, 15, 20, 25, <strong>and</strong> 30% of total prote<strong>in</strong>. A lead<strong>in</strong>g commercial <strong>milkfish</strong>feed was also tested as an additional control. The experimental <strong>diets</strong> were fed to triplicate groups of<strong>milkfish</strong> f<strong>in</strong>gerl<strong>in</strong>gs (mean <strong>in</strong>itial weight =0.42±0.01g) at 10% body weight /day.Results showed that % weight ga<strong>in</strong> (WG) of <strong>milkfish</strong> juveniles fed <strong>diets</strong> with 5% (WG= 833.1) <strong>and</strong> 10%(WG=835.3) feed pea <strong>in</strong>clusion did not significantly differ from that of the SEAFDEC control diet (0% feedpea <strong>in</strong>clusion; WG=834.8). However, % weight ga<strong>in</strong> obta<strong>in</strong>ed <strong>for</strong> <strong>milkfish</strong> juveniles fed with 15%(WG=691.0) <strong>and</strong> 20% (WG=680.0) feed pea <strong>in</strong>clusion <strong>in</strong> the diet were significantly higher than thecommercial <strong>milkfish</strong> feed <strong>for</strong>mulation (no feed pea <strong>in</strong>clusion, WG=581.4). Survival ranged from 70-90%.FCR was between 2.1 to 2.60 while PER ranged from 1.15 to 1.44.Dietary crude prote<strong>in</strong> digestibility values of the experimental <strong>diets</strong> were 84.8 to 89.2% suggest<strong>in</strong>g that feedpea prote<strong>in</strong> is well digested by <strong>milkfish</strong>.Over-all results <strong>in</strong>dicate that feed peas could be used as an alternate dietary prote<strong>in</strong> source <strong>for</strong> <strong>milkfish</strong>juveniles. Optimum level of <strong>in</strong>clusion without am<strong>in</strong>o acid supplementation is 10% of the dietary prote<strong>in</strong>(131g feed pea/kg dry diet). Dietary prote<strong>in</strong> <strong>in</strong>clusion levels up to 20% feed peas (260g/kg diet) are stillacceptable.General ConclusionsThese feed<strong>in</strong>g trials clearly demonstrate that whole feed pea can be <strong>in</strong>corporated as an alternative prote<strong>in</strong>source <strong>in</strong> <strong>diets</strong> <strong>for</strong> <strong>tilapia</strong>, <strong>milkfish</strong>, <strong>and</strong> <strong>shrimp</strong>. S<strong>in</strong>ce feed peas have a moderate prote<strong>in</strong> content (23-25%)compared to fish meal (65-70%), their <strong>in</strong>corporation <strong>in</strong> fish <strong>diets</strong> needs to be balanced with other prote<strong>in</strong><strong>in</strong>gredients, especially <strong>for</strong> fish that require high prote<strong>in</strong> levels <strong>in</strong> their diet. In this case, feed pea canthere<strong>for</strong>e be used as one of the <strong>in</strong>gredients that would collectively replace fish meal <strong>in</strong> practical <strong>diets</strong>.The replacement of other plant prote<strong>in</strong> sources with feed pea is possible as evidenced by the studiesconducted. <strong>Feed</strong> peas conta<strong>in</strong> high levels of lys<strong>in</strong>e, which could complement the am<strong>in</strong>o acids of other<strong>in</strong>gredient substitutes that are deficient <strong>in</strong> such am<strong>in</strong>o acids. The relatively low level of sulfur am<strong>in</strong>o acids(i.e., methion<strong>in</strong>e <strong>and</strong> cyst<strong>in</strong>e) <strong>in</strong> feed pea meal may limit the use of this plant prote<strong>in</strong> source depend<strong>in</strong>gupon the requirement of the species <strong>and</strong> the diet <strong>for</strong>mulation.The pea variety used <strong>in</strong> these studies conta<strong>in</strong>s low levels of anti-nutritional factors <strong>and</strong> is similar to mostfeed pea varieties now supplied <strong>in</strong> global markets. Thus, positive results were obta<strong>in</strong>ed <strong>for</strong> <strong>shrimp</strong> <strong>and</strong><strong>tilapia</strong>, even at high levels of <strong>in</strong>corporation <strong>in</strong> the <strong>diets</strong>. The relatively lower per<strong>for</strong>mance of <strong>milkfish</strong>compared to <strong>shrimp</strong> <strong>and</strong> <strong>tilapia</strong>, even with feed pea compris<strong>in</strong>g 15% of the diet, may be attributed to am<strong>in</strong>oacid deficiencies or possibly to effects from certa<strong>in</strong> anti-nutritional factors. However, it is notable that thegrowth response of <strong>milkfish</strong> fed the 15% feed pea diet was still better than from the commercial <strong>milkfish</strong>diet, which conta<strong>in</strong>ed no feed pea, so further study is needed.The availability of feed pea meal as an alternative prote<strong>in</strong> source <strong>for</strong> <strong>tilapia</strong>, <strong>milkfish</strong>, <strong>and</strong> <strong>shrimp</strong> may openavenues <strong>for</strong> commercial producers to reduce feed costs. <strong>Feed</strong> peas have a higher carbohydrate content(65-67%) compared to soybean meal (44-45%), which may provide a lower cost <strong>and</strong> more digestible energysource <strong>for</strong> the animals.2
Utilization Of <strong>Feed</strong> Pea, Pisum Sativum Meal, As An Alternative Prote<strong>in</strong> SourceIn Practical Diets For Juvenile Tiger Shrimp, Penaeus Monodon FabriciusMyrna N. Bautista-Teruel, Perla S. Eusebio, <strong>and</strong> Timothy P. WelshAbstractThe potential of feed pea, Pisum sativum, meal as an alternative prote<strong>in</strong> source <strong>in</strong> practical <strong>diets</strong> <strong>for</strong> thejuvenile tiger <strong>shrimp</strong>, Penaeus monodon, was assessed <strong>in</strong> several experiments. Six isonitrogenous <strong>diets</strong>were <strong>for</strong>mulated to conta<strong>in</strong> 40% prote<strong>in</strong>. Prote<strong>in</strong> from feed pea meal replaced 0, 20, 40, 60, 80, <strong>and</strong> 100%of the prote<strong>in</strong> from defatted soybean meal <strong>in</strong> the <strong>diets</strong>. These values were equivalent to 0, 5, 10, 15, 20,<strong>and</strong> 25% respectively of the total prote<strong>in</strong> <strong>in</strong> the diet. A negative control with no prote<strong>in</strong> sources was addedto the treatments. Twelve <strong>shrimp</strong> post-larvae with an average weight of 0.02±0.01g were r<strong>and</strong>omlyassigned <strong>in</strong> 35, 60-l oval tanks equipped with a flow-through seawater system. The <strong>shrimp</strong>s were fed the<strong>for</strong>mulated <strong>diets</strong> at a daily feed<strong>in</strong>g rate of 20-25% body weight <strong>for</strong> 90 days <strong>in</strong> 5 replicate samples. Nosignificant differences (P0.05) compared to the rest of thetreatments. Specific growth rates (SGR) of <strong>shrimp</strong>s <strong>for</strong> the various treatments showed the same trend asthe percent weight ga<strong>in</strong>. Survival of <strong>shrimp</strong> <strong>for</strong> all treatments, <strong>in</strong>clud<strong>in</strong>g the negative control, was generallyhigh at 75-100%. The apparent dry matter (ADMD) <strong>and</strong> prote<strong>in</strong> (APD) digestibilities of the dry feed pea <strong>in</strong> P.monodon were high at 73.38±4.98 <strong>and</strong> 92.74±2.62, respectively. Digestibility coefficients <strong>for</strong> dry matter <strong>and</strong>prote<strong>in</strong> <strong>for</strong> the feed pea meal-based <strong>diets</strong> <strong>in</strong>creased with <strong>in</strong>creas<strong>in</strong>g level of feed pea replacement. Therewere no significant differences (P
Materials <strong>and</strong> MethodsExperimental <strong>diets</strong>The feed <strong>in</strong>gredients used <strong>in</strong> this study were obta<strong>in</strong>ed from commercial suppliers through the SEAFDECpilot feed mill plant. <strong>Feed</strong> pea of US orig<strong>in</strong> was supplied through a local distributor <strong>in</strong> Manila, Philipp<strong>in</strong>es.Prior to use, all dry feed <strong>in</strong>gredients were ground <strong>and</strong> sieved through a 60µm mesh screen sieve.Proximate analyses <strong>for</strong> each feed <strong>in</strong>gredient were conducted <strong>and</strong> the result<strong>in</strong>g data were used <strong>in</strong> diet<strong>for</strong>mulation (Table 1). Six isonitrogenous <strong>diets</strong> were <strong>for</strong>mulated to conta<strong>in</strong> 40% prote<strong>in</strong> (Table 2). Prote<strong>in</strong>from feed pea replaced 0, 20, 40, 60, 80, <strong>and</strong> 100% of the prote<strong>in</strong> from defatted soybean meal <strong>in</strong> the <strong>diets</strong>.These values were equivalent to 0, 5, 10, 15, 20, 25%, respectively, of the total prote<strong>in</strong> <strong>in</strong> the diet.Replacement of prote<strong>in</strong> was based on the essential am<strong>in</strong>o acid requirements of tiger <strong>shrimp</strong> (Kanazawa<strong>and</strong> Teshima, 1981; NRC, 1993; FDS Manual, 1994; Millamena et al., 1996-1999). A negative control withno prote<strong>in</strong> sources was added to the treatments. Prote<strong>in</strong> content of 40% <strong>in</strong> the <strong>shrimp</strong> diet has beenreported to be optimal <strong>for</strong> juvenile Penaeus monodon (Alava <strong>and</strong> Lim 1983; Bautista, 1986; Shiau et al.1991). The diet conta<strong>in</strong><strong>in</strong>g no feed pea meal served as the control diet. Other animal prote<strong>in</strong> sources, suchas fish meal, <strong>shrimp</strong> meal, <strong>shrimp</strong> head meal, <strong>and</strong> squid meal, were <strong>in</strong>cluded <strong>in</strong> the dietary <strong>for</strong>mulations atthe same levels. The levels of wheat flour <strong>and</strong> rice bran were adjusted to ma<strong>in</strong>ta<strong>in</strong> similar dietary prote<strong>in</strong>contents. Diets were prepared accord<strong>in</strong>g to st<strong>and</strong>ard diet preparation <strong>in</strong> the laboratory as described <strong>in</strong> FDSManual, 1994. To prevent lipid oxidation dur<strong>in</strong>g storage, all <strong>diets</strong> were packed <strong>in</strong> sealed plastic conta<strong>in</strong>ers<strong>and</strong> stored <strong>in</strong>side a cold room at –20ºC until used <strong>in</strong> the feed<strong>in</strong>g trials.Proximate analyses were conducted of the various <strong>diets</strong> prepared follow<strong>in</strong>g the methods of Association ofOfficial Analytical Chemists (AOAC 1990). The am<strong>in</strong>o acid composition of both soybean meal <strong>and</strong> feed peameal <strong>and</strong> experimental <strong>diets</strong> was determ<strong>in</strong>ed us<strong>in</strong>g the method of Simpson et al., 1976.<strong>Feed</strong><strong>in</strong>g trialsGood quality <strong>and</strong> disease-free post-larval Penaeus monodon were sourced from a private hatchery <strong>in</strong>Tigbauan, Iloilo, Philipp<strong>in</strong>es. They were placed <strong>in</strong> 2-tonne fiberglass tanks <strong>and</strong> fed with Artemia sp <strong>and</strong>control diet <strong>for</strong> a week be<strong>for</strong>e they were transferred to experimental tanks. Twelve <strong>shrimp</strong> post-larvae withan average weight of 0.02 ± 0.01g were r<strong>and</strong>omly assigned <strong>in</strong> 35, 60 L oval tanks equipped with a flowthroughseawater system. Prior to start of the feed<strong>in</strong>g trial, <strong>shrimp</strong>s were acclimatized to experimental <strong>diets</strong>.The <strong>shrimp</strong> were fed the <strong>for</strong>mulated <strong>diets</strong> at a daily feed<strong>in</strong>g rate of 20-25% of total body weight <strong>for</strong> 90 days<strong>in</strong> 5 replicate samples. Shrimp were fed three times daily at 0800, 1300, <strong>and</strong> 1700h. The wet weights ofthe <strong>shrimp</strong> were recorded every 15-d <strong>in</strong>terval <strong>for</strong> 90 days <strong>and</strong> the amount of feed given was adjusted everysampl<strong>in</strong>g day. All experimental tanks were cleaned be<strong>for</strong>e every feed<strong>in</strong>g. Water temperature, sal<strong>in</strong>ity,dissolved oxygen, <strong>and</strong> pH were measured daily <strong>in</strong> all tanks. Total values <strong>for</strong> ammonia-nitrogen <strong>and</strong> nitritenitrogenwere measured once a week. Shrimp were collected at the beg<strong>in</strong>n<strong>in</strong>g of the feed<strong>in</strong>g trial <strong>for</strong>proximate analyses. At the conclusion of the feed<strong>in</strong>g trial, all <strong>shrimp</strong> samples from each tank were pooled,freeze-dried <strong>and</strong> ground <strong>for</strong> proximate analyses of whole body composition follow<strong>in</strong>g the st<strong>and</strong>ard methodsof AOAC (1990).Biological analysisDiet per<strong>for</strong>mance was evaluated by calculation of percent weight ga<strong>in</strong>=f<strong>in</strong>al weight-<strong>in</strong>itial weight/<strong>in</strong>itialweight x 100; specific growth rate=100 (ln ave. f<strong>in</strong>al wt-ln ave. <strong>in</strong>itial wt)/no. of culture days; feed conversionratio (FCR)= total dry feed <strong>in</strong>take (g)/wet weight ga<strong>in</strong> (g); percent survival =f<strong>in</strong>al number of <strong>shrimp</strong>/<strong>in</strong>itialnumber of <strong>shrimp</strong> x 100.In vivo digestibility experimentApparent digestibility coefficients <strong>for</strong> dry matter (ADMD) <strong>and</strong> crude prote<strong>in</strong> (APD) of feed peas as <strong>in</strong>gredient<strong>and</strong> feed-peas based <strong>diets</strong> were measured us<strong>in</strong>g 1% Cr 2 O 3 as external <strong>in</strong>dicator. The method by Cho. etal. (1982) was adapted <strong>in</strong> a ratio of 70:30 (reference diet to test <strong>in</strong>gredient) <strong>in</strong> each test diet. The controldiet used <strong>for</strong> growth experiment was used as reference diet. Composition of the diet is shown <strong>in</strong> Table 3.In the digestibility experiment <strong>for</strong> the test <strong>in</strong>gredient <strong>and</strong> feed pea-based <strong>diets</strong>, 10 <strong>shrimp</strong> with mean bodyweight of 14.53± 0.57g <strong>and</strong> 8 <strong>shrimp</strong> with mean body weight of 13.56±0.56g were stocked <strong>in</strong> 250 L conicalfiberglass tanks <strong>for</strong> the test <strong>in</strong>gredient <strong>and</strong> feed pea-based <strong>diets</strong>, respectively. The <strong>shrimp</strong> were acclimatedto experimental <strong>diets</strong> <strong>and</strong> laboratory conditions <strong>for</strong> 7 days be<strong>for</strong>e the experiment. All <strong>shrimp</strong> were fed at 8-10% of the total body weight 3x daily. A flow-through filtered seawater system with cont<strong>in</strong>uous aeration <strong>and</strong>flow rate of 600-700 ml/m<strong>in</strong> was provided <strong>for</strong> each tank. Water temperature <strong>and</strong> sal<strong>in</strong>ity were ma<strong>in</strong>ta<strong>in</strong>ed at24-48ºC <strong>and</strong> at 30-34 ppt, respectively. Culture period was 80 days. Fecal collection was done manually.The feces were allowed to float <strong>in</strong>to a plastic scoop <strong>and</strong> then pipetted <strong>and</strong> gently transferred <strong>in</strong>to acollect<strong>in</strong>g vial. Care was taken to prevent the break<strong>in</strong>g-up of fecal str<strong>and</strong>s to facilitate collection <strong>and</strong> toavoid leach<strong>in</strong>g of nutrients. Thereafter, fecal samples were carefully r<strong>in</strong>sed with distilled water <strong>and</strong>immediately stored <strong>in</strong> a freezer to retard bacterial decomposition. At the end of fecal collection, samples4
were thawed <strong>and</strong> pooled prior to freeze-dry<strong>in</strong>g. Dried fecal samples were thoroughly mixed <strong>and</strong> prepared<strong>for</strong> chromic (Cr 2 O 3 ) (Carter et al., 1960) <strong>and</strong> crude prote<strong>in</strong> analysis (AOAC, 1990). Apparent dry matterdigestibility (ADMD) <strong>and</strong> apparent prote<strong>in</strong> digestibility (APD) were determ<strong>in</strong>ed us<strong>in</strong>g the equation:% Digestibility = 100-100 X [{C d /C f } X {N f /N d }] where: C d = % chromic oxide <strong>in</strong> diet; C f = % chromic oxide <strong>in</strong>feces; N f = % nutrient <strong>in</strong> feces; N d = % nutrient <strong>in</strong> dietWater stability test <strong>for</strong> <strong>diets</strong>Water stability of the <strong>diets</strong> was determ<strong>in</strong>ed at 4, 8, 12, 16, <strong>and</strong> 24 h follow<strong>in</strong>g the method described <strong>in</strong> FDSManual, 1994. Percent water stability was computed as f<strong>in</strong>al dry weight of feed / <strong>in</strong>itial dry weight of feed X100.Statistical analysisAll data were analyzed by a one-way ANOVA us<strong>in</strong>g a Statistical Analysis Software Program of SPSS. TheDuncan’s Multiple Comparisons T was used to determ<strong>in</strong>e the differences between the treatment means(Duncan, 1955). Results were considered statistically significant at the level of P
Smith et al. (1999) reported that digestibility coefficients of feed peas <strong>in</strong> tiger <strong>shrimp</strong> were 80% <strong>for</strong> ADMD<strong>and</strong> 91% <strong>for</strong> APD. The ADMD value <strong>and</strong> APD value is almost the same as those obta<strong>in</strong>ed <strong>in</strong> this presentstudy (73% <strong>and</strong> 89-92%).In this study, no adverse effect on <strong>shrimp</strong> was noted on the use of whole unprocessed feed pea. Perhaps,process<strong>in</strong>g of feed pea may even improve its present nutritional value. Cruz-Suarez et al., 2001 however,did not obta<strong>in</strong> any particular benefit with the use of processed feed pea (dehull<strong>in</strong>g). In her study, raw feedpeas <strong>and</strong> peas processed by dehull<strong>in</strong>g have similar nutritional value <strong>in</strong> <strong>shrimp</strong> <strong>diets</strong>. Results, however, maybe dependent on the type or variety of feed pea used. Studies with other species such as trout (Kaushik etal., 1993) <strong>and</strong> European sea bass (Giuveia <strong>and</strong> Davies, 2000) have emphasized the requirement <strong>for</strong>dehull<strong>in</strong>g <strong>and</strong> extrusion cook<strong>in</strong>g. Eusebio (1991) also found that process<strong>in</strong>g of cowpea <strong>and</strong> rice bean hadno significant effect on growth <strong>and</strong> survival of P. monodon, although apparent prote<strong>in</strong> digestibility of ricebean was improved. Shrimp are more tolerant than other species of certa<strong>in</strong> anti-nutritional factors <strong>in</strong> theseed coat components (Cruz-Suarez et al., 2001).This study has demonstrated the acceptable nutritional value of whole feed pea as an <strong>in</strong>gredient <strong>in</strong> <strong>shrimp</strong><strong>diets</strong>, s<strong>in</strong>ce this product can replace most commonly used <strong>shrimp</strong> feed <strong>in</strong>gredients, such as soybean meal.Inclusion of feed peas <strong>in</strong> <strong>shrimp</strong> <strong>diets</strong> may there<strong>for</strong>e be a function of diet <strong>for</strong>mulation. An <strong>in</strong>clusion level upto 42% <strong>in</strong> the juvenile <strong>shrimp</strong>, P. monodon, practical diet does not give any adverse effect on growth,survival, <strong>and</strong> body composition of the animal.Table 1Proximate composition (% dry weight) of feed <strong>in</strong>gredients <strong>in</strong>cluded <strong>in</strong> test <strong>diets</strong>*IngredientsMoistureCrudeProte<strong>in</strong>(N x 6.25)Crude fatCrudefiberNFE c<strong>Feed</strong> pea a 11.58 25.24 1.32 3.68 65.96 3.80Soybean meal b 10.78 42.67 1.37 4.03 44.87 7.06Seaweed 9.1 12.13 0.44 5.58 30.42 51.43Wheat flour 14.19 17.21 1.26 0.03 80.76 0.74Squid meal 15.34 78.84 5.19 0.55 5.38 10.04Shrimp meal 13.66 70.25 2.76 2.08 5.35 19.56Peruvian fish meal 9.3 74.64 7.32 1.02 0.76 16.26Shrimp head meal 10.08 47.44 3.00 12.04 9.74 27.78Rice bran 10.12 14.22 18.40 7.20 50.17 10.01*Means of 2 replicate samplesa Whole feed peab Defatted soybean mealcNFE-Nitrogen Free ExtractAshTable 2Percentage composition of experimental <strong>diets</strong> on a dry matter basis (g/100g dry diet)Diet No.Ingredients 1 2 3 4 5 6 7% Soybean replacement 0 20 40 60 80 100Neg.control% Total prote<strong>in</strong> replacement 0 5 10 15 20 25 -<strong>Feed</strong> pea - 8.45 16.90 25.36 33.82 42.30 -Soybean meal 25.00 20.00 15.00 10.00 5.00 - -Wheat flour 17.00 13.00 9.00 7.00 5.00 5.00 17.00Rice bran 8.95 9.5 10.05 8.59 7.13 3.65 22.95Dextr<strong>in</strong> - - - - - - 49.00Common <strong>in</strong>gredients 49.05 49.05 49.05 49.05 49.05 49.05 11.05*Peruvian fish meal, 23; Ascetes, 3; squid meal, 2; <strong>shrimp</strong> head meal, 10; seaweed, 2.5; cod liver oil, 2;soybean oil, 1; soybean lecith<strong>in</strong>, 1; vitam<strong>in</strong> mix, 1.99; vitam<strong>in</strong> C, 0.01; m<strong>in</strong>eral mix,1; dicalciumphosphate,1;carboxymethylcellulose, 0.5; ethoxyqu<strong>in</strong>,0.05.**Vitam<strong>in</strong> mix. _-carotene ,3.0M.I.U.kg -1 ;cholecalceferol, 0.6M.I.U.kg -1 ; thiam<strong>in</strong>e, 3.60g kg -1 ; riboflav<strong>in</strong>, 7.20gkg -1 ; pyridox<strong>in</strong>e, 6.60g kg -1 ; cyanocobalam<strong>in</strong>e, 0.02gm kg -1 ; _-tocopherol, 16.50 gm kg -1 ; menadione, 2.40gm kg -1 ; niac<strong>in</strong>, 14.40gm kg -1 ; pantothenic acid, 4.00 gm kg -1 ; biot<strong>in</strong>, 0.02 gm kg -1 ; folic acid, 1.20gm kg -1 ;<strong>in</strong>ositol, 30.00gm kg -1 ; stay C, 100.00gm kg -1 ; M<strong>in</strong>eral mix: P, 12.0%; Ca, 12.0%; Mg, 1.5%; Fe, 0.15%; Zn0.42%; Cu, 0.21%; K, 7.50%; Co, 0.011%; Mn, 0.160%; Se, 0.001%; Mo, 0.0005%; Al ,0.0025%; I, 0.04%.6
Table 3Composition of reference <strong>and</strong> test <strong>diets</strong> <strong>for</strong> <strong>in</strong> vivo digestibility experiment <strong>in</strong> <strong>shrimp</strong>,P. monodon juveniles (g/100 g feed)<strong>Feed</strong> IngredientReference Test DietDiet (70:30)Peruvian fish meal 23.00 16.10Squid meal 2.00 1.40Ascetes sp. 3.00 2.10Shrimp head meal 10.00 7.00Soybean meal, defatted 25.00 17.50Wheat flour 17.00 11.90Rice bran 8.90 5.50Cod liver oil 2.00 1.40Soy bean oil 1.00 0.70Vitam<strong>in</strong> mix 1.99 1.39Phosphated ascorbic acid* 0.01 0.01M<strong>in</strong>eral mix 1.00 0.70Dicalcium phosphate 1.00 1.00Seaweed 2.50 1.75Celufil 0.50 0.50Erthoxyqu<strong>in</strong> 0.05 0.05Cr 2 O 3 1.00 1.00<strong>Feed</strong> peas - 30.00* Phosphitan C, feed grade, Showa Denko K.K. JapanTable 4Diet No.Proximate composition (%) of experimental <strong>diets</strong>*MoistureCrudeProte<strong>in</strong> Crude Fat CrudeFiberNitrogenFreeExtractAsh1 (0) 8.05 40.02 7.34 5.26 30.73 16.652 (20) 6.44 39.12 7.06 5.80 31.42 16.603 (40) 6.76 39.45 7.69 5.16 31.41 16.294 (60) 7.24 39.08 7.06 5.05 33.18 15.635 (80) 6.47 39.97 7.40 5.29 31.82 15.526 (100) 4.47 39.25 7.71 5.08 32.73 15.237 (neg) 7.01 6.98 7.06 5.15 74.89 5.92*Mean values of 2 replicate samplesTable 5Am<strong>in</strong>o acid composition (per 100 g sample) of soybean meal, feed pea meal <strong>and</strong> experimental<strong>diets</strong> aAm<strong>in</strong>o acidSoybean <strong>Feed</strong> pea % Replacement <strong>in</strong> the dietmeal meal 0 40 80 100Aspartic acid 5.32 3.15 2.29 2.28 2.38 2.69Methion<strong>in</strong>e b 0.63 0.19 0.27 0.29 0.31 0.33Threon<strong>in</strong>e b 1.72 1.06 0.84 0.86 0.83 0.86Ser<strong>in</strong>e 2.46 1.33 0.91 0.94 0.95 0.97Glutamic acid 8.64 4.67 4.06 3.97 3.77 3.71Prol<strong>in</strong>e 2.11 1.1 1.16 1.21 1.26 1.32Glyc<strong>in</strong>e 2.36 1.17 1.29 1.32 1.34 1.32Alan<strong>in</strong>e 2.39 1.15 1.24 1.26 1.28 1.36Val<strong>in</strong>e b 1.41 1.26 1.02 1.04 1.05 1.08Isoleuc<strong>in</strong>e b 1.42 1.22 1.22 1.23 1.23 1.71Leuc<strong>in</strong>e b 4.07 2.2 1.93 1.95 1.96 1.97Tyros<strong>in</strong>e b 1.84 0.9 0.87 0.88 0.89 0.89Phenylalan<strong>in</strong>e b 1.93 1.32 0.96 0.98 1.09 1.05Lys<strong>in</strong>e b 2.73 2 1.84 1.86 1.84 1.89Histid<strong>in</strong>e b 1.05 0.57 0.54 0.54 0.53 0.55Arg<strong>in</strong><strong>in</strong>e b 2.56 1.9 1.45 1.57 1.69 1.68a Values are mean of two replicate samplesb Essential am<strong>in</strong>o acids <strong>for</strong> <strong>shrimp</strong>, Penaeus monodon (Kanazawa <strong>and</strong>Teshima, 1981; NRC, 1993; FDS Manual 1994; Millamena et al., 1996-1999)7
Table 6Response of juvenile P. monodon over a 90-d feed<strong>in</strong>g trial to experimental <strong>diets</strong> conta<strong>in</strong><strong>in</strong>greplacement levels of soybean meal prote<strong>in</strong> with feed pea meal prote<strong>in</strong>*Diet No.Initial mean F<strong>in</strong>al mean Weightwt (g) wt (g) ga<strong>in</strong> a SGR b FCR c PER d Survivale(%)(%)1 (0) 0.02±0.01 1.30±0.08 5598±309 a 4.49±0.06 a 1.23±0.14 a 1.23±0.11 a 832 (20) 0.02±0.01 1.13±0.06 5162±92 a 4.40±0.01 a 1.77±0.04 a 1.44±0.03 a 1003 (40) 0.02±0.01 1.45±0.04 5980±165 a 4.61±0.01 a 1.36±0.12 a 1.43±0.01 a 754 (60) 0.02±0.01 1.37±0.01 5839±65 a 4.54±0.12 a 1.89±0.03 a 1.35±0.02 a 925 (80) 0.02±0.01 1.21±0.18 5187±395 a 4.38±0.15 a 1.39±0.32 a 1.34±0.08 a 1006 (100) 0.02±0.01 1.19±0.07 5223±205 a 4.41±0.04 a 1.39±0.33 a 1.66±0.08 a 1007 (neg) 0.02±0.01 0.10±0.02 364±82 b 1.67±0.20 b 7.02±1.86 b 0.11±0.01 b 75* Means of 5 replicate samples. Values <strong>in</strong> the same row with different superscripts are not significantlydifferent (P
Table 10Percent recovery of experimental <strong>diets</strong> <strong>in</strong> seawater*4 8No. of hours1 2 16 24Diet No.Diet 1 (0) 89 87% Recovery85 83 80Diet 2 (20) 91 85 83 82 80Diet 3 (40) 92 91 90 86 85Diet 4 (60) 94 93 93 92 91Diet 5 (80) 92 91 91 90 90Diet 6 (100) 91 89 87 88 86Diet 7 (neg.) 88 83 80 77 76*Values are means of triplicate samplesAcknowledgementThe authors acknowledge the United States Department of Agriculture <strong>and</strong> the USA Dry Pea <strong>and</strong> LentilCouncil <strong>for</strong> the research <strong>and</strong> travel fund<strong>in</strong>g support; M. Mallare <strong>and</strong> J. Vera Cruz <strong>for</strong> the technicalassistance; F. Jarder <strong>for</strong> the proximate analysis; J. Bangcaya <strong>and</strong> M. Arnaiz <strong>for</strong> the am<strong>in</strong>o acid analysis,<strong>and</strong> M.J. Bernas <strong>for</strong> the Cr 2 O 3 analysis.References:Akiyama, D.M. 1991. Soybean meal utilization by mar<strong>in</strong>e <strong>shrimp</strong>. In: D.M. Akiyama <strong>and</strong> R.K.H. Tan (eds). Proceed<strong>in</strong>gs of theAquaculture <strong>Feed</strong> Process<strong>in</strong>g <strong>and</strong> Nutrition Workshop. Thail<strong>and</strong> <strong>and</strong> Indonesia. September 19-25, 1991. American SoybeanAssociation. S<strong>in</strong>gapore. pp 207-225.Alava, V. R. <strong>and</strong> Lim, C. 1983. The quantitative dietary prote<strong>in</strong> requirement of Penaeus monodon juveniles <strong>in</strong> a controlledenvironment. Aquaculture. 53:229-242Allan, G., Stone, D.A.J., Booth, M.A., 1999. Alternative prote<strong>in</strong> sources: plant prote<strong>in</strong>s. Book of abstracts of the World AquacultureSociety Annual Meet<strong>in</strong>g ’99. April 26-May 2, 1999. Sydney, Australia. WAS, Baton Rouge. I.A. USA, 18.Allan, G. 1998. Prote<strong>in</strong> sources.potential <strong>for</strong> pulses. .International Aquafeed 2:.17-20Allan, G.L. ,Smith, D.M. 1998. Recent Nutrition Research with Australian Penaeid. Reviews <strong>in</strong> Fisheries Science. pp. 113-127.Allan, G., 1997. Potential <strong>for</strong> pulses <strong>in</strong> aquaculture systems. Proceed<strong>in</strong>gs of International Food Legume Research Conference III,Sept. 22-26, 1997, Adelaide, Australia. 13 pp.AOAC (Association of Official Analytical Chemists), 1990. Official methods of analysis, 15 th edition. Association of Official AnalyticalChemists. Arl<strong>in</strong>gton, Virg<strong>in</strong>ia, USA.Bautista, M.N. 1986. The response of Penaeus monodon juverniles to vary<strong>in</strong>g prote<strong>in</strong>/energy ratio <strong>in</strong> test <strong>diets</strong>..Aquaculture.,53:229-242Booth, M.A., Allan, G.L., Stone, D.A.J., 1999. Utilization of four agricultural a<strong>in</strong>gredients by silver perch. Book of abstracts of the WorldAquacultue Society Annual Meet<strong>in</strong>g ’99, April 26-May 2, 1999. Sydney, Australia. WAS, Baton Rouge. I.A. USA, 20.Burel, C., Boujard, T., Boeuf. G., Evrard, J., Peyronnet, C., Kaushik, S.J., 1996. Utilisation de prote<strong>in</strong>s d’orig<strong>in</strong>e vegetale (pois, lup<strong>in</strong>,colza) dans l’alimentation de la truite arc-en-ciel: valeur nutritionelle et effets sur l’axe thyreotrope. In: CRITT Valicentre (Eds),Proceed<strong>in</strong>gs of Colloque Annuel Valicentre, Ardon, France, 28 Nov. 1996, pp 47-58.Carter, J.F., Bol<strong>in</strong>, D.W., Erikson, P., 1960. The evaluation of <strong>for</strong>ages by the Agronomic “difference” method <strong>and</strong> chromogen chromicoxide “<strong>in</strong>dicator” technique. N.D. Agric.Castell, A.G., Guenter, W., Igbasan, F.A. 1996. Nutritive values of peas <strong>for</strong> non-rum<strong>in</strong>ant <strong>diets</strong> Animal <strong>Feed</strong> ScienceTechnology.60:209-227Cho, C.Y., Sl<strong>in</strong>ger, S.J., Bayly, M.S., 1982. Bioenrgetics of salmonid fishes; enrgy <strong>in</strong>take, expenditure <strong>and</strong> productivity. Comp.Biochem. Physiol. 73B, 25-41.Cruz-Ricque, L.E. Guilllaume, J. Cuzon, G. AQUACOP, Taravao ( French Polynesia) 1987. Squid prote<strong>in</strong> prfotien effect on growthof four penaeid <strong>shrimp</strong>. 16 ref. Journal of the world Aquaculture Society. Baton Rouge L.A. Vol 18,No.4. pp209-217Cruz-Suarez, L.E., Ricque-Marie, D., Tapia-Salazar, M., McCallum, I.M., Hickl<strong>in</strong>g, D., 2001. assessment of differently processed feedpea (Pisum sativum) meals <strong>and</strong> canola meal (Brassica sp.) <strong>in</strong> <strong>diets</strong> <strong>for</strong> blue <strong>shrimp</strong> ( Litopenaues stylirostris). Aquaculture 196,87-101.Duncan, D.B., 1955. Multiple-range <strong>and</strong> multiple F-tests. Biometrics, 11, 1-42.Eusebio, P.S., 1991. Effect of dehull<strong>in</strong>g on the nutritive value of some legum<strong>in</strong>ous seeds as prote<strong>in</strong> <strong>for</strong> tiger prawn, Penaeusmonodon juveniles. Aquaculture 99, 297-308.<strong>Feed</strong> Development Section, 1994. <strong>Feed</strong>s <strong>and</strong> feed<strong>in</strong>g of Milkfish, Nile Tilapia, Asian sea bass, <strong>and</strong> Tiger Shrimp. SEAFDECAquaculture Extension Manual No. 21.SEAFDEC Aquaculture Department, Tigbauan, Iloilo, Philipp<strong>in</strong>es. 97 pp.Gomes, L.O.A.<strong>and</strong> Honculada Primavera, J. 1993. Reproductive quality of male Penaeus monodon . Aquaculture. 112:157-164Gomes, E.F., Rema, P., Kaushik, S.J., 1993. Effects of dietary <strong>in</strong>corporation of co-extruded plant prote<strong>in</strong> (rapeseed <strong>and</strong> peas) ongrowth, nutrient utilization <strong>and</strong> muscle fatty acid composition of ra<strong>in</strong>bow trout (Oncorhynchis mykiss). Aquaculture 113, 339-353.Gomes, E.F. Rema, P. Kaushik, S., 1995. Replacement of fish meal by plant prote<strong>in</strong> <strong>in</strong> the diet of ra<strong>in</strong>bow trout (Oncorhynchismykiss). Digestibility <strong>and</strong> growth per<strong>for</strong>mance. Aquaculture 130, 177-186.Gouveia, A., Davies, S.J., 1998. Prelim<strong>in</strong>ary evaluation of pea seed meal <strong>in</strong> <strong>diets</strong> <strong>for</strong> juvenile European sea bass (Dicentrarchuslabrax). Aquaculture 166, 311-320.Gouveia, A., Davies, S.J., 2000. Inclusion of an extruded dehulled pea seed meal <strong>in</strong> <strong>diets</strong> <strong>for</strong> juvenile European sea bass(Dicentrarchus labrax). Aquaculture 182, 183-193.Kanazawa, A., Teshima, S., 1981. Essential am<strong>in</strong>o acids of the prawn. Bullet<strong>in</strong> of Japanese Society of Scientific Fisheries 17, 1375-1379.9
Kaushik, S.J., Vachot, C., Aguirre, P., 1993. Potential utilization of extruded peas. 6 thInternational Symposium on Fish Nutrition,October 4, 1993. Hobart, Australia.Millamena, O.M., Teruel, M.B., Kanazawa, A., Teshima, S., 1999. Quantitative dietary requirements of postlarval tiger <strong>shrimp</strong>,Penaues monodon, <strong>for</strong> histid<strong>in</strong>e, isoleuc<strong>in</strong>e, leuc<strong>in</strong>e, phenylalan<strong>in</strong>e <strong>and</strong> tryptophen. Aquaculture 179, 169-179.Millamena, O.M., Bautista-Teruel, M.N., Reyes, O.S., Kanazawa, A., 1998. Requirements of juvenile mar<strong>in</strong>e <strong>shrimp</strong>, Penauesmonodon (Fabricius) <strong>for</strong> lys<strong>in</strong>e <strong>and</strong> arg<strong>in</strong><strong>in</strong>e. Aquaculture 164, 95-104.Millamena, O.M., Bautista, M.N., Reyes, O.S., Kanazawa, A., 1997. Threon<strong>in</strong>e requirement of juvenile mar<strong>in</strong>e <strong>shrimp</strong> Penaeusmonodon. Aquaculture 151, 9-14.Novoa, N.M.A., Castillo, L.O., 1998. Potentiacialidad del uso de las legum<strong>in</strong>osas como fuent proteica en alimentos para peces. IVSimposium Internacional de Nutricion Acuicola. La Paz, B.C.S. Mexico, Noviembre 15-18, 1998.NRC (National Research Council), 1983. Nutre<strong>in</strong>t requirements of warmwater fishes <strong>and</strong> shellfishes. National Academic Press.Wash<strong>in</strong>gton D.C.Olivera-Novoa, M.A. Olivera-Castillo,L. (Potential use of legumes as prote<strong>in</strong> source <strong>in</strong> foodstuff of fish)Santos, J.M., Gomes, E., 1997. Carbohydrates <strong>in</strong> sea bass (Dicentrarchus labrax) <strong>diets</strong>: effect of the replacement of fish meal bydifferent sources of carbohydrates on growth, body composition <strong>and</strong> digestibility. Proc. 3 rdInt. Symp. On Research <strong>for</strong>Aquaculture: Fundamental <strong>and</strong> Applied Aspects, 24-27 August 1997, Barcelona, Spa<strong>in</strong>.186.Smith, D.M., Tabrett, S.J., Sarac, H.Z. 1999. Fish meal replacement <strong>in</strong> the diet of prawn, Penaeus monodon. Book of Abstracts of theWorld Aquaculture Society Annual Meet<strong>in</strong>g ’99. April 26-May 2, 1999. Sydney, Australia. WAS, Baton Rouge, LA, USA, 707.Spyridakis, P., Metailler, R., Gabaudan, J., Riaza, A., 1989. Studies on nutrient digestibility <strong>in</strong> European sea bass (Dicentrarchuslabrax). I. Methodological aspects concern<strong>in</strong>g feces collection. Aquaculture 77, 61-70.UNIP-ITCF, 1995. In: Carrouee, B., Gatel, F. (eds.) <strong>Peas</strong> utilization <strong>in</strong> animal feed<strong>in</strong>g. Union Nationale Interprofessionelle desPlantes Riches en Prote<strong>in</strong>es, Paris, France, 99 pp.10
<strong>Feed</strong> Pea (Pisum Sativum) As An Alternative Prote<strong>in</strong> SourceIn The Diets Of Nile Tilapia, Oreochromis Niloticus (L.)Corazon B. Santiago, Perla S. Eusebio, <strong>and</strong> Timothy P. WelshAbstractA study was conducted to test feed pea (Pisum sativum) as a prote<strong>in</strong> source <strong>in</strong> Nile <strong>tilapia</strong> <strong>diets</strong> <strong>and</strong> todeterm<strong>in</strong>e its digestibility. In experiment 1, fishmeal-based <strong>diets</strong> were used to allow the maximum level offeed pea as fishmeal prote<strong>in</strong> substitute. Prepared as dry pellets, the test <strong>diets</strong> were isonitrogenous (30%crude prote<strong>in</strong>) <strong>and</strong> approximately isocaloric (14 kJ g -1 ). Fish meal supplied about 28% prote<strong>in</strong> <strong>in</strong> the <strong>diets</strong>.<strong>Feed</strong> peas (12.7-63.3% of the diet) substituted up to 50% of fishmeal prote<strong>in</strong>. The control diet did notconta<strong>in</strong> peas. Manually sexed male Nile <strong>tilapia</strong>, weigh<strong>in</strong>g 32-39 g per fish at stock<strong>in</strong>g, were used. The fishwere reared <strong>in</strong> polyethylene tanks (58x37x27 cm) with aeration. Water was static but was partially changeddaily. Water temperature <strong>for</strong> the whole duration of the experiment ranged from 22-27°C. Fish were allowedto feed to satiation twice daily. The various <strong>in</strong>clusion levels of feed peas did not affect the body weight,feed<strong>in</strong>g activity <strong>and</strong> feed efficiency of the <strong>tilapia</strong>. Weight ga<strong>in</strong> after 9 weeks (range: 21.7+5.6-34.0+9.3 g) didnot differ significantly among treatments (P>0.05). Survival rates were highly variable (40-75%) <strong>and</strong>mortality was not related to treatment. For experiment 2, plant-based <strong>tilapia</strong> <strong>diets</strong> were also designed to beisonitrogenous <strong>and</strong> isocaloric. <strong>Feed</strong> peas <strong>in</strong> the <strong>diets</strong> ranged from 5.9-41.0%. <strong>Feed</strong> peas substituted up to35% of the plant prote<strong>in</strong> (or up to 29% of total dietary prote<strong>in</strong>). Separate feed<strong>in</strong>g trials were conducted ontwo stra<strong>in</strong>s of all-male <strong>tilapia</strong> (CLSU <strong>and</strong> BFAR stra<strong>in</strong>s) us<strong>in</strong>g the same test <strong>diets</strong> <strong>and</strong> larger tanks(90x78x43 cm). Water temperature dur<strong>in</strong>g the two trials ranged from 23-27°C. After 12 weeks of feed<strong>in</strong>g,weight ga<strong>in</strong> did not differ significantly among treatments <strong>in</strong> each <strong>tilapia</strong> stra<strong>in</strong> (45.5+7.8-57.4+12.4 g <strong>for</strong> theCLSU stra<strong>in</strong>; 52.5+4.4-74.1+9.2 g <strong>for</strong> the BFAR stra<strong>in</strong>). FCR <strong>and</strong> PER were not significantly differentamong treatments. Survival was 100% <strong>in</strong> all tanks <strong>in</strong> both trials. Determ<strong>in</strong>ed with the use of chromic oxideas a marker, the apparent prote<strong>in</strong> digestibility of feed pea as <strong>in</strong>gredient was 87.2+2.0%. Diets <strong>in</strong>experiments 1 <strong>and</strong> 2 that conta<strong>in</strong>ed peas had more than 90% prote<strong>in</strong> digestibility. Overall, feed pea is analternative prote<strong>in</strong> source that can be used rout<strong>in</strong>ely <strong>in</strong> the <strong>diets</strong> of Nile <strong>tilapia</strong>.Key words: Tilapia nutrition; <strong>Peas</strong>; Alternative prote<strong>in</strong> source; Fishmeal substitute; DigestibilityIntroductionFish meal is a major source of highly digestible nutrients <strong>and</strong> is a palatable <strong>in</strong>gredient <strong>in</strong> fish <strong>diets</strong>. It can bethe cheapest prote<strong>in</strong> source, at times, based on the price per kilogram of prote<strong>in</strong> (Hardy, 2000). However,the dem<strong>and</strong> <strong>for</strong> fish meal by various food production sectors (e.g., poultry, livestock <strong>and</strong> aquaculture) is<strong>in</strong>creas<strong>in</strong>g while the supply is stagnat<strong>in</strong>g or even decreas<strong>in</strong>g (Starkey, 1994). This causes the ris<strong>in</strong>g cost offish meal. In view of the need to m<strong>in</strong>imize dependence of aquaculture feeds on fish meal, the search <strong>for</strong>alternative prote<strong>in</strong> sources has been an <strong>in</strong>ternational concern.The most commonly used plant prote<strong>in</strong> sources that could partially substitute fish meal <strong>in</strong> fish <strong>diets</strong> are oilseed meals, some leaf meals, <strong>and</strong> cereals <strong>and</strong> their by-products (Gerpacio <strong>and</strong> Castillo, 1979; Zamora <strong>and</strong>Baguio, 1984; Tacon, 1987; NRC, 1993; Hertrampf <strong>and</strong> Piedad-Pascual, 2000). Various feedstuffs,<strong>in</strong>clud<strong>in</strong>g gra<strong>in</strong> legumes, have been tested as fishmeal substitutes <strong>in</strong> farmed <strong>tilapia</strong> (El-Sayed, 1999). Thegra<strong>in</strong> legumes are also called pulses, which refer to edible seeds of plants with pods belong<strong>in</strong>g to the familyLegum<strong>in</strong>ocae (Hertrampf <strong>and</strong> Piedad-Pascual, 2000). Lup<strong>in</strong>s, beans, black <strong>and</strong> green gram, (feed or field)pea <strong>and</strong> several other peas (cow pea, chick pea) belong to this category. Although they are used <strong>in</strong> poultry,sw<strong>in</strong>e, <strong>and</strong> cattle feeds, peas are not among the <strong>in</strong>gredients ord<strong>in</strong>arily added <strong>in</strong> fish <strong>diets</strong>. However, thedigestibility of several species of legume seeds has been studied <strong>in</strong> young <strong>tilapia</strong> (Oreochromis niloticus)(De Silva et al. 1988), juvenile ra<strong>in</strong>bow trout (Oncorhynchus mykiss) (Gomes et al., 1995; Pfeffer et al.,1995; Burel et al., 2000), turbot (Psetta maxima) (Burel et al., 2000), <strong>and</strong> Australian silver perch (Bidyanusbidyanus) (Allan et al., 2000). <strong>Feed</strong> pea (Pisum sativum), <strong>in</strong> particular, has been tested to replace fish meal<strong>in</strong> the <strong>diets</strong> of ra<strong>in</strong>bow trout (Gouveia et al., 1993), European sea bass (Dicentrarchus labrax) (Gouveia <strong>and</strong>Davies, 1998), <strong>and</strong> Atlantic salmon (Salmo salar) (Carter <strong>and</strong> Hauler, 2000). Because of its high potentialas a fish feed <strong>in</strong>gredient, feed pea has to be tested <strong>in</strong> other important food fish, <strong>in</strong>clud<strong>in</strong>g <strong>tilapia</strong>. Thus, thepresent study was conducted to determ<strong>in</strong>e the effect of levels of dietary feed peas on the growth <strong>and</strong>survival of juvenile Nile <strong>tilapia</strong> <strong>and</strong> on feed efficiency. The digestibility of feed peas as an <strong>in</strong>gredient <strong>and</strong> of<strong>diets</strong> conta<strong>in</strong><strong>in</strong>g feed peas was also determ<strong>in</strong>ed.Materials <strong>and</strong> Methods1. Experimental <strong>diets</strong>Two sets of <strong>diets</strong> <strong>in</strong> dry pellet <strong>for</strong>m were tested <strong>in</strong> two separate experiments. For experiment 1, six fishmealbased<strong>diets</strong> (Table 1) were designed to conta<strong>in</strong> 30% crude prote<strong>in</strong> <strong>and</strong> digestible energy of about 14 kJ g -1 .The computed am<strong>in</strong>o acids <strong>in</strong> the <strong>diets</strong>, based on the am<strong>in</strong>o acid contents of the <strong>in</strong>gredients, met or11
exceeded am<strong>in</strong>o acid requirements of young Nile <strong>tilapia</strong> (Santiago <strong>and</strong> Lovell, 1988). A fishmeal-based dietallowed the <strong>in</strong>corporation of high levels of feed peas <strong>in</strong> the test <strong>diets</strong>. The feed peas (12.7-63.3% of thediet) substituted 10-50% of fishmeal prote<strong>in</strong>, or about 9-48% of total dietary prote<strong>in</strong>. The diet without feedpeas served as a control. Because of the high nitrogen-free extract (NFE) <strong>in</strong> feed peas, the <strong>diets</strong> had aboutthe same energy content, but the supplemental starch <strong>and</strong> oil decreased as the feed pea <strong>in</strong> the diet<strong>in</strong>creased. Based on the actual analysis of prote<strong>in</strong>, lipid, <strong>and</strong> NFE, however, the digestible energy of thediet with the highest feed pea (63.3%) was slightly lower (Table 1).In experiment 2, eight plant-based <strong>diets</strong> conta<strong>in</strong><strong>in</strong>g only 8% fish meal were used (Table 2). The <strong>diets</strong> werealso designed to be isonitrogenous <strong>and</strong> isocaloric as <strong>in</strong> experiment 1. Dietary feed peas (5.9-41.0%)substituted 5-35% of plant prote<strong>in</strong> or about 4-30% of total dietary prote<strong>in</strong>. Substitution of prote<strong>in</strong> fromsoybean meal, copra (coconut) meal <strong>and</strong> rice bran by the feed peas was ma<strong>in</strong>ta<strong>in</strong>ed at a ratio of 2:1:1.The fish meal used <strong>in</strong> experiments 1 <strong>and</strong> 2 was obta<strong>in</strong>ed <strong>in</strong> two batches. The commercial fish meal,soybean meal <strong>and</strong> copra meal were ground <strong>and</strong> sieved us<strong>in</strong>g a No. 45 st<strong>and</strong>ard test<strong>in</strong>g sieve be<strong>for</strong>e use.The dry feed peas were ground whole, <strong>in</strong>clud<strong>in</strong>g hulls, <strong>in</strong>to powder <strong>for</strong>m. Analyses showed that the peasconta<strong>in</strong>ed 22.32% crude prote<strong>in</strong>, 1.17% crude fat, 3.36% ash, 3.25% crude fiber, <strong>and</strong> 58.32% nitrogen-freeextract. These values are close to those reported <strong>for</strong> feed peas (Muehlbauer <strong>and</strong> Tullu, 1997; <strong>Pulse</strong>Canada, 1999a; Racz, 1999).2. Experimental fish <strong>and</strong> tanksThree stra<strong>in</strong>s of <strong>tilapia</strong> juveniles were obta<strong>in</strong>ed <strong>for</strong> the study. The young fish were reared <strong>in</strong> the laboratory<strong>for</strong> 6-8 weeks be<strong>for</strong>e use. Dur<strong>in</strong>g this time, the fish were fed dry pellets without feed peas. Each batch offish was sorted three times dur<strong>in</strong>g acclimatization to ensure uni<strong>for</strong>mity <strong>in</strong> size at stock<strong>in</strong>g.The fish <strong>in</strong> experiment 1 were manually sexed male Nile <strong>tilapia</strong> juveniles (BFS stra<strong>in</strong>) produced <strong>in</strong> theStation. Each fish weighed 32-39 g at stock<strong>in</strong>g. Twenty-four polyethylene tanks measur<strong>in</strong>g 58x37x27 cmwere filled with 40 l of water <strong>and</strong> r<strong>and</strong>omly stocked with five fish each.In experiment 2, two all-male <strong>tilapia</strong> stra<strong>in</strong>s were used <strong>in</strong> separate feed<strong>in</strong>g trials. The CLSU stra<strong>in</strong><strong>in</strong>dividually weighed 24-31 g at stock<strong>in</strong>g; the BFAR stra<strong>in</strong>, 25-37 g each. Five <strong>tilapia</strong> juveniles (CLSU stra<strong>in</strong>)were stocked <strong>in</strong> each of 24 polyethylene tanks (90x78x43 cm) filled with 180 l of water. In the other feed<strong>in</strong>gtrial, 16 tanks were r<strong>and</strong>omly stocked with six juveniles (BFAR stra<strong>in</strong>) per tank.3. <strong>Feed</strong><strong>in</strong>g treatments, sampl<strong>in</strong>g <strong>and</strong> water managementEach of the feed<strong>in</strong>g experiments was conducted <strong>in</strong> a completely r<strong>and</strong>omized design. In experiment 1, therewere six dietary treatments with four replicates each. The treatments represented levels of fishmeal prote<strong>in</strong>substitution by the feed peas. In each of the two feed<strong>in</strong>g trials <strong>in</strong> experiment 2, there were eight treatmentsor levels of plant prote<strong>in</strong> substitution by feed peas. Each of the dietary treatments had three replicates <strong>for</strong>the CLSU stra<strong>in</strong> or two replicates <strong>for</strong> the BFAR stra<strong>in</strong>.<strong>Feed</strong><strong>in</strong>g was done twice daily at 0900 <strong>and</strong> 1400h <strong>for</strong> 9 weeks <strong>in</strong> experiment 1 <strong>and</strong> <strong>for</strong> 12 weeks <strong>in</strong>experiment 2. The amount of feed given to the fish at each feed<strong>in</strong>g exceeded satiation level to ensure thatthe feed was not limit<strong>in</strong>g. Excess feed was collected 1-1.5 hours after each feed<strong>in</strong>g, dried <strong>in</strong> an oven,weighed <strong>and</strong> used <strong>in</strong> the calculation of feed consumption by difference. The amount of feed consumed wasback calculated to be equivalent to about 5% of fish biomass.In all feed<strong>in</strong>g trials, body weight of fish was measured weekly <strong>for</strong> the first 4 weeks <strong>and</strong> biweekly <strong>in</strong> thesucceed<strong>in</strong>g weeks except <strong>in</strong> experiment 1 when the f<strong>in</strong>al measurements were done after 9 weeks. Totallength of fish was measured at stock<strong>in</strong>g <strong>and</strong> dur<strong>in</strong>g harvest. <strong>Feed</strong> conversion ratio (FCR, the amount offeed consumed divided by weight ga<strong>in</strong> of fish), prote<strong>in</strong> efficiency ratio (PER, weight ga<strong>in</strong> divided by weightof prote<strong>in</strong> consumed), <strong>and</strong> survival rate were determ<strong>in</strong>ed <strong>for</strong> each tank.Deep well water stored <strong>in</strong> a reservoir was used <strong>for</strong> the growth trials. Water <strong>in</strong> the rear<strong>in</strong>g tanks was staticbut was partially changed (1/4-1/3 of the volume) daily. All rear<strong>in</strong>g tanks were provided with aeration.Temperature was determ<strong>in</strong>ed daily <strong>in</strong> the morn<strong>in</strong>g <strong>and</strong> afternoon. Dissolved oxygen was monitored everymorn<strong>in</strong>g be<strong>for</strong>e water was partially changed with the use of YSI DO meter (Model 55/25 FT). The pH wasmeasured with a pH meter (Beckman, Model PHI 50). Total ammonia nitrogen (NH 3 -N) was determ<strong>in</strong>edweekly be<strong>for</strong>e chang<strong>in</strong>g of water <strong>in</strong> the morn<strong>in</strong>g by the Nessler method with the use of a Hach kit(DREL/2010).12
Water temperature <strong>for</strong> the whole duration of experiment 1 ranged from 22-27°C, be<strong>in</strong>g at the lower range<strong>for</strong> most of the days. Dissolved oxygen <strong>in</strong> the morn<strong>in</strong>g be<strong>for</strong>e partial water change ranged from 3.5-6.2 mg l -1 . The total NH 3 -N ranged from 0.63-2.39 mg l -1 <strong>and</strong> pH, 7.7-7.9. In experiment 2, water temperature <strong>for</strong> thefeed<strong>in</strong>g trial with the CLSU stra<strong>in</strong> of <strong>tilapia</strong> was 23-27°C; pH, 7.4-8.1; total NH 3 -N, 0.21-2.42 mg l -1 . For thefeed<strong>in</strong>g trial us<strong>in</strong>g the BFAR stra<strong>in</strong>, water temperature also ranged from 23-27°C; pH, 7.6-8.7; <strong>and</strong> totalNH 3 -N, 0.28-1.74 mg l -1 . For each sampl<strong>in</strong>g time, water quality was similar among treatments.4. Biochemical analysesSamples of feed <strong>in</strong>gredients, experimental <strong>diets</strong>, <strong>and</strong> some fish at stock<strong>in</strong>g <strong>and</strong> dur<strong>in</strong>g harvest wereobta<strong>in</strong>ed <strong>for</strong> proximate analysis by st<strong>and</strong>ard methods (AOAC, 1990). At the end of the each feed<strong>in</strong>g trial<strong>and</strong> after a 24-hour fast<strong>in</strong>g, fish samples were obta<strong>in</strong>ed <strong>and</strong> dissected. The appearance of the fish <strong>and</strong> the<strong>in</strong>ternal organs were exam<strong>in</strong>ed visually <strong>for</strong> any abnormality. Other samples of fish that received the <strong>diets</strong>whose digestibility was determ<strong>in</strong>ed were subjected to cold shock, weighed <strong>and</strong> kept frozen until they wereprocessed further. The fish samples were then autoclaved, homogenized, dried <strong>in</strong> a vacuum oven at 60°C,<strong>and</strong> ground <strong>for</strong> analysis.5. Digestibility measurements5.1. Digestibility of feed peas as <strong>in</strong>gredientThe apparent dry matter digestibility (ADMD) <strong>and</strong> crude prote<strong>in</strong> digestibility (APD) of feed peas as<strong>in</strong>gredient were measured <strong>in</strong>directly us<strong>in</strong>g chromic oxide (Cr 2 O 3 ) as external <strong>in</strong>dicator (Cho et al., 1982;Spyridakis et al., 1989). The reference diet <strong>for</strong> the measurement of digestibility of feed peas was the sameas the control diet used <strong>in</strong> experiment 1 (Table 1), except that 1% Cr 2 O 3 <strong>and</strong> 1% carboxymethylcellulose(CMC, b<strong>in</strong>der) replaced some amounts of the filler. The test diet conta<strong>in</strong>ed 70% reference diet <strong>and</strong> 30%feed peas, follow<strong>in</strong>g the method of Cho et al. (1982). It also conta<strong>in</strong>ed 1% Cr 2 O 3 <strong>and</strong> CMC.Each of the <strong>diets</strong> was fed to <strong>tilapia</strong> <strong>in</strong> three replicate tanks stocked with 10 juvenile <strong>tilapia</strong> (37.96 ± 0.42 gfish -1 ). The <strong>tilapia</strong> came from the same source as those used <strong>in</strong> experiment 1. The fish were fed at 5-8% offish biomass daily with two feed<strong>in</strong>gs a day (0830 <strong>and</strong> 1430h). Water temperature ranged from 24-26°C.A modified Guelph system (Cho et al., 1982; Eusebio <strong>and</strong> Coloso, 2000) was used <strong>in</strong> the digestibility trials.Each conical fiberglass tank (250 L capacity) was provided with filtered, flow-through water. Flow rate of thewater was 780-850 ml m<strong>in</strong> -1 . Water passed through a fecal decantation column <strong>in</strong>to an attached clearplastic bottle where the fecal materials settled until collected. The tanks <strong>and</strong> the fecal collection apparatuswere cleaned twice daily be<strong>for</strong>e feed<strong>in</strong>g <strong>in</strong> the morn<strong>in</strong>g <strong>and</strong> 2 hours after feed<strong>in</strong>g <strong>in</strong> the afternoon.Collection of feces released from 1730-0730 h started after a 5-day <strong>in</strong>itial feed<strong>in</strong>g <strong>and</strong> lasted <strong>for</strong> 25consecutive days. Fecal material were carefully r<strong>in</strong>sed with distilled water <strong>and</strong> stored <strong>in</strong> a freezer to retardbacterial decomposition. Samples were pooled <strong>and</strong> freeze-dried. Dry fecal samples <strong>and</strong> test <strong>diets</strong> wereanalyzed <strong>for</strong> Cr 2 O 3 (Carter et al., 1960) <strong>and</strong> crude prote<strong>in</strong> (AOAC, 1990).5.2. Digestibility of <strong>diets</strong> conta<strong>in</strong><strong>in</strong>g feed peasThe digestibility of <strong>diets</strong> with 0, 10, 30 <strong>and</strong> 50% replacement of fishmeal prote<strong>in</strong> (Table 1), as well as <strong>diets</strong>with 0, 15, 25 <strong>and</strong> 35% replacement of plant prote<strong>in</strong> by feed peas (Table 2), was determ<strong>in</strong>ed <strong>in</strong> <strong>tilapia</strong> <strong>in</strong>separate trials. Celufil (filler), starch, <strong>and</strong> rice bran were adjusted to accommodate 1% Cr 2 O 3 <strong>and</strong> the b<strong>in</strong>der<strong>in</strong> the <strong>diets</strong>. Each feed<strong>in</strong>g period, <strong>in</strong>clud<strong>in</strong>g the 5-day adjustment with the marked <strong>diets</strong>, lasted <strong>for</strong> 30 days.Fish used <strong>in</strong> determ<strong>in</strong><strong>in</strong>g the digestibility of the two sets of <strong>diets</strong> conta<strong>in</strong><strong>in</strong>g feed peas were bigger <strong>tilapia</strong>juveniles (CLSU stra<strong>in</strong>, 82.7+9.3 g) that came from the same batch used <strong>in</strong> the growth trial (experiment 2).The digestibility tank system, <strong>and</strong> the procedure <strong>for</strong> collection of feces <strong>and</strong> process<strong>in</strong>g of samples were thesame as <strong>in</strong> the previous digestibility trial <strong>for</strong> peas as an <strong>in</strong>gredient. The apparent digestibility <strong>for</strong> dry matter<strong>and</strong> crude prote<strong>in</strong> <strong>in</strong> the <strong>diets</strong> was likewise computed us<strong>in</strong>g the <strong>for</strong>mula of Spyridakis et al. (1989).6. Statistical analysisData on body weight (weekly <strong>and</strong> biweekly), weight ga<strong>in</strong>, total length, survival, FCR, PER, carcass prote<strong>in</strong><strong>and</strong> ash, <strong>and</strong> digestibility coefficients were analyzed by ANOVA us<strong>in</strong>g the General L<strong>in</strong>ear ModelsProcedure by SAS <strong>for</strong> PC (SAS Institute Inc., 1991). When significant difference among treatments wasdetected at P
However, weight ga<strong>in</strong> was highest at the 10% fishmeal prote<strong>in</strong> substitution, or 12.7% feed pea <strong>in</strong> the diet.The FCR values <strong>for</strong> the duration of the experiment, as well as the PER, did not differ significantly (Table 3).Survival rates of <strong>tilapia</strong> <strong>in</strong> replicate tanks with<strong>in</strong> treatment were highly variable; mean survival rates did notdiffer significantly among treatments (P>0.05). Mortality was caused by the aggressive behavior of the male<strong>tilapia</strong> <strong>in</strong> the small rear<strong>in</strong>g tanks <strong>and</strong> was not treatment-related.In experiment 2, body weight of the CLSU stra<strong>in</strong> of <strong>tilapia</strong> at weekly or biweekly <strong>in</strong>tervals did not differsignificantly among treatments (P>0.05). The f<strong>in</strong>al weight ga<strong>in</strong> <strong>and</strong> length <strong>in</strong>crement, as well as the FCR<strong>and</strong> PER, did not differ significantly (Table 4). Survival rate was 100% <strong>in</strong> all tanks. Likewise, the BFARstra<strong>in</strong> of <strong>tilapia</strong> <strong>in</strong> experiment 2 did not show significant differences <strong>in</strong> body weight dur<strong>in</strong>g each sampl<strong>in</strong>g, orweight ga<strong>in</strong> <strong>and</strong> total length <strong>in</strong>crement over a 12-week period (Table 5). Moreover, the FCR <strong>and</strong> PER didnot differ significantly among treatments. Survival rate <strong>in</strong> all tanks was also 100%.Carcass prote<strong>in</strong> of fish from four dietary treatments <strong>in</strong> experiment 1 showed no significant differences(P>0.05) (Table 6). However, body ash <strong>in</strong>creased significantly <strong>in</strong> fish fed <strong>diets</strong> with 37.5 <strong>and</strong> 63.3% feedpeas (or 30 <strong>and</strong> 50% fishmeal prote<strong>in</strong> substitution). The fish fed with 10% fishmeal prote<strong>in</strong> substitution(12% feed peas) had the highest carcass lipid. Fish <strong>in</strong> all other treatments had similar carcass lipid. Inexperiment 2, carcass prote<strong>in</strong> as well as body ash differed significantly among treatments (Table 6), but notrend could be established <strong>in</strong> relation to fish growth <strong>and</strong> digestibility of the <strong>diets</strong>. However, as the dietaryfeed peas <strong>in</strong> the plant-based <strong>diets</strong> <strong>in</strong>creased <strong>and</strong> the dietary lipid decreased (Table 2), carcass lipiddecreased (Table 6).There was no visible adverse effect of dietary peas on feed<strong>in</strong>g behavior <strong>and</strong> the appearance of the fish <strong>and</strong>the <strong>in</strong>ternal organs. The three <strong>tilapia</strong> stra<strong>in</strong>s used <strong>in</strong> the feed<strong>in</strong>g trials readily accepted the <strong>diets</strong> conta<strong>in</strong><strong>in</strong>gfeed peas <strong>and</strong> consumed almost the same amount of feed <strong>in</strong> relation to their body weight (about 5% of fishbiomass). Visual exam<strong>in</strong>ation at the end of each trial revealed that the <strong>tilapia</strong> were generally lean. Fish liverdid not appear fatty <strong>and</strong> only few adipose tissues were visible <strong>in</strong> the body cavity.The apparent dry matter digestibility (ADMD) of feed peas as <strong>in</strong>gredient was 69.3+1.8% <strong>and</strong> prote<strong>in</strong>digestibility (APD) was 87.2+2.0%. The ADMD coefficients <strong>for</strong> some fishmeal-based <strong>diets</strong> used <strong>in</strong>experiment 1 significantly <strong>in</strong>creased with <strong>in</strong>creas<strong>in</strong>g level of feed peas (Table 7). The APD <strong>for</strong> the <strong>diets</strong>tested were all high, exceed<strong>in</strong>g 90%. Although the absolute differences were small <strong>for</strong> practical purposes,the APD of the control diet (without pea) was significantly higher than that of diet with 12.7% feed pea, butdid not differ significantly from that of <strong>diets</strong> with 37.5% or 63.3% feed pea (Table 7). The plant-based <strong>diets</strong><strong>in</strong> which digestibility coefficients were determ<strong>in</strong>ed also showed a significant <strong>in</strong>crease <strong>in</strong> ADMD when feedpea <strong>in</strong> the diet was 29.3% or more (Table 7). The APD coefficients of the plant-based <strong>diets</strong> were high(>90%), as <strong>in</strong> the fishmeal-based <strong>diets</strong> <strong>in</strong> experiment 1, <strong>and</strong> did not differ significantly among treatments.DiscussionThe three feed<strong>in</strong>g trials consistently demonstrated that feed peas could be <strong>in</strong>corporated <strong>in</strong> <strong>tilapia</strong> <strong>diets</strong> at awide range of levels to replace fishmeal prote<strong>in</strong> or other plant prote<strong>in</strong>s without affect<strong>in</strong>g fish growth, feedefficiency, <strong>and</strong> survival. The FCR values obta<strong>in</strong>ed <strong>for</strong> all <strong>diets</strong> <strong>in</strong> the feed<strong>in</strong>g trials were higher than theexpected values (about 2) <strong>and</strong>, consequently, the PER values were fairly low. These could be attributed tothe water temperature dur<strong>in</strong>g the experiments, be<strong>in</strong>g lower than the optimum (28-31°C) <strong>for</strong> the <strong>tilapia</strong>(Luquet, 1991), <strong>and</strong> to some losses <strong>in</strong> the collection of the uneaten feed. Because the <strong>in</strong>door culture systemhad static water, the dissolved oxygen be<strong>for</strong>e partial water change <strong>in</strong> the morn<strong>in</strong>g sometimes dipped closeto the m<strong>in</strong>imum level (3 mg l -1 ) <strong>for</strong> <strong>tilapia</strong> (Luquet, 1991). Nevertheless, the <strong>tilapia</strong> <strong>in</strong> two of three feed<strong>in</strong>gtrials had 100% survival. The growth response of <strong>tilapia</strong> to <strong>diets</strong> with peas <strong>in</strong> the different feed<strong>in</strong>g trials wasnot affected by the dietary levels of feed pea.In general, carcass prote<strong>in</strong>, lipid <strong>and</strong> ash did not <strong>in</strong>dicate any adverse effect of <strong>in</strong>creas<strong>in</strong>g dietary feed pea.Although growth did not differ significantly among treatments, significant differences <strong>in</strong> prote<strong>in</strong> wasobserved <strong>in</strong> fish fed plant-based <strong>diets</strong>, but not <strong>in</strong> fish fed the fishmeal-based <strong>diets</strong>. Moreover, carcass lipidof the <strong>tilapia</strong> (CLSU stra<strong>in</strong>) fed plant-based <strong>diets</strong> decreased with the <strong>in</strong>crease of feed peas <strong>in</strong> the diet. In acompanion study, feed<strong>in</strong>g of <strong>milkfish</strong> (Chanos chanos) with vary<strong>in</strong>g dietary feed peas caused significantdifferences <strong>in</strong> growth but it did not <strong>in</strong>fluence carcass composition (I. Borlongan, personal communication2002). Similarly, two levels of peas <strong>in</strong> the <strong>diets</strong> (20 <strong>and</strong> 40%) did not affect carcass prote<strong>in</strong> <strong>and</strong> ash <strong>in</strong>European sea bass but lipid was significantly lower <strong>in</strong> fish given diet with 40% pea (Gouveia <strong>and</strong> Davies,1988).Although high amounts of feed peas could be used <strong>in</strong> <strong>tilapia</strong> <strong>diets</strong>, the actual amount that would be<strong>in</strong>corporated <strong>in</strong> practical applications will be <strong>in</strong>fluenced largely by the cost of the peas <strong>in</strong> relation to the cost14
of compet<strong>in</strong>g prote<strong>in</strong> sources. The digestibility of the peas is also considered <strong>in</strong> evaluat<strong>in</strong>g its potential as aprote<strong>in</strong> source. In the present study, the digestibility coefficients <strong>for</strong> feed peas <strong>in</strong> Nile <strong>tilapia</strong> are comparableto those reported <strong>for</strong> other freshwater fishes (Table 8). The highest digestibility coefficients <strong>for</strong> P. sativumwere obta<strong>in</strong>ed <strong>in</strong> turbot, a mar<strong>in</strong>e species. In a companion study, the crude prote<strong>in</strong> digestibility of feed peas<strong>in</strong> <strong>milkfish</strong> was also higher (92%) than <strong>in</strong> <strong>tilapia</strong>; however, dry matter digestibility was lower (I. Borlongan,personal communication 2002). Allan et al. (2000) determ<strong>in</strong>ed the digestibility of peas <strong>and</strong> other <strong>in</strong>gredients<strong>in</strong> silver perch as well as that of am<strong>in</strong>o acids <strong>in</strong> the <strong>in</strong>gredients. The prote<strong>in</strong> digestibility of the <strong>in</strong>gredientswas a reflection of the availability of am<strong>in</strong>o acids <strong>in</strong> silver perch. A few exceptions were the animal prote<strong>in</strong>sources <strong>and</strong> some oilseed meals whose prote<strong>in</strong>s may have been damaged dur<strong>in</strong>g process<strong>in</strong>g (Allan et al.,2000). Moreover, the apparent energy digestibility of peas as <strong>in</strong>gredient <strong>in</strong> some fish species (Table 8)could also reflect carbohydrate digestibility <strong>in</strong> the fish. This is because peas conta<strong>in</strong> much higher amountsof carbohydrate than lipid (Muehlbauer <strong>and</strong> Tullu, 1997; <strong>Pulse</strong> Canada, 1999a; Racz, 1999) <strong>and</strong> the prote<strong>in</strong>digestibility coefficients <strong>for</strong> peas <strong>in</strong> different fish species (Table 8) are close. Moreover, the apparent energydigestibility coefficients reported <strong>for</strong> peas as <strong>in</strong>gredient are near the values <strong>for</strong> the carbohydrate digestibilityof soybean meal (54%), wheat gra<strong>in</strong> (61%), <strong>and</strong> uncooked corn starch (55-61%) <strong>in</strong> blue <strong>tilapia</strong> (0. aureus)(NRC, 1993).In<strong>for</strong>mation on the use of P. sativum <strong>in</strong> fish <strong>diets</strong> is limited. Gomes et al. (1995) used feed pea at very a lowlevel (4% of the diet) together with other plant <strong>in</strong>gredients (faba bean meal, maize gluten, full-fat soybean,<strong>and</strong> a co-extruded mixture of peas <strong>and</strong> rapeseed) to partially substitute fish meal <strong>in</strong> ra<strong>in</strong>bow trout diet. In astudy by Gouveia et al. (1993), pea seed meal was used at 38.2% of the diet (20% of the dietary prote<strong>in</strong>) ofra<strong>in</strong>bow trout with or without cook<strong>in</strong>g/expansion (145 º C, 25 kg per cm 2 ). The thermal treatment slightlyimproved the nutritional value of the <strong>diets</strong> conta<strong>in</strong><strong>in</strong>g the peas. In another study, there was a significantdecrease <strong>in</strong> the prote<strong>in</strong> digestibility of the diet when the pea (P. sativum) <strong>in</strong> the diet of ra<strong>in</strong>bow trout<strong>in</strong>creased from 25–50% (Pfeffer et al., 1995). Furthermore, the digestibility of the <strong>diets</strong> conta<strong>in</strong><strong>in</strong>g either 25or 50% peas <strong>in</strong>creased significantly when the peas were autoclaved. APD coefficients of ra<strong>in</strong>bow trout <strong>diets</strong>conta<strong>in</strong><strong>in</strong>g 25% feed peas <strong>in</strong>creased from 86-91% when the peas had pre-treatment. For <strong>diets</strong> conta<strong>in</strong><strong>in</strong>g50% peas, APD <strong>in</strong>creased from 83-86% when the peas were autoclaved (Pfeffer et al., 1995). In asubsequent study by Gouveia et al. (1998) on European sea bass (D. labrax), fishmeal-based <strong>diets</strong>conta<strong>in</strong><strong>in</strong>g 20 <strong>and</strong> 40% pea had APD coefficients of 88-89%. In the present study, the APD coefficients ofthe <strong>tilapia</strong> <strong>diets</strong> conta<strong>in</strong><strong>in</strong>g feed pea were high (90.5-92%) <strong>and</strong> were practically not affected by the dietarylevel of peas. This suggests that feed pea <strong>and</strong> the <strong>in</strong>gredients it replaced had similar prote<strong>in</strong> digestibility.The whole peas with hulls were simply dried <strong>and</strong> ground. The digestibility of dehulled peas would mostlikely be higher <strong>in</strong> <strong>tilapia</strong> s<strong>in</strong>ce dehull<strong>in</strong>g removes most of the fiber of <strong>in</strong>gredients (Eusebio, 1991). Whencompared to other feedstuffs tested <strong>in</strong> <strong>tilapia</strong>, feed pea has APD coefficient that is comparable to that of fishmeal (Hanley, 1987; NRC, 1993; Jauncey, 1998). However, it is slightly lower than the prote<strong>in</strong> digestibilityvalues reported <strong>for</strong> soybean meal (91-94%) <strong>in</strong> <strong>tilapia</strong> species (Hanley, 1987; Lim, 1987; Luquet 1991; NRC,1993).The prote<strong>in</strong> content of feed peas is close to that of copra (coconut) meal, some cereal gra<strong>in</strong> by-products,brewers' gra<strong>in</strong>s, <strong>and</strong> leaf meals (Gerpacio <strong>and</strong> Castillo, 1979; Hanley, 1987; Tacon, 1987; NRC, 1993;Hertrampf <strong>and</strong> Piedad-Pascual, 2000). The relatively low prote<strong>in</strong> content of feed peas compared to fishmeal would limit the amount that could be <strong>in</strong>corporated <strong>in</strong> the <strong>diets</strong> of fish that require high prote<strong>in</strong> levels.However, feed peas could be used as one of the <strong>in</strong>gredients that would collectively replace fish meal <strong>in</strong> apractical diet. <strong>Feed</strong> peas could also replace other plant prote<strong>in</strong> sources, as shown <strong>in</strong> the present study,especially when its cost is competitive. <strong>Feed</strong> peas conta<strong>in</strong> high levels of lys<strong>in</strong>e (<strong>Pulse</strong> Canada, 1999a;Racz, 1999) which could complement the am<strong>in</strong>o acids of other fishmeal substitutes that are deficient <strong>in</strong>lys<strong>in</strong>e (e.g. canola meal <strong>and</strong> gluten meals). However, as <strong>in</strong> soybean meal <strong>and</strong> other legume seeds, thesulfur am<strong>in</strong>o acids (methion<strong>in</strong>e <strong>and</strong> cyst<strong>in</strong>e) are low <strong>and</strong> could be the first limit<strong>in</strong>g am<strong>in</strong>o acids when highamounts of plant prote<strong>in</strong> sources are used. For fish requir<strong>in</strong>g high dietary prote<strong>in</strong>, pea prote<strong>in</strong> concentrate(49% crude prote<strong>in</strong>) has been explored as a possible partial replacement of fish meal (Carter <strong>and</strong> Hauler,2000). Up to 27% pea prote<strong>in</strong> concentrate <strong>in</strong> the extruded feed did not affect growth of salmon parr. Cowpea (Vigna unguiculata) prote<strong>in</strong> concentrate was also tested <strong>in</strong> Nile <strong>tilapia</strong> fry <strong>and</strong> up to 40% <strong>in</strong>clusion level<strong>in</strong> the diet gave acceptable results (Olvera-Novoa et al., 1997).One important concern <strong>in</strong> the use of pulses as <strong>in</strong>gredients <strong>in</strong> aqua feeds is the presence of anti-nutritionalfactors (Tacon, 1987; Hertrampf <strong>and</strong> Piedad-Pascual, 2000). However, through genetic selection, presentpea varieties conta<strong>in</strong> no tann<strong>in</strong>s <strong>and</strong> only low levels of tryps<strong>in</strong> <strong>in</strong>hibitors <strong>and</strong> lect<strong>in</strong>s (Bond <strong>and</strong> Duc, 1993)that can be deactivated by heat treatment (Melcion <strong>and</strong> van del Poel, 1993). <strong>Pulse</strong>s are produced ma<strong>in</strong>ly <strong>for</strong>their mature seeds <strong>and</strong> immature pods <strong>for</strong> human consumption (Muehlbauer <strong>and</strong> Tullu, 1997), unlikesoybean <strong>and</strong> other oilseeds that are grown ma<strong>in</strong>ly <strong>for</strong> process<strong>in</strong>g <strong>in</strong>to edible oils <strong>and</strong> prote<strong>in</strong> concentrates.With the expansion of production of feed peas as human food <strong>and</strong> animal feed (<strong>Pulse</strong> Canada, 1999b),more peas would be available <strong>in</strong> the market.15
The consistent response of the <strong>tilapia</strong> juveniles to <strong>diets</strong> conta<strong>in</strong><strong>in</strong>g feed peas <strong>in</strong> three feed<strong>in</strong>g trials clearlyshowed that feed pea as an alternative <strong>in</strong>gredient can be rout<strong>in</strong>ely <strong>in</strong>cluded <strong>in</strong> <strong>tilapia</strong> <strong>diets</strong>. Further studieson feed peas as component of <strong>tilapia</strong> <strong>diets</strong> (e.g., those related to process<strong>in</strong>g <strong>and</strong> energy utilization) have tobe conducted.Table 1Composition of fishmeal-based <strong>diets</strong> <strong>for</strong> male Nile <strong>tilapia</strong> <strong>in</strong> experiment 1 (g per 100g diet)% replacement of fishmeal prote<strong>in</strong> (or total dietary prote<strong>in</strong>)Ingredient0 a 10 (9.3) a 20 (18.6) 30 (28.0) 40 (37.3) 50 (47.6)aFish meal 49.0 44.1 39.2 34.3 29.4 24.5<strong>Peas</strong> - 12.7 25.3 37.5 50.7 63.3Rice bran 15.0 15.0 15.0 15.0 15.0 10.2Starch 15.0 12.0 9.0 6.0 - -Soybean oil 5.0 5.0 5.0 5.0 2.9 -Vit-m<strong>in</strong> mix 2.0 2.0 2.0 2.0 2.0 2.0Celufil (filler) 14.0 9.2 4.5 0.2 - -Analyzed (as fed)Crude prote<strong>in</strong> (%) 31.9 31.6 31.0 29.9 29.2 28.9Crude fat (%) 11.2 11.0 10.4 10.4 7.7 2.5Ash (%) 9.7 9.0 8.9 8.1 7.7 6.7Crude fiber (%) 6.7 6.5 6.2 6.8 7.0 6.4NFE (%) 33.9 35.7 37.2 37.8 41.3 48.6Digestible energy (kJ g -1 ) 14.5 14.7 14.6 14.4 13.8 12.9a Diet whose digestibility <strong>in</strong> <strong>tilapia</strong> was also determ<strong>in</strong>ed <strong>in</strong> a separate feed<strong>in</strong>g trial.Table 2 Composition of plant-based <strong>diets</strong> <strong>for</strong> male <strong>tilapia</strong> (CLSU <strong>and</strong> BFAR stra<strong>in</strong>s) <strong>in</strong> experiment 2(g per 100g diet)% replacement of plant prote<strong>in</strong>s (or total dietary prote<strong>in</strong>)Ingredient 0 a 5 (4.2) 10 (8.4) 15 (12.7) a 20 (16.9) 25 (21.1) a 30 (25.3) 35 (29.6) aFish meal 8.00 8.00 8.00 8.00 8.00 8.00 8.00 8.00Soybean meal 40.00 38.63 37.25 35.88 34.50 33.13 31.75 30.38Copra meal 20.00 18.37 16.73 15.10 13.47 11.83 10.20 8.57Rice bran 24.00 21.49 18.98 16.46 13.95 11.44 8.93 6.41<strong>Peas</strong> - 5.86 11.72 17.57 23.43 29.29 35.15 41.00Soybean oil 4.00 4.00 4.00 4.00 4.00 4.00 4.00 4.00Vitam<strong>in</strong> mix 0.40 0.40 0.40 0.40 0.40 0.40 0.40 0.40M<strong>in</strong>eral mix 0.70 0.70 0.70 0.70 0.70 0.70 0.70 0.70Starch 2.90 2.56 2.23 1.89 1.55 1.21 0.88 0.54Analyzed (as fed)Crude prote<strong>in</strong> (%) 29.7 32.4 32.4 31 32 29.8 31.8 29.9Crude fat (%) 10.1 9.5 8.7 7.1 8.2 7.5 7.1 6.9Ash (%) 7.7 6.3 7 5.6 7.2 7 6.2 6.6Crude fiber (%) 7.9 7.4 7.7 6.5 7.2 6.6 6.6 6.3NFE (%) 37.4 37.2 37.4 42.9 38.3 41.8 41.2 43Digestible energy (kJ g -1 ) 14.2 14.4 14.2 14.1 14.1 13.9 14 13.9a Diet whose digestibility <strong>in</strong> <strong>tilapia</strong> was also determ<strong>in</strong>ed <strong>in</strong> a separate feed<strong>in</strong>g trial.Table 3Mean <strong>in</strong>itial weight <strong>and</strong> total length, ga<strong>in</strong> <strong>in</strong> weight <strong>and</strong> length, survival, FCR <strong>and</strong> PER of male Nile<strong>tilapia</strong> fed <strong>diets</strong> conta<strong>in</strong><strong>in</strong>g feed peas at vary<strong>in</strong>g fishmeal prote<strong>in</strong> substitution <strong>for</strong> 9 weeks(experiment 1) aFishmeal prote<strong>in</strong> Dietary feed Body weight (g) Total length (cm) Survivalsubstitution (%) peas (%) Initial Ga<strong>in</strong> Initial Ga<strong>in</strong> (%)FCR PER- - 35.5+0.9 24.0+7.7 12.6+0.7 3.0+0.5 40+23 4.1+0.7 0.8+0.110 12.7 35.3+0.6 34.0+9.3 12.5+0.6 3.4+0.4 70+26 3.2+0.5 1.0+0.220 25.3 35.8+0.3 25.3+7.3 12.6+0.5 2.8+0.4 70+26 4.2+1.6 0.8+0.330 37.5 34.9+1.1 21.7+5.6 12.5+0.6 2.4+0.1 55+30 4.2+0.6 0.8+0.140 50.7 35.5+0.6 25.1+4.6 12.7+0.6 3.0+0.6 45+19 3.4+0.7 1.0+0.250 63.3 35.5+0.6 25.2+9.6 12.4+0.7 2.8+0.7 65+25 4.0+1.4 1.0+0.4a Column means are not significantly different from each other (P>0.05). Mean+SEM16
Table 4Mean <strong>in</strong>itial weight <strong>and</strong> total length, ga<strong>in</strong> <strong>in</strong> weight <strong>and</strong> length, FCR <strong>and</strong> PER of <strong>tilapia</strong> (CLSUstra<strong>in</strong>) fed <strong>diets</strong> conta<strong>in</strong><strong>in</strong>g feed peas at vary<strong>in</strong>g plant prote<strong>in</strong> substitution <strong>for</strong> 12 weeks(experiment 2) aPlant prote<strong>in</strong> Dietary feed Body weight (g) Total length (cm)substitution (%) peas (%) Initial Ga<strong>in</strong> Initial Ga<strong>in</strong>FCR PER0 0 28.0+3.0 53.6+12.8 11.6+0.1 4.7+1.4 3.4+0.6 1.0+0.25 5.9 28.2+2.8 57.4+12.4 11.6+0.3 5.0+0.2 3.2+0.4 1.0+0.110 11.7 28.5+3.2 49.5+ 7.2 11.5+0.2 5.1+0.6 3.6+0.4 0.9+0.115 17.6 28.3+2.9 57.1+ 8.5 11.7+0.2 5.2+0.9 3.3+0.3 1.0+0.120 23.4 28.5+2.6 56.7+ 2.1 11.7+0.2 5.1+0.3 3.3+0.3 1.0+0.125 29.3 28.4+3.2 45.5+ 7.8 11.7+0.1 4.6+0.4 4.0+0.4 0.9+0.130 35.2 28.4+3.0 54.0+ 0.7 11.6+0.2 5.1+0.2 3.5+0.2 0.9+0.035 41 28.1+2.4 56.7+13.5 11.5+0.1 5.4+1.0 3.4+0.6 1.0+0.2a Column means are not significantly different from each other (P>0.05). Mean+SEMTable 5Mean <strong>in</strong>itial weight <strong>and</strong> total length, ga<strong>in</strong> <strong>in</strong> weight <strong>and</strong> length, FCR <strong>and</strong> PER of male <strong>tilapia</strong> (BFARstra<strong>in</strong>) fed <strong>diets</strong> conta<strong>in</strong><strong>in</strong>g feed peas at vary<strong>in</strong>g plant prote<strong>in</strong> substitution <strong>for</strong> 12 weeks(experiment 2) aPlant prote<strong>in</strong> Dietary feed Body weight (g) Total length (cm)substitution 0.80 peas (%) Initial Ga<strong>in</strong> Initial Ga<strong>in</strong>FCR PER0 0 31.1+4.3 52.5+4.4 12.1+0.6 5.0+0.6 4.3+0.4 0.8+0.15 5.9 31.0+3.6 71.6+22 12.1+0.5 5.8+0.8 3.3+0.6 0.9+0.210 11.7 30.9+4.3 60.2+0.7 12.1+0.6 5.0+0.4 3.6+0.2 0.8+0.015 17.6 30.9+4.3 69.0+11.5 12.1+0.5 4.8+1.5 3.7+0.6 0.9+0.220 23.4 30.8+3.9 62.4+10 12.2+0.6 5.1+0.3 3.6+0.5 0.9+0.125 29.3 30.9+3.6 57.0+5.9 12.1+0.5 5.2+0.8 3.6+0.1 0.9+0.030 35.2 31.0+3.8 63.9+1.3 12.1+0.4 5.1+0.3 3.8+0.1 0.8+0.035 41 31.1+4.5 74.1+9.2 12.1+0.6 5.7+0.7 3.2+0.1 1.0+0.0a Column means are not significantly different from each other (P>0.05). Mean+SEMTable 6 Carcass prote<strong>in</strong> <strong>and</strong> ash of Nile <strong>tilapia</strong> after 9 weeks of feed<strong>in</strong>g us<strong>in</strong>g some <strong>diets</strong> <strong>in</strong> experiment 1<strong>and</strong> after 12 weeks of feed<strong>in</strong>g <strong>in</strong> experiment 2 aDietDiets <strong>in</strong> Expt 1Dietary feedpeas (%)% fishmeal prote<strong>in</strong> substitutionCrudeprote<strong>in</strong>AshLipid0 - 56.5± 0.2 a 18.9± 0.1 b 18.8±0.3 b10 12.7 56.4± 0.6 a 19.5± 0.3 b 19.4±0.0 a30 37.5 57.2+0.4 a 20.8+0.4 a 18.7±0.0 b50 63.3 57.4+0.2 a 20.8+0.1 a 18.9±0.1 bDiets <strong>in</strong> Expt 2 b% plant prote<strong>in</strong> substitutionDry matter basis (%)0 - 55.7+0.4 c 16.3+0.6 b 23.2±0.4 a15 17.6 59.1+0.4 a 14.7+0.2 c 21.2±0.3 b25 29.3 56.5+0.2 c 16.3+0.3 b 20.9±0.3 b35 41.0 58.2+0.2 b 18.3+0.0 a 20.3±0.1 baFor each experiment, column means with a common superscript are notsignificantly different (P>0.05).bAt stock<strong>in</strong>g of the CLSU <strong>tilapia</strong> stra<strong>in</strong>, body prote<strong>in</strong> was 58.7+0.5%; ash,26.0+0%; lipid, 11.3+0.2%.17
Table 7Apparent dry matter digestibility (ADMD) <strong>and</strong> prote<strong>in</strong> digestibility (APD) of <strong>diets</strong> with peas <strong>in</strong>juvenile male <strong>tilapia</strong> (CLSU stra<strong>in</strong>)DigestibilitytrialsDietary feedpeas (%)Trial us<strong>in</strong>g <strong>diets</strong> <strong>in</strong> Expt 1% fishmeal prote<strong>in</strong> substitutionADMD (%) aAPD (%) a0 0 72.1± 0.6 c 92.5± 0.4 a10 12.7 75.6± 0.4 b 90.5± 0.4 b30 37.5 77.8+1.1 ab 91.5+0.7 ab50 63.3 78.8+0.6 a 92.0+0.2 abTrial us<strong>in</strong>g <strong>diets</strong> <strong>in</strong> Expt 2% plant prote<strong>in</strong> substitution0 0 74.1+0.2 b 90.6+0.3 a15 17.6 73.4+0.59 b 91.5+0.3 a25 29.3 76.2+0.67 a 91.2+0.3 a35 41 76.9+0.42 a 91.6+0.3 aa For each digestibility trial, column means with a commonsuperscript are not significantly different (P>0.05).Table 8Digestibility coefficients (%) <strong>for</strong> P. sativum <strong>in</strong> different fish speciesFish Dry matter Prote<strong>in</strong> Energy ReferenceRa<strong>in</strong>bow trout, 52 g 66.1 80.4 59.2 Gomes et al. (1995)Ra<strong>in</strong>bow trout, 100g 66.3 87.9 68.9 Burel et al. (2000)Turbot, 110 g 71.5 92.9 77.7 Burel et al. (2000)Silver perch 51.0 81.0 51.0 Allan et al. (2000)Nile <strong>tilapia</strong>, 38 g 69.3 87.2 no data present studyAcknowledgementsThis study was funded by the US Department of Agriculture <strong>and</strong> sponsored by the USA Dry Pea <strong>and</strong> LentilCouncil. <strong>Feed</strong>s <strong>and</strong> fish samples were analyzed by the staff of the Central Analytical Laboratory ofSEAFDEC AQD, Tigbauan, Iloilo or the Animal Nutrition Analytical Service Laboratory, University of thePhilipp<strong>in</strong>es Los Baños, Laguna.ReferencesAllan, G.L., Park<strong>in</strong>son, S., Booth, M.A., Stone, D.A.J, Rowl<strong>and</strong> S.J., Frances, J., Warner-Smith, R., 2000. Replacement of fish meal <strong>in</strong><strong>diets</strong> <strong>for</strong> Australian silver perch, Bidyanus bidyanus: 1. Digestibility of alternative <strong>in</strong>gredients. Aquaculture 186, 293-310.Association of Official Analytical Chemists (AOAC), 1990. Official Methods of Analysis, 15th edn. AOAC, Arl<strong>in</strong>gton, VA, 1228 pp.Bond, D.A., Duc, G., 1993. Plant breed<strong>in</strong>g as a means of reduc<strong>in</strong>g ant<strong>in</strong>utritional factors <strong>in</strong> gra<strong>in</strong> legumes. In: van der Poel, A.F.B.,Huisman, J., Sa<strong>in</strong>i, H.S. (Eds.), Second International Workshop on Ant<strong>in</strong>utritional Factors (ANFs) <strong>in</strong> Legume Seeds, RecentAdvances of Research <strong>in</strong> Ant<strong>in</strong>utritional Factors <strong>in</strong> Legume Seeds, 1-2 December 1993, EAAP Publication, The Netherl<strong>and</strong>s, pp.379-396.Burel C., Boujard, T., Tulli, F., Kaushik, S.J., 2000. Digestibility of extruded peas, extruded lup<strong>in</strong>, <strong>and</strong> rapeseed meal <strong>in</strong> ra<strong>in</strong>bow trout(Oncorhynchus mykiss) <strong>and</strong> turbot (Psetta maxima). Aquaculture 188, 285-298.Carter, J.F., Bol<strong>in</strong>, D.W., Erikson, P., 1960. The evaluation of <strong>for</strong>ages by the Agronomic “difference” method <strong>and</strong> chromogen chromicoxide “<strong>in</strong>dicator” technique. N.D. Agric. Exp. Stn., Techn. Bull. 426, 55 pp.Carter, C.G., Hauler, R.C., 2000. Fish meal replacement by plant meals <strong>in</strong> extruded feeds <strong>for</strong> Atlantic salmon, Salmo salar L.Aquaculture 185, 299-311.Cho, C.Y., Sl<strong>in</strong>ger, S.J., Bayley, M.S., 1982. Bioenergetics of salmonid fishes: energy <strong>in</strong>take, expenditure <strong>and</strong> productivity. Comp.Biochem. Physiol. 73B, 25-41.De Silva, S.S., Keembiyahetty, C.N., Gunasekera, R.M., 1988. Plant <strong>in</strong>gredient substitutes <strong>in</strong> Oreochromis niloticus (L.) <strong>diets</strong>:Ingredient digestibility <strong>and</strong> effect of dietary prote<strong>in</strong> content on digestibility. J. Aqua. Trop. 3, 127-138.El-Sayed, A.-F. M., 1999. Alternative dietary prote<strong>in</strong> sources <strong>for</strong> farmed <strong>tilapia</strong>, Oreochromis spp. Aquaculture 179, 149-168.Eusebio, P., 1991. Effect of dehull<strong>in</strong>g on the nutritive value of some legum<strong>in</strong>ous seeds as prote<strong>in</strong> sources <strong>for</strong> tiger prawn (Penaeusmonodon) juveniles. Aquaculture 99, 297-308.Eusebio, P.S., Coloso, R.M., 2000. Nutritional evaluation of various plant prote<strong>in</strong> sources <strong>in</strong> <strong>diets</strong> <strong>for</strong> Asian sea bass Lates calcarifer.J. Appl. Ichthyol. 16, 56-60.Gerpacio, A.L., Castillo, L.S., 1979. Nutrient Composition of Some Philipp<strong>in</strong>e <strong>Feed</strong>stuffs. Technical Bullet<strong>in</strong> 21, Extension Division,Department of Animal Science, University of the Philipp<strong>in</strong>es at Los Baños, Philipp<strong>in</strong>es, 117 pp.Gomes, E.F., Rema, P., Kaushik, S.J., 1995. Replacement of fish meal by plant prote<strong>in</strong>s <strong>in</strong> the diet of ra<strong>in</strong>bow trout (Oncorhynchusmykiss): digestibility <strong>and</strong> growth per<strong>for</strong>mance. Aquaculture 130, 177-186.Gouveia, A., Oliva Teles, A., Gones, E., Rema, P., 1993. Effect of cook<strong>in</strong>g/expansion of three legume seeds on growth <strong>and</strong> foodutilization by ra<strong>in</strong>bow trout. In: Fish Nutrition <strong>in</strong> Practice, Biarritz (France), June 24-27, 1991. Ed. INRA, Paris (Les Colloques,no61), pp. 933-938.Gouveia A., Davies, S.J., 1998. Prelim<strong>in</strong>ary nutritional evaluation of pea seed meal (Pisum sativum) <strong>for</strong> juvenile European sea bass(Dicentrarchus labrax). Aquaculture 166, 311-320.18
Hanley, F., 1987. The digestibility of feedstuffs <strong>and</strong> the effects of feed<strong>in</strong>g selectivity on digestibility determ<strong>in</strong>ations <strong>in</strong> <strong>tilapia</strong>,Oreochromis niloticus. Aquaculture 66, 163-179.Hardy, R.W., 2000. Fish feeds <strong>and</strong> nutrition- Fish feeds & nutrition <strong>in</strong> the new millenium. Aquaculture Magaz<strong>in</strong>e, Jan/Feb 2000, pp.85-89.Hertrampf, J.W., Piedad-Pacual, F., 2000. H<strong>and</strong>book on Ingredients <strong>for</strong> Aquaculture <strong>Feed</strong>s. Kluwer Academic Publishers, TheNetherl<strong>and</strong>s, 573 pp.Jauncey, K., 1998. Tilapia <strong>Feed</strong>s <strong>and</strong> <strong>Feed</strong><strong>in</strong>g. Pisces Press Ltd., Stirl<strong>in</strong>g, Scotl<strong>and</strong>, 241 pp.Lim, C., 1987. Practical feed<strong>in</strong>g – <strong>tilapia</strong>s. In: Lovell, T., Nutrition <strong>and</strong> <strong>Feed</strong><strong>in</strong>g of Fish. Von Nostr<strong>and</strong> Re<strong>in</strong>hold, NY, pp 163-183.Luquet, P., 1991. Tilapia, Oreochromis spp. In: Wilson, R.P. (Ed.), H<strong>and</strong>book of Nutrient Requirements of F<strong>in</strong>fish. CRC Press, Inc.Florida, USA, pp. 169-179.Muehlbauer, F.J. <strong>and</strong> Tullu, A., 1997. Pisum sativum L. http://www.hort.purdue.edu/cropfactsheets/pea.htm (2 July 2002).Melcion, J.-P., van der poel, A.F.B., 1993. Process technology <strong>and</strong> ant<strong>in</strong>utritional factors: pr<strong>in</strong>ciples, adequacy <strong>and</strong> processoptimization. In: van der Poel, A.F.B., Huisman, J., Sa<strong>in</strong>i, H.S. (Eds.), Second International Workshop on Ant<strong>in</strong>utritional Factors(ANFs) <strong>in</strong> Legume Seeds, Recent Advances of Research <strong>in</strong> Ant<strong>in</strong>utritional Factors <strong>in</strong> Legume Seeds, 1-2 December 1993, EAAPPublication, Wagen<strong>in</strong>gen, The Netherl<strong>and</strong>s, pp. 419-434.National Research Council (NRC), 1993. Nutrient Requirements of Fish. National Academy Press, Wash<strong>in</strong>gton, DC., 114 pp.Olvera-Novoa, M.A., Pereira-Pacheco, F., Olivera-Castillo, L., Pérez-Flores, V., Navarro, L., Sámano, J.C., 1997. Cowpea (Vignaunguiculata) prote<strong>in</strong> concentrate as replacement of fish meal <strong>in</strong> <strong>diets</strong> <strong>for</strong> <strong>tilapia</strong> (Oreochromis niloticus) fry. Aquaculture 158, 107-116.Pfeffer, E., K<strong>in</strong>z<strong>in</strong>ger, S., Rodehutscord, M., 1995. Influence of the proportion of poultry by-products <strong>and</strong> of untreated orhydrothermically treated legume seeds <strong>in</strong> <strong>diets</strong> <strong>for</strong> ra<strong>in</strong>bow trout, Oncorhynchus mykiss (Walbaum), on apparent digestibilities oftheir energy <strong>and</strong> organic compounds. Aquaculture Nutr. 1, 111-117.<strong>Pulse</strong> Canada, 1999a. Nutrient Composition. http://www.pulsecanada.com/<strong>Feed</strong><strong>Peas</strong>/NutrientComposition.htm (29 June 2002).<strong>Pulse</strong> Canada, 1999b. Production Info. http://www.pulsecanada.com/<strong>Feed</strong><strong>Peas</strong>/ProductionInfo.htm (29 June 2002)Racz, V.J., 1999. <strong>Feed</strong> pea nutrient composition. In: <strong>Feed</strong> <strong>Peas</strong>, Selected Publications <strong>and</strong> Articles <strong>for</strong> Animal Nutritionists <strong>and</strong>Livestock Producers. USA Dry Pea <strong>and</strong> Lentil Council, Bangkok, Thail<strong>and</strong>, pp. 5-8.Santiago, C.B., Lovell, R.T., 1988. Am<strong>in</strong>o acid requirements <strong>for</strong> growth of Nile <strong>tilapia</strong>. J. Nutr. 118, 1540-1546.SAS Institute Inc., 1991. SAS System <strong>for</strong> L<strong>in</strong>ear Models. Third Edition. SAS Institute Inc., Cary, North Carol<strong>in</strong>a, 329 pp.Spyridakis, P., Metailler, R., Gabaudan, J., Riaza, A., 1989. Studies on nutrient digestibility <strong>in</strong> European sea bass (Dicentrarchuslabrax). I. Methodological aspects concern<strong>in</strong>g feces collection. Aquaculture 77, 61-70.Starkey, T. J., 1994. Status of fish meal supplies <strong>and</strong> market dem<strong>and</strong>. Miscellaneous report. H.J. Baker <strong>and</strong> Bro. Inc., Stam<strong>for</strong>d, CT.,USA, 28 pp.Tacon, A.G.J., 1987. The Nutrition <strong>and</strong> <strong>Feed</strong><strong>in</strong>g of Farmed fish <strong>and</strong> Shrimp - A Tra<strong>in</strong><strong>in</strong>g Manual 2. Nutrient Sources <strong>and</strong> Composition.FAO, Brazil, 129 pp.Zamora, R.G., Baguio, S.S., 1984. <strong>Feed</strong> Composition Tables <strong>for</strong> the Philipp<strong>in</strong>es. PCARRD Book Series No. 1/1984, Philipp<strong>in</strong>e Council<strong>for</strong> Agriculture <strong>and</strong> Resources Research <strong>and</strong> Development, Los Baños, Laguna, Philipp<strong>in</strong>es, 264 pp.19
Potential Of <strong>Feed</strong> Pea (Pisum Sativum) As An Alternative Prote<strong>in</strong> SourceIn Practical Diets For Milkfish (Chanos Chanos Forsskal)Ilda G. Borlongan, Perla S. Eusebio, <strong>and</strong> Timothy P. WelshAbstractA 12-week feed<strong>in</strong>g trial was conducted to evaluate the use of feed pea as a potential dietary prote<strong>in</strong> source<strong>for</strong> juvenile <strong>milkfish</strong>, Chanos chanos Forsskal. Six isonitrogenous (30% crude prote<strong>in</strong>) <strong>and</strong> isocaloric (3940kcal/kg) practical <strong>diets</strong> were <strong>for</strong>mulated. The control diet conta<strong>in</strong>ed fish meal, soybean meal, meat <strong>and</strong>bone meal, <strong>and</strong> copra meal as pr<strong>in</strong>cipal prote<strong>in</strong> sources. <strong>Feed</strong> pea was progressively substituted at 0, 5,10, 15, 20, 25 <strong>and</strong> 30% of total prote<strong>in</strong>. A lead<strong>in</strong>g commercial <strong>milkfish</strong> feed was also tested as an additionalcontrol. The experimental <strong>diets</strong> were fed to triplicate groups of <strong>milkfish</strong> f<strong>in</strong>gerl<strong>in</strong>gs (mean <strong>in</strong>itial weight of0.42 ± 0.01g) at 10% body weight/day. Growth per<strong>for</strong>mance (expressed as % weight ga<strong>in</strong> <strong>and</strong> SGR),survival, feed conversion ratio (FCR) <strong>and</strong> prote<strong>in</strong> efficiency ratio (PER) of <strong>milkfish</strong> fed <strong>diets</strong> with up to 10%substitution of the dietary prote<strong>in</strong> with feed pea were not significantly different (P >0.05) compared to fishfed the control diet. Replacement with feed pea at 15% <strong>and</strong> higher levels led to <strong>milkfish</strong> fed these <strong>diets</strong>show<strong>in</strong>g a significantly lower growth response compared to fish fed the control without any feed pea.Nevertheless, it was observed that <strong>milkfish</strong> fed <strong>diets</strong> with up to 20% of total dietary prote<strong>in</strong> substitution withfeed pea showed better growth rates <strong>and</strong> feed conversion ratios than the commercial feed control. Wholebody composition (crude prote<strong>in</strong>, crude fat, crude fiber, nitrogen free extracts, <strong>and</strong> ash content) of <strong>milkfish</strong>fed the various test <strong>diets</strong> was not significantly different. Apparent digestibility coefficients of feed pea <strong>and</strong>experimental <strong>diets</strong> <strong>in</strong> <strong>milkfish</strong> were also determ<strong>in</strong>ed. Results <strong>in</strong>dicate that feed pea is an acceptable prote<strong>in</strong>source <strong>and</strong> can substantially replace up to 20% of the total dietary prote<strong>in</strong> <strong>in</strong> <strong>milkfish</strong> <strong>diets</strong>.Keywords:Aquaculture feeds; alternative prote<strong>in</strong> source; feed pea (Pisum sativum);<strong>milkfish</strong> (Chanos chanos Forsskal)IntroductionThe current trend <strong>in</strong> <strong>milkfish</strong> culture is toward <strong>in</strong>creased <strong>in</strong>tensification of culture systems whereby provisionof feeds becomes necessary <strong>and</strong> success there<strong>for</strong>e depends significantly on the availability of wellbalanced,nutritionally complete <strong>and</strong> cost-effective feeds. For many years, SEAFDEC AQD has doneconsiderable research on the nutrient requirement of <strong>milkfish</strong>, assessment of nutritive value of available<strong>in</strong>gredients, <strong>and</strong> development of simple <strong>and</strong> appropriate feed<strong>in</strong>g technology. These are all importantfactors toward the development of cost-effective feeds <strong>and</strong> feed<strong>in</strong>g strategy. SEAFDEC AQD has alsoendeavored to develop cost-effective feeds <strong>for</strong> <strong>milkfish</strong> culture. There is a need, however, <strong>for</strong> these feedsto be cont<strong>in</strong>uously ref<strong>in</strong>ed, improved, <strong>and</strong> tested <strong>for</strong> technical <strong>and</strong> economic feasibility.In recent years, the ris<strong>in</strong>g cost, uncerta<strong>in</strong> availability, <strong>and</strong> fluctuat<strong>in</strong>g quality of fish meal has led to thesearch <strong>for</strong> alternative prote<strong>in</strong> sources <strong>for</strong> fish feed to susta<strong>in</strong> fish production. The use of plant prote<strong>in</strong>sources to completely or partially replace fish meal <strong>in</strong> fish <strong>diets</strong> has been studied <strong>for</strong> many years by severalworkers <strong>for</strong> different fish species (De la Higuera et al., 1988; Moyano et al., 1992; Borlongan <strong>and</strong> Coloso,1994; Sanz et al., 1994; Gomes et al., 1995; Kaushik et al., 1995; Hardy, 1996; Roba<strong>in</strong>a et al., 1997;Watanabe et al., 1997; Carter <strong>and</strong> Hauler, 2000; Kissil et al., 2000 <strong>and</strong> Farhangi <strong>and</strong> Carter, 2001).<strong>Feed</strong> pea (Pisum sativum), an abundant agricultural product, is a potential feed <strong>in</strong>gredient. It is a highenergy, medium prote<strong>in</strong> <strong>in</strong>gredient with average prote<strong>in</strong> content (%CP) of 22 to 24% <strong>and</strong> digestible energy(DE) of 3420 kcal/kg. Lys<strong>in</strong>e is particularly high at 1.6%. The efficiency of feed pea as a feed <strong>in</strong>gredienthas been evaluated <strong>for</strong> cattle, sw<strong>in</strong>e, <strong>and</strong> poultry. However, there is a paucity of <strong>in</strong><strong>for</strong>mation on the use ofthis <strong>in</strong>gredient as dietary prote<strong>in</strong> source <strong>for</strong> aquaculture species.The aim of the current study was to assess the potential of feed pea (Pisum sativum) as an <strong>in</strong>gredient <strong>in</strong>practical feeds <strong>for</strong> <strong>milkfish</strong> (Chanos chanos Forsskal). This was compared with solvent-extracted soybeanmeal because soybean meal is the most often used plant alternative to fish meal <strong>in</strong> <strong>milkfish</strong> feeds. The firstphase of the experiment was conducted to establish the nutritive value of feed pea through measurement offish growth, feed utilization <strong>and</strong> carcass composition. The second phase assessed the apparentdigestibility coefficients <strong>for</strong> dry matter <strong>and</strong> dietary prote<strong>in</strong>.Materials <strong>and</strong> MethodsExperiment 1: Growth per<strong>for</strong>mance <strong>and</strong> feed utilizationExperimental DietsThe test <strong>diets</strong> were <strong>for</strong>mulated to be isonitrogenous <strong>and</strong> isocaloric. The control <strong>diets</strong> were the exist<strong>in</strong>gSEAFDEC <strong>milkfish</strong> <strong>for</strong>mulation that had been previously tested <strong>in</strong> <strong>in</strong>tensive ponds as hav<strong>in</strong>g an FCR of 1.5(D-1), <strong>and</strong> a lead<strong>in</strong>g commercial <strong>milkfish</strong> feed (D-8). The composition <strong>and</strong> proximate analyses of the20
experimental <strong>diets</strong> are presented <strong>in</strong> Table 1. All <strong>diets</strong> were <strong>for</strong>mulated to conta<strong>in</strong> 30% prote<strong>in</strong>, 10% lipid<strong>and</strong> energy of about 394kcal/100g diet. Analyses however, showed that experimental <strong>diets</strong> conta<strong>in</strong>ed 33%prote<strong>in</strong> <strong>and</strong> 10% lipid, while the commercial <strong>milkfish</strong> feed control conta<strong>in</strong>ed 37% prote<strong>in</strong> <strong>and</strong> 9% lipid. Thebasal <strong>for</strong>mulation conta<strong>in</strong>ed fish meal, defatted soybean meal, meat <strong>and</strong> bone meal, <strong>and</strong> copra meal asdietary prote<strong>in</strong> sources. The levels of feed pea <strong>in</strong>corporation tested were 0, 5, 10, 15, 20, 25, <strong>and</strong> 30% ofthe total crude prote<strong>in</strong>. Dietary essential am<strong>in</strong>o acid profiles (Table 2) were calculated based on analysesof <strong>in</strong>gredients <strong>and</strong> published data (NRC, 1977) <strong>and</strong> compared to that of requirements <strong>for</strong> <strong>milkfish</strong> juvenile(Borlongan <strong>and</strong> Coloso, 1993) which was used as the reference. Analyzed values of the essential am<strong>in</strong>oacids are likewise presented. No supplemental am<strong>in</strong>o acids were added to the <strong>diets</strong>. Cod liver <strong>and</strong>soybean oils served as lipid sources. Vitam<strong>in</strong> <strong>and</strong> m<strong>in</strong>eral premixes were kept constant <strong>in</strong> all <strong>diets</strong>.Commercial feed peas of US orig<strong>in</strong> were sourced from a local agricultural distributor. The whole dry peawas oven-dried at 60 0 C <strong>for</strong> 4 hours <strong>and</strong> f<strong>in</strong>ely ground to homogenized flour. No specialized <strong>in</strong>gredientprocess<strong>in</strong>g method was used. Diets were prepared by first mix<strong>in</strong>g all dry <strong>in</strong>gredients <strong>in</strong> the Hobart mixer.Oils were then blended with the dry <strong>in</strong>gredient mixture. An equal portion of bread flour was gelat<strong>in</strong>ized bycook<strong>in</strong>g <strong>in</strong> 600 ml water <strong>and</strong> added to the mixture. The semi-moist mixture was then passed through theHobart food gr<strong>in</strong>der to <strong>for</strong>m 2 mm diameter pellets. The pellets were dried <strong>in</strong> an air convection oven at40 0 C. The dry pellets were then ground, sieved to uni<strong>for</strong>m sizes, <strong>and</strong> stored at 4 0 C until used <strong>for</strong> feed<strong>in</strong>g.Experimental fish <strong>and</strong> feed<strong>in</strong>g managementThe experiment was conducted at the <strong>Feed</strong> Development Section of the Aquaculture Department of theSoutheast Asian Fisheries Development Center (SEAFDEC/AQD), Tigbauan, Iloilo, Philipp<strong>in</strong>es. Hatcherybred<strong>milkfish</strong> juveniles were acclimated <strong>for</strong> two weeks under laboratory conditions <strong>and</strong> to a dry diet (controldiet) prior to the experiment. The feed<strong>in</strong>g trials were conducted <strong>in</strong> an <strong>in</strong>door flow-through system. Sixty-litercapacity, oval fiberglass tanks conta<strong>in</strong><strong>in</strong>g 50L seawater with aeration were used. Milkfish juveniles (meanwt. = 0.42 g) were r<strong>and</strong>omly distributed at a stock<strong>in</strong>g rate of 10 fish per tank <strong>and</strong> <strong>in</strong> four replicate tanks pertreatment. Fish <strong>in</strong> each treatment were then fed three times daily at 0830, 1130, <strong>and</strong> 1400H at a feed<strong>in</strong>grate of 10% body weight per day <strong>for</strong> 12 weeks. <strong>Feed</strong><strong>in</strong>g ration was adjusted at every 3 weeks sampl<strong>in</strong>g<strong>in</strong>terval. Water quality parameters (temperature, sal<strong>in</strong>ity, DO, pH, ammonia, nitrite) were monitoredfollow<strong>in</strong>g the methods of Strickl<strong>and</strong> <strong>and</strong> Parsons (1972) to ensure water quality rema<strong>in</strong>ed well with<strong>in</strong> limitsrecommended <strong>for</strong> <strong>milkfish</strong> culture (Bagar<strong>in</strong>ao, 1991).Statistical AnalysesSurvival, % weight ga<strong>in</strong>, specific growth rate (SGR), food conversion ratio (FCR), <strong>and</strong> prote<strong>in</strong> efficiencyratio (PER) were calculated <strong>and</strong> subjected to statistical analyses. Data were subjected to analysis ofvariance (ANOVA) <strong>and</strong> Duncan’s Multiple Range test (DMRT). Differences between means wereconsidered significant at P
1% chromic oxide to replace an equivalent amount from the filler (Celufil). The fish were acclimated withthe control diet/reference diet (without Cr 2 O 3 ) <strong>for</strong> 1 week prior to feed<strong>in</strong>g them test <strong>diets</strong> conta<strong>in</strong><strong>in</strong>g 1%Cr 2 O 3 . Diets were fed to satiation twice daily (0900 <strong>and</strong> 1400 h). Fecal collection was started at day 5 afterthe fish were acclimated to the green <strong>diets</strong>, or when the fecal matter became greenish. The tanks <strong>and</strong> fecalcollection apparatus were cleaned twice daily, 2 hours after feed<strong>in</strong>g <strong>in</strong> the morn<strong>in</strong>g <strong>and</strong> afternoon. Fecalcollection bottles were then attached, <strong>and</strong> feces collected. Feces were collected from the plastic bottles,r<strong>in</strong>sed 3 times with distilled water; freeze-dried <strong>and</strong> prepared (Eusebio, 1991) <strong>for</strong> dry matter <strong>and</strong> crudeprote<strong>in</strong> (AOAC, 1990) <strong>and</strong> Cr 2 O 3 (Carter et al., 1960) analyses. The test <strong>diets</strong> were likewise analyzed <strong>for</strong>dry matter, crude prote<strong>in</strong> <strong>and</strong> Cr 2 O 3 .In vivo apparent prote<strong>in</strong> digestibility (APD) <strong>and</strong> apparent dry matter digestibility (ADMD) of feed pea werecomputed us<strong>in</strong>g the <strong>for</strong>mula of Spyridakis et al. (1989) <strong>and</strong> Cho et al. (1982). ADMD <strong>and</strong> APD of<strong>for</strong>mulated <strong>diets</strong> were computed us<strong>in</strong>g the <strong>for</strong>mula of Spyridakis et al. (1989). The data were analyzedus<strong>in</strong>g ANOVA <strong>for</strong> completely r<strong>and</strong>omized design (CRD). Treatment means were compared by Duncan'sMultiple Range Test (DMRT) us<strong>in</strong>g SAS computer software. Differences were considered significant atP
The results of the digestibility trial did not support the assumption of reduced prote<strong>in</strong> availability from feedpea. In the present study, dietary crude prote<strong>in</strong> digestibility values of the experimental <strong>diets</strong> were above80%. A comparison with the control diet supports the observation that pea prote<strong>in</strong> is well digested by<strong>milkfish</strong>. In fact, apparent prote<strong>in</strong> digestibility value was superior with the partial <strong>in</strong>clusion (10% of dietaryprote<strong>in</strong>) of this plant material compared to the control without feed pea. <strong>Feed</strong> pea at this level may onlyshow marg<strong>in</strong>al effects of anti-nutritional factors <strong>and</strong> limit<strong>in</strong>g am<strong>in</strong>o acids due to its relatively low content ofsuch compounds <strong>and</strong> its fairly good prote<strong>in</strong> biological value <strong>for</strong> fish nutrition. Another consequence of us<strong>in</strong>gfeed pea <strong>in</strong> place of soybean meal <strong>in</strong> the diet <strong>for</strong>mulation <strong>for</strong> <strong>milkfish</strong> is the reduction of bread flour <strong>in</strong> <strong>diets</strong>conta<strong>in</strong><strong>in</strong>g high levels of feed pea. This is because of the higher carbohydrate content of feed peacompared to soybean meal. At this <strong>in</strong>clusion level, <strong>in</strong> practical conditions, feed<strong>in</strong>g costs can be dramaticallydecreased.In general, feed pea meal proved to be an acceptable <strong>in</strong>gredient <strong>for</strong> consideration <strong>in</strong> practical <strong>diets</strong> <strong>for</strong>grower stage production of <strong>milkfish</strong>. Future work showed be directed towards evaluat<strong>in</strong>g extruded peaproducts where pre-gelat<strong>in</strong>ization of the starch would be possible, or test<strong>in</strong>g various pea prote<strong>in</strong>concentrates which have been processed to remove unwanted components such as fiber, tann<strong>in</strong>, etc.These products conta<strong>in</strong> much higher prote<strong>in</strong> levels that could be used to substitute <strong>in</strong>creas<strong>in</strong>g amounts offish meal <strong>in</strong> fish feed <strong>for</strong>mulations. Further studies are needed to f<strong>in</strong>d out the maximum <strong>in</strong>clusion level offeed pea us<strong>in</strong>g other <strong>in</strong>gredient process<strong>in</strong>g methods (e. g. dehull<strong>in</strong>g, autoclav<strong>in</strong>g, pressure cook<strong>in</strong>g, prote<strong>in</strong>concentrat<strong>in</strong>g, etc) <strong>and</strong> different types of pellet mak<strong>in</strong>g (e. g. extrusion); <strong>in</strong> consideration of the effect ofthese process<strong>in</strong>g methods on efficient utilization of essential nutrients by the fish.Previous experiments us<strong>in</strong>g cold-pressed pellets <strong>for</strong> Atlantic salmon suggested that 40% fish meal prote<strong>in</strong>replacement with pea or lup<strong>in</strong> prote<strong>in</strong> concentrate was feasible (Carter, 1998). Carter <strong>and</strong> Hauler (2000)confirmed that at least 33% fish meal prote<strong>in</strong> replacement with pea prote<strong>in</strong> concentrate was possible. Amajor problem <strong>in</strong> the use of plant meals is their relatively low prote<strong>in</strong> content. In the study of Carter <strong>and</strong>Hauler (2000), the prote<strong>in</strong> concentrates used were produced by air separation <strong>and</strong> resulted <strong>in</strong> lup<strong>in</strong> <strong>and</strong> peaconcentrates with 46% <strong>and</strong> 49% crude prote<strong>in</strong>, respectively. This represented an <strong>in</strong>crease of between 44<strong>and</strong> 133% over the prote<strong>in</strong> <strong>in</strong> the raw lup<strong>in</strong> <strong>and</strong> peas, respectively. Prote<strong>in</strong> at this level is comparable tosoybean meal, but still far lower than that <strong>in</strong> fish meal. Gouveia et al., (1993) compared the efficacy of threelegume seed meals, e. g., lup<strong>in</strong> seed meal (Lup<strong>in</strong>us albus), faba beans (V. faba) <strong>and</strong> pea seed meal (P.sativum) <strong>in</strong> a 3-month feed<strong>in</strong>g trial with juvenile ra<strong>in</strong>bow trout. They reported that trout per<strong>for</strong>med well on<strong>diets</strong> that had up to 20% of the prote<strong>in</strong> content be<strong>in</strong>g supplied by each of these <strong>in</strong>gredients. In fact, growth<strong>and</strong> feed utilization was superior with the partial <strong>in</strong>clusion of these plant materials. The <strong>in</strong>clusion of a coextrudedplant prote<strong>in</strong> made from rapeseed <strong>and</strong> field pea had no effect at up to 15% replacement of theprote<strong>in</strong>. However, at 45% <strong>in</strong>clusion, growth per<strong>for</strong>mance of ra<strong>in</strong>bow trout was significantly lower than thecontrol diet (Gomes et al., 1993). The low digestible energy from both raw <strong>and</strong> autoclaved field peas waspredicted to limit their use <strong>in</strong> ra<strong>in</strong>bow trout feeds (Pfeffer et al., 1995; Gouveia <strong>and</strong> Davies, 1998). Energydigestibility of legumes is considerably lower than <strong>for</strong> prote<strong>in</strong> due to their high carbohydrate content. Theuse of extrusion is important <strong>in</strong> <strong>in</strong>creas<strong>in</strong>g the nutrient availability of plant meals, especially <strong>in</strong> relation to<strong>in</strong>creas<strong>in</strong>g the amount of digestible energy available through greater gelat<strong>in</strong>ization of starch (Pongmaneerat<strong>and</strong> Watanabe, 1993).S<strong>in</strong>ce the objective of this study was to evaluate the direct nutritive value of feed peas, the experiment wascarried out <strong>in</strong> an <strong>in</strong>-door clear water flow-through system. However, experience shows that <strong>milkfish</strong> <strong>in</strong>ponds grow better than <strong>milkfish</strong> given the same feed under controlled laboratory conditions (Sumagaysay etal., 1991; Sumagaysay <strong>and</strong> Borlongan, 1995). It is expected that higher growth rates <strong>and</strong> better FCR <strong>and</strong>PER may result if the <strong>milkfish</strong> are reared <strong>in</strong> ponds. It is recommended that feed<strong>in</strong>g experiments us<strong>in</strong>g thebest <strong>diets</strong> be done under natural pond conditions <strong>and</strong> an economic assessment of the feed pea-basedfeeds be conducted.23
Table 1Composition (g/100g diet) <strong>and</strong> proximate analyses of the experimental <strong>diets</strong>D-1 D-2 D-3 D-4 D-5 D-6 D-7 D-8Ingredients0% 5% 10% 15% 20% 25% 30% *CMFWhite fish meal 10.0 10.0 10.0 10.0 10.0 10.0 10.0Soybean meal 35.0 31.5 28.0 24.5 21.0 17.5 14.0Copra meal 13.0 13.0 13.0 13.0 13.0 13.0 13.0Meat <strong>and</strong> bone meal 11.0 11.0 11.0 11.0 11.0 11.0 11.0Vitam<strong>in</strong> mix 3.0 3.0 3.0 3.0 3.0 3.0 3.0M<strong>in</strong>eral mix 2.0 2.0 2.0 2.0 2.0 2.0 2.0Cod liver oil 2.0 2.0 2.0 2.0 2.0 2.0 2.0Soybean oil 2.0 2.0 2.0 2.0 2.0 2.0 2.0Bread flour 21.2 17.3 13.9 10.6 7.2 3.8 0.4Filler (Celufil) 0.8 1.7 2.0 2.3 2.6 3.0 3.3Green peas - 6.5 13.1 19.6 26.2 32.7 39.3Total 100 100 100 100 100 100 100Proximate compostion (%dry basis) of the test <strong>diets</strong>Crude prote<strong>in</strong> 33.52 33.44 33.20 33.42 33.29 33.22 33.35 37.38Crude fat 10.24 10.22 10.10 10.08 10.02 10.08 10.07 9.14Crude fiber 4.66 4.96 4.42 4.39 4.94 4.51 4.63 5.20Nitrogen-free extracts 43.54 43.34 43.96 43.37 43.33 43.79 43.70 39.18Ash 8.04 8.04 8.32 8.74 8.42 8.40 8.25 9.10*CMF = Commercial Milkfish <strong>Feed</strong>Table 2Am<strong>in</strong>o acid composition of various test <strong>diets</strong> <strong>and</strong> a comparison of the am<strong>in</strong>o acid requirements of<strong>milkfish</strong>Essential am<strong>in</strong>o acid Diet 1 Diet 3 Diet 5 Diet 7 Milkfish Req’t*EAA content: Calculated (g/100g diet)Arg<strong>in</strong><strong>in</strong>e 1.57 1.43 1.29 1.43 1.58Histid<strong>in</strong>e 0.68 0.60 0.54 0.46 0.60Isoleuc<strong>in</strong>e 1.05 0.95 0.85 0.75 1.20Leuc<strong>in</strong>e 1.79 1.64 1.48 0.77 1.53Lys<strong>in</strong>e 1.56 1.45 1.32 1.21 1.20Methion<strong>in</strong>e + Cyst<strong>in</strong>e 0.70 0.64 0.57 0.51 0.98Phenylalan<strong>in</strong>e + Tyros<strong>in</strong>e 1.61 1.46 1.27 1.08 1.57Threon<strong>in</strong>e 0.96 0.88 0.79 0.71 1.35Tryptophan 0.15 0.15 0.15 0.13 0.18Val<strong>in</strong>e 1.17 1.08 1.00 0.90 1.06EAA content: Analyzed Value (g/100g diet)Arg<strong>in</strong><strong>in</strong>e 1.21 1.61 0.94 1.30Histid<strong>in</strong>e 0.63 0.54 0.33 0.32Isoleuc<strong>in</strong>e 0.96 0.98 0.64 0.74Leuc<strong>in</strong>e 1.43 1.70 1.26 1.27Lys<strong>in</strong>e 1.31 1.37 1.23 0.96Methion<strong>in</strong>e** 0.27 0.31 0.2 0.22Phenylalan<strong>in</strong>e + Tyros<strong>in</strong>e 1.58 1.88 1.31 1.36Threon<strong>in</strong>e 0.92 0.82 0.72 0.64Tryptophan nd nd nd ndVal<strong>in</strong>e 1.04 1.09 0.91 0.85* Based on Borlongan <strong>and</strong> Coloso, 1995** Cyst<strong>in</strong>e not determ<strong>in</strong>ed24
Table 3Composition (g/100g diet) of the reference <strong>and</strong> test <strong>diets</strong> <strong>for</strong> the digestibility determ<strong>in</strong>ationIngredientsReferenceDietTest Diet70:30:00White fish meal 10.0 7.0Soybean meal 35.0 24.5Copra meal 13.0 9.1Meat <strong>and</strong> bone meal 11.0 7.7Vitam<strong>in</strong> mix 3.0 2.1M<strong>in</strong>eral mix 2.0 1.4Cod liver oil 2.0 1.4Soybean oil 2.0 1.4Bread flour 20.2 13.6Filler (Celufil) 0.8 0.8Cr 2O 3 1.0 1.0Green peas - 30.0Total 100 100Table 4Response of <strong>milkfish</strong> juveniles to the various test <strong>diets</strong> after 12 weeks of feed<strong>in</strong>gDiet No.% % Weight SGRSurvival Ga<strong>in</strong> (%/day)FCR PER1 (0%) 90 c 834.8 e 1.58 e 2.15 e 1.44 d2 (5%) 90 c 833.1 e 1.51 e 2.10 e 1.46 d3 (10%) 90 c 835.3 e 1.50 e 2.10 e 1.44 d4 (15%) 80 b 691.0 d 1.32 d 2.25 d 1.37 c5 (20%) 80 b 680.0 d 1.29 d 2.39 c 1.35 c6 (25%) 70 a 512.6 b 0.89 b 2.50 b 1.21 b7 (30%) 70 a 464.0 a 0.80 a 2.60 a 1.15 a8(CMF) 80 b 581.4 c 1.00 c 2.46 b 1.23 bSGR (specific growth rate) = ln (f<strong>in</strong>al wt.- <strong>in</strong>itial wt)/84 days x 100FCR (feed conversion ratio) = total dry feed given (g) / total wet wt. ga<strong>in</strong> (g)PER (prote<strong>in</strong> efficiency ratio) = wet wt.ga<strong>in</strong> (g) / amount of prote<strong>in</strong> fed (g)CMF = Commercial Milkfish <strong>Feed</strong>Table 5Carcass proximate composition (%) of <strong>milkfish</strong> juveniles fed the various test <strong>diets</strong>Diet No.MoistureCrudeProte<strong>in</strong>CrudeFatCrudeFiberNFE*Ash1 (0%) 76.96 59.06 23.92 0.86 5.92 10.242 (5%) 75.02 60.02 23.69 0.44 4.41 10.443 (10%) 75.16 60.64 23.18 0.79 4.78 10.614 (15%) 76.24 60.46 23.16 0.58 5.56 10.245 (20%) 77.31 60.08 23.87 0.48 4.21 11.366 (25%) 76.92 59.66 22.12 0.62 6.39 11.217 (30%) 76.63 59.96 23.74 0.74 4.05 11.518(CMF) 75.00 60.56 23.71 0.44 4.25 11.04Table 6Apparent digestibility coefficients (%) <strong>for</strong> dry matter (ADMD) <strong>and</strong> crude prote<strong>in</strong> (APD) ofexperimental <strong>diets</strong> <strong>in</strong> <strong>milkfish</strong> (Chanos chanos Forsskal)Diet No. ADMD APD1 (0%) 61.1 a 86.4 b3 (10%) 68.1 a 89.2 a5 (20%) 65.4 a 86.3 b7 (30%) 60.1 a 84.8 b25
AcknowledgementThe authors gratefully acknowledge the United States Department of Agriculture (USDA) through the USADry <strong>Peas</strong> <strong>and</strong> Lentil Council (USADPLC), Moscow, Idaho, USA <strong>for</strong> fund<strong>in</strong>g support. The excellent technicalassistance of Lucia Jimenez, Marthena Joyce Bernas <strong>and</strong> Niel Tibubos is also appreciated.ReferencesAssociation of Official Analytical Chemists (AOAC), 1990. 15 th ed. K. Helrich (ed) AOAC, Arl<strong>in</strong>gton, VA, USA.Bagar<strong>in</strong>ao, T. U. 1991. Biology of <strong>milkfish</strong>, Chanos chanos Forsskal. Aquaculture Department, Southeast Asian FisheriesDevelopment Center, Tigbauan, Iloilo, Philipp<strong>in</strong>es, p.94.Borlongan, I. G., Coloso, R. M., 1993. Requirement of <strong>milkfish</strong> (Chanos chanos Forsskal) juveniles <strong>for</strong> essential am<strong>in</strong>o acids. J. Nutr.123, 125-132.Borlongan, I. G., Coloso, R. M. 1994. Leafmeals as prote<strong>in</strong> sources <strong>in</strong> the <strong>diets</strong> <strong>for</strong> <strong>milkfish</strong> (Chanos chanos Forsskal). In: de Silva, S.S. (ed). Fish Nutrition Research <strong>in</strong> Asia, Proceed<strong>in</strong>gs of the 5 th Asian Fish Nutrition Network Workshop, Asian Fish. Soc. Spec.Publ. 9, 63-68.Carter, C. G., Hauler, R. C. 2000. Fish meal replacement by plant meals <strong>in</strong> extruded feeds <strong>for</strong> Atlantic salmon, Salmo salar L.Aquaculture 185, 299-311.Carter, C. G. 1998. Fish meal replacement <strong>in</strong> aquaculture feeds <strong>for</strong> Atlantic salmon. 93/120 Fisheries Research <strong>and</strong> DevelopmentCorporation, Deak<strong>in</strong>, Australia.Carter, J.F., Bol<strong>in</strong>, D.W.Erikson, P., 1960. The evaluation of <strong>for</strong>ages by the Agronomic “difference” method <strong>and</strong> chromogen chromicoxide “<strong>in</strong>dicator” technique. N.D. Agric. Exp. Stn. Techn. Bull.426, 55 pp.Cho C.Y., Sl<strong>in</strong>ger,S.J., Bayley, M.S.,1982. Bioenergetics of salmonid fishes; energy <strong>in</strong>take, expenditure <strong>and</strong> productivity.Comp.Biochem.Physiol.73B, 25-41.De la Higuera, M., Garcia-Gallego, M., Sanz, A., Cardenete, G., Suarez, M. D., Moyano, F. J. 1988. Evaluation of lup<strong>in</strong> seed meal asan alternative prote<strong>in</strong> source <strong>in</strong> feed<strong>in</strong>g of ra<strong>in</strong>bow trout (Salmo gairdneri). Aquaculture 71, 37-50.Eusebio, P.S., Coloso R.M., 2000. Nutritional evaluation of various plant prote<strong>in</strong> sources <strong>in</strong> <strong>diets</strong> <strong>for</strong> Asian sea bass Lates calcarifer.J. Appl. Ichthyol. 16, 546-560.Eusebio, P.S., 1991. Effect of dehull<strong>in</strong>g on the nutritive value of some legum<strong>in</strong>ous seeds as prote<strong>in</strong> <strong>for</strong> tiger prawn, Penaeus monodonjuveniles. Aquaculture 99, 297-308.Farhangi, M., Carter, G., 2001. Growth, physiological <strong>and</strong> immunological responses of ra<strong>in</strong>bow trout (Oncorhynchus mykiss) todifferent dietary <strong>in</strong>clusion levels of dehulled lup<strong>in</strong> (Lup<strong>in</strong>us angustifolius). Aquacult. Res. 32(Suppl.1), 329-340.Gomes, E. F., Corraze, G., Kaushik, S., 1993. Effects of dietary <strong>in</strong>corporation of a co-extruded plant prote<strong>in</strong> (rapeseed <strong>and</strong> peas) ongrowth, nutrient utilization <strong>and</strong> muscle fatty acid composition of ra<strong>in</strong>bow trout (Oncorhynchus mykiss). Aquaculture 113, 339-353.Gomes, E. F., Rema, P., Kaushik, S. J., 1995. Replacement of fish meal by plant prote<strong>in</strong>s <strong>in</strong> the diet of ra<strong>in</strong>bow trout (Oncorhynchusmykiss): digestibility <strong>and</strong> growth per<strong>for</strong>mance. Aquaculture 130, 177-186.Gouveia, A., Davies, S. J., 1998. Prelim<strong>in</strong>ary nutritional evaluation of pea seed meal (Pisum sativum) <strong>for</strong> juvenile European sea bass(Dicentrarchus labrax). Aquaculture 166, 311-320.Gouveia, A., Oliva Teles, A., Gomes, E., Rema, P., 1993. Effect of cook<strong>in</strong>g/expansion of three legume seeds on growth <strong>and</strong> foodutilization by ra<strong>in</strong>bow trout. In: Kaushik, S. J., Luquet, P. (Eds.), Fish Nutrition <strong>in</strong> Practice, INRA, Paris, pp.933-938.Hardy, R. W., 1996. Alternative prote<strong>in</strong> sources <strong>for</strong> salmon <strong>and</strong> trout <strong>diets</strong>. Anim. <strong>Feed</strong> Sci. Technol. 59, 71-80.Kaushik, S. J., Cravedi, J. P., Lalles, J. P., Sumpter, J., Fauconneau, B., Laroche, M., 1995. Partial or total replacement of fish mealby soybean prote<strong>in</strong> on growth, prote<strong>in</strong> utilization, potential estrogenic or antigenic effects, cholesterolemia <strong>and</strong> flesh qualitry <strong>in</strong>ra<strong>in</strong>bow trout. Oncorhynchus mykiss. Aquaculture 133, 257-274.Kissil, G. Wm., Lupatsch, I., Higgs, D. A. <strong>and</strong> Hardy, R. W. 2000. Dietary substitution of soy <strong>and</strong> rapeseed prote<strong>in</strong> concentrate <strong>for</strong> fishmeal, <strong>and</strong> their effects on growth <strong>and</strong> nutrient utilization <strong>in</strong> gilthead seabream, Sparus aurata L. Aquacult. Res. 31, 595-601.Moyano, F. J., Cardenete, G., De la Higuera, M., 1992. Nutritive value of <strong>diets</strong> conta<strong>in</strong><strong>in</strong>g a high pecentage of vegetable prote<strong>in</strong> <strong>for</strong>trout, Oncorhynchus mykiss. Aquat. Liv<strong>in</strong>g Resour. 5, 23-29.NRC, 1993. Nutrient Requirements of Fish. National Academy Press, Wash<strong>in</strong>gton, DC.Oliva-Teles, A., Gouveia, A. J., Gomes, E., Rema, P. 1994. The effect of different process<strong>in</strong>g treatments on soybean meal utilizationby ra<strong>in</strong>bow trout, Oncorhynchus mykiss. Aquaculture 124, 343-349.Pfeffer, E., K<strong>in</strong>z<strong>in</strong>ger, S., Rodehutscord, M., 1995. Influence of the proportion of poultry slaughter by-products <strong>and</strong> of untreated orhydrothermically treated legume seeds <strong>in</strong> <strong>diets</strong> <strong>for</strong> ra<strong>in</strong>bow trout, Oncorhynchus mykiss (Walbaum), on apparent digestibilities oftheir energy <strong>and</strong> organic compounds. Aquacult. Nutr. 1, 111-117.Pongmaneerat, J., Watanabe, T., 1993. Effect of extrusion process<strong>in</strong>g on the utilization of soybean meal <strong>diets</strong> <strong>for</strong> ra<strong>in</strong>bow trout,Nippon Suisan Gakkaishi 59, 1407-1414.Refstie, S., Storebakken, T., Roem, A. J., 1998. <strong>Feed</strong> consumption <strong>and</strong> conversion <strong>in</strong> Atlantic salmon (Salmo salar) fed <strong>diets</strong> with fishmeal, extracted soybean or soybean meal with reduced content of oligosaccharides, tryps<strong>in</strong> <strong>in</strong>hibitors, lect<strong>in</strong>s <strong>and</strong> soya antigens.Aquaculture 162, 301-312.Roba<strong>in</strong>a, L., Moyano, F. J., Izquierdo, M. S., Socorro, J., Vergara, J. M., Montero, D. 1997. Corn gluten <strong>and</strong> meat <strong>and</strong> bone meal asprote<strong>in</strong> sources <strong>in</strong> <strong>diets</strong> <strong>for</strong> gilthead seabream (Sparus aurata): Nutritional <strong>and</strong> histological implications. Aquaculture 157, 347-359.Sanz, A., Morales, A. E., De la Higuera, M., Cardenate, G. 1994. Sunflower meal compared with soybean meal as partial substitutes<strong>for</strong> fish meal <strong>in</strong> ra<strong>in</strong>bow trout (Oncorhynchus mykiss) <strong>diets</strong>-prote<strong>in</strong> <strong>and</strong> energy utilization. Aquaculture 128, 287-300.Spyridakis,P., Metailler, R; Gabaudan,J., Riaza, A., 1989. Studies on nutrient digestibility <strong>in</strong> European sea bass (Dicentrarchuslabrax). I. Methodological aspects concern<strong>in</strong>g feces collection. Aquaculture 77, 61-70.Simpson, R. J., Neuberger, M. R., Liu, T. Y. 1976. Complete am<strong>in</strong>o acid analysis of prote<strong>in</strong> from s<strong>in</strong>gle hydrolysate. J. Biol. Chem.251, 1936-1940.Strickl<strong>and</strong>, J. D. H., Parsons, T. R. 1972. A Practical H<strong>and</strong>book of Seawater Analysis. In: Stevensons, J. C. (ed). Fisheries ResearchBoard Canada, Canada Department of Fisheries <strong>and</strong> Oceans, Ottawa, Canada.Sumagaysay, N. S., Borlongan, I. G. 1995. Growth <strong>and</strong> production of <strong>milkfish</strong> (Chanos chanos) <strong>in</strong> brackishwater ponds: Effects ofdietary prote<strong>in</strong> <strong>and</strong> feed<strong>in</strong>g levels. Aquaculture 132, 273-284.Sumagaysay, N. S., Marquez, F. E., Chiu-Chern, Y.N., 1991. Evaluation of different supplemental feeds <strong>for</strong> <strong>milkfish</strong> (Chanos chanos)reared <strong>in</strong> brackishwater ponds. Aquaculture 93,177-189.Tacon, A. G. J., 1997. Fishmeal replacers: Review of ant<strong>in</strong>utrients with<strong>in</strong> oilseeds <strong>and</strong> pulses- a limit<strong>in</strong>g factor <strong>for</strong> the aquafeed greenrevolution? In: Tacon, A., Basurca, B. (Eds.), <strong>Feed</strong><strong>in</strong>g Tomorrow’s Fish. Cashiers Options Méditerranéenes, Vol. 22, pp.154-182.Watanabe, T., Verakunpiriya, V., Watanabe, K., Kiron, V., Satoh, S. 1997. <strong>Feed</strong><strong>in</strong>g of ra<strong>in</strong>bow trout with non-fish meal <strong>diets</strong>.Fisheries Science 63(2), 258-266.26
USA Dry Pea& Lentil CouncilHead Office2780 W. Pullman Rd.Moscow, Idaho, 83843-8024 USATel: 208-882-3023 Fax: (208) 882-6406;E-mail: pulse@pea-lentil.comWeb: www.pulse.comSoutheast Asia RepresentativeAttention: Mr. Tim WelshAgriSource Co. Ltd.76/1 Soi Lang Suan, Ploenchit Rd.Bangkok 10330 Thail<strong>and</strong>Tel: 66-2-251-8655 to 6 Fax: 66-2-251-0390Email: agsource@lox<strong>in</strong>fo.co.thSoutheast Asian Fisheries Development CenterAquaculture DepartmentTigbauan, Iloilo 5021 Philipp<strong>in</strong>esTel: (6333) 362965 Fax: (6333) 3351008E-mail: clmarte@aqd.seafdec.org.phWeb: www.seafdec.org.ph