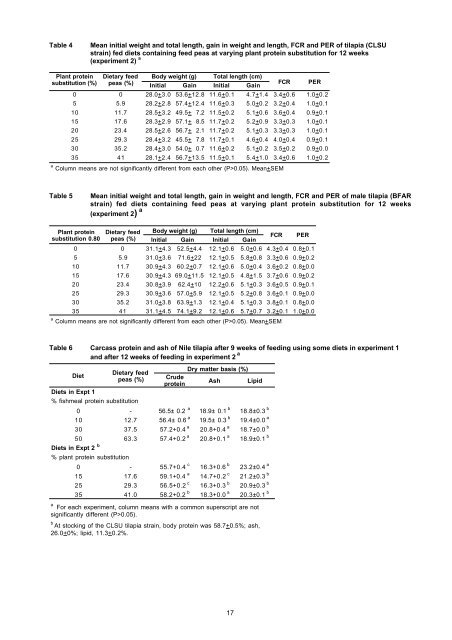
Table 4Mean <strong>in</strong>itial weight <strong>and</strong> total length, ga<strong>in</strong> <strong>in</strong> weight <strong>and</strong> length, FCR <strong>and</strong> PER of <strong>tilapia</strong> (CLSUstra<strong>in</strong>) fed <strong>diets</strong> conta<strong>in</strong><strong>in</strong>g feed peas at vary<strong>in</strong>g plant prote<strong>in</strong> substitution <strong>for</strong> 12 weeks(experiment 2) aPlant prote<strong>in</strong> Dietary feed Body weight (g) Total length (cm)substitution (%) peas (%) Initial Ga<strong>in</strong> Initial Ga<strong>in</strong>FCR PER0 0 28.0+3.0 53.6+12.8 11.6+0.1 4.7+1.4 3.4+0.6 1.0+0.25 5.9 28.2+2.8 57.4+12.4 11.6+0.3 5.0+0.2 3.2+0.4 1.0+0.110 11.7 28.5+3.2 49.5+ 7.2 11.5+0.2 5.1+0.6 3.6+0.4 0.9+0.115 17.6 28.3+2.9 57.1+ 8.5 11.7+0.2 5.2+0.9 3.3+0.3 1.0+0.120 23.4 28.5+2.6 56.7+ 2.1 11.7+0.2 5.1+0.3 3.3+0.3 1.0+0.125 29.3 28.4+3.2 45.5+ 7.8 11.7+0.1 4.6+0.4 4.0+0.4 0.9+0.130 35.2 28.4+3.0 54.0+ 0.7 11.6+0.2 5.1+0.2 3.5+0.2 0.9+0.035 41 28.1+2.4 56.7+13.5 11.5+0.1 5.4+1.0 3.4+0.6 1.0+0.2a Column means are not significantly different from each other (P>0.05). Mean+SEMTable 5Mean <strong>in</strong>itial weight <strong>and</strong> total length, ga<strong>in</strong> <strong>in</strong> weight <strong>and</strong> length, FCR <strong>and</strong> PER of male <strong>tilapia</strong> (BFARstra<strong>in</strong>) fed <strong>diets</strong> conta<strong>in</strong><strong>in</strong>g feed peas at vary<strong>in</strong>g plant prote<strong>in</strong> substitution <strong>for</strong> 12 weeks(experiment 2) aPlant prote<strong>in</strong> Dietary feed Body weight (g) Total length (cm)substitution 0.80 peas (%) Initial Ga<strong>in</strong> Initial Ga<strong>in</strong>FCR PER0 0 31.1+4.3 52.5+4.4 12.1+0.6 5.0+0.6 4.3+0.4 0.8+0.15 5.9 31.0+3.6 71.6+22 12.1+0.5 5.8+0.8 3.3+0.6 0.9+0.210 11.7 30.9+4.3 60.2+0.7 12.1+0.6 5.0+0.4 3.6+0.2 0.8+0.015 17.6 30.9+4.3 69.0+11.5 12.1+0.5 4.8+1.5 3.7+0.6 0.9+0.220 23.4 30.8+3.9 62.4+10 12.2+0.6 5.1+0.3 3.6+0.5 0.9+0.125 29.3 30.9+3.6 57.0+5.9 12.1+0.5 5.2+0.8 3.6+0.1 0.9+0.030 35.2 31.0+3.8 63.9+1.3 12.1+0.4 5.1+0.3 3.8+0.1 0.8+0.035 41 31.1+4.5 74.1+9.2 12.1+0.6 5.7+0.7 3.2+0.1 1.0+0.0a Column means are not significantly different from each other (P>0.05). Mean+SEMTable 6 Carcass prote<strong>in</strong> <strong>and</strong> ash of Nile <strong>tilapia</strong> after 9 weeks of feed<strong>in</strong>g us<strong>in</strong>g some <strong>diets</strong> <strong>in</strong> experiment 1<strong>and</strong> after 12 weeks of feed<strong>in</strong>g <strong>in</strong> experiment 2 aDietDiets <strong>in</strong> Expt 1Dietary feedpeas (%)% fishmeal prote<strong>in</strong> substitutionCrudeprote<strong>in</strong>AshLipid0 - 56.5± 0.2 a 18.9± 0.1 b 18.8±0.3 b10 12.7 56.4± 0.6 a 19.5± 0.3 b 19.4±0.0 a30 37.5 57.2+0.4 a 20.8+0.4 a 18.7±0.0 b50 63.3 57.4+0.2 a 20.8+0.1 a 18.9±0.1 bDiets <strong>in</strong> Expt 2 b% plant prote<strong>in</strong> substitutionDry matter basis (%)0 - 55.7+0.4 c 16.3+0.6 b 23.2±0.4 a15 17.6 59.1+0.4 a 14.7+0.2 c 21.2±0.3 b25 29.3 56.5+0.2 c 16.3+0.3 b 20.9±0.3 b35 41.0 58.2+0.2 b 18.3+0.0 a 20.3±0.1 baFor each experiment, column means with a common superscript are notsignificantly different (P>0.05).bAt stock<strong>in</strong>g of the CLSU <strong>tilapia</strong> stra<strong>in</strong>, body prote<strong>in</strong> was 58.7+0.5%; ash,26.0+0%; lipid, 11.3+0.2%.17
Table 7Apparent dry matter digestibility (ADMD) <strong>and</strong> prote<strong>in</strong> digestibility (APD) of <strong>diets</strong> with peas <strong>in</strong>juvenile male <strong>tilapia</strong> (CLSU stra<strong>in</strong>)DigestibilitytrialsDietary feedpeas (%)Trial us<strong>in</strong>g <strong>diets</strong> <strong>in</strong> Expt 1% fishmeal prote<strong>in</strong> substitutionADMD (%) aAPD (%) a0 0 72.1± 0.6 c 92.5± 0.4 a10 12.7 75.6± 0.4 b 90.5± 0.4 b30 37.5 77.8+1.1 ab 91.5+0.7 ab50 63.3 78.8+0.6 a 92.0+0.2 abTrial us<strong>in</strong>g <strong>diets</strong> <strong>in</strong> Expt 2% plant prote<strong>in</strong> substitution0 0 74.1+0.2 b 90.6+0.3 a15 17.6 73.4+0.59 b 91.5+0.3 a25 29.3 76.2+0.67 a 91.2+0.3 a35 41 76.9+0.42 a 91.6+0.3 aa For each digestibility trial, column means with a commonsuperscript are not significantly different (P>0.05).Table 8Digestibility coefficients (%) <strong>for</strong> P. sativum <strong>in</strong> different fish speciesFish Dry matter Prote<strong>in</strong> Energy ReferenceRa<strong>in</strong>bow trout, 52 g 66.1 80.4 59.2 Gomes et al. (1995)Ra<strong>in</strong>bow trout, 100g 66.3 87.9 68.9 Burel et al. (2000)Turbot, 110 g 71.5 92.9 77.7 Burel et al. (2000)Silver perch 51.0 81.0 51.0 Allan et al. (2000)Nile <strong>tilapia</strong>, 38 g 69.3 87.2 no data present studyAcknowledgementsThis study was funded by the US Department of Agriculture <strong>and</strong> sponsored by the USA Dry Pea <strong>and</strong> LentilCouncil. <strong>Feed</strong>s <strong>and</strong> fish samples were analyzed by the staff of the Central Analytical Laboratory ofSEAFDEC AQD, Tigbauan, Iloilo or the Animal Nutrition Analytical Service Laboratory, University of thePhilipp<strong>in</strong>es Los Baños, Laguna.ReferencesAllan, G.L., Park<strong>in</strong>son, S., Booth, M.A., Stone, D.A.J, Rowl<strong>and</strong> S.J., Frances, J., Warner-Smith, R., 2000. Replacement of fish meal <strong>in</strong><strong>diets</strong> <strong>for</strong> Australian silver perch, Bidyanus bidyanus: 1. Digestibility of alternative <strong>in</strong>gredients. Aquaculture 186, 293-310.Association of Official Analytical Chemists (AOAC), 1990. Official Methods of Analysis, 15th edn. AOAC, Arl<strong>in</strong>gton, VA, 1228 pp.Bond, D.A., Duc, G., 1993. Plant breed<strong>in</strong>g as a means of reduc<strong>in</strong>g ant<strong>in</strong>utritional factors <strong>in</strong> gra<strong>in</strong> legumes. In: van der Poel, A.F.B.,Huisman, J., Sa<strong>in</strong>i, H.S. (Eds.), Second International Workshop on Ant<strong>in</strong>utritional Factors (ANFs) <strong>in</strong> Legume Seeds, RecentAdvances of Research <strong>in</strong> Ant<strong>in</strong>utritional Factors <strong>in</strong> Legume Seeds, 1-2 December 1993, EAAP Publication, The Netherl<strong>and</strong>s, pp.379-396.Burel C., Boujard, T., Tulli, F., Kaushik, S.J., 2000. Digestibility of extruded peas, extruded lup<strong>in</strong>, <strong>and</strong> rapeseed meal <strong>in</strong> ra<strong>in</strong>bow trout(Oncorhynchus mykiss) <strong>and</strong> turbot (Psetta maxima). Aquaculture 188, 285-298.Carter, J.F., Bol<strong>in</strong>, D.W., Erikson, P., 1960. The evaluation of <strong>for</strong>ages by the Agronomic “difference” method <strong>and</strong> chromogen chromicoxide “<strong>in</strong>dicator” technique. N.D. Agric. Exp. Stn., Techn. Bull. 426, 55 pp.Carter, C.G., Hauler, R.C., 2000. Fish meal replacement by plant meals <strong>in</strong> extruded feeds <strong>for</strong> Atlantic salmon, Salmo salar L.Aquaculture 185, 299-311.Cho, C.Y., Sl<strong>in</strong>ger, S.J., Bayley, M.S., 1982. Bioenergetics of salmonid fishes: energy <strong>in</strong>take, expenditure <strong>and</strong> productivity. Comp.Biochem. Physiol. 73B, 25-41.De Silva, S.S., Keembiyahetty, C.N., Gunasekera, R.M., 1988. Plant <strong>in</strong>gredient substitutes <strong>in</strong> Oreochromis niloticus (L.) <strong>diets</strong>:Ingredient digestibility <strong>and</strong> effect of dietary prote<strong>in</strong> content on digestibility. J. Aqua. Trop. 3, 127-138.El-Sayed, A.-F. M., 1999. Alternative dietary prote<strong>in</strong> sources <strong>for</strong> farmed <strong>tilapia</strong>, Oreochromis spp. Aquaculture 179, 149-168.Eusebio, P., 1991. Effect of dehull<strong>in</strong>g on the nutritive value of some legum<strong>in</strong>ous seeds as prote<strong>in</strong> sources <strong>for</strong> tiger prawn (Penaeusmonodon) juveniles. Aquaculture 99, 297-308.Eusebio, P.S., Coloso, R.M., 2000. Nutritional evaluation of various plant prote<strong>in</strong> sources <strong>in</strong> <strong>diets</strong> <strong>for</strong> Asian sea bass Lates calcarifer.J. Appl. Ichthyol. 16, 56-60.Gerpacio, A.L., Castillo, L.S., 1979. Nutrient Composition of Some Philipp<strong>in</strong>e <strong>Feed</strong>stuffs. Technical Bullet<strong>in</strong> 21, Extension Division,Department of Animal Science, University of the Philipp<strong>in</strong>es at Los Baños, Philipp<strong>in</strong>es, 117 pp.Gomes, E.F., Rema, P., Kaushik, S.J., 1995. Replacement of fish meal by plant prote<strong>in</strong>s <strong>in</strong> the diet of ra<strong>in</strong>bow trout (Oncorhynchusmykiss): digestibility <strong>and</strong> growth per<strong>for</strong>mance. Aquaculture 130, 177-186.Gouveia, A., Oliva Teles, A., Gones, E., Rema, P., 1993. Effect of cook<strong>in</strong>g/expansion of three legume seeds on growth <strong>and</strong> foodutilization by ra<strong>in</strong>bow trout. In: Fish Nutrition <strong>in</strong> Practice, Biarritz (France), June 24-27, 1991. Ed. INRA, Paris (Les Colloques,no61), pp. 933-938.Gouveia A., Davies, S.J., 1998. Prelim<strong>in</strong>ary nutritional evaluation of pea seed meal (Pisum sativum) <strong>for</strong> juvenile European sea bass(Dicentrarchus labrax). Aquaculture 166, 311-320.18