of compet<strong>in</strong>g prote<strong>in</strong> sources. The digestibility of the peas is also considered <strong>in</strong> evaluat<strong>in</strong>g its potential as aprote<strong>in</strong> source. In the present study, the digestibility coefficients <strong>for</strong> feed peas <strong>in</strong> Nile <strong>tilapia</strong> are comparableto those reported <strong>for</strong> other freshwater fishes (Table 8). The highest digestibility coefficients <strong>for</strong> P. sativumwere obta<strong>in</strong>ed <strong>in</strong> turbot, a mar<strong>in</strong>e species. In a companion study, the crude prote<strong>in</strong> digestibility of feed peas<strong>in</strong> <strong>milkfish</strong> was also higher (92%) than <strong>in</strong> <strong>tilapia</strong>; however, dry matter digestibility was lower (I. Borlongan,personal communication 2002). Allan et al. (2000) determ<strong>in</strong>ed the digestibility of peas <strong>and</strong> other <strong>in</strong>gredients<strong>in</strong> silver perch as well as that of am<strong>in</strong>o acids <strong>in</strong> the <strong>in</strong>gredients. The prote<strong>in</strong> digestibility of the <strong>in</strong>gredientswas a reflection of the availability of am<strong>in</strong>o acids <strong>in</strong> silver perch. A few exceptions were the animal prote<strong>in</strong>sources <strong>and</strong> some oilseed meals whose prote<strong>in</strong>s may have been damaged dur<strong>in</strong>g process<strong>in</strong>g (Allan et al.,2000). Moreover, the apparent energy digestibility of peas as <strong>in</strong>gredient <strong>in</strong> some fish species (Table 8)could also reflect carbohydrate digestibility <strong>in</strong> the fish. This is because peas conta<strong>in</strong> much higher amountsof carbohydrate than lipid (Muehlbauer <strong>and</strong> Tullu, 1997; <strong>Pulse</strong> Canada, 1999a; Racz, 1999) <strong>and</strong> the prote<strong>in</strong>digestibility coefficients <strong>for</strong> peas <strong>in</strong> different fish species (Table 8) are close. Moreover, the apparent energydigestibility coefficients reported <strong>for</strong> peas as <strong>in</strong>gredient are near the values <strong>for</strong> the carbohydrate digestibilityof soybean meal (54%), wheat gra<strong>in</strong> (61%), <strong>and</strong> uncooked corn starch (55-61%) <strong>in</strong> blue <strong>tilapia</strong> (0. aureus)(NRC, 1993).In<strong>for</strong>mation on the use of P. sativum <strong>in</strong> fish <strong>diets</strong> is limited. Gomes et al. (1995) used feed pea at very a lowlevel (4% of the diet) together with other plant <strong>in</strong>gredients (faba bean meal, maize gluten, full-fat soybean,<strong>and</strong> a co-extruded mixture of peas <strong>and</strong> rapeseed) to partially substitute fish meal <strong>in</strong> ra<strong>in</strong>bow trout diet. In astudy by Gouveia et al. (1993), pea seed meal was used at 38.2% of the diet (20% of the dietary prote<strong>in</strong>) ofra<strong>in</strong>bow trout with or without cook<strong>in</strong>g/expansion (145 º C, 25 kg per cm 2 ). The thermal treatment slightlyimproved the nutritional value of the <strong>diets</strong> conta<strong>in</strong><strong>in</strong>g the peas. In another study, there was a significantdecrease <strong>in</strong> the prote<strong>in</strong> digestibility of the diet when the pea (P. sativum) <strong>in</strong> the diet of ra<strong>in</strong>bow trout<strong>in</strong>creased from 25–50% (Pfeffer et al., 1995). Furthermore, the digestibility of the <strong>diets</strong> conta<strong>in</strong><strong>in</strong>g either 25or 50% peas <strong>in</strong>creased significantly when the peas were autoclaved. APD coefficients of ra<strong>in</strong>bow trout <strong>diets</strong>conta<strong>in</strong><strong>in</strong>g 25% feed peas <strong>in</strong>creased from 86-91% when the peas had pre-treatment. For <strong>diets</strong> conta<strong>in</strong><strong>in</strong>g50% peas, APD <strong>in</strong>creased from 83-86% when the peas were autoclaved (Pfeffer et al., 1995). In asubsequent study by Gouveia et al. (1998) on European sea bass (D. labrax), fishmeal-based <strong>diets</strong>conta<strong>in</strong><strong>in</strong>g 20 <strong>and</strong> 40% pea had APD coefficients of 88-89%. In the present study, the APD coefficients ofthe <strong>tilapia</strong> <strong>diets</strong> conta<strong>in</strong><strong>in</strong>g feed pea were high (90.5-92%) <strong>and</strong> were practically not affected by the dietarylevel of peas. This suggests that feed pea <strong>and</strong> the <strong>in</strong>gredients it replaced had similar prote<strong>in</strong> digestibility.The whole peas with hulls were simply dried <strong>and</strong> ground. The digestibility of dehulled peas would mostlikely be higher <strong>in</strong> <strong>tilapia</strong> s<strong>in</strong>ce dehull<strong>in</strong>g removes most of the fiber of <strong>in</strong>gredients (Eusebio, 1991). Whencompared to other feedstuffs tested <strong>in</strong> <strong>tilapia</strong>, feed pea has APD coefficient that is comparable to that of fishmeal (Hanley, 1987; NRC, 1993; Jauncey, 1998). However, it is slightly lower than the prote<strong>in</strong> digestibilityvalues reported <strong>for</strong> soybean meal (91-94%) <strong>in</strong> <strong>tilapia</strong> species (Hanley, 1987; Lim, 1987; Luquet 1991; NRC,1993).The prote<strong>in</strong> content of feed peas is close to that of copra (coconut) meal, some cereal gra<strong>in</strong> by-products,brewers' gra<strong>in</strong>s, <strong>and</strong> leaf meals (Gerpacio <strong>and</strong> Castillo, 1979; Hanley, 1987; Tacon, 1987; NRC, 1993;Hertrampf <strong>and</strong> Piedad-Pascual, 2000). The relatively low prote<strong>in</strong> content of feed peas compared to fishmeal would limit the amount that could be <strong>in</strong>corporated <strong>in</strong> the <strong>diets</strong> of fish that require high prote<strong>in</strong> levels.However, feed peas could be used as one of the <strong>in</strong>gredients that would collectively replace fish meal <strong>in</strong> apractical diet. <strong>Feed</strong> peas could also replace other plant prote<strong>in</strong> sources, as shown <strong>in</strong> the present study,especially when its cost is competitive. <strong>Feed</strong> peas conta<strong>in</strong> high levels of lys<strong>in</strong>e (<strong>Pulse</strong> Canada, 1999a;Racz, 1999) which could complement the am<strong>in</strong>o acids of other fishmeal substitutes that are deficient <strong>in</strong>lys<strong>in</strong>e (e.g. canola meal <strong>and</strong> gluten meals). However, as <strong>in</strong> soybean meal <strong>and</strong> other legume seeds, thesulfur am<strong>in</strong>o acids (methion<strong>in</strong>e <strong>and</strong> cyst<strong>in</strong>e) are low <strong>and</strong> could be the first limit<strong>in</strong>g am<strong>in</strong>o acids when highamounts of plant prote<strong>in</strong> sources are used. For fish requir<strong>in</strong>g high dietary prote<strong>in</strong>, pea prote<strong>in</strong> concentrate(49% crude prote<strong>in</strong>) has been explored as a possible partial replacement of fish meal (Carter <strong>and</strong> Hauler,2000). Up to 27% pea prote<strong>in</strong> concentrate <strong>in</strong> the extruded feed did not affect growth of salmon parr. Cowpea (Vigna unguiculata) prote<strong>in</strong> concentrate was also tested <strong>in</strong> Nile <strong>tilapia</strong> fry <strong>and</strong> up to 40% <strong>in</strong>clusion level<strong>in</strong> the diet gave acceptable results (Olvera-Novoa et al., 1997).One important concern <strong>in</strong> the use of pulses as <strong>in</strong>gredients <strong>in</strong> aqua feeds is the presence of anti-nutritionalfactors (Tacon, 1987; Hertrampf <strong>and</strong> Piedad-Pascual, 2000). However, through genetic selection, presentpea varieties conta<strong>in</strong> no tann<strong>in</strong>s <strong>and</strong> only low levels of tryps<strong>in</strong> <strong>in</strong>hibitors <strong>and</strong> lect<strong>in</strong>s (Bond <strong>and</strong> Duc, 1993)that can be deactivated by heat treatment (Melcion <strong>and</strong> van del Poel, 1993). <strong>Pulse</strong>s are produced ma<strong>in</strong>ly <strong>for</strong>their mature seeds <strong>and</strong> immature pods <strong>for</strong> human consumption (Muehlbauer <strong>and</strong> Tullu, 1997), unlikesoybean <strong>and</strong> other oilseeds that are grown ma<strong>in</strong>ly <strong>for</strong> process<strong>in</strong>g <strong>in</strong>to edible oils <strong>and</strong> prote<strong>in</strong> concentrates.With the expansion of production of feed peas as human food <strong>and</strong> animal feed (<strong>Pulse</strong> Canada, 1999b),more peas would be available <strong>in</strong> the market.15
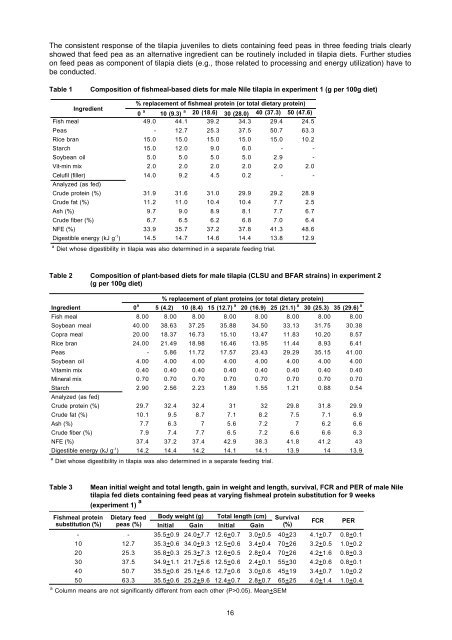
The consistent response of the <strong>tilapia</strong> juveniles to <strong>diets</strong> conta<strong>in</strong><strong>in</strong>g feed peas <strong>in</strong> three feed<strong>in</strong>g trials clearlyshowed that feed pea as an alternative <strong>in</strong>gredient can be rout<strong>in</strong>ely <strong>in</strong>cluded <strong>in</strong> <strong>tilapia</strong> <strong>diets</strong>. Further studieson feed peas as component of <strong>tilapia</strong> <strong>diets</strong> (e.g., those related to process<strong>in</strong>g <strong>and</strong> energy utilization) have tobe conducted.Table 1Composition of fishmeal-based <strong>diets</strong> <strong>for</strong> male Nile <strong>tilapia</strong> <strong>in</strong> experiment 1 (g per 100g diet)% replacement of fishmeal prote<strong>in</strong> (or total dietary prote<strong>in</strong>)Ingredient0 a 10 (9.3) a 20 (18.6) 30 (28.0) 40 (37.3) 50 (47.6)aFish meal 49.0 44.1 39.2 34.3 29.4 24.5<strong>Peas</strong> - 12.7 25.3 37.5 50.7 63.3Rice bran 15.0 15.0 15.0 15.0 15.0 10.2Starch 15.0 12.0 9.0 6.0 - -Soybean oil 5.0 5.0 5.0 5.0 2.9 -Vit-m<strong>in</strong> mix 2.0 2.0 2.0 2.0 2.0 2.0Celufil (filler) 14.0 9.2 4.5 0.2 - -Analyzed (as fed)Crude prote<strong>in</strong> (%) 31.9 31.6 31.0 29.9 29.2 28.9Crude fat (%) 11.2 11.0 10.4 10.4 7.7 2.5Ash (%) 9.7 9.0 8.9 8.1 7.7 6.7Crude fiber (%) 6.7 6.5 6.2 6.8 7.0 6.4NFE (%) 33.9 35.7 37.2 37.8 41.3 48.6Digestible energy (kJ g -1 ) 14.5 14.7 14.6 14.4 13.8 12.9a Diet whose digestibility <strong>in</strong> <strong>tilapia</strong> was also determ<strong>in</strong>ed <strong>in</strong> a separate feed<strong>in</strong>g trial.Table 2 Composition of plant-based <strong>diets</strong> <strong>for</strong> male <strong>tilapia</strong> (CLSU <strong>and</strong> BFAR stra<strong>in</strong>s) <strong>in</strong> experiment 2(g per 100g diet)% replacement of plant prote<strong>in</strong>s (or total dietary prote<strong>in</strong>)Ingredient 0 a 5 (4.2) 10 (8.4) 15 (12.7) a 20 (16.9) 25 (21.1) a 30 (25.3) 35 (29.6) aFish meal 8.00 8.00 8.00 8.00 8.00 8.00 8.00 8.00Soybean meal 40.00 38.63 37.25 35.88 34.50 33.13 31.75 30.38Copra meal 20.00 18.37 16.73 15.10 13.47 11.83 10.20 8.57Rice bran 24.00 21.49 18.98 16.46 13.95 11.44 8.93 6.41<strong>Peas</strong> - 5.86 11.72 17.57 23.43 29.29 35.15 41.00Soybean oil 4.00 4.00 4.00 4.00 4.00 4.00 4.00 4.00Vitam<strong>in</strong> mix 0.40 0.40 0.40 0.40 0.40 0.40 0.40 0.40M<strong>in</strong>eral mix 0.70 0.70 0.70 0.70 0.70 0.70 0.70 0.70Starch 2.90 2.56 2.23 1.89 1.55 1.21 0.88 0.54Analyzed (as fed)Crude prote<strong>in</strong> (%) 29.7 32.4 32.4 31 32 29.8 31.8 29.9Crude fat (%) 10.1 9.5 8.7 7.1 8.2 7.5 7.1 6.9Ash (%) 7.7 6.3 7 5.6 7.2 7 6.2 6.6Crude fiber (%) 7.9 7.4 7.7 6.5 7.2 6.6 6.6 6.3NFE (%) 37.4 37.2 37.4 42.9 38.3 41.8 41.2 43Digestible energy (kJ g -1 ) 14.2 14.4 14.2 14.1 14.1 13.9 14 13.9a Diet whose digestibility <strong>in</strong> <strong>tilapia</strong> was also determ<strong>in</strong>ed <strong>in</strong> a separate feed<strong>in</strong>g trial.Table 3Mean <strong>in</strong>itial weight <strong>and</strong> total length, ga<strong>in</strong> <strong>in</strong> weight <strong>and</strong> length, survival, FCR <strong>and</strong> PER of male Nile<strong>tilapia</strong> fed <strong>diets</strong> conta<strong>in</strong><strong>in</strong>g feed peas at vary<strong>in</strong>g fishmeal prote<strong>in</strong> substitution <strong>for</strong> 9 weeks(experiment 1) aFishmeal prote<strong>in</strong> Dietary feed Body weight (g) Total length (cm) Survivalsubstitution (%) peas (%) Initial Ga<strong>in</strong> Initial Ga<strong>in</strong> (%)FCR PER- - 35.5+0.9 24.0+7.7 12.6+0.7 3.0+0.5 40+23 4.1+0.7 0.8+0.110 12.7 35.3+0.6 34.0+9.3 12.5+0.6 3.4+0.4 70+26 3.2+0.5 1.0+0.220 25.3 35.8+0.3 25.3+7.3 12.6+0.5 2.8+0.4 70+26 4.2+1.6 0.8+0.330 37.5 34.9+1.1 21.7+5.6 12.5+0.6 2.4+0.1 55+30 4.2+0.6 0.8+0.140 50.7 35.5+0.6 25.1+4.6 12.7+0.6 3.0+0.6 45+19 3.4+0.7 1.0+0.250 63.3 35.5+0.6 25.2+9.6 12.4+0.7 2.8+0.7 65+25 4.0+1.4 1.0+0.4a Column means are not significantly different from each other (P>0.05). Mean+SEM16