The results of the digestibility trial did not support the assumption of reduced prote<strong>in</strong> availability from feedpea. In the present study, dietary crude prote<strong>in</strong> digestibility values of the experimental <strong>diets</strong> were above80%. A comparison with the control diet supports the observation that pea prote<strong>in</strong> is well digested by<strong>milkfish</strong>. In fact, apparent prote<strong>in</strong> digestibility value was superior with the partial <strong>in</strong>clusion (10% of dietaryprote<strong>in</strong>) of this plant material compared to the control without feed pea. <strong>Feed</strong> pea at this level may onlyshow marg<strong>in</strong>al effects of anti-nutritional factors <strong>and</strong> limit<strong>in</strong>g am<strong>in</strong>o acids due to its relatively low content ofsuch compounds <strong>and</strong> its fairly good prote<strong>in</strong> biological value <strong>for</strong> fish nutrition. Another consequence of us<strong>in</strong>gfeed pea <strong>in</strong> place of soybean meal <strong>in</strong> the diet <strong>for</strong>mulation <strong>for</strong> <strong>milkfish</strong> is the reduction of bread flour <strong>in</strong> <strong>diets</strong>conta<strong>in</strong><strong>in</strong>g high levels of feed pea. This is because of the higher carbohydrate content of feed peacompared to soybean meal. At this <strong>in</strong>clusion level, <strong>in</strong> practical conditions, feed<strong>in</strong>g costs can be dramaticallydecreased.In general, feed pea meal proved to be an acceptable <strong>in</strong>gredient <strong>for</strong> consideration <strong>in</strong> practical <strong>diets</strong> <strong>for</strong>grower stage production of <strong>milkfish</strong>. Future work showed be directed towards evaluat<strong>in</strong>g extruded peaproducts where pre-gelat<strong>in</strong>ization of the starch would be possible, or test<strong>in</strong>g various pea prote<strong>in</strong>concentrates which have been processed to remove unwanted components such as fiber, tann<strong>in</strong>, etc.These products conta<strong>in</strong> much higher prote<strong>in</strong> levels that could be used to substitute <strong>in</strong>creas<strong>in</strong>g amounts offish meal <strong>in</strong> fish feed <strong>for</strong>mulations. Further studies are needed to f<strong>in</strong>d out the maximum <strong>in</strong>clusion level offeed pea us<strong>in</strong>g other <strong>in</strong>gredient process<strong>in</strong>g methods (e. g. dehull<strong>in</strong>g, autoclav<strong>in</strong>g, pressure cook<strong>in</strong>g, prote<strong>in</strong>concentrat<strong>in</strong>g, etc) <strong>and</strong> different types of pellet mak<strong>in</strong>g (e. g. extrusion); <strong>in</strong> consideration of the effect ofthese process<strong>in</strong>g methods on efficient utilization of essential nutrients by the fish.Previous experiments us<strong>in</strong>g cold-pressed pellets <strong>for</strong> Atlantic salmon suggested that 40% fish meal prote<strong>in</strong>replacement with pea or lup<strong>in</strong> prote<strong>in</strong> concentrate was feasible (Carter, 1998). Carter <strong>and</strong> Hauler (2000)confirmed that at least 33% fish meal prote<strong>in</strong> replacement with pea prote<strong>in</strong> concentrate was possible. Amajor problem <strong>in</strong> the use of plant meals is their relatively low prote<strong>in</strong> content. In the study of Carter <strong>and</strong>Hauler (2000), the prote<strong>in</strong> concentrates used were produced by air separation <strong>and</strong> resulted <strong>in</strong> lup<strong>in</strong> <strong>and</strong> peaconcentrates with 46% <strong>and</strong> 49% crude prote<strong>in</strong>, respectively. This represented an <strong>in</strong>crease of between 44<strong>and</strong> 133% over the prote<strong>in</strong> <strong>in</strong> the raw lup<strong>in</strong> <strong>and</strong> peas, respectively. Prote<strong>in</strong> at this level is comparable tosoybean meal, but still far lower than that <strong>in</strong> fish meal. Gouveia et al., (1993) compared the efficacy of threelegume seed meals, e. g., lup<strong>in</strong> seed meal (Lup<strong>in</strong>us albus), faba beans (V. faba) <strong>and</strong> pea seed meal (P.sativum) <strong>in</strong> a 3-month feed<strong>in</strong>g trial with juvenile ra<strong>in</strong>bow trout. They reported that trout per<strong>for</strong>med well on<strong>diets</strong> that had up to 20% of the prote<strong>in</strong> content be<strong>in</strong>g supplied by each of these <strong>in</strong>gredients. In fact, growth<strong>and</strong> feed utilization was superior with the partial <strong>in</strong>clusion of these plant materials. The <strong>in</strong>clusion of a coextrudedplant prote<strong>in</strong> made from rapeseed <strong>and</strong> field pea had no effect at up to 15% replacement of theprote<strong>in</strong>. However, at 45% <strong>in</strong>clusion, growth per<strong>for</strong>mance of ra<strong>in</strong>bow trout was significantly lower than thecontrol diet (Gomes et al., 1993). The low digestible energy from both raw <strong>and</strong> autoclaved field peas waspredicted to limit their use <strong>in</strong> ra<strong>in</strong>bow trout feeds (Pfeffer et al., 1995; Gouveia <strong>and</strong> Davies, 1998). Energydigestibility of legumes is considerably lower than <strong>for</strong> prote<strong>in</strong> due to their high carbohydrate content. Theuse of extrusion is important <strong>in</strong> <strong>in</strong>creas<strong>in</strong>g the nutrient availability of plant meals, especially <strong>in</strong> relation to<strong>in</strong>creas<strong>in</strong>g the amount of digestible energy available through greater gelat<strong>in</strong>ization of starch (Pongmaneerat<strong>and</strong> Watanabe, 1993).S<strong>in</strong>ce the objective of this study was to evaluate the direct nutritive value of feed peas, the experiment wascarried out <strong>in</strong> an <strong>in</strong>-door clear water flow-through system. However, experience shows that <strong>milkfish</strong> <strong>in</strong>ponds grow better than <strong>milkfish</strong> given the same feed under controlled laboratory conditions (Sumagaysay etal., 1991; Sumagaysay <strong>and</strong> Borlongan, 1995). It is expected that higher growth rates <strong>and</strong> better FCR <strong>and</strong>PER may result if the <strong>milkfish</strong> are reared <strong>in</strong> ponds. It is recommended that feed<strong>in</strong>g experiments us<strong>in</strong>g thebest <strong>diets</strong> be done under natural pond conditions <strong>and</strong> an economic assessment of the feed pea-basedfeeds be conducted.23
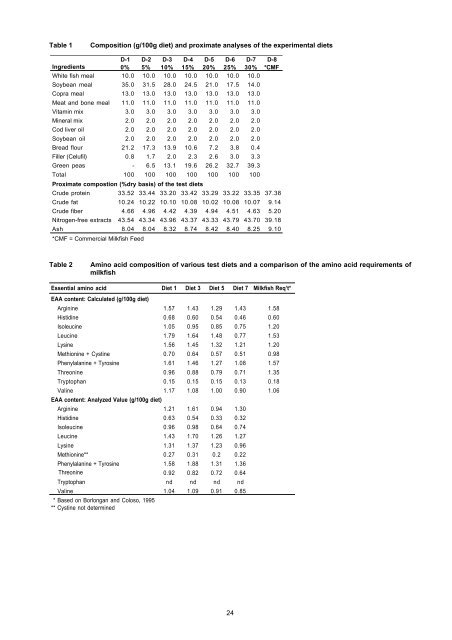
Table 1Composition (g/100g diet) <strong>and</strong> proximate analyses of the experimental <strong>diets</strong>D-1 D-2 D-3 D-4 D-5 D-6 D-7 D-8Ingredients0% 5% 10% 15% 20% 25% 30% *CMFWhite fish meal 10.0 10.0 10.0 10.0 10.0 10.0 10.0Soybean meal 35.0 31.5 28.0 24.5 21.0 17.5 14.0Copra meal 13.0 13.0 13.0 13.0 13.0 13.0 13.0Meat <strong>and</strong> bone meal 11.0 11.0 11.0 11.0 11.0 11.0 11.0Vitam<strong>in</strong> mix 3.0 3.0 3.0 3.0 3.0 3.0 3.0M<strong>in</strong>eral mix 2.0 2.0 2.0 2.0 2.0 2.0 2.0Cod liver oil 2.0 2.0 2.0 2.0 2.0 2.0 2.0Soybean oil 2.0 2.0 2.0 2.0 2.0 2.0 2.0Bread flour 21.2 17.3 13.9 10.6 7.2 3.8 0.4Filler (Celufil) 0.8 1.7 2.0 2.3 2.6 3.0 3.3Green peas - 6.5 13.1 19.6 26.2 32.7 39.3Total 100 100 100 100 100 100 100Proximate compostion (%dry basis) of the test <strong>diets</strong>Crude prote<strong>in</strong> 33.52 33.44 33.20 33.42 33.29 33.22 33.35 37.38Crude fat 10.24 10.22 10.10 10.08 10.02 10.08 10.07 9.14Crude fiber 4.66 4.96 4.42 4.39 4.94 4.51 4.63 5.20Nitrogen-free extracts 43.54 43.34 43.96 43.37 43.33 43.79 43.70 39.18Ash 8.04 8.04 8.32 8.74 8.42 8.40 8.25 9.10*CMF = Commercial Milkfish <strong>Feed</strong>Table 2Am<strong>in</strong>o acid composition of various test <strong>diets</strong> <strong>and</strong> a comparison of the am<strong>in</strong>o acid requirements of<strong>milkfish</strong>Essential am<strong>in</strong>o acid Diet 1 Diet 3 Diet 5 Diet 7 Milkfish Req’t*EAA content: Calculated (g/100g diet)Arg<strong>in</strong><strong>in</strong>e 1.57 1.43 1.29 1.43 1.58Histid<strong>in</strong>e 0.68 0.60 0.54 0.46 0.60Isoleuc<strong>in</strong>e 1.05 0.95 0.85 0.75 1.20Leuc<strong>in</strong>e 1.79 1.64 1.48 0.77 1.53Lys<strong>in</strong>e 1.56 1.45 1.32 1.21 1.20Methion<strong>in</strong>e + Cyst<strong>in</strong>e 0.70 0.64 0.57 0.51 0.98Phenylalan<strong>in</strong>e + Tyros<strong>in</strong>e 1.61 1.46 1.27 1.08 1.57Threon<strong>in</strong>e 0.96 0.88 0.79 0.71 1.35Tryptophan 0.15 0.15 0.15 0.13 0.18Val<strong>in</strong>e 1.17 1.08 1.00 0.90 1.06EAA content: Analyzed Value (g/100g diet)Arg<strong>in</strong><strong>in</strong>e 1.21 1.61 0.94 1.30Histid<strong>in</strong>e 0.63 0.54 0.33 0.32Isoleuc<strong>in</strong>e 0.96 0.98 0.64 0.74Leuc<strong>in</strong>e 1.43 1.70 1.26 1.27Lys<strong>in</strong>e 1.31 1.37 1.23 0.96Methion<strong>in</strong>e** 0.27 0.31 0.2 0.22Phenylalan<strong>in</strong>e + Tyros<strong>in</strong>e 1.58 1.88 1.31 1.36Threon<strong>in</strong>e 0.92 0.82 0.72 0.64Tryptophan nd nd nd ndVal<strong>in</strong>e 1.04 1.09 0.91 0.85* Based on Borlongan <strong>and</strong> Coloso, 1995** Cyst<strong>in</strong>e not determ<strong>in</strong>ed24