AP Lab 02 - Biology Lab Skills
AP Lab 02 - Biology Lab Skills
AP Lab 02 - Biology Lab Skills

You also want an ePaper? Increase the reach of your titles
YUMPU automatically turns print PDFs into web optimized ePapers that Google loves.
Name: ______________________________ <strong>AP</strong> <strong>Biology</strong> – <strong>Lab</strong> <strong>02</strong><br />
So back to our coin test… It is comparing our result to the expected distribution of a fair coin.<br />
To test the coin, you opt to flip it 50 times, tally the number of heads and tails, and compare<br />
your results to the fair coin distribution. Our (complete) null hypothesis would be as follows:<br />
H 0 : The coin is balanced properly and we would expect an even number of heads and<br />
tails when flipped repeatedly with 95% confidence.<br />
H a : The coin is not balanced properly and we would not expect an even number of<br />
heads and tails when flipped repeatedly with 95% confidence.<br />
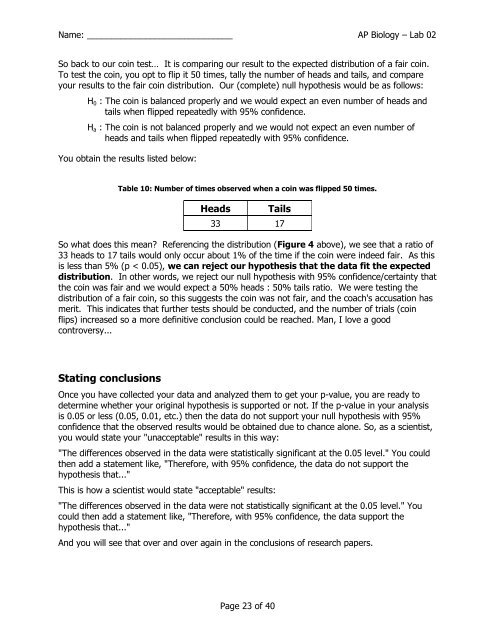
You obtain the results listed below:<br />
Table 10: Number of times observed when a coin was flipped 50 times.<br />
Heads<br />
Tails<br />
33 17<br />
So what does this mean? Referencing the distribution (Figure 4 above), we see that a ratio of<br />
33 heads to 17 tails would only occur about 1% of the time if the coin were indeed fair. As this<br />
is less than 5% (p < 0.05), we can reject our hypothesis that the data fit the expected<br />
distribution. In other words, we reject our null hypothesis with 95% confidence/certainty that<br />
the coin was fair and we would expect a 50% heads : 50% tails ratio. We were testing the<br />
distribution of a fair coin, so this suggests the coin was not fair, and the coach's accusation has<br />
merit. This indicates that further tests should be conducted, and the number of trials (coin<br />
flips) increased so a more definitive conclusion could be reached. Man, I love a good<br />
controversy...<br />
Stating conclusions<br />
Once you have collected your data and analyzed them to get your p-value, you are ready to<br />
determine whether your original hypothesis is supported or not. If the p-value in your analysis<br />
is 0.05 or less (0.05, 0.01, etc.) then the data do not support your null hypothesis with 95%<br />
confidence that the observed results would be obtained due to chance alone. So, as a scientist,<br />
you would state your "unacceptable" results in this way:<br />
"The differences observed in the data were statistically significant at the 0.05 level." You could<br />
then add a statement like, "Therefore, with 95% confidence, the data do not support the<br />
hypothesis that..."<br />
This is how a scientist would state "acceptable" results:<br />
"The differences observed in the data were not statistically significant at the 0.05 level." You<br />
could then add a statement like, "Therefore, with 95% confidence, the data support the<br />
hypothesis that..."<br />
And you will see that over and over again in the conclusions of research papers.<br />
Page 23 of 40