AP Lab 02 - Biology Lab Skills
AP Lab 02 - Biology Lab Skills
AP Lab 02 - Biology Lab Skills

Create successful ePaper yourself
Turn your PDF publications into a flip-book with our unique Google optimized e-Paper software.
Name: ______________________________ <strong>AP</strong> <strong>Biology</strong> – <strong>Lab</strong> <strong>02</strong><br />
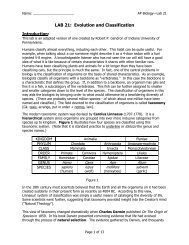
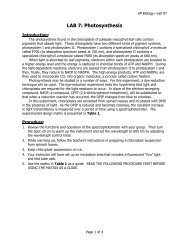
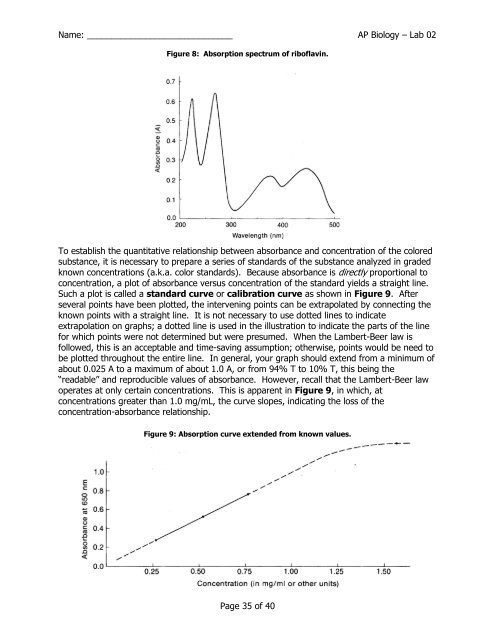
Figure 8: Absorption spectrum of riboflavin.<br />
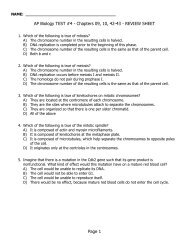
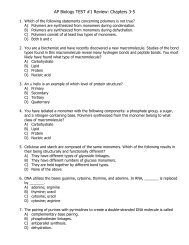
To establish the quantitative relationship between absorbance and concentration of the colored<br />
substance, it is necessary to prepare a series of standards of the substance analyzed in graded<br />
known concentrations (a.k.a. color standards). Because absorbance is directly proportional to<br />
concentration, a plot of absorbance versus concentration of the standard yields a straight line.<br />
Such a plot is called a standard curve or calibration curve as shown in Figure 9. After<br />
several points have been plotted, the intervening points can be extrapolated by connecting the<br />
known points with a straight line. It is not necessary to use dotted lines to indicate<br />
extrapolation on graphs; a dotted line is used in the illustration to indicate the parts of the line<br />
for which points were not determined but were presumed. When the Lambert-Beer law is<br />
followed, this is an acceptable and time-saving assumption; otherwise, points would be need to<br />
be plotted throughout the entire line. In general, your graph should extend from a minimum of<br />
about 0.<strong>02</strong>5 A to a maximum of about 1.0 A, or from 94% T to 10% T, this being the<br />
―readable‖ and reproducible values of absorbance. However, recall that the Lambert-Beer law<br />
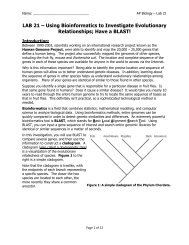
operates at only certain concentrations. This is apparent in Figure 9, in which, at<br />
concentrations greater than 1.0 mg/mL, the curve slopes, indicating the loss of the<br />
concentration-absorbance relationship.<br />
Figure 9: Absorption curve extended from known values.<br />
Page 35 of 40