
You also want an ePaper? Increase the reach of your titles
YUMPU automatically turns print PDFs into web optimized ePapers that Google loves.
What<br />
You’ll Learn<br />
To measure the areas and<br />
perimeters of figures and the<br />
volumes of objects<br />
Project<br />
Link<br />
And Why<br />
• Let’s Play Mini-Golf!<br />
To solve problems related<br />
to length of a fence, area of<br />
yard to be seeded, and volume<br />
of soil needed to fill a planter<br />
Key Words<br />
• leg<br />
• hypotenuse<br />
• inverse operation<br />
• composite figure<br />
• prism<br />
• cylinder<br />
• pyramid<br />
• cone<br />
• slant height<br />
• sphere
Communicate Your Thinking<br />
When you solve a problem, you can communicate your<br />
thinking in words, diagrams, or numbers.<br />
Someone else should be able to understand your<br />
thinking and check your work.<br />
Tina owns a landscape business.<br />
Here is her sketch of a backyard and some calculations.<br />
Check Tina’s calculations.<br />
5 m 5 m 5 m<br />
Patio<br />
4 m<br />
10 m<br />
Turf<br />
15 m<br />
Area of turf<br />
5 5 5 10 5 10 5 4<br />
10 50 50 20<br />
110 20<br />
90<br />
5 m<br />
I think I need 90 m 2 of turf<br />
5 m<br />
10 m<br />
Write a letter to Tina.<br />
Point out the errors she made.<br />
Describe the errors in detail.<br />
Provide some advice so Tina does not make the same mistakes again.<br />
Show Tina how to communicate her thinking better.<br />
2 CHAPTER 1: Measuring Figures and Objects
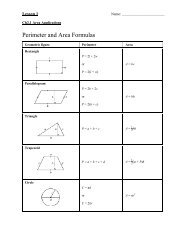
1.1 Measuring Perimeter and Area<br />
Hyo Jin is redecorating her living room.<br />
She measures the room.<br />
Hyo Jin calculates the area of the walls to<br />
help determine how many litres of paint to buy.<br />
She calculates the perimeter of the room<br />
to determine how many metres of<br />
wallpaper border to buy.<br />
Investigate<br />
Perimeter and Area Problems<br />
Work with a partner.<br />
You will need scissors.<br />
Your teacher will give you a larger copy of these clues.<br />
Cut them apart.<br />
➢ The clues belong<br />
in sets of 4.<br />
Each set includes:<br />
1 clue with a diagram,<br />
1 clue describing<br />
a problem, and<br />
2 clues with perimeter<br />
and area formulas.<br />
Sort the clues into sets.<br />
➢ Choose one set of clues.<br />
Solve the problem.<br />
Show your work.<br />
135 cm<br />
6.0 m<br />
4.0 m<br />
3.4 m<br />
7.0 m<br />
Nicki is building a stage.<br />
The stage is a trapezoid.<br />
How much wood does<br />
she need for the floor of<br />
the stage?<br />
Trevor is putting a frieze<br />
around the rectangular<br />
ceiling of his studio.<br />
How much frieze does<br />
he need?<br />
Amrit is painting<br />
handicapped parking<br />
spaces. Each space is a<br />
parallelogram. What is<br />
the area of each space?<br />
1.2 m<br />
This perimeter is called<br />
circumference.<br />
C πd or C 2πr<br />
Area is the product of<br />
the length and width.<br />
A lw<br />
2.0 m 2.5 m<br />
4.0 m<br />
Perimeter is the sum<br />
of the lengths of all<br />
four sides.<br />
P a b c d<br />
Josie is laying sod on a<br />
triangular part of her<br />
property. How much sod<br />
does she need?<br />
Area is the square of the<br />
length of one side.<br />
A s 2<br />
Perimeter is the sum of<br />
double the length and<br />
double the width.<br />
P 2l 2w<br />
8 m<br />
5 m 10 m<br />
4 m<br />
20 m<br />
Kevin is sewing lace trim<br />
on a circular tablecloth.<br />
How much trim does he<br />
need?<br />
Area is the product of<br />
the length of one side<br />
and the height to the<br />
opposite parallel side.<br />
A bh<br />
Keisha is tiling her<br />
square shower floor.<br />
How much tile does she<br />
need?<br />
Perimeter is the sum of<br />
the lengths of the three<br />
sides.<br />
P a b c<br />
Area is one-half the<br />
area of the related<br />
parallelogram.<br />
1<br />
A <br />
2<br />
bh<br />
Perimeter is double the<br />
length of one side plus<br />
double the length of an<br />
adjacent side.<br />
P 2b 2c<br />
Perimeter is four times<br />
the length of one side.<br />
P 4s<br />
3 m<br />
8 m<br />
Area is the product of π<br />
and the square of the<br />
radius.<br />
A πr 2<br />
Area is one-half the sum<br />
of the 2 parallel sides<br />
times the perpendicular<br />
distance between them.<br />
1<br />
A (a b)h<br />
2<br />
Reflect<br />
➢ How did you solve the problem you selected?<br />
➢ What is another way to solve the same problem?<br />
1.1 Measuring Perimeter and Area 3
Connect the Ideas<br />
The perimeter of a figure is the distance around it.<br />
The area of a figure is the number of square units inside it.<br />
One way to calculate perimeter or area is to substitute<br />
the appropriate measures into a formula.<br />
Rectangle<br />
Square<br />
w<br />
s<br />
<br />
P 2 + 2w<br />
P 4s<br />
A w A s 2<br />
You can also find<br />
the perimeter of a<br />
figure whose sides<br />
are line segments<br />
by adding the<br />
lengths of its sides.<br />
You do not have<br />
to memorize the<br />
perimeter formulas.<br />
Parallelogram<br />
Triangle<br />
h<br />
c<br />
a<br />
h<br />
b<br />
b<br />
P 2 b + 2 c<br />
P a + b + c<br />
A bh A 1 2 bh<br />
c<br />
The circumference<br />
of the circle is also<br />
the perimeter of<br />
the circle.<br />
Circle<br />
d<br />
r<br />
Trapezoid<br />
c<br />
h<br />
a<br />
d<br />
b<br />
C πd or C 2πr<br />
P a + b + c + d<br />
A πr 2 Area 1 2 (sum of parallel sides) ×<br />
height<br />
or, A 1 2 (a + b)h<br />
4 CHAPTER 1: Measuring Figures and Objects
Practice<br />
1. Determine the perimeter and area of each figure.<br />
a) 9 m<br />
b) c)<br />
10 cm<br />
24 cm<br />
5 m<br />
8 cm<br />
26 cm<br />
2. Determine the perimeter and area of each figure.<br />
a) b) 10 cm c)<br />
3 cm<br />
5 cm 15 cm 12 cm 13 cm<br />
8 cm<br />
24 cm<br />
3. Determine the perimeter and area of each figure.<br />
a) 3.7 cm<br />
b) 3.5 cm c)<br />
1.5 cm<br />
2.5 cm<br />
4.9 cm<br />
5.2 cm<br />
2.8 cm<br />
5 cm<br />
14.0 cm<br />
4.5 cm 5.4 cm<br />
9.0 cm<br />
4. The sail on a yacht has the shape of a triangle.<br />
What is the area of this sail?<br />
Remember to show<br />
your work.<br />
1.5 m 2.5 m<br />
2.1 m<br />
3.5 m<br />
28.0 cm<br />
5. Reanne is making the circles of the Olympic symbol from plastic tubing.<br />
Each circle has radius 75 cm. How much tubing does she need?<br />
6. When a paper towel tube is cut along<br />
its seam, it unwraps to form a parallelogram.<br />
How much cardboard is used to make the tube?<br />
13.2 cm<br />
1.1 Measuring Perimeter and Area 5
We can use a formula to determine the length or width<br />
when the perimeter is known.<br />
Example<br />
Solution<br />
The perimeter of a rectangle is 56 cm. Its width is 4 cm.<br />
What is its length?<br />
<br />
The perimeter P of a rectangle is:<br />
4 cm<br />
P 2 2w<br />
Substitute: P 56 and w 4<br />
56 2 2(4)<br />
Solve for .<br />
56 2 8 Think: What do we add to 8 to get 56?<br />
We know that 56 48 8<br />
So, 2 48 Think: What do we multiply 2 by to get 48?<br />
We know that 2 24 48<br />
So, 24<br />
The rectangle is 24 cm long.<br />
7. The area of a rectangle is 48 cm 2 .<br />
a) The width is 6 cm. What is its length?<br />
b) The length is 12 cm. What is its width?<br />
Having trouble?<br />
Read the<br />
Example above.<br />
8. Rosa has 24 m of fencing to make a square pen for her dog.<br />
How long is each side of the pen? Sketch the pen. Justify your answer.<br />
9. Assessment Focus Serena has 3 m of garden edging.<br />
She wants to make a flowerbed that is an isosceles triangle.<br />
a) Suppose each equal side is 90 cm long. How long is the third side?<br />
b) Suppose the third side is 90 cm long. How long is each equal side?<br />
Justify your answers.<br />
Recall that<br />
1 m = 100 cm.<br />
10. Take It Further Luis makes a circle from a piece of wire 120 cm long.<br />
a) What is the diameter of the circle?<br />
b) Will the wire fit around a circular tube with diameter 40 cm?<br />
Justify your answer.<br />
Choose one of the figures from this section.<br />
Explain how you found its perimeter or area.<br />
6 CHAPTER 1: Measuring Figures and Objects
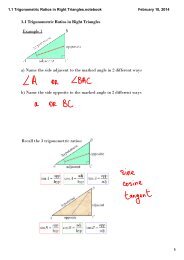
1.2<br />
Measuring Right Triangles<br />
People in many occupations,<br />
such as carpenters, plumbers,<br />
and building contractors,<br />
use right triangles in their work.<br />
Investigate<br />
Squares Drawn on the Sides of Triangles<br />
You will need a ruler and protractor.<br />
Your teacher will give you a larger copy of these triangles.<br />
Each triangle has a square drawn on each side.<br />
The side length of the square is the side length of the triangle.<br />
➢ Begin with the right triangle.<br />
Calculate the area of each square.<br />
What do you notice about the 3 areas?<br />
➢ Use a ruler and protractor.<br />
Draw a different right triangle and the squares on its sides.<br />
Are the areas of the squares related in the same way?<br />
➢ Do you think the areas are related in the same way for each of<br />
these triangles?<br />
• an acute triangle • an obtuse triangle<br />
To find out, repeat the activity for these triangles.<br />
Reflect<br />
➢ Work with a classmate.<br />
Write a word equation that relates the areas of the<br />
squares on the sides of a right triangle.<br />
Include a sketch of a right triangle.<br />
➢ Are the areas of the squares on the sides of an acute or<br />
obtuse triangle related in the same way?<br />
Justify your answer.<br />
1.2 Measuring Right Triangles 7
Connect the Ideas<br />
In a right triangle, the shorter sides are<br />
the legs. These sides form the right angle.<br />
The longest side is opposite the right angle.<br />
It is called the hypotenuse.<br />
Leg<br />
Hypotenuse<br />
Leg<br />
The sum of the areas of the squares<br />
on the legs is equal to the area of<br />
the square on the hypotenuse.<br />
This relationship is written as:<br />
a 2 b 2 c 2<br />
This relationship is named the<br />
Pythagorean Theorem.<br />
The theorem is not true<br />
for acute or obtuse triangles.<br />
This relationship can be used<br />
to determine the length<br />
of the hypotenuse of a right triangle<br />
when you know the lengths of the legs.<br />
a 2 a b<br />
c<br />
c 2<br />
b 2<br />
To determine the hypotenuse in this<br />
right triangle, substitute for a and b in<br />
the formula a 2 b 2 c 2 .<br />
Substitute: a 7 and b 5<br />
Hypotenuse<br />
7 cm 5 cm<br />
7 2 5 2 c 2<br />
(7 7) (5 5) c 2<br />
49 25 c 2<br />
74 c 2<br />
c 74<br />
c 8.602<br />
Use the inverse operation.<br />
You know c 2 . To find c, take the square root.<br />
Use the key on a calculator.<br />
The hypotenuse is about 8.6 cm, to 1 decimal place.<br />
This result is reasonable. That is, the hypotenuse is always greater<br />
than the legs and 8.6 is greater than 5 and 7.<br />
8 CHAPTER 1: Measuring Figures and Objects
Practice<br />
Where necessary, give the answers to 1 decimal place.<br />
1. Determine each unknown length.<br />
a) 8 cm<br />
b) c)<br />
5 cm<br />
6 cm<br />
8 m<br />
12 cm<br />
2. Determine each unknown length.<br />
a) b) c)<br />
3.4 cm<br />
5.9 cm<br />
4.6 m<br />
10.1 m<br />
13.2 m<br />
3. Ali walks along the path through the park.<br />
How far does Ali walk?<br />
4. A right triangle has legs 9 cm and 12 cm.<br />
Sketch the triangle. What is its perimeter?<br />
Show your work.<br />
5. A plumber is installing pipe.<br />
She has to offset the pipe around an obstacle.<br />
a) What is the length of this offset section of pipe?<br />
Justify your answer.<br />
b) Is the result reasonable? Explain.<br />
3.0 km<br />
Path<br />
Offset<br />
24 cm<br />
1.5 km<br />
24 cm<br />
6. A contractor estimates how many sheets<br />
of plywood will be needed to build this roof.<br />
His first step is to determine<br />
the length of the sloping part.<br />
How long is it? Justify your answer.<br />
Overhang<br />
0.6 m<br />
Sloping part<br />
1.5 m<br />
3.6 m<br />
7. Use the Pythagorean Theorem to find out if these are right triangles.<br />
Justify your answers.<br />
a) b) 6.4 m<br />
c)<br />
3 cm<br />
4 cm<br />
9.6 km<br />
5.6 m<br />
2.5 m<br />
12.8 km<br />
5 cm<br />
16.0 km<br />
Remember: a 2 b 2 c 2 is only true for right triangles.<br />
c is the longest side.<br />
1.2 Measuring Right Triangles 9
We can also use the Pythagorean Theorem to determine the length of a leg.<br />
Example<br />
Solution<br />
Kim is building a ramp with a piece of wood 175 cm long.<br />
The height of the ramp is 35 cm.<br />
What is the horizontal length of the ramp?<br />
Since the side view<br />
of the ramp is a right<br />
35 cm<br />
triangle, we use the<br />
Pythagorean Theorem.<br />
b<br />
Let the horizontal leg be b.<br />
Use: a 2 b 2 c 2<br />
Substitute: a 35 and c 175<br />
35 2 b 2 175 2<br />
1225 b 2 30 625<br />
1225 1225 b 2 30 625 1225<br />
b 2 29 400<br />
b 2 29 400<br />
b 2 171.46<br />
The horizontal length of the ramp is about 171 cm.<br />
175 cm<br />
To isolate b 2 , subtract 1225<br />
from each side of the equation.<br />
To calculate b,<br />
take the square root.<br />
8. Determine each unknown length.<br />
a) b) c)<br />
2.0 m<br />
1.5 m<br />
15 cm 9 cm<br />
3.2 m<br />
2.5 m<br />
9. Assessment Focus Suppose you know that the lengths of two sides of a right triangle<br />
are 3.5 cm and 4.5 cm. What is the length of the third side? Show two possible answers.<br />
10. Take It Further A ladder is 4.9 m long. It leans against a wall with its foot 1.2 m from<br />
the base of the wall. The distance from the foot of a ladder to the wall should be about<br />
one-quarter of the distance the ladder reaches up the wall.<br />
Is the ladder safely positioned? Justify your answer.<br />
Describe how the areas of the squares drawn on the sides of a right triangle are related.<br />
Why is it important to know the Pythagorean Theorem?<br />
10 CHAPTER 1: Measuring Figures and Objects
1.3 Area of a Composite Figure<br />
An appraiser is determining the value of some vacant land.<br />
As part of the process, he must calculate the area of the land.<br />
Often parcels of land have irregular shapes.<br />
How can their areas be calculated?<br />
Investigate<br />
Drawing a Composite Figure and Determining Its Area<br />
You may need dot paper or grid paper.<br />
You know how to determine the area of each figure below.<br />
➢ Combine any or all of these figures, or parts of them.<br />
Design an unusual garden.<br />
➢ Determine the area of your garden.<br />
Write enough measures on your design so someone else could<br />
calculate its area.<br />
Reflect<br />
➢ Trade designs with a classmate.<br />
Calculate the area of your classmate’s garden.<br />
➢ Compare answers. If both of you have different answers<br />
for the same garden, try to find out why.<br />
Keep your designs for use in Section 1.4.<br />
1.3 Area of a Composite Figure 11
Connect the Ideas<br />
A figure made up of other figures<br />
is called a composite figure.<br />
This composite figure is made up<br />
of a rectangle and a trapezoid.<br />
9 m<br />
6 m 3 m<br />
Determine the<br />
area of each part<br />
Determine<br />
the total area<br />
Is the answer<br />
reasonable?<br />
The rectangle has dimensions<br />
9 m by 3 m.<br />
7 m<br />
Its area is: A w<br />
9 3<br />
27<br />
The trapezoid has parallel sides of 9 m and 7 m.<br />
The height of the trapezoid is: 6 m 3 m 3 m<br />
Its area is: A 1 2 (a b)h<br />
1 2 (9 7) 3<br />
1 2 16 3<br />
8 3<br />
24<br />
Total area Rectangle area Trapezoid area<br />
27 24<br />
51<br />
The area of the composite figure is 51 m 2 .<br />
From the diagram, the area of the trapezoid<br />
is a little less than the area of the rectangle.<br />
So, the total area should be less than twice the area of the<br />
rectangle. That is, less than 2 27 54<br />
Since 51 is a little less than 54, the answer is reasonable.<br />
Practice<br />
Assume the figures in questions 1 and 2 are drawn on 1-cm grid paper.<br />
1. Determine the area of each composite figure.<br />
a) b) c)<br />
12 CHAPTER 1: Measuring Figures and Objects
2. Determine the area of each composite figure.<br />
a) b) c)<br />
3. Determine the area of each composite figure.<br />
a) 40 cm<br />
b) 4 m<br />
c)<br />
15 cm<br />
20 cm<br />
2 m<br />
30 cm<br />
10 cm<br />
15 cm<br />
45 cm<br />
Another way to determine the area of a composite figure is to draw<br />
a figure around the composite figure first.<br />
Example<br />
Determine the area<br />
of this composite figure.<br />
The curve is a semicircle.<br />
9.2 cm<br />
13.0 cm<br />
Solution<br />
The composite figure is a rectangle<br />
that measures 9.2 cm by 13.0 cm,<br />
with a semicircle removed.<br />
• The diameter of the semicircle is 9.2 cm.<br />
So, the radius of the semicircle is:<br />
9.2 <br />
2 cm<br />
9.2 cm<br />
4.6 cm<br />
The area of a circle is: A πr 2<br />
So, the area of the semicircle is:<br />
A 1 2 πr 2<br />
Substitute: r 4.6<br />
A 1 2 π (4.6) 2 33.24<br />
• The area of the rectangle is: 9.2 13.0 119.6<br />
• Total area Rectangle area Semicircle area<br />
119.6 33.24<br />
86.36<br />
The area of the composite figure is about 86.4 cm 2 .<br />
13.0 cm<br />
4.6 cm<br />
1.3 Area of a Composite Figure 13
4. Calculate the area of each figure.<br />
a) 13 m<br />
b)<br />
1.5 m<br />
7 m<br />
25 cm<br />
9 cm<br />
5. Kiren quotes for paving driveways based on the area to be paved.<br />
Determine the area of each driveway. All curves are semicircles.<br />
Is each result reasonable? Explain.<br />
a) 6 m<br />
b) 15 m<br />
c)<br />
6 m<br />
4 m<br />
4 m<br />
6 m<br />
4 m<br />
3 m<br />
3 m<br />
8 m<br />
6. Assessment Focus The floor plan of a sunroom is shown.<br />
a) What is the area of the floor of this sunroom?<br />
b) There are 10 000 cm 2 in 1 m 2 .<br />
What is the area of the floor in square centimetres?<br />
c) A square tile has side length 30 cm.<br />
What is the area of 1 tile?<br />
d) Estimate how many tiles are needed to cover the floor.<br />
Justify your answer.<br />
1 m<br />
Sunroom<br />
4 m<br />
1 m<br />
3 m<br />
7. Take It Further One flowerbed has the shape of a trapezoid.<br />
The parallel sides are 5 m and 7 m long.<br />
The distance between the parallel sides is 4 m.<br />
On the shorter parallel side, there is another flowerbed that has<br />
the shape of a rhombus, with side length 5 m and height 3 m.<br />
a) Sketch the flowerbeds.<br />
b) What is the area of the flowerbeds?<br />
c) One bag of topsoil covers 0.25 m 2 . How many bags are needed?<br />
d) One bag of topsoil costs $2.29, including taxes.<br />
How much will the topsoil in part c cost?<br />
Sketch and label a composite figure.<br />
Determine its area. Try to do this two different ways if possible.<br />
Show your work.<br />
14 CHAPTER 1: Measuring Figures and Objects
1.4<br />
Perimeter of a Composite Figure<br />
Tamara works for a fencing company.<br />
She is preparing a price quote for a customer.<br />
Tamara needs to know the type of fencing<br />
being ordered and the perimeter<br />
of the area to be fenced.<br />
Investigate<br />
Perimeter of a Composite Figure<br />
Your teacher will give you a large copy of this design.<br />
The curve is a semicircle.<br />
10 cm<br />
3 cm<br />
6 cm<br />
8 cm<br />
4 cm<br />
Or, you can use your garden design from Section 1.3.<br />
Calculate the perimeter of the design.<br />
Reflect<br />
➢ Trade solutions with a classmate. Check your classmate’s solution.<br />
➢ Compare answers. If you have different answers for the same garden,<br />
try to find out why.<br />
➢ For which figures are the measurements you need for perimeter<br />
different from those you need for area?<br />
How did you find these measurements?<br />
1.4 Perimeter of a Composite Figure 15
Connect the Ideas<br />
Determine the<br />
curved length<br />
Determine<br />
the perimeter<br />
Check<br />
the result<br />
Here is a composite figure from Section 1.3.<br />
The perimeter of this figure is the sum of<br />
3 sides of a rectangle and<br />
9.2 cm<br />
one-half the circumference of a circle.<br />
The diameter of the circle is 9.2 cm.<br />
The circumference of a circle is: C πd<br />
So, the circumference is: C π 9.2<br />
One-half the circumference is: 1 2 π 9.2 14.45<br />
The approximate perimeter of the composite figure is:<br />
13.0 9.2 13.0 14.45 49.65<br />
The perimeter is about 49.7 cm.<br />
From the diagram, the length of the semicircle<br />
is greater than the width of the rectangle.<br />
So, the perimeter of the figure should be greater than<br />
the perimeter of the rectangle, which is approximately<br />
2(9) 2(13) 18 + 26 44; the result is reasonable.<br />
13.0 cm<br />
Practice<br />
1. a) Determine the perimeter of each composite figure.<br />
i) 6.0 cm<br />
ii)<br />
6.0 cm<br />
4.0 cm<br />
4.0 cm<br />
iii)<br />
6.0 cm<br />
iv)<br />
6.0 cm<br />
4.0 cm<br />
4.0 cm<br />
b) What do you notice about the perimeters in part a?<br />
Do you think the same relationships are true<br />
for the areas? How could you find out?<br />
2. Sarah is lighting the theatre stage arch for the new play.<br />
The arch is a semicircle on top of a rectangle.<br />
How long is the string of lights? Justify your answer.<br />
12.6 m<br />
3.2 m<br />
16 CHAPTER 1: Measuring Figures and Objects
3. This design is 4 one-quarter circles<br />
on the sides of a square.<br />
a) What is the perimeter of the design?<br />
The broken lines are not part of the perimeter.<br />
b) Is your result reasonable? Explain.<br />
11.4 cm<br />
Sometimes you may need to use the Pythagorean Theorem<br />
to calculate a length before you can determine the perimeter.<br />
Example<br />
Here is a plan of a driveway from<br />
Section 1.3.<br />
A fence is to be placed around the<br />
driveway on the sides indicated.<br />
How much fencing is needed?<br />
4 m<br />
6 m<br />
3 m<br />
6 m<br />
Solution<br />
We know the length of each part<br />
of the fence except for AB.<br />
Draw right ABC.<br />
Then AC 6 m 4 m 2 m<br />
and BC 6 m 3 m 3 m<br />
To find the length of AB, use the<br />
Pythagorean Theorem in ABC.<br />
4 m<br />
A<br />
C<br />
B<br />
6 m<br />
a 2 b 2 c 2<br />
Substitute: a 3 and b 2<br />
3 2 2 2 c 2<br />
9 4 c 2<br />
13 c 2<br />
c 13<br />
c 3.6<br />
The total length of fencing is:<br />
6 m 3.6 m 4 m 13.6 m<br />
About 14 m of fencing are needed.<br />
1.4 Perimeter of a Composite Figure 17
4. Determine the perimeter of each figure. Show your work.<br />
a) 23.0 cm<br />
b)<br />
12.0 cm<br />
11.0 cm<br />
10.0 cm 12.0 cm<br />
Need Help?<br />
Read the Example<br />
on page 17.<br />
5.0 cm<br />
5. Assessment Focus A circular fish pond is set in a rectangular patio.<br />
a) Plastic edging is placed around the pond and the patio.<br />
i) What length of edging is used?<br />
ii) The edging costs $4.79/m.<br />
What is the total cost of the edging?<br />
b) The patio is paved with sandstone tiles.<br />
i) What is the area that is paved?<br />
ii) The sandstone costs $45.00/m 2 .<br />
What is the total cost of the sandstone?<br />
c) What assumptions did you make in parts a and b?<br />
6. Sketch two different composite figures that have the same perimeter.<br />
Calculate the perimeters, or explain how you know they are equal.<br />
Calculate each area.<br />
12 m<br />
2 m<br />
2 m<br />
8 m<br />
7. Take It Further Yazan is putting up a wallpaper border in his family room.<br />
The border will run along the top<br />
4.5 m<br />
of all the walls, including above<br />
1.0 m<br />
any doors and windows.<br />
a) What length of border does Yazan need?<br />
0.4 m<br />
b) The border comes in 4.57-m rolls.<br />
1.2 m<br />
How many rolls does Yazan need?<br />
c) Each roll of border costs $14.99.<br />
1.0 m<br />
How much will the border for this room cost?<br />
3.8 m<br />
Sketch a composite figure.<br />
Explain how you calculate its perimeter.<br />
Show your work.<br />
18 CHAPTER 1: Measuring Figures and Objects
Measurement Bingo<br />
Materials:<br />
• counters as markers<br />
• 2-cm grid paper<br />
• scissors<br />
• container<br />
Play in a group of 4.<br />
➢ Each player outlines a 4 by 4 square<br />
on 2-cm grid paper.<br />
➢ Write these 16 answers anywhere on your 4 by 4 grid — one in<br />
each square:<br />
circumference of a circle; area of a circle; area of a square;<br />
trapezoid; cm 3 ;m 2 ; 6; 9; 10; 11; 20; 24; 27; 30; 34; 45<br />
➢ Your teacher will give your group a copy of 16 questions.<br />
➢ Cut the questions apart.<br />
Fold each question, and place it in a container.<br />
➢ Take turns to pick a question.<br />
Everyone answers the question.<br />
Cover the answer on your grid with a marker.<br />
➢ The first person to cover a row or column wins.<br />
Game: Measurement Bingo 19
Mid-Chapter Review<br />
1.1<br />
1. For each figure:<br />
• Determine its area.<br />
• Determine its perimeter.<br />
a) b)<br />
5. Determine the perimeter of each<br />
triangle.<br />
a) b)<br />
15.0 cm<br />
10.0 cm<br />
12.0 cm<br />
18.0 cm<br />
1.4 m<br />
6. Determine each unknown length.<br />
c)<br />
2.5 m<br />
1.4 m<br />
a) b)<br />
c<br />
h<br />
15.0 m<br />
10.0 m<br />
2.1 m<br />
2.3 m<br />
12.0 m<br />
3.4 m<br />
2. For each measurement in question 1,<br />
did you use a formula?<br />
If your answer is yes, write the<br />
formula. If your answer is no, explain<br />
how you calculated.<br />
1.3<br />
1.4<br />
7. Determine the perimeter and area of<br />
each composite figure. How do you<br />
know your results are reasonable?<br />
a) A rectangle with a square removed<br />
10 cm<br />
1.1<br />
1.2<br />
3. Determine the area and perimeter of<br />
each figure.<br />
a) b)<br />
12 cm<br />
b) A quarter circle on a rectangle<br />
6.0 cm<br />
8.0 m<br />
12.0 cm<br />
3.0 cm<br />
6.0 m<br />
1.2<br />
4. Determine each unknown length.<br />
a)<br />
7.0 m<br />
1.3<br />
8. Andrew is painting 2 coats on 2 walls<br />
of his studio. Each wall looks like this:<br />
2.0 m<br />
4.0 m<br />
4.0 m<br />
2.0 m<br />
b)<br />
9.0 cm<br />
16.0 cm<br />
6.0 m<br />
One can of paint covers 10.5 m 2<br />
with one coat. How many cans of<br />
paint does Andrew need?<br />
Justify your answer.<br />
20 CHAPTER 1: Measuring Figures and Objects
1.5<br />
Volumes of a Prism and a Cylinder<br />
Some buildings and bridges are supported<br />
by concrete columns called piers.<br />
A civil engineer calculates the volume<br />
of the piers so that enough concrete<br />
is ordered for a project.<br />
Investigate<br />
Relating the Volumes of a Prism and a Cylinder<br />
Which of these pictures represent prisms? Justify your answers.<br />
What would you need to know to determine the volume of<br />
each prism?<br />
A<br />
B<br />
C<br />
K<br />
G<br />
J<br />
F<br />
H<br />
E<br />
D<br />
Reflect<br />
➢ What is the same about all the prisms? What is different?<br />
➢ Suppose each prism is filled with layers of congruent<br />
figures. Which figure would it be in each prism?<br />
➢ Which object is a cylinder? Choose one of the<br />
prisms and compare it with the cylinder.<br />
What is the same about these two objects?<br />
What is different?<br />
1.5 Volumes of a Prism and a Cylinder 21
Connect the Ideas<br />
Compare a prism and a cylinder.<br />
Each solid can be placed with its top directly above the base.<br />
Visualize slicing the prism and the cylinder into layers.<br />
Height<br />
Height<br />
Base<br />
Base<br />
The area of each layer equals the area of the base.<br />
The height of the layers is equal to the height of the prism and cylinder.<br />
So, the volume of the solid equals the area of the base multiplied<br />
by the height.<br />
The volume of a prism is:<br />
V = base area height<br />
The volume of a cylinder is:<br />
V = base area height<br />
The base area of a cylinder is: πr 2<br />
The height is: h<br />
r<br />
h<br />
So, the volume of a cylinder can also be written as:<br />
V = πr 2 h<br />
d<br />
h<br />
A label on the tank<br />
indicates that its<br />
capacity is 190 L.<br />
Why do you think<br />
the two capacities<br />
are so different?<br />
A hot-water tank is shaped like a cylinder with base<br />
diameter 56 cm and height 120 cm.<br />
Its volume can be found using this formula: V = πr 2 h<br />
The radius r is: 56 <br />
2 cm = 28 cm<br />
Substitute: r = 28 and h = 120<br />
V = π 28 2 120<br />
295 561.0<br />
The volume of the tank is about 300 000 cm 3 .<br />
1 cm 3 of volume = 1 mL of capacity<br />
And, 1000 mL = 1 L<br />
So, 300 000 cm 3 300 000<br />
<br />
1000<br />
L<br />
= 300.000 L<br />
The capacity of the tank is about 300 L.<br />
22 CHAPTER 1: Measuring Figures and Objects
Practice<br />
1. Determine the volume of each prism.<br />
a) b) c)<br />
6 cm<br />
6 cm<br />
6 cm<br />
12 cm 24 cm<br />
12 cm<br />
4 cm<br />
8 cm<br />
16 cm<br />
2. Determine the volume of each prism.<br />
a) b) 8 cm c)<br />
4 cm<br />
12 cm<br />
4 cm 6 cm<br />
9 m<br />
16 m<br />
24 m<br />
Need Help?<br />
Read Connect<br />
the Ideas.<br />
3 cm<br />
3. Determine the volume of each cylinder.<br />
a) 22.0 m<br />
b) 10.0 cm c)<br />
12.0 cm<br />
12.0 cm<br />
8.0 m<br />
10.0 cm<br />
4. Pasta is sold in a box that is a rectangular prism.<br />
The box that feeds 4 people measures 3 cm by 9 cm by 18 cm.<br />
a) What is the volume of this box?<br />
b) The company wants to produce a party-pack box of pasta.<br />
Each dimension of the box will be doubled.<br />
Will this be enough pasta for 16 people? Justify your answer.<br />
5. Assessment Focus Hay bales come in different shapes and sizes.<br />
Some are rectangular prisms. Others are cylindrical.<br />
A rectangular bale is 75 cm by 20 cm by 14 cm.<br />
A cylindrical bale has base diameter 150 cm and length 120 cm.<br />
a) Sketch each bale. Which has the greater volume? Justify your answer.<br />
b) About how many of the smaller bales have a total volume<br />
equal to that of the larger bale?<br />
6. a) What is the volume of this barn?<br />
b) Would this barn hold 1000 of the rectangular hay<br />
bales in question 5? How do you know?<br />
c) Would this barn hold 1000 of the cylindrical hay<br />
bales in question 5? How do you know?<br />
d) Are your results reasonable? Explain.<br />
12.0 m<br />
8.0 m<br />
9.0 m<br />
7.0 m<br />
1.5 Volumes of a Prism and a Cylinder 23
Sometimes we need to use the Pythagorean Theorem to calculate a length<br />
on a prism, before we find its volume.<br />
Example<br />
Solution<br />
A base of a prism is<br />
not necessarily the<br />
bottom face.<br />
a) Determine the height of the base<br />
of this prism.<br />
b) Determine the volume of this prism.<br />
16 cm<br />
a) Sketch the triangular base.<br />
Let the height of the triangle be h.<br />
The height bisects the base of the triangle.<br />
Use the Pythagorean Theorem in ABC.<br />
h 2 8 2 16 2<br />
h 2 64 256<br />
h 2 256 64<br />
h 2 192<br />
h 192<br />
h 13.86<br />
The height of the base is about 14 cm.<br />
b) The base area is: 1 2 16 13.86 110.88<br />
The length is: 12 cm<br />
The volume is: base area length 110.88 12<br />
1330.56<br />
The volume of the prism is about 1331 cm 3 .<br />
A<br />
C<br />
h<br />
12 cm<br />
16 cm<br />
B<br />
8 cm<br />
7. A child’s building block set has these triangular prisms.<br />
Determine the volume of wood in each block.<br />
a) Equilateral b) Isosceles<br />
triangular prism<br />
triangular prism<br />
4 cm<br />
10 cm<br />
8. Take It Further Many types of cheese are produced in<br />
cylindrical slabs. One-quarter of this slab has been sold.<br />
a) What is the volume of this piece of cheese?<br />
b) The mass of 1 cm 3 of cheese is about 1.2 g.<br />
What is the mass of the cheese shown here?<br />
18 cm<br />
4 cm<br />
6 cm<br />
11 cm<br />
10 cm<br />
Why can you use the same formula to calculate the volumes of<br />
a prism and a cylinder? Include examples in your explanation.<br />
24 CHAPTER 1: Measuring Figures and Objects
1.6 Volume of a Pyramid<br />
A company wants to know how much oil<br />
is contained in a new oilfield.<br />
A geologist estimates the volume of oil<br />
underground. She models the layers of oil<br />
as cut-off pyramids and calculates<br />
their volumes.<br />
Investigate<br />
Relating the Volumes of a Prism and a Pyramid<br />
A prism and pyramid<br />
with the same base<br />
and height are<br />
related.<br />
Work with a partner.<br />
You will need:<br />
• a pyramid and a prism with congruent bases and equal heights<br />
• sand or plastic rice<br />
➢ Make a prediction. How do you think the volumes of this<br />
pyramid and prism compare?<br />
Fill the pyramid with sand.<br />
➢ Estimate how many pyramids of sand will fill the prism.<br />
➢ Fill the prism to check your estimate.<br />
➢ How is the volume of the pyramid related to the volume of the<br />
prism? How does this compare with your prediction?<br />
Reflect<br />
Compare results with classmates who used related prisms<br />
and pyramids with bases different from yours.<br />
➢ Does the volume relationship depend on the shape of<br />
the base of the related pyramid and prism? Explain.<br />
➢ Use what you know about the volume of a prism to write<br />
a formula for the volume of a related pyramid.<br />
1.6 Volume of a Pyramid 25
Connect the Ideas<br />
The contents of three pyramids fit exactly into the prism.<br />
These 3 volumes together… …are equal to this volume.<br />
That is, the volumes of 3 pyramids are equal<br />
to the volume of the related prism.<br />
So, the volume of a pyramid is one-third<br />
the volume of the related prism.<br />
h<br />
V = 1 3 Bh, where B is the area of the base<br />
of the pyramid and h is the height<br />
of the pyramid.<br />
To calculate how much plaster is needed<br />
to fill this mould, we calculate the volume of<br />
the pyramid.<br />
The base of the pyramid is a square with<br />
side length 22 cm.<br />
So, the base area is: B = 22 22 = 484<br />
The height of the pyramid is: h = 65<br />
The volume of the pyramid is: V = 1 3 Bh<br />
V = 1 3 484 65<br />
10 486.67<br />
The volume of plaster is about 10 487 cm 3 .<br />
22 cm<br />
65 cm<br />
Base<br />
Practice<br />
1. The prism and pyramid have the same base and height.<br />
Determine each volume.<br />
8 cm<br />
3 cm<br />
9 cm<br />
26 CHAPTER 1: Measuring Figures and Objects
2. Determine the volume of each rectangular pyramid.<br />
a) b) c)<br />
20 cm<br />
7 m<br />
15 cm<br />
15 cm<br />
4 m<br />
18 cm<br />
15 cm<br />
5 m<br />
25 cm<br />
3. Determine the volume of each pyramid.<br />
a) b) c)<br />
19 m<br />
10 m<br />
17 cm<br />
11 m<br />
8 m<br />
6 m<br />
9 cm<br />
12 cm<br />
15 m<br />
4. Pyramids have been constructed in many places around the world.<br />
One of the most famous is the Great Pyramid of Giza.<br />
It contains the burial chamber of Pharaoh Khufu.<br />
Today, the pyramid is 137 m high.<br />
When first constructed, it was 146.5 m high.<br />
a) Sketch the original pyramid.<br />
Label the sketch with the given measurements.<br />
b) What volume of rock has been lost over the years?<br />
Why do you think it has been lost?<br />
230 m<br />
40 m<br />
137 m<br />
5. A pyramid in Pune, India, can hold 5000 people.<br />
a) What is the volume of air per person in the pyramid?<br />
b) How do you know your answer is reasonable?<br />
6. Assessment Focus A package for a frozen treat<br />
is a triangular pyramid. All edge lengths are 12.0 cm.<br />
Each triangular face has height 10.4 cm.<br />
a) Calculate the volume of the pyramid.<br />
Show your work.<br />
b) The package lists its contents as 200 mL.<br />
Why are the contents in millilitres different<br />
from the volume in cubic centimetres?<br />
64 m<br />
10.0 cm<br />
12.0 cm<br />
10.4 cm<br />
12.0 cm<br />
1 cm 3 1 mL<br />
1.6 Volume of a Pyramid 27
Sometimes the height of a pyramid is difficult to measure.<br />
We can use the Pythagorean Theorem to calculate the height of the pyramid.<br />
Example<br />
Solution<br />
A crystal paperweight is a pyramid<br />
with dimensions as shown.<br />
a) What is the height of the pyramid?<br />
b) What is the volume of crystal in the pyramid?<br />
a) The height of the pyramid is one leg of a<br />
7 cm<br />
right triangle. The hypotenuse is 8.3 cm.<br />
The other leg is one-half the base<br />
of the other triangular face, or 3.5 cm.<br />
Use the Pythagorean Theorem in ABC.<br />
A<br />
h 2 3.5 2 8.3 2<br />
h 2 12.25 68.89<br />
h 2 68.89 12.25<br />
h<br />
h 2 56.64<br />
h 56.64<br />
h 7.526<br />
C<br />
The height of the pyramid is about 7.5 cm.<br />
b) The volume of the pyramid is: V 1 3 Bh<br />
The base area is: B 7 5 35<br />
So, V 1 3 35 7.526 87.80<br />
The volume of crystal in the pyramid is about 88 cm 3 .<br />
3.5 cm<br />
8.3 cm<br />
8.3 cm<br />
5 cm<br />
B<br />
7. A wooden pyramid has a square base with side length 14.0 cm.<br />
The height of each triangular face is 16.8 cm.<br />
a) Determine the height of the pyramid.<br />
b) Determine the volume of wood in the pyramid.<br />
8. Take It Further The volume of the Great Pyramid of Cholula in<br />
Mexico is estimated to be 4.5 million cubic metres. It is 66 m high.<br />
What is the side length of its square base? Justify your answer.<br />
height<br />
14.0 cm<br />
16.8 cm<br />
14.0 cm<br />
How is the volume of a pyramid related to the volume of a prism?<br />
Include diagrams in your explanation.<br />
28 CHAPTER 1: Measuring Figures and Objects
1.7<br />
Volume of a Cone<br />
Large quantities of grains are sometimes<br />
stored in conical piles.<br />
Often, only the height of the pile is known.<br />
Techniques have been developed to<br />
estimate the radius of the pile.<br />
The volume can then be calculated.<br />
Investigate<br />
Relating the Volumes of a Cylinder and a Cone<br />
A cylinder and cone<br />
with the same base and<br />
height are related.<br />
Work with a partner.<br />
You will need:<br />
• a cylinder and a cone with congruent bases and equal heights<br />
• sand or plastic rice<br />
➢ Make a prediction. How do you think the volumes of this<br />
cylinder and cone compare?<br />
Fill the cone with sand.<br />
➢ Estimate how many cones of sand will fill the cylinder.<br />
➢ Fill the cylinder to check your estimate.<br />
➢ How is the volume of the cone related to the volume of the<br />
cylinder? How does this compare with your prediction?<br />
Reflect<br />
Compare results with classmates who used related cylinders<br />
and cones with bases different from yours.<br />
➢ Does the volume relationship depend on the size of the<br />
base of the related cone and cylinder? Explain.<br />
➢ Use what you know about the volume of a cylinder to<br />
write a formula for the volume of a related cone.<br />
1.7 Volume of a Cone 29
Connect the Ideas<br />
A cone and a cylinder with the same base and height are related.<br />
The relationship between the volumes of a cone and its related<br />
cylinder is the same as that for a pyramid and its related prism.<br />
These 3 volumes together …<br />
… are equal to this volume.<br />
The volume of a cone is one-third the volume of its related cylinder.<br />
So, the volume of a cone is: V 1 3 Bh<br />
where B is the area of the base of the cone<br />
and h is the height of the cone.<br />
The volume of a cylinder is: V πr 2 h<br />
So, the volume of its related cone is:<br />
V 1 3 πr 2 πr<br />
h or 2 h<br />
or πr 2 h 3<br />
3<br />
The volume of a cone is V 1 3 πr 2 h,<br />
where r is the base radius and h is the height.<br />
h<br />
B<br />
h<br />
r<br />
When a conveyor belt drops gravel,<br />
the gravel forms a cone.<br />
This cone is 3.7 m high and has a<br />
base diameter of 4.6 m.<br />
The volume of gravel is: V 1 3 πr 2 h<br />
r <br />
4.6 2 m 2.3 m<br />
Substitute: r 2.3 and h 3.7<br />
V 1 3 π 2.3 2 3.7<br />
V 20.497<br />
The volume of gravel is about 20.5 m 3 .<br />
4.6 m<br />
3.7 m<br />
30 CHAPTER 1: Measuring Figures and Objects
Practice<br />
1. The cylinder and cone in each pair have the same base and height.<br />
The volume of each cylinder is given. Determine the volume of each cone.<br />
a) b)<br />
Need Help?<br />
Read Connect<br />
the Ideas.<br />
V 42 cm 3 V ? V 19.2 cm 3 V ?<br />
2. The cylinder and cone in each pair have the same base and height.<br />
Determine each volume.<br />
a) 1 cm<br />
b)<br />
3 cm<br />
3 cm<br />
1 cm<br />
3.5 cm<br />
2.4 cm<br />
2.4 cm<br />
3.5 cm<br />
3. Determine the volume of each cone.<br />
a) b) c)<br />
8 cm<br />
4.7 cm<br />
2.9 m<br />
16.0 m<br />
6 cm<br />
2.4 cm<br />
4. An ice-cream cone has diameter 6 cm and height 12 cm.<br />
What is the volume of the cone? Justify your answer.<br />
Sometimes the height of a cone is not given.<br />
We can measure the slant height and radius,<br />
then use the Pythagorean Theorem to calculate the height.<br />
h<br />
r<br />
slant<br />
height<br />
Example<br />
A paper drinking cup is a cone.<br />
The base has diameter 6.4 cm.<br />
The slant height is 9.5 cm.<br />
a) Determine the height of the cone.<br />
b) Determine the volume of water<br />
that will fill the cup.<br />
6.4 cm<br />
9.5 cm<br />
1.7 Volume of a Cone 31
Solution 6.4 cm<br />
a) The radius of the cone is: r <br />
2<br />
3.2 cm<br />
Use the Pythagorean Theorem:<br />
3.2 cm<br />
h 2 3.2 2 9.5 2<br />
h 2 10.24 90.25<br />
h 2 h<br />
90.25 10.24<br />
h 2 80.01<br />
h 80.01<br />
h 8.945<br />
The cone is about 9 cm high.<br />
b) The volume of water the cone will hold is equal to the<br />
volume of the cone.<br />
Use: V 1 3 πr 2 h<br />
Substitute: r 3.2 and h 8.945<br />
V 1 3 π 3.2 2 8.945<br />
V 95.92<br />
The volume of water is about 96 cm 3 .<br />
9.5 cm<br />
5. Determine the height and volume of each cone.<br />
a) b) c)<br />
9.4 m<br />
5 cm<br />
h<br />
h<br />
6.2 m<br />
3 cm<br />
h<br />
16 cm<br />
11 cm<br />
6. Assessment Focus A pile of sand is a cone.<br />
The base diameter is 3.8 m and the slant height is 4.0 m.<br />
a) What is the volume of sand in the pile? Include a diagram.<br />
b) How do you know your answer is reasonable?<br />
7. Take It Further A hill can be approximated as a cone.<br />
Its circumference is about 3 km. Its slant height is about 800 m.<br />
What is the approximate volume of soil in the hill?<br />
Recall that<br />
1 km 1000 m.<br />
How is the volume of a cone related to the volume of a cylinder?<br />
Include diagrams in your explanation.<br />
32 CHAPTER 1: Measuring Figures and Objects
1.8<br />
Volume of a Sphere<br />
Some companies have experimented<br />
with making ball bearings in space.<br />
In space, a molten lump of steel floats.<br />
As the steel cools and hardens, it forms a perfect sphere.<br />
This is simpler than the manufacturing process on Earth.<br />
How could an engineer determine how much molten steel<br />
would be needed to produce a particular size of sphere<br />
in space?<br />
Investigate<br />
The Volume of a Sphere<br />
Work with a partner.<br />
You will need:<br />
• a graduated cylinder<br />
• a sphere that sinks<br />
• water<br />
➢ Estimate the volume of the sphere.<br />
Explain your estimation strategy.<br />
Recall that<br />
1 mL 1 cm 3 .<br />
➢ Record the volume of water in the<br />
graduated cylinder.<br />
Place the sphere in the cylinder.<br />
Record the new level of water.<br />
Calculate the volume of the sphere<br />
in cubic centimetres.<br />
How does the actual volume compare with your estimate?<br />
➢ Find a way to measure the radius of your sphere.<br />
➢ The volume of a sphere depends on the cube of its radius, r.<br />
For your sphere, calculate r r r, or r 3 .<br />
Reflect<br />
➢ Divide the volume, V,by r 3 .<br />
➢ Compare results with several other pairs of classmates.<br />
What do you notice about your values of V r 3 ?<br />
1.8 Volume of a Sphere 33
Connect the Ideas<br />
An old tennis ball has the same diameter as a frozen juice can.<br />
This coincidence can be used to relate the volume of the ball<br />
to the volume of the can.<br />
➢ Two matching empty cans are cut so their<br />
heights equal the diameter of the ball.<br />
6 cm<br />
6 cm 6 cm<br />
➢ One can is filled with water.<br />
➢ The ball is soaked with water<br />
then pushed into the can right<br />
to the bottom. Water overflows<br />
into a tray.<br />
➢ The volume of water in the tray<br />
equals the volume of the ball.<br />
This water is poured into the<br />
other can. The height of the<br />
water is measured.<br />
➢ The height of the water is 4 cm.<br />
The height of the can is 6 cm.<br />
6 cm<br />
4 cm<br />
Since the cans are congruent, the ratio of the volumes of water<br />
is equal to the ratio of the heights.<br />
Since 4 cm is 2 3 of 6 cm, the volume of the ball is 2 3 the volume<br />
of the can.<br />
Volume of a sphere 2 3 Volume of a cylinder into which the<br />
sphere just fits<br />
34 CHAPTER 1: Measuring Figures and Objects
6 cm<br />
6 cm<br />
The height of this cylinder equals its diameter.<br />
The volume of the cylinder is about 170 cm 3 .<br />
The volume of the sphere with the same diameter is about:<br />
2 3 170 cm 3 113 cm 3<br />
2r<br />
r<br />
r<br />
The volume of this cylinder is πr 2 2r 2πr 3<br />
The volume of the sphere is:<br />
2 3 2πr 3 4 3 πr 3<br />
The volume V of a sphere with radius r is: V 4 3 πr 3<br />
Practice<br />
1. The height of this cylinder is twice its radius.<br />
Determine the volumes of the cylinder and the sphere.<br />
5 cm<br />
10 cm<br />
2. The height of this cylinder is twice its radius.<br />
Determine the volume of the sphere.<br />
7 cm<br />
3. Determine the volume of each sphere.<br />
a) 10 cm b) c)<br />
4 m<br />
3.5 cm<br />
Many objects are approximately spherical.<br />
Their volumes can be estimated using the formula for the volume of a sphere.<br />
Example<br />
An orange is approximately spherical.<br />
Its diameter is 10 cm.<br />
What is the volume of the orange?<br />
G<br />
1.8 Volume of a Sphere 35
Solution To determine the volume of the orange, use: V 4 3 πr 3<br />
cm<br />
r 10 <br />
2 5 cm. Substitute: r 5<br />
V 4 3 π 5 3<br />
V 523.599<br />
The volume of the orange is about 524 cm 3 .<br />
4. Determine the volume of each sphere.<br />
a) b) c)<br />
18 m<br />
8.4 cm<br />
14 cm<br />
5. An inflated balloon approximates a sphere with radius 11.5 cm.<br />
A student’s lung capacity is 3.6 L.<br />
a) How many breaths does the student use to inflate the balloon?<br />
What assumptions did you make?<br />
b) How do you know your answer is reasonable?<br />
6. Assessment Focus Lyn has a block of wood<br />
that measures 14 cm by 14 cm by 14 cm.<br />
She is making a wooden ball in tech class.<br />
a) What is the volume of wood in the block?<br />
b) What is the largest possible diameter for the ball?<br />
c) What is the volume of the wooden ball?<br />
d) What volume of wood is cut off the block to make the ball?<br />
What assumptions did you make?<br />
7. Take It Further Meighan is selling ice-cream cones at the fall fair.<br />
Each carton of ice cream is 20 cm by 11 cm by 24 cm.<br />
The ice-cream scoop makes a sphere of ice cream, with diameter 8 cm.<br />
a) How many scoops should Meighan get from each carton?<br />
b) Each carton of ice cream costs $4.29. How much does each scoop cost?<br />
c) Meighan pays $1.99 for a package of 12 sugar cones. Suggest a price Meighan<br />
should charge for each single-scoop and double-scoop cone. Justify your answer.<br />
How is the volume of a sphere related to the volume of a cylinder?<br />
Include diagrams in your explanation.<br />
36 CHAPTER 1: Measuring Figures and Objects
Chapter Review<br />
What Do I Need to Know?<br />
Pythagorean Theorem<br />
a 2 b 2 c 2 , where a and b are the legs<br />
of a right triangle and c is the hypotenuse<br />
b<br />
c<br />
a<br />
Volume Formulas<br />
Volume of a prism is<br />
base area times height.<br />
V Bh<br />
Volume of a cylinder is<br />
base area times height.<br />
V πr 2 h<br />
See the Expanded<br />
Glossary for the<br />
formulas for areas<br />
and perimeters<br />
of figures.<br />
B<br />
B<br />
h<br />
r<br />
h<br />
Volume of a pyramid is one-third<br />
Volume of a cone is one-third<br />
the base area times the height.<br />
the base area times the height.<br />
V 1 3 Bh V 1 3 πr 2 h<br />
h<br />
h<br />
B<br />
B<br />
r<br />
Volume of a sphere is two-thirds<br />
Volume of a sphere is four-thirds π<br />
the volume of a cylinder into<br />
times the cube of the radius.<br />
which the sphere just fits. V 4 3 πr 3<br />
2r<br />
r<br />
r<br />
Chapter Review 37
What Should I Be Able to Do?<br />
1.1<br />
1. Determine the perimeter and area of<br />
each figure.<br />
a)<br />
10 cm<br />
1.3<br />
5. Determine the area of this figure.<br />
The curve is a semicircle.<br />
7.5 cm<br />
4 cm<br />
5 cm<br />
6.2 cm<br />
b)<br />
6 cm<br />
2. A hurricane warning flag is a square<br />
with side length 90 cm.<br />
The red border is 12 cm wide.<br />
90 cm<br />
6. The sailing regatta committee has<br />
this flag to show a fourth place finish.<br />
What is the area of the red material<br />
in the flag?<br />
81 cm<br />
162 cm<br />
23 cm<br />
27 cm<br />
1.4<br />
7. Determine the perimeter of this<br />
figure.<br />
30 cm<br />
1.2<br />
a) What is the area of black material?<br />
b) What is the area of red material?<br />
3. Determine each unknown length.<br />
a)<br />
12 cm<br />
9 cm<br />
15 cm s<br />
8. A large greeting card has the shape<br />
of a square, with a semicircle on<br />
each of two sides.<br />
b)<br />
7.5 cm<br />
19.5 cm<br />
4. Jean set up cross poles for his horse<br />
to jump. How long is each cross pole?<br />
4.8 m<br />
0.8 m<br />
10 cm<br />
a) There is a ribbon around the<br />
perimeter of the card.<br />
How long is this ribbon?<br />
b) How do you know your answer is<br />
reasonable?<br />
38 CHAPTER 1: Measuring Figures and Objects
1.5<br />
9. Determine the volume of each<br />
object.<br />
1.7<br />
13. a) What is the volume of the cone?<br />
a)<br />
8 cm<br />
6 cm<br />
13 cm<br />
35 cm<br />
b)<br />
5.4 m<br />
23.5 m<br />
10. A tray of lasagna for 4 people is 19 cm<br />
wide, 24 cm long, and 7 cm deep.<br />
a) Suppose the length and width of<br />
the tray are doubled. How many<br />
people should this new tray feed?<br />
Explain your answer.<br />
Include a diagram.<br />
b) Suppose each dimension of the<br />
tray is doubled. How many people<br />
should the larger tray feed?<br />
Justify your answer.<br />
b) What is the height of this related<br />
cylinder?<br />
c) What would the cylinder’s height<br />
have to be for it to have the<br />
same volume as the cone?<br />
Check your answer.<br />
14. Sebastian is filling a conical piñata.<br />
How much space is there for candy?<br />
44 cm<br />
h<br />
14 cm 2<br />
56 cm<br />
1.6<br />
11. Determine the volume of the<br />
pyramid.<br />
1.8<br />
15. Determine the volume of each<br />
sphere.<br />
a) b)<br />
24 cm<br />
8.4 cm<br />
24 m<br />
20 cm<br />
7 cm<br />
12. The Katimavik Pavilion at Expo ’67 is<br />
a huge square pyramid. Its base is<br />
20.0 m by 20.0 m. Its height is 14.1 m.<br />
a) What is the volume of the<br />
pyramid?<br />
b) How do you know your answer is<br />
reasonable?<br />
16. In February 2003, Andy Martell of<br />
Toronto set a world record for the<br />
largest ball of plastic wrap.<br />
The ball was approximately spherical.<br />
Its diameter was about 43.6 cm.<br />
a) What was its volume?<br />
b) How do you know your answer is<br />
reasonable?<br />
Chapter Review 39
Practice Test<br />
Multiple Choice: Choose the correct answer for questions 1 and 2.<br />
1. A circle has diameter 16 cm. What is its approximate area?<br />
A. 631.65 cm 2 B. 50.27 cm 2 C. 201.06 cm 2 D. 804.25 cm 2<br />
2. Which statement is true for the volumes of these objects?<br />
A. All volumes are equal.<br />
1 m<br />
B. The cylinder has<br />
the least volume.<br />
2 m<br />
C. Two volumes are equal.<br />
D. The sphere has<br />
the greatest volume.<br />
1 m<br />
1 m<br />
2 m<br />
Show all your work for questions 3 to 6.<br />
3. Knowledge and Understanding Determine each unknown length.<br />
a) b)<br />
9 cm 14 cm<br />
12 m<br />
8 m<br />
4. Application The town works department is ordering<br />
materials for a new park. It has the shape of a parallelogram<br />
with a right triangle on one side. Here is a plan of the park.<br />
a) Which measure must you determine to find<br />
the area of the park? What is the park’s area?<br />
b) The park is to be fenced except for the gated entrances.<br />
There will be four 2.25-m gates in the fence.<br />
How much fencing needs to be ordered?<br />
Justify your answers.<br />
400 m<br />
300 m<br />
B<br />
500 m<br />
310 m<br />
5. Communication In ABC, is ∠ABC a right angle?<br />
Justify your answer.<br />
A<br />
24 cm<br />
29 cm<br />
17 cm<br />
C<br />
6. Thinking Cameron is filling a drink cooler with bags of ice.<br />
How many bags of ice are needed to half fill the cooler?<br />
What assumptions did you make?<br />
55 cm<br />
70 cm<br />
Cooler<br />
Ice<br />
31 cm<br />
10 cm<br />
22 cm<br />
40 CHAPTER 1: Measuring Figures and Objects
What<br />
You’ll Learn<br />
To determine the maximum<br />
area of a rectangle for<br />
a given perimeter and to<br />
determine the minimum<br />
perimeter of a rectangle for<br />
a given area<br />
And Why<br />
In real-world problems, we<br />
often want to maximize<br />
space or minimize cost.<br />
Key Words<br />
• maximum<br />
• minimum<br />
Project<br />
Link<br />
• Build the Biggest<br />
Chip Tray
Exploring Guided Examples<br />
All sections of this textbook have one Guided Example.<br />
A Guided Example is a detailed solution to a problem.<br />
Reading a Guided Example<br />
Reading a Guided Example will help you learn the math<br />
in that section.<br />
When you read a Guided Example, you should make sure you<br />
understand how one step follows from the previous steps.<br />
Example<br />
A rectangular prism has dimensions 6 m by 4 m by 3 m.<br />
Determine the volume of the prism.<br />
Solution<br />
Volume is<br />
measured in<br />
cubic units.<br />
Sketch and label a prism.<br />
Use the formula for the volume of<br />
a rectangular prism: V wh<br />
Substitute: 6, w 4, and h 3<br />
V 6 4 3<br />
72<br />
The volume of the prism is 72 m 3 .<br />
4 m<br />
6 m<br />
3 m<br />
➢ Work with a partner. Read the Solution above.<br />
➢ Make sure you understand each step in the Solution.<br />
➢ Read and explain each step in the Solution to your partner.<br />
Writing a Guided Example<br />
Writing a solution that looks like a Guided Example can help you<br />
organize your work and show all your steps.<br />
Use the Guided Example above as a guide.<br />
➢ Write a solution to the following problem.<br />
Example<br />
A rectangular prism has dimensions 12 cm by 6 cm by 8 cm.<br />
Determine the volume of the prism.<br />
➢ Compare your solution with your partner’s.<br />
➢ Do the solutions look like the Guided Example above?<br />
Explain any differences.<br />
42 CHAPTER 2: Investigating Perimeter and Area of Rectangles
2.1 Varying and Fixed Measures<br />
Fiona and Justin have a<br />
chocolate bar to share.<br />
The bar is 10 cm long.<br />
Fiona can cut the bar anywhere<br />
she chooses.<br />
Investigate<br />
Cutting a Fixed Length<br />
➢ When Fiona cuts the bar, what might the lengths of the two<br />
pieces be? Copy and complete this table.<br />
Which tools could<br />
you use to help you<br />
solve this problem?<br />
Length of one piece<br />
(cm)<br />
Length of the other piece<br />
(cm)<br />
Give at least 6 possible sets of lengths.<br />
➢ How are the two lengths related?<br />
➢ What patterns do you see in the lengths?<br />
Reflect<br />
➢ Do the lengths have to be whole numbers? Explain.<br />
➢ Which measures change?<br />
Which measure stays the same?<br />
➢ What are the lengths likely to be if Justin chooses his piece first?<br />
2.1 Varying and Fixed Measures 43
Connect the Ideas<br />
Nikki is building a rectangular dog pen.<br />
She has 24 m of fence.<br />
<br />
w<br />
We can determine possible dimensions for the pen.<br />
The perimeter of a rectangle is twice the sum of its length<br />
and width.<br />
The perimeter is 24 m.<br />
So, the sum of the length and width is 12 m.<br />
w 12<br />
List pairs of measures whose sum is 12.<br />
We do not need to<br />
continue the table<br />
because we would<br />
repeat the rectangles<br />
we have.<br />
Width (m) Length (m) Perimeter (m)<br />
1 11 24<br />
2 10 24<br />
3 9 24<br />
4 8 24<br />
5 7 24<br />
6 6 24<br />
The perimeter stays<br />
the same.<br />
The length and<br />
width vary.<br />
For the perimeter to remain the same, the length decreases as the<br />
width increases.<br />
The increase in width is equal to the decrease in length.<br />
The rectangles from the table are drawn on 1-cm grid paper below.<br />
11 cm<br />
1 cm<br />
10 cm<br />
2 cm<br />
9 cm<br />
3 cm<br />
8 cm<br />
4 cm<br />
7 cm<br />
5 cm<br />
6 cm<br />
6 cm<br />
44 CHAPTER 2: Investigating Perimeter and Area of Rectangles
Practice<br />
1. Point P moves along line segment AB.<br />
A<br />
P<br />
B<br />
a) Which measures vary?<br />
b) Which measure stays the same?<br />
2. Point B moves along the circumference of a circle.<br />
Point O is the centre of the circle.<br />
a) Which measures vary?<br />
b) Which measures stay the same?<br />
O<br />
B<br />
A<br />
3. Point A moves along line segment CD.<br />
Triangle ABC is a right triangle.<br />
In ∆ABC:<br />
a) Which measures vary?<br />
b) Which measures stay the same?<br />
B<br />
C<br />
A<br />
D<br />
4. a) Determine the perimeter and area of this rectangle.<br />
b) Suppose the length is increased by 5 cm and<br />
the width is decreased by 5 cm.<br />
How do you think the perimeter and area will change?<br />
Explain. Include a diagram in your explanation.<br />
c) Calculate the perimeter and area of the new rectangle.<br />
Were you correct in part b?<br />
Justify your answer.<br />
5. Use the rectangle from question 4.<br />
a) Suppose the length is doubled and the width is halved.<br />
How do you think the perimeter and area will change?<br />
Explain.<br />
b) Calculate the perimeter and area of the new rectangle.<br />
Were you correct in part a?<br />
Justify your answer.<br />
Include a diagram.<br />
6. Sketch 5 different rectangles with each perimeter.<br />
Label each rectangle with its dimensions.<br />
a) Perimeter: 20 units<br />
b) Perimeter: 32 units<br />
25 cm<br />
35 cm<br />
Which tools could<br />
you use to help you<br />
solve this problem?<br />
2.1 Varying and Fixed Measures 45
Example<br />
A rectangle has area 12 cm 2 .<br />
Determine 3 different lengths and widths for the rectangle.<br />
Solution<br />
The area of a rectangle is: A w<br />
So, the length times the width is 12 cm 2 .<br />
List pairs of measures whose product is 12 cm 2 .<br />
Width (cm) Length (cm) Area (cm 2 )<br />
1 12 12<br />
2 6 12<br />
3 4 12<br />
Recall that w<br />
means w<br />
7. Sketch 5 different rectangles with each area.<br />
Label each rectangle with its dimensions.<br />
a) Area: 36 square units b) Area: 48 square units<br />
8. Assessment Focus<br />
a) Give 4 different pairs of lengths and widths for a rectangle with<br />
perimeter 16 cm.<br />
b) Do rectangles with the same perimeter have the same area?<br />
c) Give 3 different pairs of lengths and widths for a rectangle with area 16 cm 2 .<br />
d) Do rectangles with the same area have the same perimeter?<br />
Justify your answers.<br />
9. a) How can the area of a rectangle stay the same when its length<br />
and width change?<br />
b) How do you determine possible lengths and widths for a given area?<br />
10. Take It Further Triangle ABC is a right triangle.<br />
Sketch this triangle on grid paper.<br />
Suppose the measure of ∠A changes.<br />
a) Which other measures change?<br />
b) Which measures stay the same?<br />
Draw triangles to illustrate your answers.<br />
A<br />
C<br />
B<br />
Explain how the perimeter of a rectangle can stay the same<br />
when the length and width change.<br />
How do you determine the possible lengths and widths for<br />
a given perimeter?<br />
46 CHAPTER 2: Investigating Perimeter and Area of Rectangles
Using The Geometer’s Sketchpad<br />
to Investigate Rectangles<br />
Part 1: Rectangles with a Given Perimeter<br />
1. Open the file FixedPerimArea.gsp.<br />
Click the tab for page 1.<br />
2. The rectangle in the sketch has perimeter 24 cm.<br />
Click Animate! to see how the dimensions of the<br />
rectangle vary while the perimeter stays the same.<br />
3. a) Click Animate! to stop the animation.<br />
b) Create this table in your notebook.<br />
Length (cm) Width (cm) Perimeter (cm)<br />
c) Start and stop the animation 6 times.<br />
Each time you stop the animation, record the length and<br />
width of the rectangle in the table.<br />
d) Describe the patterns in the lengths and widths.<br />
e) Explain how the dimensions of a rectangle can vary while<br />
the perimeter stays the same.<br />
24<br />
Technology: Using The Geometer’s Sketchpad to Investigate Rectangles 47
Part 2: Rectangles with a Given Area<br />
1. Use the file FixedPerimArea.gsp.<br />
Click the tab for page 2.<br />
2. The rectangle in the sketch has area 24 cm 2 .<br />
Click Animate! to see how the dimensions of the<br />
rectangle vary while the area stays the same.<br />
3. a) Click Animate! to stop the animation.<br />
b) Create this table in your notebook.<br />
Length (cm) Width (cm) Area (cm 2 )<br />
c) Start and stop the animation several times.<br />
Each time you stop the animation, record the length and<br />
width of the rectangle in the table.<br />
d) Describe the patterns in the lengths and widths.<br />
e) Explain how the dimensions of a rectangle can vary while<br />
the area stays the same.<br />
24<br />
48 CHAPTER 2: Investigating Perimeter and Area of Rectangles
2.2 Rectangles with Given Perimeter or Area<br />
Investigate<br />
Rectangles with a Given Perimeter<br />
Work with a partner.<br />
You will need 0.5-cm grid paper.<br />
Your teacher will give you a loop of string.<br />
How many different rectangles can you make with the loop of string?<br />
➢ Lay the loop of string<br />
on grid paper.<br />
Place the tips of<br />
four pencils inside<br />
the loop.<br />
Use the lines on the<br />
grid paper to make<br />
the angles as close<br />
to 90° as possible.<br />
➢ Use the pencils to<br />
make the string taut<br />
and form a rectangle.<br />
Mark the vertices on<br />
the grid paper.<br />
➢ Remove the string.<br />
Use a ruler to join<br />
the vertices and draw<br />
the rectangle.<br />
Measure the length and width of the rectangle.<br />
Calculate its area and perimeter.<br />
Record these measures.<br />
Length Width Area Perimeter<br />
(cm) (cm) (cm 2 ) (cm)<br />
➢ Use the same loop.<br />
Repeat the previous steps to create 4 different rectangles.<br />
Reflect<br />
➢ How do you know when the figure is a rectangle?<br />
➢ Why do all the rectangles have the same perimeter?<br />
➢ Why do the rectangles have different areas?<br />
2.2 Rectangles with Given Perimeter or Area 49
Connect the Ideas<br />
A toy farm set has 20 straight sections of fence.<br />
Each section is 10 cm long.<br />
Here are 2 possible rectangular toy corrals.<br />
1st corral<br />
2nd corral<br />
8 sections long 7 sections long<br />
2 sections wide 3 sections wide<br />
Determine<br />
the dimensions<br />
1st corral<br />
8 10 cm<br />
80 cm<br />
w 2 10 cm<br />
20 cm<br />
The corral is 80 cm by 20 cm.<br />
2nd corral<br />
7 10 cm<br />
70 cm<br />
w 3 10 cm<br />
30 cm<br />
The corral is 70 cm by 30 cm.<br />
We can compare the perimeters of the corrals and their areas.<br />
Determine<br />
the perimeters<br />
Recall that 2(80)<br />
means 2 80.<br />
Use the formula: P 2 2w<br />
1st corral<br />
2nd corral<br />
Substitute: 80 and w 20 Substitute: 70 and w 30<br />
P 2(80) 2(20) P 2(70) 2(30)<br />
160 40 140 60<br />
200 200<br />
The perimeter is 200 cm.<br />
The perimeter is 200 cm.<br />
Determine<br />
the areas<br />
Use the formula: A w<br />
1st corral<br />
2nd corral<br />
Substitute: 80 and w 20 Substitute: 70 and w 30<br />
A (80)(20) A (70)(30)<br />
1600 2100<br />
The area is 1600 cm 2 . The area is 2100 cm 2 .<br />
The corrals have the same perimeter but different areas.<br />
50 CHAPTER 2: Investigating Perimeter and Area of Rectangles
Practice<br />
1. a) Draw each rectangle on grid paper.<br />
i) 8, w 2 ii) 8, w 3 iii) 6, w 4 iv) 9, w 2<br />
b) Which rectangles in part a have the same perimeter? How do you know?<br />
c) Which rectangles in part a have the same area? How do you know?<br />
d) Can rectangles with the same perimeter have different areas? Explain.<br />
e) Can rectangles with the same area have different perimeters? Explain.<br />
Example<br />
Jacy wants to frame<br />
these pictures.<br />
a) Show that both<br />
pictures have the<br />
same area.<br />
b) Is the same length<br />
of frame needed for<br />
each picture?<br />
Explain.<br />
36 cm<br />
A<br />
25 cm<br />
45 cm<br />
B<br />
20 cm<br />
Solution<br />
Calculate the<br />
perimeter of<br />
each picture<br />
to determine<br />
the length<br />
of frame.<br />
a) Use the formula: A w<br />
Picture A<br />
Picture B<br />
Substitute: 36 and w 25 Substitute: 45 and w 20<br />
A (36)(25) A (45)(20)<br />
900 900<br />
Both pictures have area 900 cm 2 .<br />
b) Use the formula: P 2 2w<br />
Picture A<br />
Picture B<br />
Substitute: 36 and w 25 Substitute: 45 and w 20<br />
P 2(36) 2(25) P 2(45) 2(20)<br />
122 130<br />
Picture A needs 122 cm of frame. Picture B needs 130 cm of frame.<br />
So, picture B needs more frame.<br />
2. a) Draw this rectangle on grid paper.<br />
Draw 5 different rectangles with the same perimeter as this rectangle.<br />
b) Calculate the area of each rectangle.<br />
A w<br />
Write the area inside each rectangle.<br />
c) Cut out the rectangles. Sort them from least to greatest area.<br />
d) Describe how the shapes of the rectangles change<br />
as the area increases.<br />
2.2 Rectangles with Given Perimeter or Area 51
3. a) Draw this rectangle on grid paper.<br />
Draw 3 different rectangles with the same area<br />
as this rectangle.<br />
b) Calculate the perimeter of each rectangle.<br />
P 2 2w<br />
Write the perimeter inside each rectangle.<br />
c) Cut out the rectangles. Sort them from least to greatest perimeter.<br />
d) Describe how the rectangles change as the perimeter increases.<br />
4. Assessment Focus<br />
a) Draw a square on grid paper.<br />
Determine its area and perimeter.<br />
b) Draw a rectangle with the same perimeter but a different area.<br />
c) Which figure has the greater area? Show your work.<br />
5. This diagram shows overlapping rectangles drawn on<br />
1-cm grid paper.<br />
All of them share the same vertex.<br />
a) Calculate the area of each rectangle.<br />
What do you notice?<br />
b) Which rectangle do you think has the least perimeter?<br />
The greatest perimeter? Justify your choice.<br />
c) Calculate the perimeter of each rectangle.<br />
Were you correct in part b? Explain.<br />
A<br />
B<br />
C<br />
D<br />
E<br />
6. This diagram shows overlapping rectangles drawn<br />
on 1-cm grid paper. All of them share the same vertex.<br />
a) Calculate the perimeter of each rectangle.<br />
What do you notice?<br />
b) Which rectangle do you think has the least area?<br />
The greatest area? Justify your choice.<br />
c) Calculate the area of each rectangle.<br />
Were you correct in part b? Explain.<br />
A<br />
B<br />
C<br />
D<br />
E<br />
F<br />
G<br />
H<br />
7. Take It Further Can two different rectangles have the same perimeter<br />
and the same area? Justify your answer.<br />
Explain how rectangles can have the same perimeter but different areas.<br />
Explain how rectangles can have the same area but different perimeters.<br />
Include diagrams in your explanations.<br />
52 CHAPTER 2: Investigating Perimeter and Area of Rectangles
2.3 Maximum Area for a Given Perimeter<br />
A building supply store donates fencing<br />
to a day-care centre.<br />
The fencing will be used to create a<br />
rectangular play area.<br />
Which dimensions will give the largest<br />
possible area?<br />
Investigate<br />
Greatest Area of a Rectangle<br />
Work in a group of 4.<br />
You will need a 10 by 10 geoboard and geobands.<br />
➢ Choose one of these perimeters:<br />
10 units, 16 units, 18 units, or 20 units<br />
➢ Make as many different rectangles as you can<br />
with that perimeter.<br />
Record the length and width of each rectangle in a table.<br />
Determine the area of each rectangle.<br />
Length Width Area<br />
(units) (units) (square units)<br />
➢ Which rectangle has the greatest area?<br />
Reflect<br />
➢ How do you know you found the rectangle with the<br />
greatest area?<br />
➢ What is the greatest area?<br />
Describe the rectangle with the greatest area.<br />
➢ Share results with your group.<br />
Compare the rectangles with the greatest area for<br />
a given perimeter.<br />
How are they the same? How are they different?<br />
2.3 Maximum Area for a Given Perimeter 53
Connect the Ideas<br />
Since the edging<br />
cannot be cut, the<br />
dimensions of the<br />
rectangles must be<br />
whole numbers.<br />
Maya has 18 m of edging to create a rectangular flowerbed.<br />
What dimensions will give the greatest area?<br />
➢ Suppose the edging is in 1-m sections and cannot be cut.<br />
Draw rectangles to represent flowerbeds with perimeter 18 m.<br />
Calculate the area of each rectangle.<br />
8 m<br />
1 m<br />
7 m<br />
2 m<br />
6 m<br />
3 m<br />
5 m<br />
4 m Length (m) Width (m) Area (m 2 )<br />
8 1 8<br />
7 2 14<br />
6 3 18<br />
5 4 20<br />
From the table, the greatest or maximum area is 20 m 2 .<br />
The greatest area occurs when the dimensions of<br />
the flowerbed are closest in value: 5 m and 4 m<br />
4.1 m<br />
4.9 m<br />
4.2 m<br />
4.8 m<br />
➢ If the edging can be cut, Maya can make flowerbeds with<br />
dimensions that are even closer in value.<br />
Length (m) Width (m) Area (m 2 )<br />
4.9 4.1 20.09<br />
4.8 4.2 20.16<br />
4.7 4.3 20.21<br />
4.6 4.4 20.24<br />
4.5 4.5 20.25<br />
4.3 m<br />
4.4 m<br />
4.5 m<br />
4.7 m<br />
4.6 m<br />
4.5 m<br />
From the table, the maximum area is 20.25 m 2 .<br />
This maximum area occurs when the dimensions of the<br />
flowerbed are equal.<br />
That is, the rectangle is a square with side length 4.5 cm.<br />
This result is true in general. Among all rectangles with<br />
a given perimeter, a square has the maximum area.<br />
It may not be possible to form a square when the sides of the<br />
rectangle are restricted to whole numbers.<br />
Then, the maximum area occurs when the length and width are<br />
closest in value.<br />
54 CHAPTER 2: Investigating Perimeter and Area of Rectangles
Practice<br />
1. a) On 1-cm grid paper, draw all possible rectangles with each perimeter.<br />
Each dimension is a whole number of centimetres.<br />
i) 8 cm ii) 12 cm iii) 22 cm<br />
b) Calculate the area of each rectangle in part a.<br />
c) For each perimeter in part a, what are the dimensions of<br />
the rectangle with the maximum area?<br />
2. Suppose you have 14 sections of fence to enclose a rectangular garden.<br />
Each section is 1 m long and cannot be cut.<br />
a) Sketch the possible gardens that can be enclosed by the fence.<br />
Label each garden with its dimensions.<br />
b) Calculate the area of each garden in part a.<br />
c) Which garden has the maximum area?<br />
Is this garden a square? Explain.<br />
Example<br />
Solution<br />
What is the maximum area of a rectangle with perimeter 30 m?<br />
The maximum area occurs when the rectangle is a square.<br />
Determine the side length, s, of a square with perimeter 30 m.<br />
Use the formula: P 4s<br />
Substitute: P 30<br />
30 4s<br />
Think: What do we multiply 4 by to get 30?<br />
Divide 30 by 4 to find out.<br />
s 30<br />
4<br />
s 7.5<br />
Calculate the area of the square. Use the formula: A s 2<br />
Substitute: s 7.5<br />
A (7.5) 2<br />
56.25<br />
The maximum area is 56.25 m 2 .<br />
s<br />
2.3 Maximum Area for a Given Perimeter 55
3. What is the maximum area for a rectangle with each perimeter?<br />
Explain your thinking.<br />
a) 36 cm b) 60 cm c) 75 cm<br />
4. Assessment Focus Determine the dimensions of a rectangle<br />
with perimeter 42 m whose area is as great as possible.<br />
What is the maximum area? Justify your answer.<br />
Need Help?<br />
Read the<br />
Example on<br />
page 55.<br />
5. Joachim has been comparing rectangles that have the same perimeter.<br />
He says that rectangles whose lengths and widths are close in value<br />
have larger areas than rectangles whose lengths and widths are<br />
very different. Do you agree with Joachim? Justify your answer.<br />
Include diagrams and calculations.<br />
6. In a banquet room, there are small square tables<br />
that seat 1 person on each side.<br />
These tables are pushed together to create<br />
a rectangular table that seats 20 people.<br />
a) Consider all possible arrangements of<br />
square tables to seat 20 people.<br />
Sketch each arrangement.<br />
b) Which arrangement requires the most tables?<br />
The fewest tables?<br />
c) Explain why the arrangement with the fewest tables<br />
might not be preferred in this situation.<br />
7. Take It Further Lisa and her sister Bonnie are each given<br />
8 m of plastic edging to create a flowerbed.<br />
Lisa creates a square flowerbed.<br />
Bonnie creates a circular flowerbed.<br />
a) Calculate the area of each girl’s flowerbed.<br />
b) Which figure encloses the greater area?<br />
Do you think the areas of all squares and circles with<br />
the same perimeter are related this way?<br />
Draw other squares and circles to find out.<br />
Three tables seat 8 people.<br />
Which tools could<br />
you use to help you<br />
solve this problem?<br />
Use The Geometer’s<br />
Sketchpad if available.<br />
Suppose your friend was absent during this lesson.<br />
Describe what you learned.<br />
Include diagrams and examples in your explanation.<br />
56 CHAPTER 2: Investigating Perimeter and Area of Rectangles
Using The Geometer’s Sketchpad<br />
to Investigate Maximum Area<br />
and Minimum Perimeter<br />
Part 1: Maximum Area<br />
1. Open the file MaxArea.gsp.<br />
Your teacher will tell<br />
you how to measure<br />
with The Geometer’s<br />
Sketchpad.<br />
2. The rectangle in the sketch has perimeter 20 cm.<br />
Drag point P to see how the area of the rectangle varies<br />
while the perimeter stays the same.<br />
a) What is the maximum area of the rectangle?<br />
b) Measure the length and width of the rectangle with<br />
maximum area. What do you notice?<br />
c) Record your results in a table.<br />
Perimeter Maximum area Length Width<br />
(cm) (cm 2 ) (cm) (cm)<br />
20<br />
3. a) Drag point B to create a rectangle with<br />
a different perimeter.<br />
b) Determine the maximum area of the rectangle.<br />
c) Record your results in the table.<br />
4. Repeat the steps in question 3 for 3 more rectangles.<br />
5. Describe the patterns in the table.<br />
Technology: Using The Geometer’s Sketchpad to Investigate Maximum Area and Minimum Perimeter 57
Part 2: Minimum Perimeter<br />
1. Open the file MinPerim.gsp.<br />
2. The rectangle in the sketch has area 9 cm 2 .<br />
Drag point P to see how the perimeter of the rectangle<br />
varies while the area stays the same.<br />
a) What is the minimum perimeter of the rectangle?<br />
b) Measure the length and width of the rectangle<br />
with minimum perimeter.<br />
What do you notice?<br />
c) Record your results in a table.<br />
Area Minimum perimeter Length Width<br />
(cm 2 ) (cm) (cm) (cm)<br />
9<br />
3. a) Drag point B to create a rectangle with a different area.<br />
b) Determine the minimum perimeter of the rectangle.<br />
c) Record your results in the table.<br />
4. Repeat the steps in question 3 for 2 more rectangles.<br />
5. Describe the patterns in the table.<br />
58 CHAPTER 2: Investigating Perimeter and Area of Rectangles
Find the Least Perimeter<br />
Play with a classmate.<br />
➢ Player B deals 6 cards to each player.<br />
He places the other cards face down.<br />
➢ Player A rolls the number cube.<br />
The number rolled represents the area of a rectangle.<br />
Materials:<br />
• deck of playing<br />
cards<br />
A = 1 Jack = 12<br />
Queen = 14 King = 16<br />
➢ Player B finds 2 cards that are the length and width<br />
of a rectangle with that area.<br />
Player B states the perimeter of the rectangle.<br />
If he is correct, he gets 1 point.<br />
If it is the least perimeter for that rectangle, he gets 2 points.<br />
Player B puts the cards in a discard pile and takes 2 more cards<br />
from the remaining deck.<br />
Then Player B rolls the cube for Player A to find the cards.<br />
➢ If Player B does not have the 2 cards, he can take a card from<br />
the remaining deck.<br />
If Player B still does not have the 2 cards he needs,<br />
Player A tries to find the 2 cards.<br />
If no one has the two cards, Player A rolls the cube again.<br />
➢ Play continues until no cards remain in the deck.<br />
The person with more points wins.<br />
• number cube<br />
labelled 16, 20, 24,<br />
28, 32, 36<br />
The numbers on the<br />
cube are the areas<br />
of rectangles.<br />
Game: Find the Least Perimeter 59
Mid-Chapter Review<br />
2.1 2.2<br />
1. Explain how the area and perimeter of<br />
the rectangle changes in each scenario.<br />
8 cm<br />
4 cm<br />
a) The length stays the same but the<br />
width increases.<br />
b) The length stays the same but the<br />
width decreases.<br />
c) Both the length and width increase.<br />
d) Both the length and width<br />
decrease.<br />
e) The length decreases and the<br />
width increases.<br />
The amount of decrease equals<br />
the amount of increase.<br />
2. Alat made these rectangles on a<br />
geoboard.<br />
a) What is the same about all these<br />
rectangles?<br />
b) What is different?<br />
2.3<br />
3. a) List 4 possible lengths and widths<br />
for a rectangle with each area.<br />
i) 30 m 2 ii) 64 m 2<br />
b) Determine the perimeter of each<br />
rectangle in part a.<br />
4. A rectangle is 15 cm long and 9 cm<br />
wide. Its length and width change as<br />
described below.<br />
a) The length increases by 3 cm and<br />
the width decreases by 3 cm.<br />
b) The length is multiplied by 3 and<br />
the width is divided by 3.<br />
In each case, does the area change?<br />
Does the perimeter change? Explain.<br />
Include diagrams and calculations<br />
in your explanation.<br />
5. A farmer has 2 horse paddocks.<br />
One paddock is 10 m by 90 m.<br />
The other paddock is 30 m by 30 m.<br />
a) Show that both paddocks have<br />
the same area.<br />
b) Is the same amount of fencing<br />
required to enclose each paddock?<br />
Explain.<br />
6. Draw these rectangles on grid paper.<br />
Rectangle A: 20 cm by 10 cm<br />
Rectangle B: Same perimeter as<br />
rectangle A but smaller area<br />
Rectangle C: Same perimeter as<br />
rectangle A and the greatest<br />
possible area<br />
Write the dimensions, perimeter, and<br />
area of each rectangle.<br />
7. What is the maximum area of a<br />
rectangular lot that can be enclosed<br />
by 180 m of fencing?<br />
60 CHAPTER 2: Investigating Perimeter and Area of Rectangles
2.4 Minimum Perimeter for a Given Area<br />
Miriam works in a garden centre.<br />
She is asked what the least amount of edging<br />
would be for a certain rectangular area of grass.<br />
How might she find out?<br />
Investigate<br />
Least Edging for a Patio<br />
Michael has 36 square stones to arrange as a rectangular patio.<br />
He will then buy edging to go around the patio.<br />
➢ Sketch the different patios Michael can create.<br />
Label each patio with its dimensions.<br />
Which tools could<br />
you use to help you<br />
solve this problem?<br />
➢ Which patio requires the least amount<br />
of edging?<br />
➢ Suppose each stone has side length 30 cm.<br />
What is the least amount of edging needed for the patio?<br />
Justify your answer.<br />
Reflect<br />
➢ Is a 9 by 4 arrangement the same as a 4 by 9 arrangement? Explain.<br />
➢ Which measure is the same for all the patios?<br />
Which measures are different?<br />
➢ What assumptions or estimates did you make to<br />
calculate the amount of edging?<br />
➢ Describe the rectangle that uses the least amount of edging.<br />
2.4 Minimum Perimeter for a Given Area 61
Connect the Ideas<br />
➢ Eric plans to build a storage shed with floor area 60 m 2 .<br />
He wants to use the least amount of materials.<br />
So, Eric needs the least perimeter for the floor.<br />
He will use 60 square patio stones, each with area 1 m 2 .<br />
Here are some rectangles that represent floors with area 60 m 2 .<br />
2 m<br />
60 m<br />
1 m<br />
The rectangles are<br />
not drawn to scale.<br />
30 m<br />
20 m<br />
3 m<br />
15 m<br />
4 m<br />
12 m<br />
5 m<br />
10 m<br />
6 m<br />
Here are some possible dimensions and perimeters of the floor.<br />
We do not need to<br />
continue the table<br />
because we would<br />
repeat the rectangles<br />
we have.<br />
Length (m) Width (m) Perimeter (m)<br />
60 1 122<br />
30 2 64<br />
20 3 46<br />
15 4 38<br />
12 5 34<br />
10 6 32<br />
From the table, the least or<br />
minimum perimeter is 32 m.<br />
The minimum perimeter<br />
occurs when the dimensions<br />
of the floor are closest in<br />
value: 10 m and 6 m<br />
s<br />
60 m 2<br />
s<br />
➢ Jenna suggests that Eric could have a lesser perimeter if he<br />
used concrete instead of patio stones.<br />
Jenna drew a square with area 60 m 2 .<br />
The area of the square is s s. The area is also 60 m 2 .<br />
To find two equal numbers whose product is 60,<br />
Jenna used her calculator to determine the square root of 60.<br />
60 7.75<br />
A square with side length 7.75 m has perimeter:<br />
4 7.75 m 31 m<br />
This is true in general. Among all rectangles with a given area,<br />
a square has the minimum perimeter.<br />
It may not be possible to form a square when the sides of the<br />
rectangle are restricted to whole numbers.<br />
Then, the minimum perimeter occurs when the length and<br />
width are closest in value.<br />
62 CHAPTER 2: Investigating Perimeter and Area of Rectangles
Practice<br />
1. a) Draw Rectangle A on grid paper.<br />
b) Draw a different rectangle that has the same area as<br />
Rectangle A.<br />
c) Do the two rectangles have the same perimeter? Explain.<br />
A<br />
2. a) Draw Rectangle B on grid paper.<br />
b) Draw a different rectangle that has the same<br />
area as Rectangle B, but a lesser perimeter.<br />
c) Draw a rectangle that has the same area<br />
as Rectangle B with the minimum perimeter.<br />
B<br />
3. a) For each number of congruent square patio<br />
stones, which arrangement would<br />
give the minimum perimeter?<br />
i) 25 stones ii) 50 stones iii) 75 stones iv) 100 stones<br />
b) Suppose each stone in part a has side length 30 cm.<br />
What is the minimum perimeter?<br />
Remember that<br />
congruent squares<br />
are the same size.<br />
4. Look at the areas and perimeters in question 3.<br />
a) What patterns do you see in the areas?<br />
b) Do the perimeters have the same pattern? Explain.<br />
Example<br />
Solution<br />
What is the minimum perimeter for a rectangle with area 40 m 2 ?<br />
The minimum perimeter occurs when the rectangle is a square.<br />
Determine the side length, s, of a square with area 40 m 2 .<br />
Use the formula: A s 2<br />
Substitute: A 40<br />
40 s 2<br />
s 40<br />
s 6.325<br />
Calculate the perimeter of the square.<br />
Use the formula: A 4s<br />
Substitute: s 6.325<br />
P 4(6.325)<br />
25.3<br />
The minimum perimeter for the rectangle is approximately 25.3 m.<br />
s<br />
40 m 2<br />
s<br />
2.4 Minimum Perimeter for a Given Area 63
In questions 5 to 7, round your answers to 1 decimal place.<br />
5. What is the minimum perimeter for a rectangle with each area?<br />
a) 30 m 2 b) 60 m 2 c) 90 m 2 d) 120 m 2<br />
6. Assessment Focus Determine the dimensions of a rectangle<br />
with area 1000 m 2 whose perimeter is the least possible.<br />
What is the minimum perimeter? Justify your answer.<br />
Having Trouble?<br />
Read Connect<br />
the Ideas.<br />
7. A rectangular patio is to be built from 56 congruent square tiles.<br />
a) Which patio design will give the minimum perimeter?<br />
b) Is this patio a square? Explain.<br />
8. Keung has been comparing rectangles that have the same area.<br />
He says that rectangles whose lengths and widths are close in value<br />
have greater perimeters than rectangles whose lengths and widths<br />
are very different. Do you agree? Explain.<br />
9. In a banquet room, there are small square tables<br />
that seat 1 person on each side.<br />
The tables are pushed together to create<br />
larger rectangular tables.<br />
a) Consider all possible arrangements of<br />
12 square tables.<br />
Sketch each arrangement on grid paper.<br />
b) Which arrangement seats the most people?<br />
The fewest people? Explain.<br />
c) Explain why the minimum perimeter<br />
might not be preferred in this situation.<br />
10. Take It Further<br />
a) Draw a square.<br />
b) Draw a rectangle that has the same area as the square<br />
but a different perimeter.<br />
c) Is it possible to draw a rectangle that has the same area<br />
as the square but a lesser perimeter than the square?<br />
Explain.<br />
Which tools could<br />
you use to solve this<br />
problem?<br />
For a given area, describe the rectangle that has the least perimeter.<br />
Will the rectangle always be a square? Explain.<br />
64 CHAPTER 2: Investigating Perimeter and Area of Rectangles
2.5<br />
Problems Involving Maximum or<br />
Minimum Measures<br />
Recall, from page 61, that Michael was building<br />
a rectangular patio with 36 square stones.<br />
To save money on edging, Michael decides to place<br />
the patio against the side of the house.<br />
Now, edging will be needed on only three sides of the patio.<br />
Investigate<br />
Solving a Problem About Minimum Length<br />
For Michael’s patio:<br />
Which tools could<br />
you use to solve this<br />
problem?<br />
➢ What should the dimensions be so the patio uses the<br />
minimum length of edging?<br />
➢ Each stone has side length 30 cm.<br />
What is the minimum length of edging?<br />
Justify your answer.<br />
Reflect<br />
➢ Could you have used the patios you drew in<br />
Section 2.4 Investigate? Explain.<br />
➢ Will a 4 by 9 patio and a 9 by 4 patio require the same<br />
length of edging? Explain.<br />
➢ Is the patio that requires the minimum length of edging<br />
a square? Explain.<br />
2.5 Problems Involving Maximum or Minimum Measures 65
Connect the Ideas<br />
A rectangular swimming area is to be enclosed by 100 m of rope.<br />
One side of the swimming area is along the shore,<br />
so the rope will only be used on three sides.<br />
What is the maximum swimming area that can be created?<br />
Sketch rectangles to represent the swimming areas.<br />
Calculate the area of each rectangle.<br />
For example, consider a swimming area with width 5 m.<br />
90 m<br />
5 m<br />
Two widths and 1 length are formed by the rope.<br />
The rope is 100 m.<br />
Two widths are: 2(5 m) 10 m<br />
So, the length is: 100 m − 10 m 90 m<br />
The area is: (5 m)(90 m) 450 m 2<br />
5 m<br />
90 m<br />
10 m<br />
80 m<br />
15 m<br />
70 m<br />
Area 450 m 2<br />
Area 800 m 2<br />
Area 1050 m 2<br />
60 m<br />
50 m<br />
40 m<br />
20 m<br />
25 m<br />
30 m<br />
Area 1200 m 2<br />
Area 1250 m 2<br />
Area 1200 m 2<br />
30 m<br />
20 m<br />
10 m<br />
35 m<br />
40 m<br />
45 m<br />
Area 1050 m 2<br />
Area 800 m 2<br />
The areas increase, then decrease.<br />
The maximum swimming area is 1250 m 2 .<br />
Only one of the rectangles has this area.<br />
The maximum swimming area is not a square.<br />
It is a rectangle that measures 50 m by 25 m.<br />
Area 450 m 2<br />
66 CHAPTER 2: Investigating Perimeter and Area of Rectangles
Practice<br />
1. A store owner uses 16 m of rope for a rectangular display.<br />
There is a wall on one side, so the rope is only used<br />
for the other 3 sides.<br />
a) Copy these rectangles.<br />
Determine the missing measures.<br />
1 m<br />
14 m<br />
12 m<br />
2 m<br />
3 m<br />
10 m<br />
Area 14 m 2 Area 24 m 2 Area 30 m 2<br />
4 m<br />
5 m<br />
6 m<br />
7 m<br />
b) What are the dimensions of the maximum area that can be enclosed?<br />
How are these dimensions related?<br />
2. Cody has 20 m of fencing to build a rectangular pen for his dog.<br />
One side of the pen will be against his house.<br />
a) Sketch and label as many possible rectangles as you can.<br />
b) Copy and complete this table.<br />
Width (m) Length (m) Area (m 2 )<br />
1 18 18<br />
Continue until the<br />
width is 9 m.<br />
c) What dimensions give the maximum area for the pen?<br />
How are these dimensions related?<br />
3. Assessment Focus A rectangular field is enclosed by 80 m of fencing.<br />
a) What are the dimensions of the field with maximum area in each situation?<br />
i) The fence encloses the entire field. ii) One side of the field is not fenced.<br />
b) How are the dimensions of the rectangles in part a related?<br />
2.5 Problems Involving Maximum or Minimum Measures 67
Example<br />
Solution<br />
A patio is to be built on the side of<br />
a house using 24 congruent square stones.<br />
It will then be edged on 3 sides. Which<br />
arrangement requires the minimum edging?<br />
The area of the patio is 24 square units.<br />
List pairs of numbers with product 24.<br />
Calculate the edging required for<br />
each patio.<br />
For a 3 by 8 arrangement, this is:<br />
Amount of edging 2(3) 8<br />
14<br />
A 4 by 6 arrangement uses the same<br />
amount of edging. So, there are<br />
2 different arrangements that require<br />
the minimum edging.<br />
Width Length Edging<br />
(units) (units) (units)<br />
1 24 26<br />
2 12 16<br />
3 8 14<br />
4 6 14<br />
6 4 16<br />
8 3 19<br />
12 2 26<br />
24 1 49<br />
4. A patio of 72 congruent square stones is to be built on the<br />
side of a house. Sketch and label possible patio designs.<br />
Which design has the minimum distance around the sides<br />
not attached to the house?<br />
5. A patio of 72 congruent square stones is to be built in the<br />
corner of a backyard against a fence. Sketch and label<br />
possible patio designs. Which design requires the minimum<br />
edging for the sides not against the fence?<br />
Fence<br />
Fence<br />
6. Take It Further Twenty-six sections of fence, each 1 m long,<br />
are used to create two storage enclosures of equal area.<br />
a) Find another way to arrange 26 sections to<br />
make two equal storage areas.<br />
The storage areas should share one side.<br />
b) What should the length and width of each storage area<br />
be to make the enclosure with the maximum area?<br />
What are the dimensions of this enclosure?<br />
Which tools could<br />
you use to solve<br />
this problem?<br />
For a given area, you have found the rectangle with the minimum<br />
perimeter and the rectangle with the minimum length of 3 sides.<br />
How are the rectangles different? Include sketches in your explanation.<br />
68 CHAPTER 2: Investigating Perimeter and Area of Rectangles
Chapter Review<br />
What Do I Need to Know?<br />
Area and Perimeter Formulas<br />
Rectangle<br />
Square<br />
w<br />
s<br />
<br />
Area: A w Area: A s 2<br />
Perimeter: P 2( w)<br />
Perimeter: P 4s<br />
or, P 2 2w<br />
Maximum Area of a Rectangle<br />
Rectangles with the same<br />
perimeter can have<br />
different areas.<br />
For example, all these rectangles<br />
have perimeter 16 cm.<br />
If the dimensions of the<br />
rectangle are restricted to<br />
whole numbers, it may not<br />
be possible to form a square.<br />
The maximum area occurs<br />
when the length and width<br />
are closest in value.<br />
A 7 cm 2<br />
A 12 cm 2<br />
A 15 cm 2<br />
A 16 cm 2<br />
This rectangle<br />
has the<br />
maximum area.<br />
Minimum Perimeter of a Rectangle<br />
Rectangles with the same area<br />
can have different perimeters.<br />
For example, all these rectangles<br />
have area 16 m 2 .<br />
If the rectangle is made from<br />
congruent square tiles, it may not be<br />
possible to form a square.<br />
The minimum perimeter occurs when<br />
the length and width are closest in value.<br />
P 34 m<br />
P 20 m<br />
P 16 m<br />
This rectangle has the minimum perimeter.<br />
Chapter Review 69
What Should I Be Able to Do?<br />
2.1<br />
1. A 3-m ladder leans against a wall.<br />
The ladder slips down the wall.<br />
4. a) Determine the perimeter and<br />
area of square B.<br />
4 cm<br />
B<br />
a) Which measures stay the same?<br />
b) Which measures vary?<br />
Tell whether each measure is<br />
increasing or decreasing.<br />
b) Draw a rectangle that has the<br />
same perimeter as square B,<br />
but a different area.<br />
c) Can you draw a rectangle that has<br />
the same perimeter as square B,<br />
but a greater area?<br />
Justify your answer.<br />
2.2<br />
2. A rectangle has perimeter 100 cm.<br />
a) Copy and complete this table.<br />
For each width, determine<br />
the length and area of the<br />
rectangle.<br />
Width (cm) Length (cm) Area (cm 2 )<br />
5<br />
10<br />
15<br />
20<br />
25<br />
2.3<br />
5. a) Do rectangle OABC and rectangle<br />
ODEF have the same perimeter?<br />
The same area? Explain.<br />
C<br />
F<br />
B<br />
E<br />
b) Describe the patterns in the table.<br />
3. A rectangle has area 72 cm 2 .<br />
a) Copy and complete this table.<br />
For each width, determine<br />
the length and perimeter of<br />
the rectangle.<br />
Width (cm) Length (cm) Perimeter (cm)<br />
2<br />
4<br />
6<br />
8<br />
b) Describe the patterns in the table.<br />
O<br />
b) Copy the rectangles in part a on<br />
grid paper. On the same diagram,<br />
draw as many rectangles as you<br />
can that have the same perimeter<br />
as rectangle OABC.<br />
c) Describe the patterns in the<br />
rectangles.<br />
d) In part b, describe the rectangle<br />
with:<br />
i) the maximum area<br />
ii) the minimum area<br />
e) Suppose you drew the rectangles<br />
in part b on plain paper. Would<br />
your answers to part d change?<br />
Explain.<br />
A<br />
D<br />
70 CHAPTER 2: Investigating Perimeter and Area of Rectangles
6. a) For each perimeter below,<br />
determine the dimensions of the<br />
rectangle with the maximum area.<br />
i) 8 cm ii) 34 cm iii) 54 cm<br />
b) Calculate the area of each<br />
rectangle in part a.<br />
How do you know each area<br />
is a maximum?<br />
7. Steve has 58 m of fencing for a<br />
rectangular garden.<br />
a) What are the dimensions<br />
of the largest garden<br />
Steve can enclose?<br />
b) What is the area of this garden?<br />
2.5<br />
11. Rachel plans to build a rectangular<br />
patio with 56 square stones.<br />
a) Sketch the different patios Rachel<br />
can create. Label each patio with<br />
its dimensions.<br />
b) Suppose Rachel decides to put<br />
edging around the patio.<br />
Which patio requires the<br />
minimum amount of edging?<br />
Justify your answer.<br />
12. A lifeguard has 400 m of rope to<br />
enclose a rectangular swimming<br />
area. One side of the rectangle is the<br />
beach, and does not need rope.<br />
Q<br />
R<br />
2.4<br />
8. Refer to question 7.<br />
Suppose the fencing comes in 1-m<br />
lengths that cannot be cut.<br />
a) What are the dimensions of the<br />
largest garden Steve can enclose?<br />
b) What is the area of this garden?<br />
9. a) For each area below, determine<br />
the dimensions of a rectangle<br />
with the minimum perimeter.<br />
i) 16 m 2 ii) 24 m 2 iii) 50 m 2<br />
b) Calculate the perimeter of each<br />
rectangle in part a.<br />
How do you know each perimeter<br />
is a minimum?<br />
10. Determine the dimensions of<br />
a rectangle with area 196 cm 2 and<br />
the minimum perimeter. What is the<br />
minimum perimeter?<br />
P<br />
a) Suppose side QR measures<br />
300 m. What is the length of RS?<br />
b) Suppose side RS measures 85 m.<br />
What is the length of QR?<br />
c) What are the dimensions of the<br />
rectangle with the maximum<br />
area? Justify your answer.<br />
S<br />
Chapter Review 71
Practice Test<br />
Multiple Choice: Choose the correct answer for questions 1 and 2.<br />
1. Pina makes a rectangular garden surrounded by 32 m of edging.<br />
Which of these figures has the maximum area?<br />
A. A 2-m by 4-m rectangle B. A 4-m by 12-m rectangle<br />
C. A 6-m by 10-m rectangle D. A square with side length 8 m<br />
2. A rectangle has an area of 36 m 2 .<br />
Which dimensions will ensure that the rectangle has the minimum perimeter?<br />
A. 6 m by 6 m B. 9 m by 4 m C. 12 m by 3 m D. 18 m by 2 m<br />
Show all your work for questions 3 to 7.<br />
3. Application Lindsay was planning to build a rectangular patio<br />
with 24 square stones and to edge it on all four sides.<br />
a) Sketch the different patios Lindsay can create.<br />
Label each patio with its dimensions.<br />
b) Which patio requires the minimum amount of edging?<br />
Justify your answer.<br />
4. Knowledge and Understanding Determine the maximum area<br />
of a rectangle with each given perimeter.<br />
a) 28 cm b) 86 cm<br />
5. Communication When you see a rectangle, how do you know if:<br />
a) it has the minimum perimeter for its area?<br />
b) it has the maximum area for its perimeter?<br />
Include diagrams in your explanation.<br />
6. Thinking Eighteen sections of fence, each 1 m long, are used<br />
to make a rectangular storage area.<br />
a) How many sections should be used for the length and<br />
the width to make the storage area a maximum?<br />
What is this area?<br />
b) Suppose workers found 2 more sections.<br />
Where should these sections be put for the<br />
maximum storage area? Justify your answer.<br />
7. Suppose the storage area in question 6 is<br />
bordered by a wall on one side and 18 sections<br />
around the remaining 3 sides. What are the<br />
dimensions of the largest area that can be formed?<br />
72 CHAPTER 2: Investigating Perimeter and Area of Rectangles
What<br />
You’ll Learn<br />
The properties and<br />
relationships among angles<br />
in polygons and angles<br />
involving parallel lines<br />
And Why<br />
These relationships are<br />
often used in carpentry and<br />
construction; for example, to<br />
ensure that floor tiles align<br />
correctly or that the sides of<br />
a door frame are parallel.<br />
Project<br />
Link<br />
Key Words<br />
• interior angle<br />
• exterior angle<br />
• transversal<br />
• corresponding<br />
angles<br />
• alternate angles<br />
• Designing with Shape,<br />
Colour, and Motion
Using a Frayer Model<br />
Every math topic has words and concepts for you to learn.<br />
A Frayer model is a tool that helps you visualize new words<br />
and concepts.<br />
It makes connections to what you already know.<br />
Here is an example of a Frayer model.<br />
Definition (in own words)<br />
A triangle with each<br />
angle less than 90 <br />
Examples<br />
Acute triangle<br />
Facts/Characteristics<br />
It has 3 sides and 3 angles.<br />
The sum of the angles is 180 .<br />
Nonexamples<br />
Isosceles<br />
Equilateral<br />
Scalene<br />
not less<br />
than 90 <br />
greater<br />
than 90 <br />
has<br />
4 sides<br />
See if you can figure out which word goes in the centre of this<br />
Frayer model.<br />
Definition (in own words)<br />
A figure with<br />
4 sides and<br />
4 angles<br />
Examples<br />
Square<br />
Rectangle<br />
Parallelogram<br />
Trapezoid<br />
Kite<br />
?<br />
Facts/Characteristics<br />
The sides are straight.<br />
The figure is closed.<br />
Nonexamples<br />
Triangle<br />
Pentagon<br />
Circle<br />
Cube<br />
Make your own Frayer model for each of these concepts:<br />
• Isosceles triangle<br />
• Pythagorean Theorem<br />
As you work through this chapter, look for ways to use<br />
a Frayer model.<br />
Scan each section for new words and new concepts.<br />
Try to make at least 3 Frayer models in this chapter.<br />
Here are some suggestions:<br />
• Exterior angle<br />
• Parallel lines<br />
• Quadrilateral<br />
74 CHAPTER 3: Relationships in Geometry
3.1 Angles in Triangles<br />
Investigate<br />
The Sum of the Interior Angles in a Triangle<br />
Work in a group of 3.<br />
You will need scissors.<br />
Draw large triangles.<br />
➢ Use a ruler. Each of you draws one of these triangles:<br />
acute triangle, obtuse triangle, and right triangle.<br />
Cut out the triangles.<br />
➢ Place each triangle so its longest side is at<br />
the bottom and its shortest side is to your left.<br />
Label the angles as shown.<br />
Turn over the triangle so the labels are face down.<br />
b<br />
c<br />
a<br />
➢ Make a fold as shown.<br />
The crease is at right angles to the bottom side.<br />
c<br />
➢ Unfold the triangle and lay it flat.<br />
Mark the point M where the crease meets the bottom side.<br />
M<br />
➢ Fold each vertex of the triangle<br />
to meet at point M.<br />
➢ How do the three angles of the<br />
triangle appear to be related?<br />
a b Mc<br />
Reflect<br />
➢ Compare your results with those of your group.<br />
➢ Did everyone get the same relationship? Explain.<br />
3.1 Angles in Triangles 75
Connect the Ideas<br />
The 3 angles in<br />
a triangle are its<br />
interior angles.<br />
Zahara constructs a triangle using The Geometer’s Sketchpad.<br />
She measures the angles in the triangle<br />
and calculates their sum.<br />
B<br />
84<br />
A<br />
50<br />
46<br />
A B C 180<br />
Acute triangle<br />
C<br />
Zahara drags the vertices to create different types of triangles.<br />
The angle measures change, but their sum does not.<br />
B<br />
101<br />
B<br />
61<br />
B<br />
70<br />
A<br />
45<br />
34<br />
A B C 180<br />
Obtuse triangle<br />
C<br />
A<br />
90<br />
29<br />
A B C 180<br />
Right triangle<br />
C<br />
55 55<br />
A<br />
C<br />
A B C 180<br />
Isosceles triangle<br />
The sum of the three interior<br />
angles of a triangle is 180°.<br />
That is, a b c 180°<br />
a<br />
b<br />
c<br />
We can use this relationship to determine the third angle in a<br />
triangle when we know the other two angles.<br />
In ABC, A B C 180°<br />
A<br />
B C 36° 46°<br />
82°<br />
B<br />
36<br />
46<br />
C<br />
To determine A, think:<br />
What do we add to 82° to get 180°?<br />
Subtract to find out.<br />
180° 82° 98°<br />
So, A 98°<br />
76 CHAPTER 3: Relationships in Geometry
Practice<br />
1. Use a ruler to draw a large triangle.<br />
Cut out the triangle and tear off its corners.<br />
Put the corners together as shown.<br />
Which relationship does this illustrate? Explain.<br />
2. Determine each unknown angle.<br />
a) b) D<br />
c)<br />
A<br />
80<br />
70<br />
1<br />
2 3<br />
1<br />
3<br />
2<br />
53°<br />
G<br />
B<br />
50<br />
C<br />
E<br />
3. For each set of angles, can a triangle be drawn?<br />
Justify your answers.<br />
a) 41°, 72°, 67° b) 40°, 60°, 100° c) 100°, 45°, 30°<br />
64<br />
F<br />
K<br />
104°<br />
H<br />
4. Can a triangle have two 90° angles? Explain.<br />
5. Assessment Focus<br />
A<br />
a) Draw then cut out a right triangle. Fold the a<br />
triangle as shown. What does this tell you about<br />
the acute angles of a right triangle?<br />
b) Use what you know about the sum of the angles<br />
b<br />
in a triangle to explain your result in part a.<br />
c) Determine each unknown angle. Explain how you did this.<br />
i) E<br />
ii) Q<br />
iii)<br />
60°<br />
a<br />
b<br />
C B C, A, B<br />
B<br />
C<br />
F<br />
D<br />
R<br />
54°<br />
P<br />
A<br />
45°<br />
6. Draw then cut out an isosceles triangle.<br />
Fold the triangle as shown.<br />
What does this tell you about the angles opposite the equal<br />
sides of an isosceles triangle?<br />
b<br />
B<br />
A<br />
c<br />
C<br />
A<br />
c<br />
b C<br />
B<br />
Example<br />
a) Write a relationship for the measures of the angles in<br />
isosceles DEF.<br />
b) Use the relationship to determine the measures of D<br />
and F.<br />
D<br />
124 E<br />
F<br />
3.1 Angles in Triangles 77
Solution<br />
a) The sum of the angles in a triangle is 180°.<br />
So, D F 124° 180°<br />
b) D F 180° 124°<br />
56°<br />
In an isosceles triangle, the angles opposite<br />
the equal sides are equal.<br />
DE FE, so D F<br />
There are 2 equal angles with a sum of 56°.<br />
So, each angle is: 56° 28°<br />
2<br />
D 28° and F 28°<br />
Think: What do we add<br />
to 124° to get 180°?<br />
Subtract to find out.<br />
Recall that<br />
56° 2.<br />
56°<br />
2<br />
means<br />
7. In each isosceles ABC below:<br />
i) Write a relationship for the measures of the angles.<br />
ii) Use the relationship to determine the measures of A and B.<br />
a) B<br />
b) A<br />
c) A<br />
C d)<br />
31<br />
B<br />
A<br />
C<br />
50<br />
C<br />
B<br />
B<br />
C<br />
66<br />
A<br />
8. Most cars have a scissors jack. It has all 4 sides equal.<br />
a) The angle shown is 40°. Determine the angle at the top<br />
of the jack.<br />
b) Suppose the angle shown increases to 42°.<br />
What happens to the angle at the top of the jack?<br />
Explain how you know.<br />
9. An equilateral triangle has 3 equal sides and 3 equal angles.<br />
Use this information to determine the measure of each angle.<br />
Show your work.<br />
10. Take It Further Determine the angle measure indicated by each letter.<br />
a) b) c)<br />
48 c<br />
d e<br />
35<br />
a b<br />
28<br />
28<br />
54<br />
20<br />
g<br />
f<br />
h<br />
Suppose you know the measure of one angle in a triangle.<br />
What else would you need to know about the triangle to<br />
determine the measures of all its angles? Explain.<br />
78 CHAPTER 3: Relationships in Geometry
Using The Geometer’s Sketchpad<br />
to Investigate Angles Related<br />
to Triangles<br />
Part 1: The Relationship among the Interior Angles<br />
1. Open the file TriangleAngles.gsp. Click the tab for page 1.<br />
2. Drag vertices A, B, and C to create 5 different triangles.<br />
a) For each triangle, copy this table and record the measures<br />
of A, B, and C.<br />
A B C A B C<br />
b) Calculate the sum of each set of angles.<br />
c) How do the interior angles of a triangle appear to be related?<br />
3. We can arrange A, B, and C so the vertex of each angle is<br />
at the centre of a circle.<br />
a) Drag vertices A, B, and C to create different triangles.<br />
Observe how the angles change on the circle.<br />
b) How does arranging the angles on a circle support your<br />
answer to question 2c?<br />
Part 2: The Relationship among the Interior<br />
and Exterior Angles<br />
1. Use the file TriangleAngles.gsp. Click the tab for page 2.<br />
Technology: Using The Geometer’s Sketchpad to Investigate Angles Related to Triangles 79
2. In ABC, side AC is extended to D to form exterior BCD.<br />
a) Drag vertices A, B, and C to create 5 different triangles.<br />
For each triangle, copy this table and record the measures<br />
of A, B, and BCD.<br />
A B BCD<br />
b) How do the three angles appear to be related? Explain why.<br />
c) Click the button: Move to Exterior Angle<br />
How does this animation support your answer to part b?<br />
Part 3: The Relationship among the Exterior Angles<br />
1. Use the file TriangleAngles.gsp. Click the tab for page 3.<br />
2. Drag vertices A, B, and C to create 5 different triangles.<br />
a) For each triangle, copy this table and record the measures<br />
of the exterior angles.<br />
BAZ CBX ACY BAZ CBX ACY<br />
b) Calculate the sum of each set of angles.<br />
c) How do the exterior angles of a triangle appear to be<br />
related? Explain why.<br />
3. We can arrange BAZ, CBX, and ACY so each vertex is at<br />
the centre of a circle.<br />
a) Drag vertices A, B, and C to create different triangles.<br />
Observe how the angles change on the circle.<br />
b) How does arranging the angles on a circle support your<br />
answer to question 2c?<br />
80 CHAPTER 3: Relationships in Geometry
3.2 Exterior Angles of a Triangle<br />
Enrico is a carpenter. He is building a ramp.<br />
Enrico knows that the greater angle between<br />
the ramp and the floor is 160°. Ramp<br />
How can Enrico calculate the<br />
?<br />
angle the vertical support<br />
makes with the ramp?<br />
160<br />
An exterior angle is formed<br />
outside a triangle when one<br />
side is extended.<br />
Angle GBC is an exterior<br />
angle of ABC.<br />
A<br />
B<br />
G<br />
C<br />
Investigate<br />
Relating Exterior and Interior Angles of a Triangle<br />
Work in a group of 3.<br />
➢ Each of you draws one of these triangles:<br />
– acute triangle<br />
– right triangle<br />
– obtuse triangle<br />
➢ Extend one side to form an exterior angle.<br />
Measure and record the exterior angle and the interior angles.<br />
Look for relationships between the exterior angle and one or<br />
more of the interior angles.<br />
Reflect<br />
Compare your results with those of your group.<br />
➢ How is the exterior angle related to the interior angle<br />
beside it?<br />
➢ How is the exterior angle related to the other two interior<br />
angles?<br />
➢ Do your results depend on the type of triangle? Explain.<br />
➢ Explain your results using facts you already know about<br />
angles and their sums.<br />
3.2 Exterior Angles of a Triangle 81
Connect the Ideas<br />
Exterior and<br />
interior angles<br />
Jamie cuts out a paper triangle.<br />
He tears off the corners at A and B and finds<br />
that they fit exterior ACD.<br />
That is, ACD A B<br />
B<br />
A<br />
C<br />
D<br />
Each exterior angle of a triangle<br />
is equal to the sum of the two<br />
opposite interior angles.<br />
That is, e a b<br />
b<br />
e<br />
a<br />
We can use this relationship to calculate<br />
the measure of A.<br />
ACD A B<br />
So, 135° A 93°<br />
Think: What do we add to 93°<br />
to get 135°?<br />
Subtract to find out.<br />
135° 93° 42°<br />
A 42°<br />
D<br />
C<br />
135<br />
B<br />
93<br />
A<br />
Sum of the<br />
exterior angles<br />
Extend the sides of ABC<br />
to form the other<br />
exterior angles.<br />
F<br />
B<br />
93<br />
BAE 180° 42°<br />
138°<br />
FBC 180° 93°<br />
87°<br />
The sum of the exterior angles is:<br />
135° 138° 87° 360°<br />
D<br />
C<br />
135<br />
42<br />
A<br />
E<br />
This relationship is true for any triangle.<br />
The sum of the 3 exterior<br />
angles of a triangle is 360°.<br />
That is, p q r 360°<br />
p<br />
r<br />
q<br />
82 CHAPTER 3: Relationships in Geometry
Practice<br />
1. a) For each exterior angle, name the opposite interior angles.<br />
b) Write a relationship between the exterior angle and the opposite interior angles.<br />
i) B<br />
ii) G<br />
iii)<br />
F<br />
H<br />
J<br />
K<br />
A<br />
C<br />
D<br />
D<br />
E<br />
M<br />
2. Determine each unknown exterior angle.<br />
Which relationship are you using each time?<br />
a) B<br />
b) F<br />
c)<br />
J<br />
74<br />
79<br />
24<br />
G<br />
D<br />
A<br />
44<br />
C<br />
E<br />
32<br />
H<br />
H<br />
48<br />
K<br />
M<br />
d) P<br />
e) R<br />
f)<br />
W<br />
R<br />
62<br />
N<br />
30<br />
M<br />
Q<br />
106<br />
S<br />
T<br />
V<br />
X<br />
U<br />
3. Determine the unknown interior angles.<br />
Justify your answers.<br />
a) B<br />
b) F<br />
c)<br />
70<br />
J<br />
22<br />
D<br />
A<br />
125<br />
C<br />
E<br />
41<br />
120<br />
G<br />
H<br />
H<br />
K<br />
71<br />
M<br />
4. A carpenter uses an L-square to measure<br />
the timber for a rafter.<br />
The ridge angle is 130°.<br />
What is the plate angle?<br />
How do you know?<br />
Ridge angle<br />
L-square<br />
Rafter<br />
Plate angle<br />
3.2 Exterior Angles of a Triangle 83
5. Assessment Focus Grace’s tech design<br />
class builds a model of a roof truss.<br />
The broken line is a line of symmetry.<br />
Determine the measure of each<br />
angle in the truss.<br />
A<br />
Explain how you know.<br />
28<br />
B<br />
56<br />
C<br />
F<br />
D<br />
E<br />
G<br />
K<br />
72<br />
H<br />
J<br />
6. Draw a triangle with an exterior angle of 160° and another exterior angle of 72°.<br />
a) Measure the third exterior angle.<br />
b) How are the three exterior angles related? Explain.<br />
c) Compare your triangle and your results with your classmates.<br />
What do you notice?<br />
When we know two exterior angles, we can determine the third exterior angle.<br />
Example<br />
Determine the angle measure indicated by x.<br />
Solution<br />
The sum of the 3 exterior angles of a triangle<br />
is 360°.<br />
So, x 110° 125° 360°<br />
x 235° 360°<br />
x 360° 235°<br />
125°<br />
x<br />
110<br />
125<br />
7. Determine the angle measure indicated by each letter. Justify your answers.<br />
a) b) c)<br />
85<br />
70<br />
y<br />
y<br />
x<br />
x<br />
150<br />
x<br />
z 38 85<br />
8. Take It Further Sketch a triangle with two exterior angles of 150° and 130°.<br />
Describe all the different ways you can determine the measures of<br />
the third exterior angle and the three interior angles.<br />
What do you know about the exterior angles of a triangle?<br />
Use diagrams to explain.<br />
84 CHAPTER 3: Relationships in Geometry
Using The Geometer’s Sketchpad<br />
to Investigate Angles Involving<br />
Parallel Lines<br />
1. Open the file Parallel.gsp. Click the tab for page 1.<br />
2. Transversal EF intersects AB to form 4 angles at H.<br />
a) Why are the acute angles equal?<br />
b) Why are the obtuse angles equal?<br />
c) How are the acute and obtuse angles related? Explain.<br />
3. CD is parallel to AB. EF intersects CD to form 4 angles at G.<br />
a) How do you think the angles at G are related to the angles<br />
at H? Explain.<br />
b) Click the button: Slide AB to CD.<br />
c) Were you correct in part a? Explain.<br />
4. Drag points E and F to change the angles that EF makes with<br />
AB and CD.<br />
a) What do you notice?<br />
b) Why are the angles related this way?<br />
Corresponding<br />
angles<br />
5. Click the tab for page 2.<br />
Technology: Using The Geometer’s Sketchpad to Investigate Angles Involving Parallel Lines 85
6. Four pairs of corresponding angles are formed by a transversal<br />
and two lines.<br />
a) If the lines are parallel, how are pairs of corresponding<br />
angles related?<br />
b) Does the same relationship hold when the lines are not parallel?<br />
Explain.<br />
Alternate angles<br />
7. Click the tab for page 3.<br />
8. Two pairs of alternate angles are formed by a transversal<br />
and two lines.<br />
a) If the lines are parallel, how are pairs of alternate angles related?<br />
b) Does the same relationship hold when the lines are not parallel?<br />
Explain.<br />
Interior angles<br />
9. Click the tab for page 4.<br />
10. Two pairs of interior angles are formed by a transversal<br />
and two lines.<br />
a) If the lines are parallel, what is the sum of the angles<br />
in a pair of interior angles?<br />
b) Does the same relationship hold when the lines are not parallel?<br />
Explain.<br />
86 CHAPTER 3: Relationships in Geometry
3.3 Angles Involving Parallel Lines<br />
Jon is learning to sail. He uses parallel rulers<br />
to map a course 225° from his current position.<br />
He places one edge of<br />
a ruler to align with 225°<br />
on a compass.<br />
He swings the other edge of<br />
the ruler to his current position<br />
and draws the course line.<br />
Investigate<br />
Angles Involving Parallel Lines<br />
You will need a protractor.<br />
➢ Draw diagrams like this.<br />
Use both edges of a ruler to draw the parallel lines<br />
in the second diagram.<br />
a b c<br />
d<br />
m n<br />
p o<br />
e<br />
f<br />
h g<br />
q r<br />
t s<br />
➢ Measure the angles.<br />
➢ How are the angles related?<br />
➢ Which angles have a sum of 180°? How do you know?<br />
Reflect<br />
➢ When a line intersects two parallel lines, how can you<br />
remember which pairs of angles are equal?<br />
➢ Does each diagram have the same number of pairs of<br />
equal angles? Explain.<br />
3.3 Angles Involving Parallel Lines 87
Connect the Ideas<br />
A transversal is<br />
a line that intersects<br />
two or more other<br />
lines.<br />
When a transversal intersects two lines, four pairs<br />
of opposite angles are formed.<br />
The angles in each pair are equal.<br />
When the lines are parallel,<br />
angles in other pairs are also equal.<br />
We can use tracing paper to show<br />
these relationships.<br />
Corresponding<br />
angles form an<br />
F pattern.<br />
Corresponding angles are equal.<br />
They have the same<br />
position with respect<br />
to the transversal and<br />
the parallel lines.<br />
x<br />
x<br />
x<br />
x<br />
Alternate angles<br />
form a Z pattern.<br />
Alternate angles are equal.<br />
They are between the parallel<br />
lines on opposite sides of the<br />
transversal.<br />
x<br />
x<br />
Interior angles form<br />
a C pattern.<br />
Interior angles have a sum<br />
of 180°. They are between the<br />
parallel lines on the same side<br />
of the transversal.<br />
x<br />
x<br />
We can use these relationships to determine the measures of other<br />
angles when one angle measure is known.<br />
48<br />
x<br />
w<br />
y<br />
z<br />
➢ w and 48° are measures<br />
of opposite angles.<br />
Opposite angles are equal,<br />
so w 48°.<br />
➢ w and x form a straight<br />
angle. The sum of their<br />
measures is 180°.<br />
w 48°, so x 180° 48°<br />
132°<br />
➢ w and y are alternate angles.<br />
They are equal.<br />
w 48°, so y 48°<br />
➢ w and z are corresponding<br />
angles.<br />
They are equal.<br />
w 48°, so z 48°<br />
88 CHAPTER 3: Relationships in Geometry
Practice<br />
1. In each diagram, which other angle measures can you find?<br />
Determine these measures. Which relationships did you use?<br />
a) b)<br />
A<br />
A<br />
E<br />
C<br />
G<br />
D<br />
B<br />
62<br />
F<br />
H<br />
E<br />
62<br />
B<br />
C<br />
G<br />
D<br />
F<br />
H<br />
Example<br />
Determine the values of x and y.<br />
116<br />
Solution<br />
Since x and 116° are the measures of interior<br />
angles between parallel lines, their sum is 180°; 134<br />
that is, x 116° 180°<br />
So, x 180° 116°<br />
64°<br />
Similarly, the measures of y and 134° have a sum of 180°; that is,<br />
y 134° 180°<br />
So, y 180° 134°<br />
46°<br />
x<br />
y<br />
2. Determine the angle measure indicated by each letter. Justify your answers.<br />
a) b) c)<br />
b<br />
45<br />
60<br />
a<br />
86<br />
d<br />
f e<br />
141<br />
h<br />
g<br />
55<br />
a<br />
d<br />
b<br />
c<br />
115<br />
3. Assessment Focus Petra says these relationships are always true<br />
when two parallel lines are intersected by a transversal.<br />
• All the acute angles are equal.<br />
• All the obtuse angles are equal.<br />
• The sum of any acute angle and any obtuse angle is 180°.<br />
Is she correct?<br />
Explain your thinking.<br />
Include a diagram in your explanation.<br />
Which relationships<br />
can you use?<br />
3.3 Angles Involving Parallel Lines 89
4. The diagram shows three sections of a steam pipe.<br />
The top pipe and bottom pipe are parallel.<br />
What is the angle between sections BC and CD?<br />
Show your work.<br />
5. Alison is building a section of fence.<br />
To make sure the boards are parallel,<br />
she measures the angles indicated.<br />
Are the boards parallel?<br />
Justify your answer.<br />
6. An ironing board is designed so the board is always<br />
parallel to the floor as it is raised and lowered.<br />
In the diagram, the two triangles are isosceles and<br />
AEB is 88°.<br />
Determine all the angles in ECD.<br />
C<br />
A<br />
88°<br />
E<br />
B<br />
D<br />
7. a) List what you know about the interior and exterior<br />
angles of triangles.<br />
b) List what you know about angles involving parallel lines<br />
cut by a transversal.<br />
c) Use the properties in parts a and b.<br />
Create a design, pattern, or picture.<br />
Colour your design.<br />
Explain how it illustrates the properties.<br />
Which tools could<br />
you use to help you?<br />
8. Take It Further Use a ruler to draw a diagram like the<br />
one at the right.<br />
Two transversals intersect at B.<br />
a) Measure to determine the values of a, b, and c.<br />
How are the measures related?<br />
b) Draw another diagram like this, so that a, b, and c have<br />
different values. Are a, b, and c related in the same way<br />
as in part a? Explain.<br />
c) Explain why the relationship is always true.<br />
B<br />
a<br />
b<br />
c<br />
A<br />
C<br />
Research to find how geometry is used in real life.<br />
You could look at occupations, sports, or architecture.<br />
Use words, pictures, or numbers to explain what you found out.<br />
90 CHAPTER 3: Relationships in Geometry
Polygon Pieces<br />
The two puzzles on this page involve these 6 polygons.<br />
B<br />
C<br />
A<br />
D<br />
E<br />
F<br />
Try this puzzle after<br />
you have completed<br />
Section 3.5.<br />
Puzzle 1<br />
The sum of the interior angles is the same for two of the polygons.<br />
Which polygons are they?<br />
How can you tell without measuring any of the angles and without<br />
calculating the sum of the interior angles of any of the polygons?<br />
Puzzle 2<br />
Your teacher will give you a copy of the 6 polygons.<br />
There is also a large regular hexagon on the copy.<br />
➢ Glue your copy to a piece of cardboard.<br />
Then cut out the 6 polygons.<br />
➢ Arrange the 6 polygons to fit together on the regular hexagon.<br />
Record your solution to the puzzle on triangular dot paper.<br />
➢ The puzzle can be solved in different ways.<br />
Compare your solution with those of other students.<br />
Record as many solutions as you can on triangular dot paper.<br />
Puzzle: Polygon Pieces 91
Mid-Chapter Review<br />
3.1<br />
1. Your teacher will give you a copy of<br />
the diagram below.<br />
The 3 triangles are congruent.<br />
b)<br />
108<br />
g<br />
B<br />
f<br />
e<br />
h<br />
137<br />
A<br />
C<br />
Colour red all angles equal to A.<br />
Colour blue all angles equal to B.<br />
Colour green all angles equal to C.<br />
Use the diagram to explain why<br />
the sum of the angles in a triangle<br />
is 180°.<br />
2. Triangles ABC and ACD are braces for<br />
the “Diner” sign.<br />
What are the values of a and b?<br />
3.3<br />
5. a) Draw a triangle and<br />
its exterior angles.<br />
b) Measure and record enough<br />
angles so that someone could<br />
determine the remaining angles.<br />
c) Trade diagrams with a classmate.<br />
Solve your classmate’s problem.<br />
6. Here is the flag of Antigua.<br />
3.2<br />
3. Use your diagram from question 1.<br />
Explain why the exterior angle of<br />
a triangle is equal to the sum of the<br />
two opposite interior angles.<br />
Determine the angle measure<br />
indicated by each letter.<br />
What assumptions are you making?<br />
7. a) Write all the relationships you can<br />
for the angles in this diagram.<br />
4. Determine the angle measure<br />
indicated by each letter.<br />
a)<br />
64<br />
a<br />
f<br />
b e<br />
a<br />
c<br />
b<br />
d<br />
c g<br />
h<br />
143<br />
b) Use these relationships to<br />
determine the angle measure<br />
indicated by each letter.<br />
92 CHAPTER 3: Relationships in Geometry
Using The Geometer’s Sketchpad<br />
to Investigate Angles Related to<br />
Quadrilaterals<br />
Part 1: The Relationship among the Interior Angles<br />
1. Open the file QuadAngles.gsp. Click the tab for page 1.<br />
2. Drag vertices A, B, C, and D to create 5 different quadrilaterals.<br />
a) Copy this table. For each quadrilateral, record the measures<br />
of A, B, C, and D.<br />
A B C D A B C D<br />
b) Calculate the sum of each set of angles.<br />
Record each sum in the table.<br />
c) How do the interior angles of a quadrilateral appear to be<br />
related? Explain.<br />
3. We can arrange A, B, C, and D so the vertex of each<br />
angle is at the centre of a circle.<br />
a) Drag vertices A, B, C, and D to create different quadrilaterals.<br />
Observe how the angles change on the circle.<br />
b) How does arranging the angles on a circle support your<br />
answer to question 2c?<br />
Technology: Using The Geometer’s Sketchpad to Investigate Angles Related to Quadrilaterals 93
Part 2: The Relationship among the Exterior Angles<br />
1. Use the file QuadAngles.gsp. Click the tab for page 2.<br />
2. Drag vertices A, B, C, and D to create 5 different quadrilaterals.<br />
a) Copy this table. For each quadrilateral, record the measures<br />
of the exterior angles.<br />
WAD XBA YCB ZDC WAD XBA YCB ZDC<br />
b) Calculate the sum of each set of angles.<br />
Record each sum in the table.<br />
c) How do the exterior angles of a quadrilateral appear to be<br />
related? Explain.<br />
3. We can arrange the exterior angles so each vertex is at the<br />
centre of a circle.<br />
a) Drag vertices A, B, C, and D to create different quadrilaterals.<br />
Observe how the angles change on the circle.<br />
b) How does arranging the angles on a circle support your<br />
answer to question 2c?<br />
94 CHAPTER 3: Relationships in Geometry
3.4<br />
Interior and Exterior Angles<br />
of Quadrilaterals<br />
Investigate<br />
Angle Relationships in Quadrilaterals<br />
Which tools could<br />
you use to help you?<br />
➢ Draw a quadrilateral.<br />
Measure the interior angles.<br />
Calculate their sum.<br />
➢ Extend each side of the quadrilateral to draw 4 exterior angles,<br />
one at each vertex.<br />
Measure the exterior angles.<br />
Calculate their sum.<br />
➢ Repeat the steps above for 2 different quadrilaterals.<br />
What is the sum of the interior angles of a quadrilateral?<br />
What is the sum of the exterior angles of a quadrilateral?<br />
➢ What is the relationship between the interior angle and the<br />
exterior angle at any vertex of a quadrilateral?<br />
Reflect<br />
➢ Did your results depend on the type of quadrilateral<br />
drawn? Explain.<br />
➢ How can you use what you know about the sum of the<br />
angles in a triangle to determine the sum of the angles in a<br />
quadrilateral?<br />
➢ How can you use the sum of the interior angles of a<br />
quadrilateral to determine the sum of the exterior angles?<br />
3.4 Interior and Exterior Angles of Quadrilaterals 95
Connect the Ideas<br />
Interior<br />
angles of a<br />
quadrilateral<br />
Any quadrilateral can be divided into 2 triangles.<br />
The sum of the angles in each triangle is 180°.<br />
The sum of the angles in 2 triangles is: 2 180° 360°<br />
So, the sum of the interior angles<br />
of any quadrilateral is 360°.<br />
That is, a b c d 360°<br />
d<br />
a<br />
c<br />
b<br />
Exterior<br />
angles of a<br />
quadrilateral<br />
At each vertex, an interior angle and an exterior angle<br />
form a straight angle.<br />
The sum of their measures is 180°.<br />
q<br />
d<br />
r<br />
c<br />
a<br />
p<br />
b<br />
s<br />
b s<br />
b s 180<br />
A quadrilateral has 4 vertices.<br />
So, the sum of the interior and exterior angles is:<br />
4 180° 720°<br />
The sum of the interior angles is 360°.<br />
So, the sum of the exterior angles is:<br />
720° 360° 360°<br />
The sum of the exterior<br />
angles is 360°.<br />
That is, p q r s 360°<br />
q<br />
r<br />
p<br />
s<br />
96 CHAPTER 3: Relationships in Geometry
Practice<br />
1. Draw then cut out a large quadrilateral.<br />
Tear off the corners.<br />
How can you arrange the corners to show that the<br />
interior angles of a quadrilateral have a sum of 360°?<br />
Sketch what you did.<br />
2. Determine the angle measure indicated by each letter.<br />
a) b) 150<br />
c)<br />
89<br />
b<br />
93<br />
103<br />
a<br />
33<br />
150<br />
61<br />
119<br />
119<br />
c<br />
3. Draw 2 congruent parallelograms. Cut them out.<br />
a) Cut out and arrange the pieces of one parallelogram as shown.<br />
D<br />
d<br />
a<br />
A<br />
b<br />
C<br />
c<br />
B<br />
a b<br />
A, D<br />
c<br />
B, C<br />
d<br />
Cut out and arrange the pieces of the second parallelogram as shown.<br />
Which tools could<br />
you use to help you?<br />
A a<br />
D<br />
d<br />
C<br />
c<br />
b<br />
B<br />
C, D<br />
c d<br />
b a<br />
B, A<br />
How are two angles that share a common side of a parallelogram related?<br />
b) Use what you know about angles involving parallel lines<br />
to explain the relationship in part a.<br />
Example<br />
Solution<br />
One angle of a parallelogram is 60°.<br />
Determine the measures of the<br />
other angles.<br />
D<br />
60<br />
Since p and 60° are the measures of interior angles between parallel<br />
sides DC and AB, their sum is 180°; that is, p 60° 180°<br />
So, p 180° 60°<br />
120°<br />
Similarly, p and q are the measures of interior angles between<br />
parallel sides AD and BC.<br />
So, q 120° 180°, then q 60°<br />
p<br />
A<br />
C<br />
r<br />
q<br />
B<br />
3.4 Interior and Exterior Angles of Quadrilaterals 97
q and r are the measures of interior angles between parallel sides<br />
CD and BA.<br />
So, 60° r 180°, then r 120°<br />
4. Determine the angle measure indicated by each letter.<br />
Which relationships did you use each time?<br />
a) b<br />
b) c)<br />
c<br />
127<br />
f<br />
h<br />
48<br />
a<br />
89<br />
d<br />
e<br />
j<br />
k<br />
5. Draw then cut out a parallelogram.<br />
Cut out and arrange the pieces<br />
of the parallelogram as shown.<br />
What does this tell you about<br />
opposite angles in a parallelogram?<br />
A a<br />
D<br />
d<br />
C<br />
c<br />
b<br />
B<br />
D<br />
C<br />
d<br />
c<br />
A<br />
B b a<br />
6. A kite has pairs of adjacent sides equal.<br />
a) Draw a kite. Determine how the angles are related.<br />
Explain how you did this.<br />
b) Compare your answer to part a with that of a classmate.<br />
Work together to explain why the relationships in part a are always true.<br />
7. Assessment Focus Determine the angle measure indicated by each letter.<br />
Explain how you know.<br />
a) b) c)<br />
100<br />
90<br />
84<br />
a<br />
126<br />
b<br />
32<br />
136<br />
d<br />
8. Take It Further Quadrilateral ROSE is an isosceles trapezoid.<br />
Sides OS and RE are parallel. Sides OR and SE are equal.<br />
a) Find as many relationships as you can among the interior<br />
R<br />
angles of ROSE.<br />
b) Choose a tool and use it to demonstrate the relationships in part a.<br />
O<br />
S<br />
E<br />
What do you know about the interior and exterior angles of<br />
quadrilaterals? Use diagrams to explain.<br />
98 CHAPTER 3: Relationships in Geometry
3.5 Interior and Exterior Angles of Polygons<br />
A garden has the shape of a pentagon.<br />
It is surrounded by straight walking paths.<br />
James starts walking around the garden.<br />
At each fork, he turns left.<br />
When James returns to his starting point,<br />
through how many degrees has he turned?<br />
Investigate<br />
Which tools could<br />
you use to help you?<br />
The Sum of the Exterior Angles of a Polygon<br />
➢ Work in a group.<br />
You will need a large open space.<br />
Your group will be assigned one of the polygons below.<br />
Use masking tape to create it.<br />
Group 1<br />
Triangle<br />
Group 2<br />
Quadrilateral<br />
Group 3<br />
Pentagon<br />
Group 4<br />
Hexagon<br />
Group 5<br />
Heptagon<br />
Group 6<br />
Octagon<br />
➢ Have a member of the group walk around the polygon until<br />
she arrives back where she started from, and faces the way she<br />
began. Determine the total angle she turned through.<br />
➢ Repeat for each of the other polygons.<br />
What do you notice?<br />
Reflect<br />
➢ Do the results depend on the number of sides in the<br />
polygon? Explain.<br />
➢ What do these results suggest about the sum of the<br />
exterior angles of any polygon? Explain.<br />
3.5 Interior and Exterior Angles of Polygons 99
Connect the Ideas<br />
Interior angles<br />
of a polygon<br />
We can determine the sum of the interior angles of any polygon<br />
by dividing it into triangles.<br />
Polygon Number Number of Angle sum<br />
of sides triangles<br />
Triangle 3 1 1(180°) 180°<br />
Quadrilateral 4 2 2(180°) 360°<br />
Pentagon 5 3 3(180°) 540°<br />
Hexagon 6 4 4(180°) 720°<br />
In each polygon, the number of triangles is always 2 less than the<br />
number of sides. So, the angle sum is 180° multiplied by 2 less than<br />
the number of sides.<br />
We can write this as an equation.<br />
S (n 2) 180°<br />
S is the sum of the interior angles of a polygon with n sides.<br />
A polygon with<br />
12 sides can be<br />
divided into<br />
10 triangles.<br />
Exterior angles<br />
of a polygon<br />
We can use this formula to determine the<br />
sum of the interior angles of a polygon<br />
with 12 sides.<br />
S (n 2) 180°<br />
Substitute: n 12<br />
S (12 2) 180°<br />
10 180°<br />
1800°<br />
The sum of the interior angles of a 12-sided polygon is 1800°.<br />
At each vertex, an interior angle and an<br />
exterior angle have a sum of 180°.<br />
For 12 vertices, the sum of the interior and<br />
exterior angles is: 12 180° 2160°<br />
The sum of the interior angles is 1800°.<br />
So, the sum of the exterior angles is: 2160° 1800° 360°<br />
We can reason this way for any polygon.<br />
The sum of the exterior angles of any polygon is 360°.<br />
100 CHAPTER 3: Relationships in Geometry
Practice<br />
1. Use a ruler to draw a large pentagon and its exterior angles as<br />
shown. Cut out the exterior angles.<br />
How can you arrange them to show that the exterior angles of a<br />
pentagon have a sum of 360°?<br />
Sketch what you did.<br />
2. What is the sum of the interior angles of a polygon with each number of sides?<br />
a) 7 sides b) 10 sides c) 24 sides<br />
3. Determine the angle measure indicated by x.<br />
a) b)<br />
104<br />
102<br />
128<br />
118<br />
120<br />
x<br />
59<br />
44<br />
x 103<br />
60<br />
65<br />
Example<br />
Solution<br />
A regular polygon has all sides equal and all angles equal.<br />
What is the measure of each interior angle in a regular hexagon?<br />
A hexagon has 6 sides.<br />
Use the sum of the interior angles:<br />
S (n 2) 180°<br />
Substitute: n 6<br />
S (6 2) 180°<br />
4 180°<br />
720°<br />
Since the angles are equal, divide by 6 to determine the measure<br />
of each angle: 720° 120°<br />
6<br />
Each interior angle in a regular hexagon is 120°.<br />
4. Determine the measure of one interior angle in a regular polygon with each<br />
number of sides.<br />
a) 5 sides b) 8 sides c) 10 sides d) 20 sides<br />
5. Determine the measure of one exterior angle for each regular polygon in question 4.<br />
6. A Canadian $1 coin has the shape of a regular polygon.<br />
a) How many sides does it have?<br />
b) What is the measure of each interior angle?<br />
Show your work.<br />
3.5 Interior and Exterior Angles of Polygons 101
7. Assessment Focus<br />
a) List all that you know about the interior angles and<br />
exterior angles of polygons.<br />
b) Use the properties in part a.<br />
Create a design, pattern, or picture.<br />
Colour your design to illustrate the properties.<br />
Explain your colour scheme.<br />
8. A concave polygon has an interior angle that is a reflex angle.<br />
Here are two examples.<br />
a) Draw a concave quadrilateral.<br />
b) Draw a concave pentagon.<br />
c) Measure the angles.<br />
Determine the sum of the angles in each figure.<br />
d) Do concave polygons obey this relationship:<br />
Interior angle sum (n 2) 180°?<br />
Justify your answer.<br />
Use The Geometer’s<br />
Sketchpad if available.<br />
A reflex angle is<br />
between 180°<br />
and 360°.<br />
9. Find a soccer ball or use this picture.<br />
a) Which different polygons do you see on the ball?<br />
b) What is the measure of one interior angle of a<br />
white polygon?<br />
c) What is measure of one interior angle of a black polygon?<br />
d) What is the sum of the angles at the red dot?<br />
What do you notice?<br />
10. Take It Further You can divide a hexagon into triangles by choosing<br />
a point inside the hexagon and joining all vertices to that point.<br />
a) What is the sum of the angles in all the triangles?<br />
b) What would have to be subtracted from the sum in<br />
part a to get the sum of the interior angles of<br />
the hexagon? Explain.<br />
c) Repeat parts a and b for other polygons.<br />
Write an equation for the sum of the interior angles<br />
in a polygon with n sides.<br />
How can you find the sum of the angles in any polygon?<br />
When can you use this sum to determine the measures of the<br />
angles in the polygon? Include sketches in your answer.<br />
102 CHAPTER 3: Relationships in Geometry
Using The Geometer’s Sketchpad<br />
to Investigate Angles Related to<br />
Regular Polygons<br />
Part 1: Relationships among the Interior Angles<br />
and the Exterior Angles of a Regular Polygon<br />
1. Open the file PolyAngles.gsp. Click the tab for page 1.<br />
2. A regular polygon has all sides equal and all angles equal.<br />
a) Start with a regular polygon with 3 sides.<br />
This is an equilateral triangle.<br />
Copy the table.<br />
Complete the first 3 columns for an equilateral triangle.<br />
Number of sides Measure of Measure of Sum of Sum of<br />
in the regular one interior one exterior interior exterior<br />
polygon angle angle angles angles<br />
b) Use the button to create a regular polygon with 4 sides.<br />
Complete the first 3 columns of the table for this polygon.<br />
c) Repeat part b for 4 different regular polygons.<br />
As the number of sides increases:<br />
How do the interior angles change?<br />
How do the exterior angles change?<br />
3. Complete the last two columns of the table for each polygon<br />
from question 2.<br />
As the number of sides increases:<br />
How does the sum of the interior angles change?<br />
What do you notice about the sum of the exterior angles?<br />
Technology: Using The Geometer’s Sketchpad to Investigate Angles Related to Regular Polygons 103
Part 2: The Relationship among the Exterior Angles<br />
of a Regular Polygon<br />
1. Use the file PolyAngles.gsp. Click the tab for page 2.<br />
2. In Part 1, question 3, you discovered a relationship among the<br />
exterior angles of a regular polygon.<br />
a) Start with a triangle.<br />
Click the Shrink Polygon button to shrink the triangle<br />
to a point.<br />
What do the exterior angles appear to form?<br />
Click the Reset button to return the polygon to its<br />
original size.<br />
b) Click the button to create a polygon with 4 sides.<br />
Click the Shrink Polygon button to shrink the polygon<br />
to a point.<br />
What do the exterior angles appear to form?<br />
Click the Reset button to return the polygon to its<br />
original size.<br />
c) Repeat the steps in part b for 4 different regular polygons.<br />
3. a) When you shrink any regular polygon, what do the exterior<br />
angles appear to form?<br />
b) What does this suggest about the sum of the exterior<br />
angles of a regular polygon?<br />
104 CHAPTER 3: Relationships in Geometry
Chapter Review<br />
What Do I Need to Know?<br />
Any Triangle<br />
a<br />
r<br />
b c d<br />
p<br />
q<br />
Sum of the interior angles is 180°. Sum of the exterior angles is 360°.<br />
a b c 180° p q r 360°<br />
Each exterior angle is the sum of the<br />
two opposite interior angles.<br />
d a b<br />
Isosceles Triangle<br />
Equilateral Triangle<br />
60<br />
60<br />
60<br />
The angles opposite the equal Each angle is 60°.<br />
sides are equal.<br />
Parallel Lines<br />
d<br />
c<br />
e<br />
f<br />
g<br />
h<br />
k<br />
j<br />
Corresponding angles are equal.<br />
c g e j d h f k<br />
Alternate angles are equal.<br />
e h f g<br />
Interior angles have a sum of 180°.<br />
e g 180° f h 180°<br />
Any Quadrilateral<br />
a<br />
b<br />
c<br />
r<br />
q<br />
d<br />
s<br />
p<br />
Sum of the interior angles is 360°. Sum of the exterior angles is 360°.<br />
a b c d 360° p q r s 360°<br />
Chapter Review 105
Parallelogram<br />
a<br />
b<br />
a<br />
b<br />
Any Polygon<br />
If there are n sides, the sum of the<br />
interior angles is: (n 2) 180°<br />
The sum of the exterior angles is 360°,<br />
regardless of the number of sides.<br />
Opposite angles are equal.<br />
Also, a b 180°<br />
What Should I Be Able to Do?<br />
3.1<br />
1. Explain how you know that the sum<br />
of the angles in a triangle is 180°.<br />
3.1<br />
3.3<br />
4. Determine the angle measure<br />
indicated by each letter.<br />
3.1<br />
3.2<br />
2. Can a triangle have 2 obtuse angles?<br />
Explain.<br />
3. Determine the angle measure<br />
indicated by each letter.<br />
136<br />
a<br />
b<br />
c<br />
d<br />
e<br />
a)<br />
78<br />
73<br />
x<br />
43<br />
5. Are these lines parallel?<br />
Justify your answer.<br />
a)<br />
b)<br />
42<br />
112<br />
111<br />
x<br />
y<br />
b)<br />
c)<br />
64<br />
136<br />
116<br />
88<br />
x<br />
106 CHAPTER 3: Relationships in Geometry
6. The top of this TV<br />
table is parallel<br />
to the ground.<br />
The triangles<br />
are isosceles.<br />
Determine the<br />
measures of the<br />
labelled angles.<br />
x<br />
y<br />
82<br />
3.5<br />
8. a) Use this diagram to determine<br />
the sum of the interior angles<br />
in an octagon.<br />
3.4<br />
7. Determine the angle measure<br />
indicated by each letter.<br />
Justify your answer.<br />
a)<br />
b)<br />
69<br />
84<br />
118<br />
21<br />
y<br />
x<br />
b) A regular octagon has 8 equal<br />
sides and 8 equal angles.<br />
Determine each measure:<br />
i) an interior angle<br />
ii) an exterior angle<br />
9. Determine the sum of the interior<br />
angles of a polygon with each<br />
number of sides. Try to do this two<br />
different ways.<br />
a) 6 sides b) 12 sides c) 18 sides<br />
c)<br />
119<br />
x<br />
104<br />
z<br />
10. a) What is the sum of the interior<br />
angles of a pentagon?<br />
Show your work.<br />
b) What does the following<br />
sequence of pictures demonstrate<br />
about the sum of the exterior<br />
angles of a pentagon?<br />
y<br />
d)<br />
66<br />
x<br />
54<br />
81<br />
c) Does the result of part a agree with<br />
your answer in part b? Explain.<br />
11. A regular polygon has 100 sides.<br />
Determine the measure of one<br />
interior angle and one exterior<br />
angle.<br />
60<br />
Chapter Review 107
Practice Test<br />
Multiple Choice: Choose the correct answer for questions 1 and 2.<br />
1. What are the values of a and b?<br />
A. a 85°, b 85° B. a 95°, b 85°<br />
C. a 85°, b 95° D. a 95°, b 95°<br />
b<br />
85<br />
a<br />
2. Determine the value of x.<br />
A. 32° B. 52°<br />
C. 58° D. 64°<br />
A<br />
x<br />
Show all your work for questions 3 to 6.<br />
D<br />
116<br />
B<br />
C<br />
3. Communication Suppose you had<br />
a cutout of this quadrilateral.<br />
Explain how to demonstrate that<br />
the sum of its interior angles is 360°.<br />
How many different ways could you do this?<br />
Explain.<br />
B<br />
A<br />
D<br />
C<br />
4. Knowledge and Understanding Determine the angle measure indicated by each letter.<br />
a) b) c)<br />
127<br />
46<br />
a<br />
d<br />
b c<br />
49<br />
131 a 15<br />
5. Application On a baseball diamond, home plate has<br />
the shape of a pentagon.<br />
The pentagon has 3 right angles.<br />
The other 2 other angles are equal.<br />
a) What is the sum of the angles of a pentagon?<br />
b) What is the measure of each equal angle?<br />
How do you know?<br />
x<br />
y<br />
6. Thinking Use this diagram.<br />
Explain why PRQ RST.<br />
P<br />
Q<br />
R<br />
S<br />
T<br />
108 CHAPTER 3: Relationships in Geometry
What<br />
You’ll Learn<br />
To use different<br />
proportional reasoning<br />
strategies to solve problems<br />
involving ratios, rates, and<br />
percents<br />
And Why<br />
Situations involving ratios,<br />
rates, and percents occur<br />
frequently in daily life, such as<br />
calculating sales tax or getting<br />
the best deal when you shop.<br />
Project<br />
Link<br />
• Organizing a Banquet<br />
Key Words<br />
• ratio<br />
• equivalent ratios<br />
• proportion<br />
• rate<br />
• unit rate<br />
• percent
Decoding Word Problems<br />
A word problem is a math question in a real-world context.<br />
Being able to read and understand word problems should help<br />
you relate math to life outside the classroom.<br />
Here is a word problem:<br />
Joseph is buying a carpet for his living room.<br />
It is a rectangular room that measures 4 m by 5 m.<br />
The carpet costs $11.99/m 2 .<br />
How much will Joseph spend on carpet?<br />
Many word problems have three parts:<br />
1. The context or set-up Joseph is buying a carpet<br />
for his living room.<br />
2. The math information It is a rectangular room<br />
that measures 4 m by 5 m.<br />
The carpet costs $11.99/m 2 .<br />
3. The question How much will Joseph<br />
spend on carpet?<br />
Some word problems use key words to tell you what to do.<br />
Here are some common key words and phrases:<br />
Calculate<br />
Describe<br />
Determine<br />
Estimate<br />
Compare Explain<br />
Justify<br />
List<br />
Show your work<br />
Solve<br />
Simplify<br />
Work with a partner. Look through the text.<br />
Find an example where each key word is used.<br />
Choose one key word. Explain what it means.<br />
110 CHAPTER 4: Proportional Reasoning
4.1 Equivalent Ratios<br />
A day-care centre must maintain<br />
certain ratios of staff to children.<br />
These ratios depend on<br />
the age of the child.<br />
For 3- to 5-year-olds, the required<br />
ratio of staff to children is 110.<br />
Investigate<br />
Comparing Ratios<br />
Work with a partner.<br />
You will need a ruler or metre stick and 10 copies<br />
of the same textbook.<br />
➢ Measure the height of 1 textbook.<br />
Record it in a table.<br />
Number of books Height of pile (cm) Number of booksheight<br />
➢ Pile the textbooks, one at a time.<br />
Record the height of the pile each time you add a book.<br />
Stop when your pile reaches 10 textbooks.<br />
➢ Write the ratio of each number of books to the height.<br />
➢ What patterns do you see in your table?<br />
Reflect<br />
Compare your results with those of classmates who used<br />
a different textbook.<br />
➢ How are the patterns the same?<br />
➢ How are they different?<br />
4.1 Equivalent Ratios 111
Connect the Ideas<br />
Recall that a ratio is a comparison of two quantities.<br />
For example, suppose the ratio of students to computers<br />
in a school is 51.<br />
This means there are 5 students for every 1 computer.<br />
Equivalent ratios make the same comparison.<br />
Suppose a class of 30 students has 6 computers.<br />
The ratio of students to computers is 306.<br />
This ratio is equivalent to 51, because it has the same meaning—<br />
there are 5 times as many students as computers.<br />
Here are two ways to determine equivalent ratios.<br />
➢ Multiply each term in a ratio by the same number.<br />
810 (3 8) (3 10)<br />
2430<br />
810 and 2430 are equivalent ratios.<br />
➢ Divide each term in a ratio by a common factor.<br />
8<br />
810 10<br />
2 2<br />
45<br />
810 and 45 are equivalent ratios.<br />
Practice<br />
1. Determine an equivalent ratio by multiplying.<br />
a) 23 b) 43 c) 45 d) 65<br />
112 CHAPTER 4: Proportional Reasoning
2. Determine an equivalent ratio by dividing.<br />
a) 3050 b) 217 c) 1512 d) 1836<br />
3. Determine two equivalent ratios for each ratio.<br />
a) 25 b) 125500 c) 101 d) 15001000<br />
4. The ratio of length to width for this rectangle is 86.<br />
a) Use grid paper. Draw a smaller rectangle whose dimensions<br />
have the same ratio.<br />
b) Draw a larger rectangle whose dimensions have the same ratio.<br />
c) Amir draws a rectangle with length 26 cm and width 18 cm.<br />
Is the ratio of the dimensions of Amir’s rectangle equivalent<br />
to the ratio of the dimensions of your rectangles?<br />
How do you know?<br />
5. An architect draws a plan for a wheelchair ramp.<br />
On the plan, the ramp is 2 cm high and 24 cm long.<br />
What might the dimensions of the actual ramp be?<br />
How did you use equivalent ratios to find out?<br />
2 cm<br />
6<br />
The maximum<br />
height allowed for<br />
a wheelchair ramp<br />
is 76 cm.<br />
24 cm<br />
8<br />
We can use equivalent ratios to compare ratios.<br />
Example<br />
Solution<br />
June and Megan make grape punch for a party.<br />
June uses grape concentrate and ginger ale in the ratio 32.<br />
Megan uses grape concentrate and ginger ale in the ratio 85.<br />
Which punch has the stronger grape taste? Explain.<br />
The recipe that uses more concentrate for the same volume<br />
of ginger ale has the stronger grape taste.<br />
The volume of ginger ale is the second term of each ratio.<br />
So, write 32 and 85 with the same second term.<br />
The least common multiple of 2 and 5 is 10.<br />
So, write both 32 and 85 with the second term 10.<br />
June’s punch<br />
Megan’s punch<br />
32 (3 5)(2 5) 85 (8 2)(5 2)<br />
1510<br />
1610<br />
The volume of concentrate is the first term of each ratio.<br />
Megan’s punch uses more concentrate for the same volume<br />
of ginger ale.<br />
It has the stronger grape taste.<br />
4.1 Equivalent Ratios 113
6. Refer to the Guided Example, page 113.<br />
a) Write equivalent ratios for 32 and 85 with the same first term.<br />
b) How do the ratios in part a help you determine which punch has<br />
the stronger grape taste?<br />
7. Compare the strawberry punch in each pair of pitchers.<br />
Which has the stronger strawberry taste? Explain.<br />
a) b)<br />
A<br />
■ 1 part<br />
concentrate<br />
■ 2 parts<br />
water<br />
B<br />
■ 5 parts<br />
concentrate<br />
■ 8 parts<br />
water<br />
A<br />
■ 2 parts<br />
concentrate<br />
■ 3 parts<br />
water<br />
B<br />
■ 5 parts<br />
concentrate<br />
■ 6 parts<br />
water<br />
8. Assessment Focus Beakers of blue and clear liquids are combined.<br />
a) Predict which set you think will produce the bluer liquid.<br />
Justify your answer.<br />
Set A<br />
Set B<br />
b) Which set does produce the bluer liquid? Explain.<br />
c) Sketch a different set of beakers that would produce the same shade<br />
of blue as set A.<br />
9. A loft measures 10 m by 16 m.<br />
A scale drawing of the loft is to fit on a 21-cm by 28-cm sheet of paper.<br />
What could the dimensions of the scale drawing be? How did you find out?<br />
10. Take It Further A CD jewel case measures 12.5 cm by 14.0 cm by 1.0 cm.<br />
A model of the case measures 5.0 cm by 5.6 cm by 0.5 cm.<br />
One dimension on the model is incorrect.<br />
a) Which dimension is incorrect?<br />
b) What should the dimension be?<br />
What are the equivalent ratios?<br />
Explain two ways to determine a ratio that is equivalent to a given ratio.<br />
Include examples in your explanation.<br />
114 CHAPTER 4: Proportional Reasoning
4.2 Ratio and Proportion<br />
A nurse uses equivalent ratios to calculate<br />
drug dosages.<br />
A drug comes in 150-mg tablets.<br />
The dosage ordered is 375 mg.<br />
The nurse needs to calculate how many<br />
tablets are required.<br />
Investigate<br />
Using Proportional Reasoning to Solve a Problem<br />
Use counters.<br />
A hospital gift shop<br />
sells 4 magazines for<br />
every 3 books.<br />
➢ Suppose the shop<br />
sold 18 books.<br />
How many<br />
magazines did<br />
it sell?<br />
➢ Suppose the shop<br />
sold 12 magazines.<br />
How many books did it sell?<br />
➢ One Friday, the shop sold 35 books and magazines altogether.<br />
How many of each kind did it sell?<br />
Record your work.<br />
Reflect<br />
Compare your recording strategies with those of a classmate.<br />
➢ How could you solve the problems without using counters?<br />
➢ How can you use equivalent ratios to solve the problems?<br />
4.2 Ratio and Proportion 115
Connect the Ideas<br />
Hamadi is a pediatric nurse.<br />
He uses a table like the one below to give<br />
the correct dose of a pain reliever.<br />
2<br />
Approximate body mass (kg) 5 10 15<br />
Dose (mg) 60 120 180<br />
3<br />
In proportional<br />
situations, the<br />
quantities involved<br />
are related by<br />
multiplication or<br />
division.<br />
The statement<br />
560 35d is<br />
a proportion.<br />
A proportion is a<br />
statement that two<br />
ratios are equal.<br />
When the body mass doubles, the dose doubles.<br />
When the body mass triples, the dose triples.<br />
We say that the drug dose is proportional to the body mass.<br />
560, 10120, and 15180 are equivalent ratios.<br />
We can determine the drug dose for a body mass of 35 kg.<br />
Let d milligrams represent this dose.<br />
We need a ratio equivalent to 560, with the first term 35.<br />
That is, 560 35d<br />
Here are two ways to determine the value of d.<br />
Look for a multiplication<br />
relationship between ratios<br />
?<br />
Look for a multiplication<br />
relationship within ratios<br />
?<br />
Use a table.<br />
560 35d<br />
560 35d<br />
Think: What do we multiply Think: What do we multiply<br />
5 by to get 35? Multiply 60 5 by to get 60? Multiply 35<br />
by the same number.<br />
by the same number.<br />
12<br />
7 7<br />
5 60<br />
35 d<br />
5 60<br />
35 d<br />
12<br />
So, 60 7 d<br />
So, 35 12 d<br />
That is, d 420 That is, d 420<br />
A dose of 420 mg is needed for a body mass of 35 kg.<br />
116 CHAPTER 4: Proportional Reasoning
Practice<br />
1. Describe two ways the numbers in each proportion are related.<br />
a) 520 125500 b) 101 12012 c) 7525 300100 d) 13 1648<br />
2. Multiply between ratios to determine each value of n.<br />
a) 25 8n b) 2n 69 c) n5 1220 d) 8n 415<br />
3. Multiply within ratios to determine each value of z.<br />
a) 48 3z b) 5z 618 c) z14 1020 d) 321 z56<br />
Need Help?<br />
Read Connect<br />
the Ideas.<br />
4. A portable music player with 4 GB of memory stores about 1000 songs.<br />
A music player with 60 GB of memory stores about 15 000 songs.<br />
Is the number of songs proportional to the amount of memory?<br />
Explain your reasoning.<br />
5. To make green paint, 3 parts yellow paint are mixed with 2 parts blue paint.<br />
Janis has 12 L of blue paint. How much yellow paint does she need? Explain.<br />
6. Ali earned $80 working 10 h.<br />
How long would it take him to earn $200? Explain how you found your answer.<br />
7. A recipe that serves 4 people uses 3 potatoes.<br />
How many potatoes are needed to serve 20 people?<br />
Sometimes, it is helpful to simplify one of the ratios in a proportion.<br />
Example<br />
Solution<br />
Determine the value of c.<br />
c20 1815<br />
c20 1815<br />
We cannot immediately identify how the terms are related.<br />
?<br />
c20 1815<br />
?<br />
Use mental math to determine an equivalent ratio for 1815.<br />
Divide each term by 3.<br />
18<br />
1815 15<br />
3 3<br />
65<br />
So, c20 65<br />
4<br />
Since 20 4 5, then c 4 6<br />
So, c 24<br />
4.2 Ratio and Proportion 117
8. Determine the value of each variable.<br />
a) 410 18c b) 12525 n6 c) 6y 912 d) 60z 246<br />
9. Assessment Focus In 1996, the Royal Canadian Mint<br />
issued the new $2 coin.<br />
a) A poster advertising the new coin showed a large<br />
photograph of the toonie.<br />
The diameter of the inner core on the poster was 51 cm.<br />
What was the outer diameter of the coin on the poster?<br />
Show your work.<br />
b) Did you solve the problem using a proportion?<br />
How could you solve it without using a proportion?<br />
10. When a robin flies, it beats its wings about 23 times in 10 s.<br />
How many times will it beat its wings in 2 min?<br />
Explain your thinking.<br />
11. A gear ratio is the ratio of the numbers of teeth<br />
in two connected gears.<br />
The gear ratio of two gears is 32.<br />
a) The larger gear has 126 teeth.<br />
How many teeth does the smaller gear have?<br />
How did you solve the problem?<br />
b) Suppose the smaller gear has 126 teeth.<br />
How many teeth would the larger gear have? Explain.<br />
Show your work.<br />
12. Take It Further There are 900 students enrolled<br />
in Mount Forest Secondary School.<br />
The ratio of girls to boys is 54.<br />
a) How many boys and how many girls go to Mount Forest SS?<br />
Explain how you found your answer.<br />
b) The average class size is 27 students.<br />
Suppose this class is representative of all the students in the school.<br />
How many students in this class are girls?<br />
How many are boys?<br />
17 mm<br />
28 mm<br />
Use one of the questions in this section.<br />
Explain how you can use a proportion to answer the question.<br />
118 CHAPTER 4: Proportional Reasoning
Using The Geometer’s Sketchpad<br />
to Investigate Scale Drawings<br />
Identifying Scales<br />
1. Open The Geometer’s Sketchpad.<br />
Open the sketch Investigating Scale Drawings.gsp.<br />
The sketch has scale drawings of some rooms in a house.<br />
The actual dimensions of each room are shown.<br />
Use the instructions your teacher gives you.<br />
2. Measure the lengths of the sides of each room.<br />
3. Compare the actual measures on the diagram to the lengths<br />
you measured.<br />
a) Which rooms are drawn to scale? How do you know?<br />
b) What is the scale?<br />
4. a) Which rooms are not drawn to scale? Explain.<br />
b) Suppose these rooms were drawn using the scale<br />
in question 3.<br />
What would the dimensions be?<br />
Technology: Using The Geometer’s Sketchpad to Investigate Scale Drawings 119
Creating a Scale Drawing<br />
1. Open a new sketch.<br />
2. You will create a scale drawing of a soccer field.<br />
The actual dimensions of the field are:<br />
Touchline – 120 m<br />
Goal line – 90 m<br />
Penalty area – 16.5 m by 40 m<br />
Centre circle – radius of 9.15 m<br />
Use the instructions your teacher gives you to construct<br />
a scale drawing.<br />
3. Choose the scale you will use to create your drawing.<br />
4. Follow the instructions to create the scale drawing using the<br />
scale you chose. How do you determine the length and width<br />
of your scale drawing?<br />
5. How would the drawing change if you used a smaller scale?<br />
A larger scale?<br />
Construct new scale drawings to check your predictions.<br />
Did you use equivalent ratios? Explain.<br />
6. Print your scale drawings.<br />
Trade drawings with a classmate.<br />
Determine the scale for each of your classmate’s drawings.<br />
7. Construct a scale drawing of an object of your choice.<br />
Print the drawing and explain how you constructed it.<br />
Include the actual dimensions of the object and the scale.<br />
120 CHAPTER 4: Proportional Reasoning
4.3 Unit Rates<br />
In many places in Ontario,<br />
home-owners use firewood to heat<br />
their homes.<br />
The firewood is split and stacked<br />
into units called cords. One cord of<br />
wood measures about 1.20 m wide<br />
by 2.40 m long by 1.20 m high.<br />
1.20 m<br />
2.40 m<br />
1.20 m<br />
Investigate<br />
Comparing Unit Rates<br />
You will investigate two methods in which firewood is split.<br />
➢ Northern Lights Firewood uses a machine called<br />
a firewood processor.<br />
It produces 32 cords in 8 h.<br />
➢ Duhaime’s Timber Products uses 6 people with chain saws<br />
and log splitters.<br />
They produce 21 cords in 6 h.<br />
Which company produces firewood faster?<br />
Reflect<br />
➢ What strategy did you use to determine the faster method?<br />
➢ Compare your strategy for solving the problem with<br />
those of other students.<br />
If you used different strategies, explain your strategy<br />
to other students.<br />
4.3 Unit Rates 121
Connect the Ideas<br />
In each case, the<br />
operating costs<br />
are proportional<br />
to the time.<br />
Northern Lights Firewood<br />
Operating costs: $620 for 8 h<br />
Duhaime’s Timber Products<br />
Operating costs: $585 for 6 h<br />
To determine which company has the greater operating costs,<br />
we determine the operating costs per hour.<br />
Northern Lights Firewood’s<br />
operating costs are $620 for 8 h.<br />
To determine the hourly operating<br />
costs, divide 620 by 8.<br />
620 8 77.5<br />
The operating costs are $77.50 per hour.<br />
620 8<br />
8 8<br />
? 1<br />
Duhaime’s Timber Products’<br />
585 6<br />
6 6<br />
operating costs are $585 for 6 h.<br />
? 1<br />
To determine the hourly operating<br />
costs, divide 585 by 6.<br />
585 6 97.5<br />
The operating costs are $97.50 per hour.<br />
So, Duhaime’s Timber Products has the greater operating costs.<br />
A rate is a<br />
comparison of two<br />
quantities with<br />
different units.<br />
Each hourly rate is called a unit rate, because it tells the cost for<br />
1 h, or one unit of time.<br />
Unit rates can be written in different ways:<br />
➢ Using words: one hundred kilometres per hour<br />
➢ Using numbers, symbols,<br />
and words: 100 km per hour<br />
➢ Using numbers and symbols:<br />
100 km/h<br />
122 CHAPTER 4: Proportional Reasoning
Practice<br />
1. Determine each unit rate.<br />
a) 50 goals scored in 25 games b) $400 earned in 40 h<br />
c) $6.00 for 12 oranges d) 770 km travelled in 7 h<br />
2. Determine each unit rate.<br />
a) $5.00 for 10 CDs b) $2.37 for 3 kg of apples<br />
c) 9 kg lost in 6 weeks d) 22 km hiked in 5 h<br />
3. Twelve hundred litres of water were pumped out of a flooded basement in 8 h.<br />
What was the unit rate of outflow?<br />
4. Mr. and Mrs. Dell recently finished some renovations to their house.<br />
Twenty square metres of carpeting cost $875.<br />
Seventeen square metres of hardwood flooring cost $750.<br />
Which flooring is more expensive per square metre? Explain.<br />
5. Alec wants to join one of three online music clubs.<br />
eTunes Tunezilla Monstersongs.com<br />
$21.00 for 20 songs $41.65 for 35 songs $54.50 for 50 songs<br />
Which music club is more economical? Explain.<br />
6. A 12-pack of pop costs $2.99.<br />
The same pop costs $0.75 per can from a vending machine.<br />
Is this a fair price? Explain.<br />
We can use unit rates to determine the best buy.<br />
Example<br />
Cereal comes in 3 sizes.<br />
500 g for 650 g for 800 g for<br />
$<br />
2.99 $<br />
3.69 $<br />
4.29<br />
A<br />
B<br />
C<br />
a) Calculate the unit price for each box.<br />
b) Which box is the best buy? Explain.<br />
4.3 Unit Rates 123
Solution<br />
a) Since 1 g is very small, we calculate the cost of 100 g.<br />
This is the unit price.<br />
Box A has mass 500 g and costs $2.99.<br />
$2.99<br />
500 g is 5 100 g; so, the cost of 100 g of Box A is:<br />
5<br />
$0.598<br />
Box B has mass 650 g and costs $3.69.<br />
$3.69<br />
650 g is 6.5 100 g; so, the cost of 100 g of Box B is:<br />
6.5<br />
$0.568<br />
Box C has mass 800 g and costs $4.29.<br />
$4.29<br />
800 g is 8 100 g; so, the cost of 100 g of Box C is: $0.536<br />
b) Box C has the lowest unit price. It is the best buy.<br />
8<br />
7. Which is the best buy? Show your work.<br />
300 mL for 500 mL for 750 mL for<br />
$<br />
1.59 $<br />
2.39 $<br />
3.49<br />
A<br />
B<br />
C<br />
8. Assessment Focus Sue wants to buy tea.<br />
The brand that she buys comes in 2 sizes.<br />
a) Use unit rates.<br />
Which box of tea bags is the better buy?<br />
b) How could Sue determine the better buy without<br />
using unit rates? Explain.<br />
c) Why might Sue not want to purchase the better buy?<br />
9. Take It Further A 400-g package of Grandma’s Cookies has 18 cookies<br />
and costs $2.49.<br />
A 700-g package of Dee’s Delights has 12 cookies and costs $3.99.<br />
a) Which unit would you use to determine the better buy?<br />
Explain why you chose that unit.<br />
b) Determine the unit price of each brand of cookie.<br />
c) Which brand is the better buy? Explain.<br />
36 tea bags 144 tea bags<br />
$<br />
1.99 $<br />
5.39<br />
What is a unit rate?<br />
How can you use unit rates to determine the better buy?<br />
Use examples in your explanation.<br />
124 CHAPTER 4: Proportional Reasoning
Grid Paper Pool<br />
Materials<br />
Grid Paper Pool Master<br />
1-cm grid paper<br />
Each “pool table” is a rectangle<br />
drawn on a grid.<br />
There is a pocket at each corner.<br />
The figure at the right is a 3 by 2 table.<br />
D<br />
A<br />
C<br />
B<br />
The ball always<br />
travels along<br />
diagonals of squares.<br />
Both where the ball<br />
starts and where it<br />
ends are counted<br />
as hits.<br />
Here are the rules of the puzzle.<br />
➢ An imaginary ball is hit from<br />
corner A. It travels across the<br />
grid, at 45° to AB.<br />
➢ The ball bounces off each side<br />
it hits at a 45° angle.<br />
D<br />
Hit<br />
Hit<br />
A<br />
➢ The ball continues to travel until it reaches a pocket.<br />
Your teacher will give you copies of different “pool tables.”<br />
➢ For each pool table:<br />
– Draw the path the ball takes.<br />
– Copy and complete this table.<br />
Write the pocket letter in the third column.<br />
Pool table dimensions Number of hits Ball reaches pocket:<br />
Hit<br />
Hit<br />
C<br />
Hit<br />
B<br />
➢ What patterns do you see in the results?<br />
➢ Another table measures 16 by 24.<br />
Predict the number of hits before the ball stops.<br />
Predict the pocket in which the ball stops.<br />
How did you make your predictions?<br />
➢ Determine the dimensions of 2 different pool tables where<br />
the ball stops in pocket D after 7 hits.<br />
Puzzle: Grid Paper Pool 125
Mid-Chapter Review<br />
4.1<br />
1. Which ratios in each pair are<br />
equivalent? How do you know?<br />
a) 1215 and 4860<br />
b) 32 and 2516<br />
c) 34 and 1518<br />
d) 625125 and 18036<br />
2. Lemonade is made with water and<br />
concentrate.<br />
a) Which pitcher has the stronger<br />
lemonade? Explain how you know.<br />
6. In 2002, 3 out of 10 doctors in Canada<br />
were women.<br />
a) What is the ratio of female doctors<br />
to male doctors?<br />
b) There are 72 female doctors<br />
in a city.<br />
How many male doctors are there?<br />
c) There are 119 male doctors in<br />
another city.<br />
How many female doctors<br />
are there?<br />
d) What assumptions did you make<br />
in parts b and c?<br />
4.2<br />
■ 4 parts<br />
concentrate<br />
■ 3 parts<br />
water<br />
A<br />
■ 3 parts<br />
concentrate<br />
■ 2 parts<br />
water<br />
b) Describe the contents of a different<br />
pitcher that has the same strength<br />
lemonade as Pitcher B.<br />
3. A 7500-kg African elephant eats about<br />
200 kg per day. A 5000-kg African<br />
elephant eats about 150 kg per day.<br />
Is the amount of food an elephant<br />
eats proportional to its mass?<br />
Explain your reasoning.<br />
B<br />
4.3<br />
7. Calculate each unit rate.<br />
a) Driving 45 km on 3 L of gas<br />
b) Typing 120 words in 4 min<br />
c) Earning $148 for an 8-h shift<br />
d) Driving 525 km in 6 h<br />
8. Beckie and Scott rode their bicycles<br />
to school.<br />
Beckie rode 8 km in 15 min.<br />
Scott rode 12 km in 25 min.<br />
Who rode faster? Explain.<br />
9. a) Determine the price for 100 g<br />
of each box of cereal.<br />
4. Determine the value of each variable.<br />
a) 53 n24<br />
b) 47 m35<br />
c) 164 12y<br />
d) 1821 r14<br />
5. A recipe for salad dressing uses 60 mL<br />
of vinegar for 240 mL of oil.<br />
Emil has only 40 mL of vinegar.<br />
How much oil should he use?<br />
CEREAL<br />
A<br />
CEREAL<br />
B<br />
b) Which box is the better buy?<br />
Explain.<br />
126 CHAPTER 4: Proportional Reasoning
4.4 Applying Proportional Reasoning<br />
Cary wants to estimate the distance<br />
between two places. He uses a map<br />
scale and proportional reasoning.<br />
Many different types of problems<br />
can be solved using proportional<br />
reasoning.<br />
Investigate<br />
Using Different Strategies to Solve a Problem<br />
➢ Use Pattern Blocks to create this design.<br />
Each block in the design has a value that is<br />
proportional to its area.<br />
The value of the yellow hexagon is $3.<br />
What is the value of the entire design?<br />
How do you know?<br />
➢ Create a design that costs between $5 and $6.<br />
Write the value of your design.<br />
Record your design.<br />
Explain how you determined the value.<br />
Reflect<br />
Compare strategies with your classmates.<br />
➢ How could you use equivalent ratios to solve<br />
the problems?<br />
➢ How could you use unit rates to solve the problems?<br />
4.4 Applying Proportional Reasoning 127
Connect the Ideas<br />
Kirsten’s neighbour used 120 patio stones to cover 8 m 2 .<br />
Kirsten wants to build a patio using the same type of stone.<br />
Use reasoning<br />
Kirsten wants to pave 18 m 2 of her backyard.<br />
We can use unit rates to determine the number of<br />
patio stones Kirsten needs.<br />
An area of 8 m 2 requires 120 patio stones.<br />
So, an area of 1 m 2 120<br />
requires:<br />
8<br />
stones 15 stones<br />
Then, an area of 18 m 2 requires: 18 15 stones 270 stones<br />
Kirsten needs 270 stones to pave her backyard.<br />
Kirsten discovers that the patio stones are on sale.<br />
She can afford to buy 330 stones.<br />
Kirsten decides to build a larger patio.<br />
Use a table<br />
We can use a similar method to determine the greatest area<br />
Kirsten can cover with 330 stones.<br />
120 8<br />
120<br />
8<br />
120<br />
1<br />
120<br />
330 330<br />
330 330 8<br />
8<br />
120<br />
330 <br />
120<br />
m 2 22 m 2<br />
The greatest area Kirsten can cover with 330 stones is 22 m 2 .<br />
128 CHAPTER 4: Proportional Reasoning
Practice<br />
1. Sean buys 8 DVDs for $120.<br />
Each DVD costs the same amount.<br />
a) How much does 1 DVD cost?<br />
b) How much do 13 DVDs cost?<br />
2. Ioana works for 4 days and earns $224. At this rate:<br />
a) How much does she earn in 1 day?<br />
b) How much does she earn in 11 days?<br />
3. Mika worked 6 shifts and earned $720.<br />
She earns the same amount for each shift.<br />
How much money would she earn in 4 shifts?<br />
4. Zeljko purchased 4 cases of pop for $26.<br />
a) How many cases could he buy for $91? Explain.<br />
b) How could you have solved the problem a different way?<br />
5. A car travels 96 km on 8 L of gasoline.<br />
a) How far will the car travel on 25 L of gasoline?<br />
b) How much gasoline is needed to travel 120 km?<br />
Show your work.<br />
6. A machine can bind 1000 books in 8 min.<br />
a) How many books can the machine bind in 1 h?<br />
b) How long will it take to bind 7250 books? Explain.<br />
We use proportional reasoning when we use a map to determine distances.<br />
Example<br />
Solution<br />
The driving distance from Sault Ste. Marie to North Bay<br />
is about 425 km.<br />
On a map, this distance is 8.5 cm.<br />
On the same map, the distance from North Bay to Windsor<br />
is 13.5 cm.<br />
What is the actual distance between these cities?<br />
8.5 cm represents 425 km.<br />
425<br />
So, 1 cm represents:<br />
8.5<br />
km 50 km<br />
Then, 13.5 cm represents: 13.5 50 km 675 km<br />
The actual distance from North Bay to Windsor is about 675 km.<br />
4.4 Applying Proportional Reasoning 129
7. Madurodam is a miniature city in the Netherlands.<br />
Every object in the city is built to the same scale.<br />
A lamppost in Madurodam is 12 cm tall.<br />
It is modelled after an actual lamppost that is 3 m tall.<br />
a) A bridge that crosses the canal in Madurodam is<br />
30 cm long. How long is the actual bridge that was<br />
used as the model?<br />
b) A clock tower is to be built in Madurodam.<br />
It is modelled after a clock tower that is 25 m tall.<br />
How tall should the miniature tower be?<br />
c) Explain how you solved each problem.<br />
8. Chloë challenged her father to a basketball game.<br />
Each person gets a different number of points for scoring a basket.<br />
a) Chloë scored 12 baskets and has 36 points.<br />
How many points would she get if she scored 15 baskets?<br />
b) Her father scored 16 baskets and has 32 points.<br />
How many points would he get if he scored 19 baskets?<br />
c) Their total score at the end of the game is 95 points.<br />
How many baskets did each person score?<br />
9. Assessment Focus Imran is visiting his grandmother in the United States.<br />
He can exchange $20 Canadian for $17 US.<br />
a) How many US dollars would Imran get for $225 Canadian?<br />
b) When Imran returns, he has $10 US.<br />
How much is this in Canadian dollars?<br />
What assumptions did you make?<br />
10. Take It Further A recipe for pancakes calls for 2 cups flour mixed<br />
1<br />
with 1<br />
2<br />
cups buttermilk.<br />
1<br />
Liisa mixes 5 cups flour with 2<br />
2<br />
cups buttermilk.<br />
Will Liisa’s pancake mix be too dry, too watery, or just right?<br />
How do you know?<br />
You have learned several strategies to solve proportional reasoning problems.<br />
Choose one strategy. Explain when you would use it.<br />
Include an example of a problem.<br />
130 CHAPTER 4: Proportional Reasoning
4.5 Using Algebra to Solve a Proportion<br />
Hockey sticks vary in length.<br />
Taller players use longer sticks.<br />
The National Hockey League only allows hockey sticks<br />
that are shorter than 1.60 m.<br />
Length<br />
Investigate<br />
Solving an Equation to Solve a Problem<br />
In 2005, Zdeno Chara was a defenceman<br />
for the Ottawa Senators.<br />
He was the tallest player in the league.<br />
The NHL made an exception to the stick length rule<br />
for Chara because he was so tall.<br />
At 2.06 m, Chara used a stick that was 1.80 m long.<br />
➢ The shortest player in the NHL has a height of 1.70 m.<br />
Suppose the ratio of the length of his stick to his height<br />
is the same as it is for Chara.<br />
What is the length of the stick?<br />
➢ The Ottawa Senators sometimes give out souvenir miniature<br />
sticks at their games.<br />
How short would a player have to be to use a stick 37 cm long?<br />
What assumptions do you make?<br />
Reflect<br />
Compare strategies for solving these problems with<br />
your classmates.<br />
➢ Did you write a proportion in each case? Explain.<br />
➢ What other strategies could you have used to solve<br />
these problems?<br />
➢ How could you check your answers?<br />
4.5 Using Algebra to Solve a Proportion 131
Connect the Ideas<br />
In hockey, when<br />
one team receives<br />
a penalty and plays<br />
one player short, the<br />
other team is said to<br />
be on a power play.<br />
The Toronto Maple Leafs scored 17 power-play goals in<br />
the first 8 games of the 2005–2006 season.<br />
Suppose the team continued to score power-play goals<br />
at the same rate. We can estimate how many of these goals it<br />
might score in the 82-game season.<br />
Let n represent the number of power-play goals scored<br />
in 82 games.<br />
Here are two ways to determine the value of n.<br />
Solve a proportion using<br />
within ratios<br />
Solve a proportion using<br />
between ratios<br />
In the left column,<br />
we compare ratios<br />
of goals to games.<br />
In the right column,<br />
we compare the<br />
ratio of goals to the<br />
ratio of games.<br />
An equation is a<br />
balance. To keep the<br />
balance, what we do<br />
to one side we must<br />
also do to the other<br />
side.<br />
17 goals . . . in . . . 8 games 17 goals . . . in . . . 8 games<br />
n goals . . . in . . . 82 games<br />
n goals . . . in . . . 82 games<br />
178 n82<br />
n17 828<br />
Write each ratio in<br />
Write each ratio in<br />
fraction form.<br />
fraction form.<br />
17 n<br />
8<br />
<br />
82<br />
n 82<br />
17<br />
<br />
8<br />
To isolate n, multiply each To isolate n, multiply each<br />
side of the equation by 82. side of the equation by 17.<br />
17<br />
82 <br />
n<br />
82<br />
n<br />
17 <br />
82<br />
17<br />
8<br />
82 17<br />
8<br />
1394<br />
8<br />
<br />
82<br />
82n<br />
82<br />
17<br />
17n<br />
17<br />
n<br />
n<br />
8<br />
n 174.25 n 174.25<br />
<br />
8<br />
82 17<br />
8<br />
1394<br />
If the Leafs continued at the same rate as for the first 8 games,<br />
they would have scored about 174 power-play goals in<br />
the 2005–2006 season.<br />
Estimate<br />
to check<br />
reasonableness<br />
The ratio of power-play goals to games is 178.<br />
This is approximately 168, or 21.<br />
So, the number of power-play goals is about double<br />
the number of games.<br />
Then, in 82 games, the number of power-play goals<br />
would be about: 82 2 164<br />
This is close to the calculated number of 174.<br />
132 CHAPTER 4: Proportional Reasoning
Practice<br />
1. Solve for n.<br />
n<br />
6<br />
3<br />
2<br />
a) b) c) d) e) <br />
2. Solve for each variable.<br />
n<br />
4<br />
6<br />
8<br />
a) c9 217 b) m840 1120 c) y63 53 d) a225 79<br />
The length of an object’s shadow is proportional to the object’s height.<br />
n<br />
12<br />
5<br />
4<br />
n<br />
25<br />
8<br />
5<br />
n<br />
16<br />
5<br />
8<br />
Example<br />
A person is 1.85 m tall.<br />
At a certain time of day, her shadow is 0.74 m long.<br />
At the same time of day, the shadow of a tree is 8.40 m long.<br />
How tall is the tree?<br />
1.85 m<br />
0.74 m 8.40 m<br />
Solution<br />
Let n metres represent the height of the tree.<br />
The ratio of the person’s height to the length of her shadow<br />
is 1.850.74.<br />
The ratio of the tree’s height to the length of its shadow is n8.40.<br />
Write a proportion.<br />
1.850.74 n8.40<br />
Write each ratio in fraction form.<br />
1.85 n<br />
0.74<br />
<br />
8.40<br />
To isolate n, multiply each side of the equation by 8.40.<br />
1.85 n<br />
8.40 8.40<br />
0.74<br />
8.40 1.85<br />
8.40<br />
8.40n<br />
8.40<br />
<br />
0.74<br />
Simplify the equation.<br />
15.54<br />
0.74<br />
n<br />
n 21<br />
The tree is 21 m tall.<br />
4.5 Using Algebra to Solve a Proportion 133
3. Each shadow is measured at the same time as the shadows<br />
in the Guided Example on page 133.<br />
a) A toddler casts a shadow that is 0.33 m long.<br />
How tall is the toddler?<br />
b) A flagpole casts a shadow that is 2.96 m long.<br />
How tall is the pole?<br />
4. At an automotive repair shop, 3.5 h of labour costs $311.50.<br />
What is the labour charge for a 5-h job?<br />
How could you check your answer?<br />
5. Assessment Focus<br />
a) In 2005, the band U2 sold out two concerts in Dublin, Ireland.<br />
Forty-eight thousand tickets were sold in the first 15 min.<br />
Assume the tickets sold at a constant rate.<br />
How many tickets were sold in 50 min?<br />
b) Seventy-five thousand tickets were sold at the<br />
Stade de France in Paris, France.<br />
Suppose the tickets sold at the same rate as in Dublin.<br />
How long did it take to sell the 75 000 tickets?<br />
c) Explain the strategies you used to solve the problems.<br />
6. Take It Further Leonardo Da Vinci believed in ideal<br />
proportions of the body.<br />
In his paintings, the ratio of a person’s height to the<br />
floor-to-hips height is 74.<br />
a) A person has a floor-to-hips height of 1.16 m.<br />
How tall is the person?<br />
b) Elisha is 167 cm tall.<br />
What is her floor-to-hips height?<br />
c) Determine whether the ratio of your height<br />
to floor-to-hips height is the same as<br />
Da Vinci’s ratio.<br />
Compare your findings with those of your classmates.<br />
height<br />
floor-to-hips<br />
height<br />
Use one of the questions in this section.<br />
If you solved the problem using an equation, find a different way to solve it.<br />
If you did not use an equation to solve the problem,<br />
solve it now by using an equation.<br />
134 CHAPTER 4: Proportional Reasoning
4.6 Percent as a Ratio<br />
Investigate<br />
Using Percent to Compare Raises<br />
Work with a partner.<br />
Elena, Shane, and Gillian worked last summer at different<br />
retail stores.<br />
This summer, all of them received raises.<br />
Elena’s wages increased from $360 to $425 per week.<br />
Shane’s wages increased from $275 to $340 per week.<br />
Gillian’s wages increased from $400 to $470 per week.<br />
➢ Who received the greatest raise?<br />
➢ Compare each person’s raise with the previous year’s wages.<br />
Who received the greatest percent increase?<br />
Explain how you know.<br />
Reflect<br />
Compare strategies with your classmates for solving<br />
these problems.<br />
➢ You represented each pay raise in two ways.<br />
Which way do you think better represents the pay raise?<br />
Explain.<br />
4.6 Percent as a Ratio 135
Connect the Ideas<br />
A percent is a ratio that compares a number to 100;<br />
for example, 30100.<br />
A percent can also be written with a symbol (%), as a fraction,<br />
or as a decimal.<br />
30<br />
For example, 30% 0.30<br />
100<br />
An MP3 player that regularly sells for $180 is on sale for 25% off.<br />
Determine<br />
the sale price<br />
The sale price is 100% 25% 75% of the original price,<br />
or 75% of $180.<br />
So, the sale price is in the same ratio to 180 as 75 is to 100.<br />
Let b dollars represent the sale price.<br />
b180 75100<br />
Write this proportion in fraction form.<br />
b<br />
180<br />
b<br />
<br />
75<br />
100<br />
180<br />
0.75<br />
To isolate b, multiply each side of the equation by 180.<br />
b<br />
180<br />
180 0.75 180<br />
b 135<br />
The sale price is $135.<br />
0%<br />
75% 100%<br />
$0 b $180<br />
Notice that 75% of<br />
180 is 0.75 180.<br />
Determine<br />
the total price<br />
In Ontario, in July<br />
2006, the provincial<br />
sales tax (PST) was<br />
8% and the goods<br />
and services tax<br />
(GST) was 6%.<br />
We have to pay 14% in taxes on the MP3 player.<br />
So, the total price is 100% 14% 114% of the sale price,<br />
or 114% of $135.<br />
Let t dollars represent the total price.<br />
t<br />
<br />
135<br />
t<br />
114<br />
100<br />
135<br />
1.14<br />
To isolate t, multiply each side of the equation by 135.<br />
t<br />
135<br />
135 1.14 135<br />
t 153.9<br />
0%<br />
100% 114%<br />
$0 $135 t<br />
Notice that 114% of<br />
135 is 1.14 135.<br />
The total price of the MP3 player is $153.90.<br />
136 CHAPTER 4: Proportional Reasoning
Practice<br />
1. Write each fraction as a decimal.<br />
7<br />
15<br />
35<br />
80<br />
a) 100<br />
b) 100<br />
c) 100<br />
d) 100<br />
e)<br />
120<br />
100<br />
2. Determine each value.<br />
a) 10% of $365 b) 25% of 50 kg c) 50% of 28 m d) 125% of 120 g<br />
3. A jacket was regularly priced at $159.99.<br />
It was marked down by 30%. What was the sale price of the jacket?<br />
4. During January, 50 000 new vehicles were sold in Ontario.<br />
About 20% of these were leased. How many vehicles were leased?<br />
5. A video game sells for $59.99.<br />
a) How much is the sales tax on the game?<br />
b) What is the price including taxes?<br />
6. Skis regularly sell for $350.<br />
They are on sale at 45% off. What is the total cost, including taxes?<br />
Think of a different way to solve this problem.<br />
7. There were 288 spectators at the football game.<br />
75% were cheering for the home team.<br />
a) How many spectators were cheering for the home team? Explain.<br />
b) 40% of the spectators were students.<br />
How many spectators were adults? How do you know?<br />
We use percents when we calculate simple interest.<br />
Example<br />
Solution<br />
Emma borrows $1200 for 6 months.<br />
The annual interest rate is 6%.<br />
How much simple interest does Emma pay?<br />
Method 1: Use ratios<br />
For one year, the ratio of simple interest to the loan<br />
is equal to the ratio of the interest rate to 100%.<br />
Let x dollars represent the simple interest.<br />
x 6<br />
Then, <br />
1200<br />
x<br />
1200<br />
100<br />
6<br />
100<br />
7200<br />
100<br />
1200 1200<br />
x <br />
x 72<br />
4.6 Percent as a Ratio 137
The interest for 1 year is $72, so the interest for<br />
$72<br />
6 months is: $36<br />
2<br />
Method 2: Use algebra<br />
a) Use the formula: I = Prt<br />
I is the simple interest in dollars.<br />
The principal, P, is $1200.<br />
The annual interest rate, r, is 6%, or 0.06.<br />
Since time, t, is measured in years, write<br />
6 months as a fraction of a year:<br />
12<br />
Substitute: P 1200, r 0.06, and t <br />
6<br />
So, I 1200 0.06 <br />
12<br />
36<br />
Emma pays $36 simple interest.<br />
6<br />
6<br />
12<br />
8. Connor borrows $5000 for 9 months. The annual interest rate is 8%.<br />
How much simple interest does Connor pay?<br />
9. John put $500 in a savings account for 8 months. The annual interest rate is 2%.<br />
a) How much simple interest does the money earn?<br />
b) How much money is in the account after 8 months?<br />
10. Assessment Focus A credit card company charges 24% per year<br />
on outstanding balances.<br />
a) How much interest would be charged on an outstanding balance of $900<br />
for 90 days?<br />
b) How much is owed at the end of 90 days?<br />
Show your work.<br />
11. Take It Further Marie borrowed $3500 for 6 months.<br />
She paid $140 simple interest.<br />
What was the annual interest rate?<br />
How could you check your answer?<br />
What do you find most challenging when you solve<br />
problems involving percent?<br />
Use a question from this section to explain.<br />
How might you overcome this difficulty?<br />
138 CHAPTER 4: Proportional Reasoning
Chapter Review<br />
What Do I Need to Know?<br />
A ratio is a comparison of two quantities.<br />
Two ratios are equivalent when they can be reduced to the<br />
same ratio.<br />
For example, both 1216 and 912 reduce to 34,<br />
so they are equivalent ratios.<br />
12 : 16 9 : 12<br />
Use a Frayer model<br />
to help you<br />
understand some<br />
of the key words<br />
on this page.<br />
A proportion is a statement that two ratios are equal.<br />
For example, 23 1015<br />
or, <br />
2<br />
3<br />
10<br />
15<br />
To solve a proportion means to determine the value<br />
of an unknown term in a proportion.<br />
For example, to solve 1015 n3, determine the value of n<br />
that makes the ratios equal.<br />
A rate is a ratio of two terms with different units.<br />
A unit rate is a rate where the second term is 1 unit.<br />
For example, 50 km1 h is written as 50 km/h.<br />
A percent is a ratio with second term 100.<br />
For example, 25100 can be written:<br />
25<br />
in fraction form as<br />
100<br />
,<br />
in decimal form as 0.25, and<br />
as a percent, 25%<br />
0%<br />
0<br />
25%<br />
25 = 0.25<br />
100<br />
100%<br />
1<br />
Chapter Review 139
What Should I Be Able to Do?<br />
1. Write 2 equivalent ratios for each<br />
ratio.<br />
a) 35 b) 3642<br />
c) 1510 d) 22535<br />
4.1 4.2<br />
2. Elise made up a game with<br />
this spinner.<br />
4. Determine the value of<br />
each variable.<br />
a) 34 9n<br />
b) a35 420<br />
c) 1020 21e<br />
d) 20m 1518<br />
5. A recipe for salad dressing calls for<br />
4 parts oil to 1 part vinegar.<br />
Allie used 60 mL of vinegar.<br />
What volume of oil does she need?<br />
If the pointer lands on red,<br />
the player loses a turn.<br />
Elise made a larger spinner. It had<br />
20 sectors, 12 of which are red.<br />
a) Are the spinners equivalent?<br />
b) If your answer to part a is yes,<br />
justify your answer.<br />
If your answer is no, describe a<br />
spinner that would be equivalent<br />
to the first spinner.<br />
3. Orange juice is mixed from<br />
concentrate and water.<br />
A<br />
■ 4 parts<br />
concentrate<br />
■ 5 parts<br />
water<br />
Which mix is stronger?<br />
Justify your answer.<br />
B<br />
■ 3 parts<br />
concentrate<br />
■ 4 parts<br />
water<br />
4.3<br />
6. A recipe that makes 5 dozen cookies<br />
calls for 4 eggs and 2 cups of flour.<br />
a) Wolfgang has only 3 eggs.<br />
How much flour should he use?<br />
b) How many cookies will he make?<br />
7. Determine each unit rate.<br />
a) 240 km driven in 5 h<br />
b) 105 words typed in 3 min<br />
c) $2.80 for a 7-min call<br />
d) $4.74 for 3 kg of oranges<br />
e) 240 pages printed in 8 min<br />
8. Which toothpaste is the better buy?<br />
Show your work.<br />
85 mL for<br />
130 mL for<br />
$<br />
1.39<br />
$<br />
1.99<br />
A<br />
B<br />
140 CHAPTER 4: Proportional Reasoning
4.4<br />
9. The mass of grass seed needed to<br />
seed a yard depends on the area<br />
of the yard. Five kilograms of seed<br />
cover 100 m 2 .<br />
a) How much seed is needed for<br />
this lawn?<br />
15 m<br />
12 m<br />
4.6<br />
13. Determine each percent.<br />
a) 20% of $56.99<br />
b) 45% of $118.56<br />
c) 30% of $89.99<br />
d) 25% of $37.88<br />
14. A winter jacket is regularly priced at<br />
$79.99. It is on sale for 35% off.<br />
a) What is the sale price?<br />
b) What does the customer pay,<br />
including taxes?<br />
b) Seed is sold in 8-kg bags.<br />
One bag of seed costs $21.20.<br />
How much will it cost to seed<br />
the lawn in part a?<br />
10. Paige works after school picking<br />
apples. It took her 4 days to pick<br />
9 rows of trees.<br />
a) At this rate, how long will it take<br />
her to pick 20 rows of trees?<br />
Explain.<br />
b) Paige picked for 10 days.<br />
How many rows did she pick?<br />
15. The Canadian Radio and Television<br />
Commission requires 60% of the<br />
programming on CBC to be<br />
Canadian content. The CBC<br />
broadcasts from 6 a.m. one day to<br />
2 a.m. the next each day. How many<br />
hours of programming each week<br />
are Canadian content?<br />
4.5<br />
11. Mr. O’Shea drove 600 km on 50 L<br />
of gas.<br />
a) How far could he drive on 30 L<br />
of gas?<br />
b) How much gas would he need<br />
to travel 420 km?<br />
c) What strategy did you use to<br />
solve each problem? Explain your<br />
strategy and why you chose it.<br />
12. A photocopier can print 12 copies in<br />
48 s. At this rate, how many copies<br />
can it print in 1 min?<br />
16. Sheila put $350 in a savings account<br />
for 10 months. The annual interest<br />
rate was 3%.<br />
a) How much simple interest did the<br />
money earn?<br />
b) How much money was in the<br />
account after 10 months?<br />
17. James borrowed $1500 for 8 months.<br />
The annual interest rate was 9%.<br />
a) How much simple interest did<br />
James pay?<br />
b) What did the loan cost James?<br />
Chapter Review 141
Practice Test<br />
Multiple Choice: Choose the correct answer for questions 1 and 2.<br />
1. The ratio of length to width of a rectangle is 53.<br />
Which dimensions could be those of the rectangle?<br />
A. 9 cm by 12 cm<br />
B. 16 km by 10 km<br />
C. 10 m by 6 m<br />
D. 9 mm by 16 mm<br />
2. A 4-L can of paint covers an area of 32 m 2 .<br />
What area will a 10-L can of paint cover?<br />
A. 40 m 2<br />
B. 60 m 2<br />
C. 80 m 2<br />
D. 320 m 2<br />
Show your work for questions 3 to 6.<br />
3. Knowledge and Understanding<br />
Determine the value of each variable.<br />
a) 210 5a b) 3042 b7<br />
c) 1830 12c d) <br />
4. Communication Sun Li bought 12 oranges for $6.48.<br />
How many oranges could she buy with $10.00?<br />
How many different ways could you find out?<br />
Explain each way.<br />
5. Application Jenna put $2500 in a savings account.<br />
The annual interest rate was 2%.<br />
a) How much simple interest did the money earn in 3 months?<br />
b) How much money was in the account<br />
after 3 months?<br />
6. Thinking The sun is shining.<br />
You have a measuring tape and a friend<br />
to help you. How could you determine<br />
the height of a flagpole?<br />
Explain your strategy.<br />
n<br />
4<br />
21<br />
10<br />
142 CHAPTER 4: Proportional Reasoning
Chapters 1–4<br />
Cumulative Review<br />
CHAPTER<br />
1<br />
1. Determine the perimeter and area of<br />
each figure.<br />
a)<br />
b)<br />
5 m<br />
7 cm<br />
2. Determine the area and perimeter<br />
of this figure.<br />
The curve is a semicircle.<br />
h<br />
13 m<br />
3 cm<br />
5 cm<br />
2<br />
4. A pyramid has<br />
height 12 cm and 12 cm<br />
base area 28 cm 2 .<br />
a) What is the volume<br />
of the pyramid?<br />
b) What is the height<br />
of the related prism?<br />
c) What would the prism’s height<br />
have to be for it to have the same<br />
volume as the pyramid?<br />
Check your answer.<br />
5. A rectangle has area 20 cm 2 .<br />
Give 4 possible lengths and widths<br />
for the rectangle.<br />
28 cm 2<br />
3. Determine the volume of each<br />
object.<br />
a)<br />
b)<br />
10 cm<br />
5 cm<br />
1 m<br />
6 cm<br />
8 cm<br />
8 cm<br />
20 cm<br />
7 m<br />
9 cm<br />
6. Kate has 18 m of edging for a<br />
rectangular garden.<br />
a) What are the dimensions of the<br />
largest garden Kate can enclose?<br />
b) What is the area of this garden?<br />
c) Suppose one side of the garden<br />
is along an existing fence and<br />
does not need edging.<br />
i) What are the dimensions of<br />
the largest garden that Kate<br />
can enclose?<br />
ii) What is its area?<br />
c)<br />
4 cm<br />
7. a) For each area, determine the<br />
dimensions of a rectangle with<br />
the minimum perimeter.<br />
d)<br />
14 cm<br />
12 cm<br />
i) 25 cm 2<br />
ii) 32 cm 2<br />
iii) 78 m 2<br />
b) Calculate the perimeter of each<br />
rectangle in part a.<br />
How do you know each perimeter<br />
is a minimum?<br />
Cumulative Review 143
CHAPTER<br />
8. An isosceles triangle has one angle<br />
measuring 34°. What are the<br />
measures of the other 2 angles?<br />
Give two possible answers.<br />
3 4<br />
9. Determine the angle measure<br />
indicated by each letter.<br />
Justify your answers.<br />
a)<br />
b)<br />
c)<br />
r<br />
s<br />
c<br />
c<br />
103<br />
b<br />
d<br />
b<br />
q<br />
a<br />
y<br />
45<br />
z<br />
x<br />
10. a) Use this diagram to determine<br />
the sum of the interior angles<br />
in a hexagon.<br />
a<br />
b) Show a different way that you<br />
could divide this hexagon to<br />
determine the sum of the interior<br />
angles. Determine the sum.<br />
How does it compare to your<br />
answer to part a?<br />
c) A regular hexagon has 6 equal<br />
sides and 6 equal angles.<br />
Determine each measure.<br />
i) an interior angle<br />
ii) an exterior angle<br />
p<br />
30<br />
d<br />
75<br />
11. Write 2 equivalent ratios for<br />
each ratio.<br />
a) 27 b) 45165<br />
c) 219 d) 10024<br />
12. A recipe that makes 6 dozen<br />
meringue drops calls for 4 egg<br />
whites and 1 cup of sugar.<br />
a) Saad has only 3 eggs.<br />
How much sugar should he use?<br />
b) How many meringue drops will<br />
Saad make?<br />
13. Hannah’s favourite cereal<br />
comes in 2 sizes.<br />
Which is the better buy?<br />
Show your work.<br />
• 775 g for $5.49<br />
• 400 g for $2.97<br />
14. Running an old gas-powered lawn<br />
mower for 1 h can create as much<br />
pollution as driving a new car 550 km.<br />
It takes Isaac 45 min to mow his<br />
front and back lawns. How far would<br />
a person have to drive a new car to<br />
generate the same pollution?<br />
15. Determine each percent.<br />
a) 30% of $129.99<br />
b) 15% of $27.54<br />
c) 40% of $215.49<br />
16. Hong put $550 in a savings<br />
account for 9 months.<br />
The annual interest rate was 4%.<br />
a) How much simple interest did<br />
the money earn?<br />
b) How much money was in the<br />
account after 9 months?<br />
144 Chapters 1– 4
What<br />
You’ll Learn<br />
The relationship between<br />
two quantities can be<br />
illustrated with a graph that<br />
could be a straight line, a curve,<br />
or neither of these.<br />
Project<br />
Link<br />
And Why<br />
• Help Find the Stolen<br />
Mascot!<br />
Relationships, such as the<br />
changes in temperature<br />
during a day or the time to run<br />
a certain distance, can be<br />
described with graphs. These<br />
graphs can be used to make<br />
predictions and to solve problems.<br />
Key Words<br />
• scatter plot<br />
• trend<br />
• line of best fit<br />
• curve of best fit<br />
• linear relation<br />
• non-linear relation
Writing Solutions<br />
When your teacher asks you to “show your work,” you must show<br />
all your thinking and write a complete solution to the question.<br />
One question in a text was:<br />
“A cone has height 8 m and base radius 10 m.<br />
Determine the volume of the cone.<br />
Show your work.”<br />
Here are 2 students’ solutions.<br />
× × ×<br />
➢ The solution on the left is more detailed.<br />
List some things that are included in the detailed solution.<br />
➢ Suppose you did not know what the question was.<br />
Could you follow the thinking of the student on the right?<br />
Explain.<br />
➢ Which solution looks more like your solutions?<br />
Here are some tips to write a solution:<br />
• Write the question.<br />
• Show all your steps so someone else can follow your thinking.<br />
• Include graphs, tables, or diagrams if they help explain your<br />
thinking.<br />
• Is your solution reasonable? If it does not make sense, check all<br />
your calculations.<br />
• Use math symbols, such as and , correctly.<br />
• Include symbols, such as m and m 2 , correctly.<br />
• Write a sentence that answers the question.<br />
• Include part of the question in the answer.<br />
146 CHAPTER 5: Graphing Relations
5.1 Interpreting Scatter Plots<br />
The New York Liberty is a team in the Women’s<br />
National Basketball Association (WNBA).<br />
Statistics for the players, such as points<br />
scored and time played, are recorded.<br />
Coaches can use these data to help<br />
them decide who should play.<br />
Investigate<br />
Interpreting a Scatter Plot<br />
During the 2005 regular season,<br />
15 athletes played for the<br />
New York Liberty.<br />
The scatter plot shows data for<br />
the team. Your teacher will give<br />
you a larger copy of this graph.<br />
➢ One athlete played for 361 min.<br />
About how many points did she score?<br />
How many athletes scored fewer points than she did?<br />
➢ Another athlete scored 353 points.<br />
About how many minutes did she play?<br />
➢ How many athletes scored more than 200 points?<br />
Which of these athletes played for the fewest minutes?<br />
➢ Suppose an athlete played many minutes but only scored a few<br />
points. In which region of the graph might her point be?<br />
Justify your answer.<br />
➢ Is there a relationship between time played and number<br />
of points scored? Justify your answer.<br />
Points scored<br />
400<br />
300<br />
200<br />
100<br />
New York Liberty 2005<br />
0 400 800<br />
1200<br />
Time played (min)<br />
Reflect<br />
Suppose you are a basketball coach.<br />
You select two of these players for your team.<br />
Based on these data, which two players would you select?<br />
Justify your choice.<br />
5.1 Interpreting Scatter Plots 147
Connect the Ideas<br />
A scatter plot is used to relate two different measures.<br />
For example, the scatter plot in Investigate, page 147,<br />
relates the points each player scored with the time she played.<br />
A relationship between the measures is shown by a trend<br />
in the data points.<br />
This mark, , on an<br />
axis indicates that<br />
numbers are missing<br />
from the scale.<br />
Height and Age of Students<br />
Height (cm)<br />
160<br />
120<br />
80<br />
0 5 10 15 20<br />
Age (years)<br />
The points in this scatter<br />
plot show a relationship.<br />
As you move to the right,<br />
the points go up.<br />
There is an upward trend.<br />
Height and Time to Travel to School<br />
for High School Students<br />
Time (min)<br />
30<br />
20<br />
10<br />
0 150 160 170 180 190<br />
Height (cm)<br />
The points in this scatter<br />
plot do not show a<br />
relationship.<br />
There is no trend in the data.<br />
Practice<br />
Your teacher will give you a large copy of each scatter plot.<br />
1. Lake Turkana is in the Great Rift Valley in northwest Kenya.<br />
As part of a study of water quality, the water temperature<br />
in the lake was measured at different depths.<br />
The data are shown in this scatter plot.<br />
a) What was the approximate temperature at a depth<br />
of 70 m? At the surface?<br />
b) At what depth was the temperature<br />
a little more than 27°C?<br />
c) Do the points in the scatter plot show a relationship?<br />
Explain your thinking.<br />
Water Temperature and<br />
Depth in Lake Turkana<br />
Temperature (C)<br />
30<br />
29<br />
28<br />
27<br />
26<br />
25<br />
0 20 40 60<br />
Depth (m)<br />
148 CHAPTER 5: Graphing Relations
A scatter plot can help you to identify trends in data.<br />
Example<br />
The scatter plot shows<br />
temperature data for<br />
some Ontario cities<br />
in November.<br />
a) What does point D represent?<br />
b) What do points E<br />
and F represent?<br />
c) What does point G represent?<br />
d) Is there a trend in the data?<br />
Explain.<br />
Temperature (C)<br />
8<br />
6<br />
4<br />
2<br />
0<br />
–2<br />
Average Daily Maximum<br />
Temperature in November<br />
A<br />
B<br />
C D<br />
E<br />
40 42 44 46 F 50<br />
Latitude (N) G<br />
Solution<br />
a) Point D represents a city with an<br />
average daily maximum temperature<br />
of about 3.5°C. It is located at latitude 46°N.<br />
b) Points E and F represent two cities<br />
with latitude 48°N. They have different average<br />
daily maximum temperatures.<br />
c) Point G represents a city with latitude 50°N and an<br />
average daily maximum temperature of about 2°C.<br />
d) There is a trend in the data.<br />
As we move to the right along the Latitude axis,<br />
the points on the scatter plot go down.<br />
That is, as the latitude increases, the temperature decreases.<br />
Latitude is a measure<br />
of how far north<br />
(or south) of the<br />
equator a city is.<br />
This means that the farther north an Ontario city is, the lower the<br />
average daily maximum temperature is for November.<br />
2. a) What does this scatter plot show?<br />
b) One data point is for Windsor, with<br />
elevation 190 m. What is the average<br />
daily temperature in Windsor for March?<br />
c) One data point is for Dunnville,<br />
with an average daily temperature<br />
of 0°C for March. What is<br />
Dunnville’s approximate elevation?<br />
How do you know?<br />
d) Describe any trends in the data.<br />
Justify your answer.<br />
Daily average<br />
temperature (C)<br />
Average Daily March Temperature for<br />
Selected Ontario Cities and Towns<br />
2<br />
0<br />
–2<br />
–4<br />
–6<br />
100 200 300<br />
Elevation (m)<br />
Elevation is the height<br />
of a city or town<br />
above sea level.<br />
5.1 Interpreting Scatter Plots 149
3. Assessment Focus The Census at School<br />
project collects data from high school students<br />
across Canada and around the world.<br />
The graph shows data for 26 students.<br />
a) Liam is 154 cm tall.<br />
i) What is his approximate arm span?<br />
ii) How many students have an arm span<br />
shorter than Liam’s?<br />
b) Maya is 177 cm tall.<br />
i) What is her approximate arm span?<br />
ii) How many students have an arm span longer than Maya’s?<br />
iii) Are any of these students taller than Maya?<br />
Justify your answer.<br />
c) Describe any trends in the data. Justify your answer.<br />
4. As part of a social studies project, a group of high school students compared<br />
their earnings from part-time jobs.<br />
Student Earnings<br />
a) One student earned $112.<br />
250<br />
i) How many hours did she work?<br />
200<br />
ii) How many students earned<br />
150<br />
more money than this student?<br />
iii) Did any of these students<br />
100<br />
work fewer hours? Explain.<br />
50<br />
b) i) About how much did the<br />
student who earned<br />
Time worked (h)<br />
the most make?<br />
ii) How many hours did this student work?<br />
iii) Did any students work more hours?<br />
c) Describe any trends in the data. Justify your answer.<br />
0 5 10 15 20<br />
5. Take It Further Refer to the scatter plot in question 4.<br />
a) One student worked 8 h.<br />
i) About how much did this student earn?<br />
ii) What is this student’s hourly rate?<br />
b) Identify one student who earned more per hour than the student in part a,<br />
and one who earned less. Explain how you know.<br />
Earnings ($)<br />
Source: Statistics Canada, Education Matters: Insights on<br />
Education, Learning, and Training in Canada. “Census at<br />
School”. Catalogue no. 81-004-XIE, Vol. 2, No. 5, released<br />
February 28, 2006. Date extracted June 23, 2006.<br />
The arm span and<br />
height are measured<br />
in centimetres.<br />
Describe how a scatter plot can be used to show a trend in data.<br />
Use pictures, words, and numbers.<br />
150 CHAPTER 5: Graphing Relations
5.2 Line of Best Fit<br />
To assess a person’s nutritional needs, a doctor should<br />
know the person’s height. But it can be difficult to<br />
measure the height of a person with a disability.<br />
Researchers look for other measures that can be used<br />
to estimate a person’s height, such as knee height, arm<br />
length, and arm span.<br />
Investigate<br />
Trends in Measurement<br />
Do you think a taller person has longer arms than a shorter<br />
person? Answer the question, then conduct the following<br />
experiment to check your prediction.<br />
Work in a group of 3.<br />
You will need a measuring tape.<br />
Work together to measure each person’s height and arm length.<br />
Record these measurements on the board.<br />
Measure each person’s knee height.<br />
Record your knee height and your height in your<br />
notebook for use in Practice, question 5, page 155.<br />
Copy the data from the board into a table like this.<br />
Draw a scatter plot.<br />
Height<br />
Does there appear to be a relationship (cm)<br />
between height and arm length?<br />
How do you know?<br />
Compare your results with your prediction.<br />
If they are different, explain why.<br />
Arm length<br />
(cm)<br />
Keep your scatter<br />
plot for use in<br />
Practice, question 2,<br />
page 153.<br />
Reflect<br />
Use your scatter plot to answer these questions.<br />
Justify your answers.<br />
➢ A person is 160 cm tall. What might her arm length be?<br />
➢ A person has arm length of 75 cm. How tall might he be?<br />
Compare your answers with those of your classmates.<br />
If the answers are different, explain why.<br />
5.2 Line of Best Fit 151
Connect the Ideas<br />
Draw the<br />
scatter plot<br />
The owner of an ice-cream stand<br />
wants to predict the number<br />
of ice-cream cones she will<br />
sell each day.<br />
From her experience, she<br />
thinks the number may be<br />
related to the daily maximum<br />
temperature.<br />
For 2 weeks, the owner<br />
records the maximum<br />
temperature and the number<br />
of cones sold each day.<br />
She then draws a scatter plot.<br />
Cones sold<br />
Ice-cream Cone Sales<br />
220<br />
200<br />
180<br />
160<br />
140<br />
Recall that this<br />
mark, , on an axis<br />
indicates that<br />
numbers are missing<br />
from the scale.<br />
The scatter plot shows a trend<br />
in the data. The points go up to<br />
the right. That is, as the daily<br />
maximum temperature<br />
increases, more cones are sold.<br />
120<br />
0 24 26 28 30 32<br />
Maximum temperature (C)<br />
Draw the line<br />
of best fit<br />
To help predict the number of cones that might be sold,<br />
we draw a line of best fit.<br />
There should be<br />
about as many<br />
points above the<br />
line as below.<br />
Use the line<br />
to estimate<br />
To do this, place a ruler on<br />
the graph so that it follows<br />
the path of the points.<br />
Draw a straight line along<br />
the edge of the ruler.<br />
One day, the predicted<br />
maximum temperature is 31°C.<br />
To estimate the number<br />
of cones that might be sold,<br />
use the line of best fit.<br />
Begin at 31 on the Maximum<br />
temperature axis.<br />
Move up to the line of best fit,<br />
then over to the Cones sold axis.<br />
When the temperature is 31°C,<br />
about 186 cones might be sold.<br />
Cones sold<br />
220<br />
200<br />
186<br />
180<br />
160<br />
140<br />
120<br />
Ice-cream Cone Sales<br />
0 24<br />
26 28 30<br />
31<br />
32<br />
Maximum temperature (C)<br />
152 CHAPTER 5: Graphing Relations
Practice<br />
1. Adrianna drew a scatter plot and three different lines.<br />
Which line would you use as a line of best fit? Justify your choice.<br />
a) Wrist Circumference b) Wrist Circumference c)<br />
and Height<br />
and Height<br />
Wrist Circumference<br />
and Height<br />
Wrist circumference (mm)<br />
190<br />
170<br />
150<br />
130<br />
110<br />
0 125 145 165 185 205<br />
Height (cm)<br />
Wrist circumference (mm)<br />
190<br />
170<br />
150<br />
130<br />
110<br />
0 125 145 165 185 205<br />
Height (cm)<br />
Wrist circumference (mm)<br />
190<br />
170<br />
150<br />
130<br />
110<br />
0 125 145 165 185 205<br />
Height (cm)<br />
2. Use the scatter plot you drew in Investigate, page 151.<br />
a) Draw a line of best fit.<br />
b) Use your line to answer the two questions in Reflect, page 151.<br />
c) How do your answers in part b compare to your predictions in Reflect?<br />
d) Compare your predictions with those of two classmates.<br />
Does the line of best fit give closer predictions than the graph<br />
without the line? Explain.<br />
3. Ask your teacher for a copy of the two scatter plots from Section 5.1, page 149.<br />
a) Only one of these scatter plots may be modelled with a line of best fit.<br />
Which is it? Explain why you should not draw a line of best fit for the<br />
other scatter plot.<br />
b) Draw a line of best fit for the plot you chose in part a.<br />
Use your line to make a temperature prediction for a latitude or elevation<br />
not included on the scatter plot.<br />
You can extend a line of best fit to predict values beyond the data points.<br />
Example<br />
The table shows the world record times for women’s 500-m speed<br />
skating from 1983 to 2001.<br />
Year 1983 1986 1987 1987 1988 1994 1995 1997 1997 1997 2001 2001 2001<br />
Time(s) 39.69 39.52 39.43 39.39 39.10 38.99 38.69 37.90 37.71 37.55 37.40 37.29 37.22<br />
a) What trend do you see in the data?<br />
b) Draw a scatter plot and a line of best fit.<br />
5.2 Line of Best Fit 153
c) What might the record have been in 1981?<br />
d) When might the record time be less than 37 s?<br />
e) What assumptions are you making in part d?<br />
Solution<br />
a) The world record times are decreasing.<br />
That is, the skaters are getting faster.<br />
b)<br />
Women’s 500-m Speed Skating Records<br />
Time (s)<br />
40<br />
39<br />
38<br />
37<br />
36<br />
0 1980<br />
1985 1990 1995 2000 2005<br />
Year<br />
c) From the line of best fit, the world record in 1981<br />
might have been about 40.2 s.<br />
d) From the line of best fit, the world record might drop<br />
below 37 s by 2005.<br />
e) We assume the skaters can keep improving their times.<br />
4. A ball is dropped from different heights.<br />
The drop height and rebound height are recorded.<br />
a) What trend do you see in the data?<br />
Does the rebound height of the ball appear to<br />
depend on the height from which the ball is dropped?<br />
b) Draw a scatter plot.<br />
Does the scatter plot support your answers to part a?<br />
Explain.<br />
c) Draw a line of best fit.<br />
d) Predict the rebound height when the ball is dropped<br />
from a height of 2.5 m and from a height of 8 m.<br />
How did you do this?<br />
e) Write one other question about these data.<br />
Answer your question.<br />
Show your work.<br />
Drop<br />
height (m)<br />
Rebound<br />
height (m)<br />
1.0 0.7<br />
2.0 1.3<br />
3.0 2.3<br />
4.0 3.0<br />
5.0 3.8<br />
Having Trouble?<br />
Read the<br />
Example above.<br />
154 CHAPTER 5: Graphing Relations
5. Assessment Focus In Investigate, page 151, you recorded<br />
your height and knee height.<br />
a) Do you think a person’s knee height is related to<br />
her or his height? Explain.<br />
b) Use your measurements and those of 15 classmates.<br />
Draw a scatter plot.<br />
If possible, draw a line of best fit.<br />
Do the data support your answer to part a? Explain.<br />
c) Estimate the knee height of a person who is 180 cm tall.<br />
d) Estimate the height of a person with a knee height of 50 cm.<br />
6. Is a person’s shoe size related to her or his height?<br />
To check your answer, use the height data from Investigate,<br />
page 151, and collect shoe size data.<br />
a) Graph the data. Can you draw a line of best fit? Justify your answer.<br />
b) Do the data support your answer? Explain.<br />
7. Choose a topic to investigate that involves two measures.<br />
Pose a question about the relationship between the measures.<br />
Conduct an experiment or research to find the data you need<br />
to answer the question.<br />
Present your solution using words, numbers, and graphs.<br />
If the data appear to lie along a line, include a line of best fit on the graph.<br />
8. Will two people always draw the same line of best fit for a set of data? Explain.<br />
9. Take It Further Conduct research to find the world record times for<br />
men’s 500-m speed skating from 1983 to 2001.<br />
a) What trend do you see in the data?<br />
b) Draw a scatter plot and a line of best fit.<br />
c) Estimate what the record might have been in 1981.<br />
How did you do this? Do some research to check the estimate.<br />
d) Write a question that can be answered using the line of best fit.<br />
Prepare a solution for the question.<br />
Give the graph and question to a classmate to answer.<br />
Discuss and compare your solutions.<br />
List 2 reasons you might draw a line of best fit after plotting data.<br />
Provide an example for each reason.<br />
5.2 Line of Best Fit 155
Using Fathom to Draw<br />
a Line of Best Fit<br />
As part of the international project called Census at School,<br />
Statistics Canada has collected data on Canadian<br />
high school students.<br />
We will use Fathom to explore relationships in the data<br />
for 104 Ontario students. These students were selected<br />
from the Census at School database.<br />
Here is a “collection inspector” window for the data set:<br />
In Fathom, a collection<br />
is a data set.<br />
Source: Statistics Canada, Education Matters: Insights on Education, Learning,<br />
and Training in Canada. “Census at School”. Catalogue no. 81-004-XIE, Vol. 2,<br />
No. 5, released February 28, 2006. Date extracted June 23, 2006.<br />
We see that this person is a 15-year-old male who is 179 cm tall,<br />
has a hand span of 23 cm, a wrist circumference of 151 mm,<br />
a foot length of 28 cm, and brown eyes.<br />
We can also see information about his home and his life.<br />
Notice that some attributes, such as height,<br />
are described by a number.<br />
Other attributes, such as plans, are described in words.<br />
156 CHAPTER 5: Graphing Relations
We will create scatter plots to help us look for relationships<br />
between attributes described by numbers.<br />
Use Fathom to open the file<br />
Ontario High School Students 1.<br />
This is a ready-made data set<br />
on 104 students.<br />
Both the hand span<br />
and foot length<br />
are measured in<br />
centimetres.<br />
You will see a scatter plot showing<br />
hand span on the horizontal axis<br />
and foot length on the vertical axis.<br />
We see that, generally, the greater<br />
a person’s hand span, the longer<br />
her or his foot.<br />
To model this relationship with<br />
a line: Click on the graph so it<br />
becomes active.<br />
The Graph menu appears on the<br />
toolbar at the top of the screen.<br />
Select the Graph menu.<br />
Then select Movable Line.<br />
“Fit” the brown line to the data so it<br />
illustrates the relationship between<br />
foot length and hand span. You can<br />
“grab and drag” the ends of the brown<br />
line to make it steeper or less steep.<br />
You can “grab and drag” the middle of<br />
the brown line to move it up or down.<br />
When the line fits the data the best,<br />
the data points should be equally<br />
distributed on both sides of your<br />
line of best fit.<br />
Notice that Fathom gives you the<br />
equation for your line of best fit.<br />
Print the graph.<br />
Technology: Using Fathom to Draw a Line of Best Fit 157
Double-click the collection.<br />
The first case in the collection<br />
is displayed beside the graph.<br />
To explore if there is a relationship<br />
between hand span and wrist<br />
circumference: Left click, drag,<br />
and drop the “Wrist” attribute from<br />
the collection inspector to the<br />
vertical axis of your scatter plot.<br />
The foot length data are replaced<br />
by the wrist circumference data.<br />
Because the vertical axis now begins<br />
at a greater number, the brown<br />
movable line is no longer visible.<br />
“Grab” the bottom of the vertical<br />
axis and drag it up, until the movable<br />
line appears. “Grab and move up”<br />
the line. You can “grab and push”<br />
the vertical axis back where it was.<br />
“Fit” the movable line to the data.<br />
Describe the relationship between<br />
hand span and wrist circumference.<br />
Do you think it is appropriate to<br />
draw a line of best fit for these data?<br />
Justify your answer.<br />
Print your graph.<br />
Insert a text box.<br />
Type in your name. Save your file.<br />
Try to find relationships between<br />
other attributes described by numbers.<br />
For each relationship you investigated, compare your line of best<br />
fit with those of other students. How are they similar?<br />
158 CHAPTER 5: Graphing Relations
5.3 Curve of Best Fit<br />
Investigate<br />
Relationship between Temperature and Time<br />
Work in a group of 3.<br />
You will need: a plastic cup, an insulated cup,<br />
crushed ice, water, a measuring cup, and a thermometer<br />
Place equal volumes of ice and warm water in each cup.<br />
Predict what will happen to the ice and water in each cup.<br />
Predict how the temperature will change over time.<br />
Give reasons for your predictions.<br />
Measure the temperature of the contents of each cup<br />
at regular intervals for 30 min.<br />
How often do you think you should measure<br />
the temperatures? Why?<br />
Record the times and temperatures in a table.<br />
Use a different colour to plot each<br />
set of data on the same grid.<br />
How are the graphs the same?<br />
How are they different?<br />
Describe any trends in the graphs.<br />
Do the results support your<br />
predictions? Explain.<br />
How long did it take the contents<br />
of each cup to reach a constant<br />
temperature?<br />
Temperature (C)<br />
0<br />
Time (min)<br />
Reflect<br />
➢ What factors might affect the results of this experiment?<br />
➢ How could you change this experiment to account for<br />
these factors?<br />
Compare your results with those of your classmates.<br />
If they are different, explain why.<br />
5.3 Curve of Best Fit 159
Connect the Ideas<br />
A weather forecaster measures and plots the temperature<br />
every 2 h on a summer day.<br />
The temperatures decrease from midnight to 4:00 a.m., increase<br />
once the sun rises, reach a maximum in the afternoon, then<br />
decrease again during the late afternoon and evening.<br />
The points do not lie on a straight line, but appear to be related.<br />
These data can be approximated by a curve.<br />
We call it a curve of best fit.<br />
To draw a curve of best fit, draw the smooth curve that passes<br />
through as many points as possible.<br />
30<br />
25<br />
20<br />
15<br />
10<br />
5<br />
Temperatures Throughout the Day<br />
0<br />
12:00<br />
midnight<br />
6:00<br />
a.m.<br />
12:00<br />
noon<br />
Time of day<br />
6:00<br />
p.m.<br />
The greatest temperature occurred between 2:00 p.m. and 3:00 p.m.<br />
We can use the curve to estimate the temperature at 5:00 a.m.<br />
Begin at 5:00 a.m. on the Time of day axis.<br />
Move up to the curve, then across to the Temperature axis.<br />
At 5:00 a.m., the temperature was about 15°C.<br />
160 CHAPTER 5: Graphing Relations
Practice<br />
1. Your teacher will give you a copy of each graph.<br />
Describe any trends in the data. Draw a curve of best fit for each set of data.<br />
a) Path of an Arrow b) Population of Caribou Herd c)<br />
Height (m)<br />
5.0<br />
4.0<br />
3.0<br />
2.0<br />
1.0<br />
Number of animals<br />
25 000<br />
20 000<br />
15 000<br />
10 000<br />
5 000<br />
Height (cm)<br />
Growth of a Sunflower<br />
250<br />
200<br />
150<br />
100<br />
50<br />
0 0.5 1 1.5 2.0<br />
Time (s)<br />
0<br />
1980<br />
1988 1996<br />
Year<br />
0 20 40 60<br />
Day<br />
80<br />
2. The table shows the number of hours of daylight in Waterloo, Ontario,<br />
for the first day of each month in 2005.<br />
Month Jan Feb Mar April May June July Aug Sep Oct Nov Dec<br />
Daylight 9.0 9.9 11.2 12.8 14.2 15.2 15.4 14.5 13.2 11.7 10.3 9.2<br />
hours<br />
a) What trend do you see in the data? Explain the trend.<br />
b) Graph the data. Draw a curve of best fit.<br />
c) Estimate the number of hours of daylight on March 15.<br />
d) The day with the most daylight is June 21.<br />
Estimate the number of hours of daylight on June 21.<br />
e) Estimate the number of hours of daylight on your birthday.<br />
How did you do this?<br />
You have used a curve of best fit to predict values that lie between data points.<br />
You can also extend a curve of best fit to predict values beyond the data points.<br />
Example<br />
A soccer ball is kicked up into the air from the ground.<br />
The height of the ball is measured at regular time intervals.<br />
Here are the data.<br />
Time (s) 0 0.2 0.4 0.6 0.8 1.0 1.2 1.4 1.6<br />
Height (m) 0 2.2 4.0 5.4 6.5 7.1 7.3 7.2 6.7<br />
a) What trend do you see in the data? Explain the trend.<br />
b) Graph the data. Draw a curve of best fit.<br />
c) When do you think the ball is at its greatest height?<br />
Use the graph to check.<br />
5.3 Curve of Best Fit 161
d) When is the ball 5 m high?<br />
e) When does the ball hit the ground? How does the graph show this?<br />
Solution<br />
a) The height of the ball increases, then decreases.<br />
That is, the ball stops rising and begins to fall.<br />
b)<br />
Height of a Soccer Ball<br />
Height (m)<br />
8<br />
7<br />
6<br />
5<br />
4<br />
3<br />
2<br />
1<br />
0 1 2 3<br />
Time (s)<br />
c) From the table and graph, the greatest height of the ball<br />
seems to occur at 1.2 s when the ball is 7.3 m high.<br />
d) There are two times when the ball is 5 m high:<br />
once as it is rising and once as it is falling.<br />
To determine the second time, extend the graph to the right.<br />
Draw a smooth curve that “mirrors” the curve from the<br />
starting point to its greatest height.<br />
Height of a Soccer Ball<br />
Height (m)<br />
8<br />
7<br />
6<br />
5<br />
4<br />
3<br />
2<br />
1<br />
0 1 2 3<br />
Time (s)<br />
From the graph, the ball is 5 m high at approximately<br />
0.5 s and 1.9 s.<br />
e) The extended curve shows that the ball hits the ground after<br />
about 2.4 s, when the height is 0 m.<br />
This is where the curve meets the Time axis.<br />
162 CHAPTER 5: Graphing Relations
3. An Internet host is a computer directly connected to the Internet.<br />
The number of Internet hosts around the world has grown quickly.<br />
The data in the table are for January of each given year.<br />
Year 1992 1994 1996 1998 2000 2002 2004 2006<br />
Internet hosts 0.7 2.2 9.5 29.7 72.4 147.3 233.1 395.0<br />
(millions)<br />
a) What trend do you see in the data? Explain the trend.<br />
b) Graph the data. Draw a curve of best fit.<br />
c) Estimate the number of Internet hosts in 2001.<br />
d) When might the number of Internet hosts reach 500 million? Justify your answer.<br />
4. Assessment Focus The high divers at Paramount Canada’s<br />
Wonderland perform competitive dives from a height of 21 m.<br />
A diver’s height is measured every 0.2 s.<br />
Time (s) 0 0.2 0.4 0.6 0.8 1.0 1.2<br />
Height (m) 21 20.7 20.2 19.4 17.6 16 14<br />
a) What trend do you see in the data? Explain the trend.<br />
b) Graph the data. Draw a curve of best fit.<br />
c) Estimate when the diver will be 10 m above the water.<br />
d) When does the diver reach the pool? How do you know?<br />
5. Take It Further The table shows the number of people enrolled in<br />
apprenticeship programs in Canada, rounded to the nearest thousand.<br />
Year 1995 1996 1997 1998 1999 2000 2001 2002<br />
Females 11 12 13 14 16 17 20 22<br />
(thousands)<br />
Males 153 154 159 163 173 184 198 213<br />
(thousands)<br />
a) Graph both sets of data on one grid.<br />
b) For each data set, draw a line or curve of best fit.<br />
How did you decide which to draw?<br />
c) Estimate the numbers of females and males enrolled in apprenticeship<br />
programs in 2003. How did you do this?<br />
Suppose you graph data for which a curve of best fit can be drawn.<br />
How do you decide where to draw the curve? Include a graph in your explanation.<br />
5.3 Curve of Best Fit 163
Using a Graphing Calculator to<br />
Draw a Curve of Best Fit<br />
When data points appear to lie along a curve,<br />
we say the relation is non-linear.<br />
There are many mathematical models to describe<br />
non-linear relations.<br />
Two models are a quadratic curve of best fit and<br />
an exponential curve of best fit.<br />
The TI-83 and TI-84 graphing calculators can model a relation with<br />
• a line of best fit (LinReg)<br />
• a quadratic curve of best fit (QuadReg)<br />
• an exponential curve of best fit (ExpReg)<br />
Three sample scatter plots are shown.<br />
Each plot represents a different type of relation.<br />
It can be difficult to<br />
distinguish between<br />
quadratic and<br />
exponential relations.<br />
The quadratic curve<br />
increases more<br />
gradually.<br />
Linear Quadratic Exponential<br />
A ball is dropped from a height of 3.5 m.<br />
The height of the ball as it drops is measured<br />
using a CBR motion detector.<br />
The data are shown in this table.<br />
Time (s) 0.0 0.2 0.4 0.6 0.8<br />
Height (m) 3.5 3.2 2.8 1.5 0.2<br />
Use a TI-83 or TI-84.<br />
Follow these steps to model this relation.<br />
164 CHAPTER 5: Graphing Relations
Press … ¨ to access the List Editor.<br />
If necessary, clear the lists L1 and L2.<br />
To do this, move the cursor to the<br />
column head and press ‘ Í.<br />
Enter the times in L1, and<br />
the corresponding heights in L2.<br />
After you key in each number,<br />
press Í. Before graphing the data,<br />
make sure there are no equations<br />
in the o list. To do this, press o.<br />
Move the cursor to any equation,<br />
then press ‘.<br />
Press y o¨ to access<br />
the Stat Plot Editor for Plot 1.<br />
Set the plot options as shown here.<br />
Then press q o.<br />
This instructs the calculator to set<br />
the window so all the data can be<br />
displayed, and graphs the data.<br />
The graph should look like<br />
the one shown here.<br />
The points do not lie on a line.<br />
We will model the data with an<br />
exponential curve and a quadratic<br />
curve, and decide which is the better fit.<br />
To draw an exponential curve of<br />
best fit, press … BµÍ.<br />
The calculator displays the equation<br />
of an exponential curve that models<br />
the data.<br />
To show the curve, press o ‘.<br />
Press o.<br />
Then press OzBB¨s.<br />
VARS<br />
Technology: Using a Graphing Calculator to Draw a Curve of Best Fit 165
To draw a quadratic curve of best fit,<br />
press … BzÍ.<br />
The calculator displays the equation<br />
of a quadratic curve that models<br />
the data.<br />
To show the curve, press o ‘.<br />
Then press OzBB¨s.<br />
VARS<br />
Which model better represents the data? Justify your choice.<br />
Complete these steps for each set of data below.<br />
Use pages 165 and<br />
166 as a guide.<br />
➢ Use a TI-83 or TI-84 to graph the data.<br />
➢ Draw an exponential curve of best fit and<br />
a quadratic curve of best fit.<br />
Sketch each curve.<br />
➢ Decide which curve better models the data.<br />
Justify your answer.<br />
1. In 2002, movie attendance in Canada hit a 44-year high.<br />
The table shows the attendance in several other years<br />
for comparison.<br />
Year 1991 1998 1999 2000 2002<br />
Movie attendance 69.2 109.7 117.4 117.6 124.2<br />
in Canada (millions)<br />
2. In ideal conditions, E. coli bacteria cells divide every 20 min.<br />
The table shows how the number of cells in a sample would<br />
grow over time.<br />
Time (min) 0 20 40 60 80 100 120<br />
Number of cells 1 2 4 8 16 32 64<br />
166 CHAPTER 5: Graphing Relations
Hidden Sum<br />
Play in a group of 3.<br />
You will need a calculator.<br />
As a group, choose a target number greater than 200.<br />
The first player enters a number into the calculator,<br />
presses the Memory Plus key ´, M+<br />
and passes the calculator to the second player.<br />
The next player enters a number and presses the ´ M+ key.<br />
The number is added to the number already stored in the memory.<br />
Take turns entering numbers and pressing the ´ M+ key.<br />
Each number entered<br />
must be less than 50.<br />
When you think the sum is equal to or greater than<br />
the target number, call out “Over!”<br />
Use the Memory Recall key ´ MR to check.<br />
If you are correct, you win the game.<br />
If not, you are out of the game.<br />
The other players continue taking turns.<br />
Game: Hidden Sum 167
Mid-Chapter Review<br />
5.1<br />
1. Jordan and Esau compared the<br />
statistics of the junior boys’ basketball<br />
team. They drew a scatter plot.<br />
20<br />
Boys’ Basketball Statistics<br />
Here are some data Saskia and Maria<br />
collected.<br />
Height (cm) 69 59 54 46<br />
Mass (kg) 35 32 23 17<br />
18<br />
Height (cm) 38 31 28 27<br />
16<br />
Mass (kg) 14 6 8 5<br />
5.2<br />
Points scored<br />
14<br />
12<br />
10<br />
8<br />
6<br />
4<br />
2<br />
0<br />
10 20<br />
Time played (min)<br />
a) What does each point represent?<br />
b) How many points were scored by<br />
the boy who played 10 min?<br />
c) How many boys scored 15 or fewer<br />
points? More than 15 points?<br />
d) Suppose a boy played few minutes<br />
but scored many points. Where<br />
would his point on the graph be?<br />
e) Describe any trends in the data.<br />
Justify your answer.<br />
2. Saskia and Maria are working on a<br />
science fair project. They investigate<br />
whether a dog’s mass is related to<br />
its height.<br />
Height<br />
30<br />
5.3<br />
a) Describe any trends in the data.<br />
b) Graph the data.<br />
Draw a line of best fit.<br />
c) Does there appear to be a<br />
relationship between a dog’s<br />
height and mass?<br />
Justify your answer.<br />
d) Estimate the height of a dog with<br />
mass 16 kg.<br />
e) Estimate the mass of a dog that is<br />
50 cm high.<br />
f) What assumptions did you make<br />
in parts d and e?<br />
3. This table shows the world population<br />
every 10 years from 1900 to 2000.<br />
The populations are rounded.<br />
Year 1900 1910 1920 1930 1940 1950 1960 1970 1980 1990 2000<br />
Population 1.6 1.8 1.9 2.1 2.3 2.6 3.0 3.7 4.5 5.3 6.1<br />
(billions)<br />
a) Describe any trends in the data.<br />
b) Graph the data.<br />
Draw a curve of best fit.<br />
c) Estimate the population in 1925<br />
and in 1975.<br />
d) Estimate the population in 1890.<br />
e) Predict the population in 2010.<br />
f) What assumptions did you make<br />
in parts c, d, and e?<br />
168 CHAPTER 5: Graphing Relations
5.4 Graphing Linear Relations<br />
Investigate<br />
Relationships in Patterns<br />
Work with a partner.<br />
You will need congruent square tiles and grid paper.<br />
Frame 1<br />
Frame 2<br />
The first 3 frames in a pattern<br />
are shown at the left.<br />
➢ Draw the frames on grid paper.<br />
Describe the pattern.<br />
➢ Use tiles to construct the<br />
next 3 frames in the pattern.<br />
Draw the frames on grid paper.<br />
➢ Record the number of tiles<br />
in each frame in a table like<br />
the one below.<br />
Frame number<br />
Number of tiles<br />
in a frame<br />
Frame 3<br />
Describe any trends in the data.<br />
➢ Graph the data.<br />
Describe how you can use the graph to determine<br />
the number of tiles in a frame<br />
when you know the frame number.<br />
How many tiles will be in the 15th frame?<br />
The 22nd frame? The 100th frame?<br />
Reflect<br />
Write a rule to determine the number of tiles in any frame.<br />
Check that your rule works.<br />
Compare your rule with those of other students.<br />
If the rules are different, explain why.<br />
5.4 Graphing Linear Relations 169
Connect the Ideas<br />
Recall that volume of<br />
a pyramid: V = 1 Bh<br />
3<br />
Calculate the<br />
volume, V<br />
3 cm<br />
1 cm<br />
We can explore how the volume of a pyramid is related<br />
to its height.<br />
Here are several square pyramids with base area 9 cm 2 .<br />
3 cm<br />
2 cm<br />
9 cm 2 3 cm<br />
3 cm<br />
4 cm<br />
9 cm 2<br />
3 cm<br />
9 cm 2 5 cm<br />
3 cm<br />
9 cm 2<br />
9 cm 2 Height (cm) Volume (cm 3 )<br />
1<br />
V 3 9 1<br />
1<br />
V 3 9 2<br />
1<br />
V 3 9 3<br />
1<br />
V 3 9 4<br />
1<br />
V 3 9 5<br />
3 6 9 12 15<br />
Graph the data<br />
Here are the data and a graph.<br />
Volumes of Square Pyramids with<br />
Base Area 9 cm 2<br />
1<br />
1<br />
1<br />
1<br />
1 3<br />
2 6<br />
3 9<br />
4 12<br />
5 15<br />
3<br />
3<br />
3<br />
3<br />
Volume (cm 3 )<br />
16<br />
12<br />
8<br />
4<br />
As the height increases by 1 cm,<br />
the volume increases by 3 cm 3 .<br />
0 1<br />
2 3 4 5<br />
Height (cm)<br />
We can join the points with a line since pyramids exist<br />
with heights between the heights in the table.<br />
Since the graph is a straight line, we say there is a<br />
linear relation between the volume and height.<br />
Use the graph<br />
to estimate<br />
To estimate the volume of a<br />
pyramid with base area 9 cm 2 and<br />
height 2.5 cm:<br />
Begin at 2.5 on the Height axis.<br />
Move up to the line, then across to<br />
the Volume axis.<br />
The volume is about 7.5 cm 3 .<br />
Volumes of Square Pyramids with<br />
Base Area 9 cm 2<br />
Volume (cm 3 )<br />
16<br />
12<br />
7.5 8<br />
4<br />
0 1 2 3<br />
2.5<br />
4 5<br />
Height (cm)<br />
170 CHAPTER 5: Graphing Relations
Use a rule<br />
The rule gives an<br />
accurate answer.<br />
From the table, for these pyramids,<br />
the volume is 3 times the height.<br />
We can calculate any volume using this rule.<br />
When the height is 2.5, the volume is:<br />
V 3 2.5<br />
7.5<br />
The volume of a pyramid with base area 9 cm 2 and height<br />
2.5 cm is 7.5 cm 3 .<br />
Practice<br />
1. This graph shows how the Celsius and<br />
Fahrenheit temperature scales are related.<br />
Your teacher will give you a large<br />
copy of this graph.<br />
a) Is the relationship linear? How do you know?<br />
b) Use the graph to estimate the Fahrenheit<br />
equivalent of 25°C.<br />
c) Use the graph to estimate the Celsius<br />
equivalent of –5°F.<br />
d) How could you check your answers to<br />
parts b and c?<br />
e) Write a question that could be answered<br />
using the graph.<br />
Exchange questions with a classmate.<br />
Check each other’s work.<br />
–40<br />
Relating the Celsius and Fahrenheit<br />
Temperature Scales<br />
Temperature (F)<br />
100<br />
80<br />
60<br />
40<br />
20<br />
0 20<br />
Temperature (C)<br />
40<br />
2. In Connect the Ideas, page 170, you learned that<br />
there is a linear relationship between the volume of<br />
a square pyramid with base area 9 cm 2 and its height.<br />
Suppose we have a square prism with base area 9 cm 2 instead.<br />
a) Do you think the relationship between volume and height<br />
is linear? Justify your answer.<br />
b) Create a table of values for the volumes of prisms with heights<br />
from 1 cm to 5 cm.<br />
c) Graph the data.<br />
d) What trend do you see in the data? Is the relationship linear?<br />
e) Write a rule for the relationship.<br />
f) Determine the volume of a prism with base area 9 cm 2<br />
and height 3.5 cm.<br />
How many different ways could you do this? Explain.<br />
Need Help?<br />
A 9 cm 2<br />
Read Connect<br />
the Ideas.<br />
5.4 Graphing Linear Relations 171
We can apply what we know about linear relations to geometry.<br />
Example<br />
How are the angles in an isosceles<br />
triangle related?<br />
a) Make a table to show the measures<br />
of the equal angles and the third<br />
angle in an isosceles triangle.<br />
What trend do you see<br />
in the data?<br />
b) Graph the data.<br />
Is the relationship linear?<br />
Justify your answer.<br />
Third angle<br />
Solution<br />
In Chapter 3,<br />
you learned<br />
how the<br />
angles in a<br />
triangle are<br />
related.<br />
a) The sum of the angles in a triangle<br />
is 180°.<br />
Add the two equal angles, then<br />
subtract the sum from 180° to<br />
determine the third angle.<br />
For example, when the equal angles<br />
are 10°, their sum is 20°, and the<br />
third angle is 180° 20° 160°<br />
From the table, we see that for<br />
every 10° increase in the equal angles,<br />
there is a 20° decrease in<br />
the third angle.<br />
b) The points lie on a straight line.<br />
So, the relationship is linear.<br />
Since we can draw isosceles<br />
triangles with angles between<br />
those in the table, we join the<br />
points with a line.<br />
Angles in an Isosceles Triangle<br />
Third angle measure ()<br />
Equal angle Third angle<br />
measure (°) measure (°)<br />
10 160<br />
20 140<br />
30 120<br />
40 100<br />
50 80<br />
60 60<br />
70 40<br />
80 20<br />
160<br />
140<br />
120<br />
100<br />
80<br />
60<br />
40<br />
20<br />
0<br />
50 100<br />
Equal angle measure ()<br />
172 CHAPTER 5: Graphing Relations
3. Investigate the relationship between the 2 acute angles<br />
in a right triangle.<br />
a) Create a table of values.<br />
Use 5°, 10°, 15°, 20°, and 25° as the measures of one angle.<br />
Graph the data.<br />
b) What trend do you see in the data and graph?<br />
Is the relationship linear?<br />
Justify your answer.<br />
c) What is the measure of the second acute angle<br />
in a right triangle with one angle measuring 30°?<br />
With one angle measuring 40°?<br />
Show your work.<br />
4. Assessment Focus The first 3 frames in a pattern are<br />
shown at the right.<br />
Use toothpicks to construct the frames.<br />
a) Construct the next 3 frames in the pattern.<br />
Record each frame number and the number of<br />
toothpicks in a table.<br />
b) Do you think this is a linear relation? Explain.<br />
c) Graph the data. Is the relationship linear?<br />
Justify your answer.<br />
d) Predict how many toothpicks will be in the 8th frame.<br />
Justify your prediction.<br />
e) Write a rule for the number of toothpicks in any frame.<br />
f) Determine the number of toothpicks in the 15th frame.<br />
How many different ways could you do this? Explain.<br />
Need Help?<br />
Read the Example<br />
on page 172.<br />
Frame 1<br />
Frame 2<br />
Frame 3<br />
5. In Chapter 2, you drew different rectangles with the same<br />
perimeter. Here are the dimensions of some rectangles<br />
with perimeter 24 cm.<br />
a) Is the relationship between length and width linear?<br />
Justify your answer.<br />
b) Graph the data.<br />
Does the graph illustrate your answer to part a? Explain.<br />
c) Write a rule for the relationship.<br />
d) i) Determine the length when the width is 4.5 cm.<br />
ii) Determine the width when the length is 10.5 cm.<br />
e) How many different ways could you answer part d? Explain.<br />
Width (cm)<br />
Length (cm)<br />
1 11<br />
2 10<br />
3 9<br />
4 8<br />
5 7<br />
6 6<br />
P = 24 cm<br />
5.4 Graphing Linear Relations 173
6. An approximate rule for converting Celsius temperature to<br />
Fahrenheit temperature is: Double the Celsius temperature and add 30.<br />
a) Create a table of values for this rule.<br />
Extend the table to 30°C.<br />
Celsius<br />
temperature (˚C)<br />
20<br />
15<br />
10<br />
Fahrenheit<br />
temperature (˚F)<br />
sunny<br />
and 25°C<br />
25 2 30<br />
80°F<br />
b) Graph the data.<br />
c) Plot the line from the graph in question 1<br />
on your graph.<br />
d) Compare the two lines.<br />
For which range of temperatures is the rule<br />
“double and add 30” useful?<br />
Justify your answer.<br />
7. Take It Further Investigate the relationship between the<br />
volumes and heights of square pyramids with base area 16 cm 2 .<br />
a) Create a table of values for pyramids with heights<br />
from 1 cm to 5 cm.<br />
b) Graph the data.<br />
c) What trend do you see in the data and the graph?<br />
Is the relationship linear?<br />
Justify your answer.<br />
d) Estimate the volume of a pyramid with base area 16 cm 2<br />
and height 7.5 cm.<br />
How did you do this?<br />
e) Estimate the height of a pyramid with base area 16 cm 2<br />
and volume 60 cm 3 .<br />
How did you do this?<br />
f) Write a rule.<br />
How could you use the rule to check your answers<br />
to parts d and e?<br />
A = 16 cm 2<br />
What patterns in data and in a graph show a linear relation?<br />
Include examples in your explanation.<br />
174 CHAPTER 5: Graphing Relations
5.5 Graphing Non-Linear Relations<br />
Investigate<br />
Motion of a Pendulum<br />
Work with a partner.<br />
Do you think a longer pendulum takes more time to complete<br />
6 swings than a shorter pendulum?<br />
You will experiment to check your prediction.<br />
You will need a pencil, string, a nut, a heavy book, a metre stick,<br />
and a stopwatch. Make a pendulum as shown in the art.<br />
It should be 50 cm long.<br />
To determine the<br />
mean, add the times<br />
then divide by 4.<br />
Set your pendulum swinging.<br />
One swing occurs when the pendulum<br />
swings back and forth once. Let it swing a<br />
few times, then begin counting and timing.<br />
Record the time it takes to complete 6 swings.<br />
Repeat this process 3 more times.<br />
Determine the mean time for the 4 trials.<br />
Shorten the pendulum string to<br />
40 cm and repeat the experiment.<br />
Repeat the experiment 3 more<br />
times, shortening the length of the<br />
string to 30 cm, 20 cm, and 10 cm.<br />
Copy and complete this table.<br />
Describe any trends in the data.<br />
Was your prediction correct?<br />
Pendulum<br />
length (cm)<br />
50<br />
40<br />
30<br />
20<br />
10<br />
Mean time<br />
for 6 swings (s)<br />
Graph the data. Describe the graph. Then draw a curve of best fit.<br />
Reflect<br />
➢ How is the time for a pendulum to complete 6 swings related<br />
to the pendulum length?<br />
➢ Suppose your pendulum was 25 cm long.<br />
Estimate how long it might take to complete 6 swings.<br />
➢ What other factors do you think might affect the time for one swing?<br />
How could you check?<br />
5.5 Graphing Non-Linear Relations 175
Connect the Ideas<br />
Plankton and seaweed, which are the basis of ocean food chain,<br />
need sunlight to survive.<br />
As sunlight enters the ocean, it is absorbed and scattered<br />
by the water.<br />
The table and graph show how the<br />
amount of sunlight that penetrates<br />
clear tropical ocean water changes with depth.<br />
Light Penetration in Ocean<br />
Draw a curve<br />
of best fit<br />
Depth Light<br />
(m) penetration (%)<br />
0 100<br />
25 50<br />
75 10<br />
150 1<br />
Light penetration (%)<br />
120<br />
100<br />
80<br />
60<br />
40<br />
20<br />
0 50 100 150<br />
Depth (m)<br />
From the table and graph,<br />
we can see that the greater<br />
the depth, the less sunlight penetrates the water.<br />
Since the points appear to lie on a curve,<br />
we draw a smooth curve to fit the data.<br />
Use the curve<br />
to estimate<br />
At a depth of 40 m,<br />
about 30% of sunlight<br />
penetrates the water.<br />
At a depth of 100 m, only<br />
about 5% of sunlight<br />
penetrates the water.<br />
When the graph of a<br />
relationship is a curve,<br />
we say that the<br />
relationship is<br />
non-linear.<br />
Light penetration (%)<br />
120<br />
100<br />
80<br />
60<br />
40<br />
30<br />
20<br />
5<br />
0<br />
Light Penetration in Ocean<br />
50 100 150<br />
40<br />
Depth (m)<br />
176 CHAPTER 5: Graphing Relations
Practice<br />
1. Two graphs are shown. Is each relationship linear or non-linear?<br />
Explain how you know.<br />
a) Calories Burned When a b)<br />
55-kg Woman Walks<br />
Ontario Population<br />
300<br />
12<br />
Calories<br />
250<br />
200<br />
150<br />
100<br />
50<br />
Population (millions)<br />
8<br />
4<br />
0<br />
10 20 30 40 50 60<br />
Time (min)<br />
0<br />
1920 1940 1960 1980 2000<br />
Year<br />
2. Use the graphs in question 1.<br />
a) i) About how many calories does a 55-kg woman burn<br />
when she walks for 30 min? For 45 min?<br />
ii) What was the approximate population of Ontario in 1945? In 1995?<br />
b) Write a question of your own that can be answered<br />
using one of the graphs.<br />
Exchange questions with a classmate. Answer your classmate’s question.<br />
3. In Chapter 2, you investigated the dimensions and<br />
perimeter of a rectangle when its area was given.<br />
Here are some data for a rectangle with area 36 cm 2 .<br />
A = 36 cm 2<br />
Width (cm)<br />
Length (cm)<br />
1 36<br />
2 18<br />
3 12<br />
4 9<br />
6 6<br />
a) Is the relationship between length and width non-linear?<br />
Justify your answer.<br />
b) Graph the data.<br />
Does the graph illustrate your answer to part a? Explain.<br />
c) Use the graph.<br />
i) Determine the length when the width is 5 cm.<br />
ii) Determine the width when the length is 8 cm.<br />
d) Write a rule for the relationship.<br />
5.5 Graphing Non-Linear Relations 177
We can create a table of values from a description of a relationship.<br />
Example<br />
A typical North American adult consumes<br />
about 200 mg of caffeine a day.<br />
Caffeine has a half-life of about 6 h.<br />
This means that about 6 h after consumption,<br />
half the caffeine remains in a person’s body.<br />
a) Copy and complete the table below<br />
to show how much caffeine is left in<br />
a person’s body over time.<br />
b) What trends do you see in the data?<br />
What do you think the graph<br />
will look like?<br />
c) Graph the data. Describe the graph.<br />
How does the graph compare to<br />
your prediction in part b?<br />
d) About how much caffeine will<br />
remain after 9 h? After 36 h?<br />
What assumption did you make?<br />
Caffeine occurs<br />
naturally in coffee<br />
beans, cocoa beans,<br />
kola nuts, and tea<br />
leaves. It is also<br />
found in products,<br />
such as coffee, tea,<br />
some energy drinks<br />
and soft drinks.<br />
Time Mass of<br />
(h) caffeine (mg)<br />
0 200<br />
6<br />
12<br />
18<br />
24<br />
Solution<br />
a) Every 6 h, the mass of caffeine is<br />
halved. The times in the table<br />
increase by 6 h each time.<br />
So, divide the mass by 2 to get the<br />
new mass each time.<br />
b) The mass of caffeine is decreasing.<br />
The amount by which the mass<br />
changes is also decreasing.<br />
So, the graph will be a curve.<br />
c) Draw the curve of best fit<br />
through the points.<br />
200<br />
The graph is a curve<br />
that goes down to<br />
the right.<br />
100<br />
d) From the graph, the mass<br />
of caffeine remaining<br />
0<br />
after 9 h is about 70 mg.<br />
By extending the graph,<br />
the mass of caffeine after<br />
36 h is about 5 mg.<br />
Mass of caffeine (mg)<br />
Time Mass of<br />
(h) caffeine (mg)<br />
0 200<br />
6 100<br />
12 50<br />
18 25<br />
24 12.5<br />
Half-life of Caffeine<br />
10 20 30 40<br />
Time (h)<br />
178 CHAPTER 5: Graphing Relations
We can also determine this mass by extending the table.<br />
After 30 h, the mass is 6.25 g.<br />
After 36 h, the mass is 3.125 g.<br />
We get an exact answer using the table.<br />
We assume that the person is not consuming any<br />
more caffeine during this time.<br />
4. Use 1-cm grid paper.<br />
a) Draw squares with side lengths from 1 cm to 6 cm.<br />
b) Calculate the area of each square.<br />
Copy and complete this table.<br />
c) Graph the data.<br />
Describe any trends in the graph.<br />
d) Estimate the area of a square with side length 4.5 cm.<br />
e) Estimate the area of a square with side length 7.5 cm.<br />
f) How could you check your answers to parts d and e?<br />
Side length Area<br />
(cm) (cm 2 )<br />
0<br />
1<br />
5. Assessment Focus The first 3 solids in a pattern are shown.<br />
edge length<br />
a) Describe the pattern in the cubes.<br />
b) Sketch the next 2 solids in the pattern.<br />
Copy and complete this table.<br />
c) Describe any trends in the data.<br />
d) Suppose you know the edge length of a solid in this pattern.<br />
Edge<br />
length<br />
i) How can you determine the number of cubes needed to build it?<br />
ii) How is this number related to the volume of the solid?<br />
e) Add rows to your table for the next 2 solids in the pattern.<br />
f) Graph the data.<br />
g) How is the volume of a solid related to its edge length?<br />
Write a rule.<br />
h) What is the edge length of the solid with 512 cubes?<br />
i) How many cubes would be needed for the 10th solid?<br />
j) How many different ways could you answer parts h and i?<br />
1<br />
2<br />
Number<br />
of cubes<br />
5.5 Graphing Non-Linear Relations 179
6. A new car is purchased for $23 000.<br />
Its value depreciates by 15% each year.<br />
The estimated value of the car over time is shown.<br />
a) Predict the shape of the graph. Justify your prediction.<br />
b) Graph the data.<br />
c) Describe the graph.<br />
How does the graph compare to your prediction in part a?<br />
d) Estimate when the value of the car will be about $7500.<br />
How did you do this?<br />
Year Value of car ($)<br />
0 23 000<br />
1 19 550<br />
2 16 618<br />
3 14 125<br />
4 12 006<br />
5 10 205<br />
7. In Investigate, page 175, you explored the effect of changing the<br />
length of a pendulum.<br />
a) Do you think the time it takes for a pendulum to complete 6 swings<br />
is related to the mass of the object used?<br />
If your answer is yes, describe how they might be related.<br />
b) Design an experiment you could conduct to test your prediction.<br />
Carry out your experiment. Was your prediction correct?<br />
If you cannot complete the experiment, research to check your prediction.<br />
8. Choose 2 measurements that you think are related.<br />
a) Pose a question about the measurements.<br />
b) Collect data to answer the question. Record the data in a table.<br />
c) Graph the data. Describe any trends in the data.<br />
d) Answer the question you posed.<br />
Use Fathom or a<br />
graphing calculator,<br />
if available.<br />
9. Your teacher will give you a table that shows the mass of caffeine<br />
in some foods and drinks.<br />
a) Estimate your total caffeine intake for a typical day.<br />
b) Create a table and graph like those in the Guided Example, pages 178-179.<br />
Show the caffeine that remains in your body over time.<br />
Use your answer from part a as the initial value.<br />
c) Repeat parts a and b using data for a friend or family member.<br />
10. Take It Further Recall that the formula for the volume of a cone is V <br />
3<br />
r 2 h.<br />
Suppose the height of the cone stays the same, but its radius changes.<br />
Predict if the relationship between the radius and volume is linear or non-linear.<br />
Investigate your prediction. Write what you find out.<br />
1<br />
How can you tell from data that they represent a non-linear relation?<br />
How can you tell from a graph? Include examples in your explanation.<br />
180 CHAPTER 5: Graphing Relations
5.6 Interpreting Graphs<br />
Graphs are often used to display<br />
information in the media.<br />
These graphs are sometimes misleading<br />
or can be misinterpreted.<br />
Knowing how to interpret graphs is<br />
an important media literacy skill.<br />
Industrial Growth in April<br />
Agriculture and forestry<br />
Mines and petroleum<br />
Utilities<br />
Manufacturing<br />
Construction<br />
Wholesale<br />
Retail<br />
Financial sector<br />
Public sector<br />
Others<br />
-0.1 -0.05 0.00 0.05 0.1<br />
Percentage<br />
Investigate<br />
Representing Motion on a Graphing Calculator<br />
Work in a group of 3.<br />
Your teacher will give you instructions for using the CBR.<br />
You will need: a TI-83 Plus or TI-84 graphing calculator, a CBR<br />
motion detector, and a calculator link cable.<br />
You will use the CBR motion detector to investigate changes in your<br />
distance from a wall as you move toward and away from the wall.<br />
Connect your graphing calculator to the CBR using a link cable.<br />
➢ Stand about 3 m away from a wall. Point the CBR at the wall.<br />
When the CBR starts clicking, walk toward the wall,<br />
stop for a few seconds, then walk away from the wall.<br />
Have another group member record a description of your walk.<br />
Sketch the graph displayed on the calculator.<br />
What does the vertical axis represent?<br />
What does the horizontal axis represent?<br />
➢ Repeat the activity.<br />
This time, stand close to the wall, walk away from the wall<br />
slowly, then quickly. Describe how the graph changes.<br />
Reflect<br />
Exchange both sketches of your graphs with those of another group.<br />
➢ Describe the motion represented by each graph.<br />
➢ Discuss the descriptions the group has written.<br />
Were the descriptions accurate? Explain.<br />
➢ What do the shapes of the graphs tell you about the motion?<br />
5.6 Interpreting Graphs 181
Height<br />
Connect the Ideas<br />
The graph shows the height of water in a bathtub over time.<br />
Key points where the graph changes are labelled.<br />
D<br />
E<br />
Height of water<br />
B<br />
C<br />
F<br />
G<br />
A<br />
Time<br />
If we think about the possible reasons for the changes at the key<br />
points, we can describe what the graph represents.<br />
At point A, the tub is empty.<br />
A person puts in the plug and turns on the water.<br />
From A to B, the tub fills with water.<br />
At point B, the person turns off the water.<br />
At point C, the person gets into the tub, causing the water level<br />
to rise suddenly.<br />
The person sits in the tub from point D to point E.<br />
At point E, he pulls out the plug and the water begins to drain.<br />
At point F, the person gets out of the tub, causing the water level<br />
to drop suddenly.<br />
From point G to point H, the water continues to drain from the tub.<br />
At point H, the tub is empty.<br />
H<br />
Practice<br />
1. Which graph best represents each situation? Explain your choices.<br />
a) The height of a baseball thrown up into the air measured over several seconds<br />
b) The height of a child measured over several years<br />
c) The height of a lit candle measured over several hours<br />
Graph A<br />
Graph B<br />
Graph C<br />
Height<br />
Height<br />
Time<br />
Time<br />
Time<br />
182 CHAPTER 5: Graphing Relations
2. Julie and Osa were experimenting with a CBR and made these graphs.<br />
Describe their motions.<br />
a) b) c)<br />
When a graph includes numerical data, we can describe what it shows in more detail.<br />
Example<br />
The graph shows Jorge’s distance from home as he walks to school.<br />
Describe his walk.<br />
800<br />
Jorge’s Walk to School<br />
Distance from home (m)<br />
700<br />
600<br />
500<br />
400<br />
300<br />
200<br />
100<br />
0<br />
A<br />
B<br />
C<br />
D<br />
E<br />
5 10 15<br />
Time (min)<br />
Solution<br />
From A to B, Jorge walks away from home.<br />
The graph goes up to the right.<br />
Jorge is walking for 3 min. He walks 300 m.<br />
From B to C, Jorge is still walking away from home.<br />
The segment from B to C is less steep than that from A to B.<br />
So, Jorge’s average speed has decreased and he is walking slower.<br />
He walks for 4 min and travels 200 m.<br />
From C to D, the segment is horizontal.<br />
This means that time is passing, but Jorge’s distance<br />
from home stays the same. Jorge is standing still for 2 min.<br />
From D to E, Jorge continues his walk to school at<br />
about the same average speed as from B to C.<br />
He walks for 4 min and travels 200 m.<br />
It takes Jorge 13 min to walk 700 m to school.<br />
5.6 Interpreting Graphs 183
3. The graph shows Olivia’s distance from home as she walks to the store and back.<br />
Describe her walk.<br />
Distance from home (m)<br />
600<br />
500<br />
400<br />
300<br />
200<br />
100<br />
0<br />
A<br />
Olivia’s Walk to the Store<br />
B C<br />
D E<br />
F<br />
10 20 30<br />
Time (min)<br />
4. Assessment Focus The graph shows how the volume of<br />
water in a town reservoir changes during a typical day.<br />
Describe how the volume of water changes during the day.<br />
Suggest reasons for the changes.<br />
Volume of water (L)<br />
1 200 000<br />
1 000 000<br />
800 000<br />
600 000<br />
400 000<br />
200 000<br />
0<br />
5:00<br />
a.m.<br />
Water in Reservoir<br />
10:00 3:00<br />
a.m. p.m.<br />
Time of day<br />
8:00<br />
p.m.<br />
5. Take It Further Aaya measured the temperature<br />
of a container of ice water as it was heated.<br />
She drew this graph.<br />
Describe how the temperature changes over time.<br />
Suggest reasons for the changes.<br />
Temperature (C)<br />
100<br />
50<br />
Heating of Ice Water<br />
0<br />
10 20 30<br />
Time (min)<br />
How do the graph title and the axes labels help you interpret<br />
data on a graph? Include an example in your explanation.<br />
184 CHAPTER 5: Graphing Relations
Chapter Review<br />
What Do I Need to Know?<br />
Line of Best Fit<br />
Curve of Best Fit<br />
Age and Diameter of<br />
Northern White Cedar<br />
Age (years)<br />
80<br />
60<br />
40<br />
20<br />
0 10 20 30<br />
Diameter (cm)<br />
Time (s)<br />
Women’s 100-m Track<br />
World Records<br />
11.2<br />
11<br />
10.8<br />
10.6<br />
10.4<br />
1960 1970 1980<br />
Year<br />
Population<br />
500<br />
400<br />
300<br />
200<br />
100<br />
Muskox Population on<br />
Nunivak Island, Alaska<br />
0<br />
1950 1955 1960<br />
Year<br />
Height of a Cricket Ball<br />
Height (m)<br />
20<br />
10<br />
0 2 4<br />
Time (s)<br />
➢ A linear relation has a graph that is a straight line.<br />
For example, the perimeter of a rectangle with width 3 cm:<br />
Length (cm) Perimeter (cm)<br />
4 14<br />
5 16<br />
6 18<br />
7 20<br />
Perimeter of a Rectangle<br />
with Width 3 cm<br />
Perimeter (cm)<br />
20<br />
10<br />
0 4 8<br />
Length (cm)<br />
Use a Frayer model to<br />
help you understand<br />
some of the key<br />
words on this page.<br />
➢ A relation that does not have a straight line graph is non-linear.<br />
For example, the half-life of caffeine in the human body:<br />
Time (h) Mass of<br />
caffeine (mg)<br />
0 300<br />
6 150<br />
12 75<br />
18 37.5<br />
24 18.75<br />
30 9.375<br />
Mass of caffeine (mg)<br />
Half-life of Caffeine in Human Body<br />
300<br />
200<br />
100<br />
0 10 20 30<br />
Time (h)<br />
Chapter Review 185
5.1<br />
5.2<br />
5.3<br />
What Should I Be Able to Do?<br />
1. a) What does this scatter plot show?<br />
Price ($)<br />
Prices of a Certain Model of Used Car<br />
20 000<br />
15 000<br />
10 000<br />
5 000<br />
0 5 10 15<br />
Age (years)<br />
b) How old is the car that costs<br />
$16 500?<br />
c) Data are included for two<br />
6-year-old cars.<br />
What are their prices?<br />
Why do you think the prices<br />
are different?<br />
d) Describe any trends in the data.<br />
Explain your thinking.<br />
2. Joseph and Malik measured the<br />
growth of a seedling.<br />
Time (days) 1 3 5 7 9<br />
Height (mm) 4 12 22 36 45<br />
a) Graph the data.<br />
Describe any trends.<br />
b) Draw a line or curve of best fit.<br />
Explain how you decided which<br />
to draw.<br />
c) i) How tall do you think the<br />
seedling was after 4 days?<br />
ii) How tall might it be after<br />
10 days?<br />
How do you know?<br />
d) About how many days might it<br />
take for the seedling to reach<br />
a height of 60 mm?<br />
e) Can you predict how tall the<br />
seedling might be after 1 year?<br />
Explain.<br />
3. The Canadian Recording Industry<br />
Association keeps track of sales of<br />
recorded music in Canada.<br />
Data for 1996 to 2003 are shown in<br />
the graph.<br />
Sales ($millions)<br />
Retail Sales of Recordings in Canada<br />
1400<br />
1200<br />
1000<br />
800<br />
0<br />
1996<br />
1998 2000 2002<br />
Year<br />
a) Describe any trends in the data.<br />
b) Your teacher will give you a copy<br />
of the graph. Draw a curve of<br />
best fit.<br />
c) From the graph, about how much<br />
did Canadians spend on recorded<br />
music in 1998? In 2003?<br />
d) Predict about how much<br />
Canadians spent on recorded<br />
music in 2004.<br />
What assumptions are<br />
you making?<br />
186 CHAPTER 5: Graphing Relations
5.2<br />
5.3<br />
4. A mug of hot chocolate was left on a<br />
counter to cool. Its temperature was<br />
measured every 2 min.<br />
The results are shown in the table.<br />
d) Graph the data. Was your<br />
prediction in part c correct?<br />
e) Write a rule for the number of<br />
squares in any frame.<br />
f) How many squares will there be<br />
in the 8th frame?<br />
How do you know?<br />
g) Which frame will have 28 squares?<br />
How do you know?<br />
5.4<br />
Time (min) 0 2 4 6 8 10 12 14 16<br />
Temp (°C) 90 86 81 78 74 72 70 68 66<br />
a) Graph the data.<br />
Describe any trends.<br />
b) Draw a line or curve of best fit.<br />
Explain how you decided which<br />
to draw.<br />
c) A separate mug of hot chocolate<br />
was poured at the same time.<br />
After 1 min some cold milk<br />
was added.<br />
How will the graph for this<br />
situation differ from the graph<br />
you drew in part a?<br />
Sketch the new graph.<br />
5. The first 3 frames in a pattern<br />
are shown.<br />
5.5<br />
5.6<br />
6. Matthew and Tamara are conducting<br />
an experiment.<br />
They vary the resistance of a resistor<br />
and measure the current through it.<br />
Their results are shown in the table.<br />
Resistance (ohms) 10 20 30 40 50 60<br />
Current (A) 12 6 4 3 2.4 2<br />
a) Describe the trend.<br />
b) Graph the data.<br />
c) What will the current be when<br />
the resistance is 15 ohms?<br />
d) What will the resistance be when<br />
the current is 10 A?<br />
7. The graph shows Hasieba’s distance<br />
from home during a walk to<br />
the park.<br />
Describe her walk.<br />
Hasieba’s Distance from Home<br />
Frame 1 Frame 2 Frame 3<br />
600<br />
E<br />
F<br />
a) Draw the next 3 frames in<br />
the pattern.<br />
b) For each of the 6 frames, record<br />
the frame number and the<br />
number of squares in a table.<br />
c) Describe the trend.<br />
Do you think the graph will be<br />
linear or non-linear?<br />
Distance (m)<br />
500<br />
400<br />
300<br />
200<br />
100<br />
0<br />
A<br />
B<br />
C<br />
D<br />
10 20<br />
Time (min)<br />
G<br />
30<br />
Chapter Review 187
Practice Test<br />
Multiple Choice: Use the graph. Choose the<br />
correct answer for questions 1 and 2.<br />
Temperature in Thunder Bay, June 24, 2005<br />
1. When was the temperature greatest?<br />
A. 5 p.m. B. 2 p.m.<br />
C. 4 p.m. D. 11 a.m.<br />
2. Which is the best estimate for the<br />
temperature at 7 a.m?<br />
A. 18°C B. 20°C<br />
C. 22°C D. 25°C<br />
Temperature (C)<br />
25<br />
20<br />
15<br />
0<br />
12:00<br />
midnight<br />
4:00<br />
a.m.<br />
8:00 12:00<br />
a.m. noon<br />
Time of Day<br />
4:00<br />
p.m.<br />
8:00<br />
p.m.<br />
Show your work for questions 3 to 6.<br />
3. Application Water exerts pressure on a scuba diver.<br />
The pressure is measured in units called kilopascals (kPa).<br />
The table shows the approximate pressure at different<br />
depths of sea water.<br />
a) Graph the data. Draw a curve or line of best fit as<br />
appropriate. Explain your choice.<br />
b) At what depth is the pressure 225 kPa? 400 kPa?<br />
c) What is the pressure at the surface of the water?<br />
d) Describe the relationship between depth and pressure.<br />
Depth (m) Pressure (kPa)<br />
5 150<br />
10 200<br />
15 250<br />
20 300<br />
25 350<br />
4. Knowledge and Understanding A ball is<br />
dropped. The height it reaches after each<br />
bounce is measured.<br />
Bounces<br />
Height (m)<br />
1<br />
2.1<br />
2<br />
1.5<br />
3<br />
1<br />
4<br />
0.7<br />
5<br />
0.4<br />
6<br />
0.3<br />
The data are shown in the table.<br />
a) Describe the trend in the data.<br />
Which tools could<br />
you use to help you?<br />
b) Graph the data. Draw a curve or line of best fit as appropriate.<br />
Explain your choice.<br />
c) From what height do you think the ball was dropped? Explain your answer.<br />
d) What else could you find out from the graph?<br />
5. Thinking William and Rhiannon run 200 m.<br />
Describe each person’s run.<br />
Who finishes first? Justify your answer.<br />
6. Communication When you look at a graph,<br />
how can you tell if it represents a linear<br />
relation, a non-linear relation, or neither?<br />
Include diagrams in your answer.<br />
Distance run (m)<br />
200<br />
150<br />
100<br />
50<br />
0<br />
William<br />
Rhiannon<br />
200-m Run<br />
10 20<br />
Time (s)<br />
30 40<br />
188 CHAPTER 5: Graphing Relations
What<br />
You’ll Learn<br />
How linear relations<br />
connect to earlier work in<br />
this text on proportional<br />
reasoning, and geometry and<br />
measurement concepts<br />
Project<br />
Link<br />
And Why<br />
• Heart Rates, Breathing<br />
Rates, and Exercise<br />
Real-life situations can be<br />
represented as linear<br />
relations in different ways.<br />
This helps to show how math<br />
relates to life outside school.<br />
Key Words<br />
• first differences<br />
• rise<br />
• run<br />
• rate of change<br />
• direct variation<br />
• partial variation<br />
• vertical intercept
Making a Mind Map<br />
Organizing information can help you learn and remember<br />
the important ideas.<br />
A mind map is one way to do this.<br />
Here is a student’s mind map on fractions.<br />
To make your own mind map:<br />
➢ In the centre of a piece of paper, write the chapter title:<br />
Linear Relations<br />
➢ As you work through this chapter, list all the important ideas.<br />
Make sure to include:<br />
• section titles, such as Direct variation and Partial variation<br />
• new words<br />
• key ideas<br />
➢ At the end of each section, compare your list with a classmate’s<br />
list. Arrange your ideas on your map.<br />
Look for connections among the ideas.<br />
Organize your map to highlight these relationships.<br />
➢ At the end of the chapter, make a final copy of your map.<br />
Use colour and diagrams to highlight and explain important<br />
concepts. Use arrows to link ideas.<br />
➢ Compare your map with those of your classmates.<br />
Talk with a classmate.<br />
• How could you have organized the information differently?<br />
• What was effective about each map?<br />
• How could you improve your mind map?<br />
190 CHAPTER 6: Linear Relations
6.1 Recognizing Linear Relations<br />
Investigate<br />
Using a Table of Values to Explore a Relationship<br />
Work in a group of 4.<br />
➢ You will need linking cubes.<br />
Place a cube on the desk.<br />
Five faces of the cube are visible.<br />
Join 2 cubes. Place them on the desk.<br />
Eight faces of the cubes are visible.<br />
Record the data in a table.<br />
Continue the table to show data for<br />
up to 10 cubes in a line.<br />
Number<br />
of cubes<br />
Number of<br />
faces visible<br />
What patterns do you see in the table?<br />
Graph the data. How are the patterns shown in the graph?<br />
Is the relationship linear or non-linear? How do you know?<br />
➢ Consider this pattern of cubes.<br />
Frame 1 Frame 2 Frame 3 Frame 4<br />
Use linking cubes to build these frames.<br />
How many cubes are in each frame?<br />
Record your data in a table.<br />
Continue the table to show data for<br />
6 frames.<br />
Frame<br />
number<br />
Number<br />
of cubes<br />
What patterns do you see in the table?<br />
Graph the data. How are the patterns shown in the graph?<br />
Is the relationship linear or non-linear? How do you know?<br />
Reflect<br />
Suppose you have a table of values.<br />
How can you tell if the relationship it represents is linear or<br />
non-linear without drawing a graph?<br />
6.1 Recognizing Linear Relations 191
Connect the Ideas<br />
Look at a pattern<br />
Here is a pattern of squares. The pattern continues.<br />
Use square tiles, grid<br />
paper, or square dot<br />
paper to help you<br />
picture the pattern.<br />
Record the data<br />
Notice that the frame<br />
numbers increase by<br />
1 each time.<br />
Frame 1 Frame 2 Frame 3 Frame 4<br />
Here are tables for the perimeter and area of each frame.<br />
Frame<br />
number<br />
Perimeter<br />
(units)<br />
1 4<br />
2 8<br />
3 12<br />
4 16<br />
5 20<br />
6 24<br />
Frame Area<br />
number (square units)<br />
1 1<br />
2 3<br />
3 6<br />
4 10<br />
5 15<br />
6 21<br />
Graph the data<br />
Here are the graphs of the data.<br />
Perimeter against Frame Number<br />
Perimeter (units)<br />
24<br />
20<br />
16<br />
12<br />
8<br />
4<br />
0 1 2 3 4 5 6<br />
Frame number<br />
Area (square units)<br />
Area against Frame Number<br />
20<br />
16<br />
12<br />
8<br />
4<br />
0 1 2 3 4 5 6<br />
Frame number<br />
Analyse the data<br />
The graph of Perimeter against<br />
Frame number shows a<br />
linear relation.<br />
The points lie on a straight line.<br />
We join the points with<br />
a broken line to show<br />
the trend.<br />
The graph of Area against<br />
Frame number shows<br />
a non-linear relation.<br />
The points lie along a curve.<br />
We join the points with<br />
a broken curve to show<br />
the trend.<br />
The broken line and broken curve indicate that only plotted points<br />
are data points.<br />
192 CHAPTER 6: Linear Relations
First<br />
differences for<br />
a linear relation<br />
Add a third column to the Perimeter table.<br />
Record the changes in perimeter.<br />
Frame<br />
number<br />
Perimeter<br />
(units)<br />
1 4<br />
2 8<br />
3 12<br />
4 16<br />
5 20<br />
6 24<br />
Change in<br />
perimeter (units)<br />
8 4 4<br />
12 8 4<br />
16 12 4<br />
20 16 4<br />
24 20 4<br />
The numbers in the third column are called first differences.<br />
The first differences for a linear relation are equal.<br />
For every increase of 1 in the frame number,<br />
the perimeter increases by 4 units.<br />
All linear relations have first differences that are constant.<br />
We can use this to identify a linear relation from its table of values.<br />
First<br />
differences for<br />
a non-linear<br />
relation<br />
Add a third column to the Area table.<br />
Record the changes in area.<br />
Frame<br />
number<br />
Area<br />
(square units)<br />
1 1<br />
2 3<br />
3 6<br />
4 10<br />
5 15<br />
6 21<br />
Change in area<br />
(square units)<br />
3 1 2<br />
6 3 3<br />
10 6 4<br />
15 10 5<br />
21 15 6<br />
For a non-linear relation, the first differences are not equal.<br />
For every increase of 1 in the frame number,<br />
the area increases by a different amount each time.<br />
6.1 Recognizing Linear Relations 193
Practice<br />
1. For each table below, determine the first differences.<br />
State whether the data represent a linear or non-linear relation.<br />
Explain how you know.<br />
a)<br />
Time Cost<br />
b)<br />
Age Mass<br />
c)<br />
rented (h) ($)<br />
(months) (kg)<br />
0 0<br />
1 6<br />
2 12<br />
3 18<br />
4 24<br />
0 3.0<br />
1 4.0<br />
2 4.8<br />
3 5.5<br />
4 6.2<br />
Time Distance<br />
(s) (m)<br />
0 15<br />
1 20<br />
2 25<br />
3 30<br />
4 35<br />
2. Suggest a possible situation that each table in question 1 could represent.<br />
3. This pattern was constructed using square tiles:<br />
Frame 1 Frame 2 Frame 3<br />
a) Copy and complete this table.<br />
Record data for the first 6 frames.<br />
b) Determine the first differences.<br />
Is the relationship between frame number and area linear?<br />
Explain.<br />
c) Graph Area against Frame number.<br />
Does the graph support your answer to part b? Explain.<br />
4. This pattern was constructed using square tiles:<br />
Frame<br />
number<br />
Area<br />
(square units)<br />
Frame 1 Frame 2 Frame 3<br />
a) Copy and complete this table.<br />
Record data for the first 6 frames.<br />
b) Determine the first differences.<br />
Is the relationship between frame number and number<br />
of tiles linear? Explain.<br />
c) Graph Number of tiles against Frame number.<br />
Does the graph support your answer to part b? Explain.<br />
d) How many tiles will be in the 9th frame?<br />
How did you find out?<br />
Frame<br />
number<br />
Number<br />
of tiles<br />
194 CHAPTER 6: Linear Relations
First differences can be negative.<br />
Example<br />
This table shows the money in a<br />
Number Account<br />
bank account when it was opened,<br />
of weeks balance ($)<br />
and at the end of each following week.<br />
a) Determine the first differences.<br />
What do the first differences represent?<br />
0<br />
1<br />
2<br />
200<br />
175<br />
150<br />
b) Is this a linear or non-linear relation?<br />
3 125<br />
4 100<br />
Explain.<br />
c) Graph this relationship.<br />
Describe how the patterns in the table<br />
are shown in the graph.<br />
d) How much money is in the account after 6 weeks?<br />
Solution<br />
a)<br />
Number Account<br />
of weeks balance ($)<br />
First differences<br />
0 200<br />
1 175<br />
2 150<br />
3 125<br />
4 100<br />
175 200 25<br />
150 175 25<br />
125 150 25<br />
100 125 25<br />
The first differences represent the change in the account balance<br />
each week. Since the first differences are negative,<br />
money is being withdrawn from the account.<br />
b) The first differences are equal. The relationship is linear.<br />
c)<br />
Money in a Bank Account<br />
200<br />
Account balance ($)<br />
150<br />
100<br />
50<br />
0<br />
2 4 6 8<br />
Number of weeks<br />
The points lie on a straight line that goes down to the right.<br />
For every unit you move to the right, you move 25 units down.<br />
d) From the graph in part c, there are $50 in the account after 6 weeks.<br />
6.1 Recognizing Linear Relations 195
5. A barrel contained 42 L of water. The water was leaking out.<br />
The table shows how the volume of water in the barrel<br />
changed every hour.<br />
a) Determine the first differences.<br />
What do the first differences represent?<br />
b) Is the relationship linear or non-linear? Explain.<br />
c) Graph the relation. Does the graph support your answer to<br />
part b? Explain.<br />
d) How much water would be in the barrel after 6 h?<br />
What assumptions did you make?<br />
Time (h)<br />
0<br />
1<br />
2<br />
3<br />
4<br />
Volume (L)<br />
42<br />
38<br />
34<br />
30<br />
26<br />
e) Write a question you could answer using the data. Answer the question.<br />
6. Assessment Focus The table shows the areas of rectangles<br />
for which the length is 3 times the width.<br />
a) Sketch the rectangles.<br />
b) Determine the first differences.<br />
c) Is the relationship linear or non-linear? Explain.<br />
d) Graph the relationship. Describe the graph.<br />
e) Predict the area of the next rectangle in the pattern.<br />
Sketch the rectangle. Calculate its area to check your prediction.<br />
7. Laura is swimming lengths to prepare for a triathlon.<br />
The table shows the distances she swims in metres.<br />
a) By how much are the numbers in the first column<br />
increasing?<br />
b) Determine the first differences.<br />
What do the first differences represent?<br />
c) Is the relationship linear or non-linear? Explain.<br />
d) Graph the relationship. Does the graph support your answer to part c? Explain.<br />
e) What is the length of the pool? How did you find out?<br />
8. Take It Further Make your own pattern using square tiles, grid paper,<br />
or square dot paper. Choose 2 properties of the figures in your pattern;<br />
such as frame number, height, side length, perimeter, area,<br />
or number of squares. Investigate whether the number pattern<br />
that relates the properties is linear or non-linear. Show your work.<br />
Width (cm) Area (cm 2 )<br />
1 3<br />
2 12<br />
3 27<br />
4 48<br />
Number of Distance<br />
lengths (m)<br />
0 0<br />
5 125<br />
10 250<br />
15 375<br />
20 500<br />
Describe two ways to identify whether a relationship is linear or non-linear.<br />
Give an example of each way.<br />
196 CHAPTER 6: Linear Relations
6.2 Average Speed as Rate of Change<br />
Investigate<br />
Comparing Average Speeds on a Graph<br />
Work in a group of 4.<br />
You will need a stopwatch or a watch with a second hand<br />
and grid paper.<br />
Take turns to read this tongue twister aloud 5 times.<br />
A tongue twister is<br />
a phrase or sentence<br />
that is hard to say<br />
fast because the<br />
words include similar<br />
sounds.<br />
“A big bug bit the little beetle but the little beetle bit<br />
the big bug back.”<br />
Try to say it as quickly as possible without stumbling.<br />
Record the time in seconds it takes.<br />
The tongue twister contains 16 words.<br />
So, when you read it 5 times, you are reading 5 16, or 80 words.<br />
Copy and complete this table:<br />
Reader’s Time (s) Number of<br />
name<br />
words read<br />
80<br />
80<br />
80<br />
80<br />
Number of words read<br />
Time (s)<br />
Plot Number of words read against Time for each reader.<br />
Use a ruler to draw a line from (0, 0) to each plotted point.<br />
Label each line with the reader’s name.<br />
Who read the fastest? How do you know?<br />
Order the readers from the fastest to the slowest.<br />
Order the lines on the graph from steepest to least steep.<br />
Compare the order with that of the readers. What do you notice?<br />
Reflect<br />
How do you think your average reading speed for a tongue<br />
twister compares with that for regular text?<br />
How could you check your prediction?<br />
6.2 Average Speed as Rate of Change 197
Connect the Ideas<br />
This graph shows how the distance changes over time<br />
during a trip.<br />
Distance Travelled by a Car<br />
300<br />
This is called a<br />
distance–time graph.<br />
Distance (km)<br />
225<br />
150<br />
75<br />
run<br />
rise<br />
0 1 2 3 4<br />
Time (h)<br />
The graph is linear.<br />
Recall that: Average speed <br />
Choose any two points on the line, such as (1, 75) and (3, 225).<br />
The distance travelled is the vertical distance between the points<br />
on the graph, or the rise.<br />
The rise is: 225 km 75 km 150 km<br />
The time taken is the horizontal distance between the points,<br />
or the run.<br />
The run is: 3 h 1 h 2 h<br />
Average speed <br />
rise<br />
<br />
run<br />
150 km<br />
<br />
2 h<br />
75 km/h<br />
The average speed is 75 km/h.<br />
rise<br />
Distance travelled<br />
Time taken<br />
Distance travelled<br />
Time taken<br />
run<br />
is called the rate of change.<br />
It is a measure of the steepness of the line.<br />
The rate of change tells you how many units to move up or down<br />
for every unit you move to the right on the graph.<br />
The rate of change of distance over time is the average speed.<br />
198 CHAPTER 6: Linear Relations
Practice<br />
1. Determine each rate of change.<br />
a) Journey for a Car<br />
b)<br />
Journey for a Cyclist<br />
Distance (km)<br />
400<br />
300<br />
200<br />
100<br />
(1, 80)<br />
(5, 400)<br />
(4, 320)<br />
(3, 240)<br />
(2, 160)<br />
Distance (km)<br />
60<br />
45<br />
30<br />
15<br />
(1, 15)<br />
(2, 30)<br />
(3, 45)<br />
(4, 60)<br />
0 1 2 3 4 5<br />
Time (h)<br />
0<br />
1 2 3 4 5<br />
Time (h)<br />
2. What does each rate of change in question 1 represent?<br />
3. In Connect the Ideas, page 198, the rate of change was calculated<br />
using 2 points on the line. Choose 2 different points on the line.<br />
Confirm that the rate of change is the same for these points.<br />
An average speed can be expressed in different units.<br />
Example<br />
Nathalie leaves downtown Ottawa to meet a friend at Dow’s Lake,<br />
6 km away. She skates along the Rideau Canal.<br />
It takes Nathalie 5 min to skate 1 km.<br />
a) Assume Nathalie keeps skating at this rate.<br />
Make a table to show her distance from<br />
downtown at 5-min intervals.<br />
Graph the data.<br />
b) Determine the rate of change from the graph.<br />
What does the rate of change represent?<br />
c) How long does it take Nathalie to reach Dow’s Lake?<br />
How did you determine this?<br />
d) What is Nathalie’s average speed in kilometres per hour?<br />
Ottawa’s Rideau<br />
Canal Skateway was<br />
officially designated<br />
the world’s largest<br />
naturally frozen<br />
ice rink.<br />
Solution<br />
a)<br />
Time Distance from<br />
(min) downtown (km)<br />
0 0<br />
5 1<br />
10 2<br />
15 3<br />
20 4<br />
Nathalie’s Skate to Dow’s Lake<br />
Distance from downtown (km)<br />
6<br />
5<br />
4<br />
3<br />
rise<br />
2<br />
1<br />
run<br />
0 5 10 15 20 25 30<br />
Time (min)<br />
6.2 Average Speed as Rate of Change 199
To answer the<br />
questions in parts c<br />
and d, we could have<br />
extended the table.<br />
b) Choose 2 points on the line: (5, 1) and (20, 4)<br />
The rise is: 4 km 1km 3km<br />
The run is: 20 min 5 min 15 min<br />
rise<br />
Rate of change <br />
run<br />
3 km<br />
<br />
15 min<br />
0.2 km/min<br />
The rate of change is 0.2 km/min.<br />
This is Nathalie’s average speed in kilometres per minute.<br />
c) By extending the graph, we can see that it takes Nathalie<br />
30 min to travel the 6 km to Dow’s Lake.<br />
d) Nathalie’s average speed is 0.2 km/min.<br />
There are 60 min in 1 h.<br />
So, the average speed in kilometres per hour is: 60 0.2 12<br />
Nathalie’s average speed is 12 km/h.<br />
4. Matt took 20 min to drive 24 km to attend a concert.<br />
a) Graph distance against time for this journey.<br />
b) What is the rate of change of distance with time?<br />
c) What was Matt’s average speed for his trip? How do you know?<br />
d) What was Matt’s average speed in kilometres per hour?<br />
Need Help?<br />
Read the<br />
Example above.<br />
5. Assessment Focus A group of friends is hiking 15 km around a lake.<br />
It takes the group 30 min to hike the first 2 km.<br />
Assume the group keeps hiking at this rate.<br />
a) Make a table to show the distance from the start at 30-min intervals.<br />
Graph the data.<br />
b) Determine the rate of change. What does it represent?<br />
c) How long will it take for the group to complete the hike?<br />
How did you determine this?<br />
d) What is the average hiking speed in kilometres per hour?<br />
e) Write a question you could answer using the graph. Answer the question.<br />
6. Take It Further Keta and Aaron run in a half-marathon.<br />
Keta can run the 21-km course in 120 min.<br />
Aaron’s average speed is 8.4 km/h.<br />
Who runs faster? How do you know?<br />
How many different ways can you find out?<br />
What is the rate of change? How is it related to the steepness of a line?<br />
Make a Frayer model to explain.<br />
200 CHAPTER 6: Linear Relations
6.3 Other Rates of Change<br />
Before an operation, an animal must be<br />
“put out” so that it does not feel any<br />
pain. Many veterinarians use a drug<br />
called Pentothal.<br />
Investigate<br />
Using Tables and Graphs to Explore Rates of Change<br />
The graph shows the amount of Pentothal required for dogs<br />
of different masses.<br />
Dose of Pentothal (mg)<br />
Pentothal Doses for Dogs<br />
60<br />
50<br />
40<br />
30<br />
(2, 31)<br />
20 (1, 23)<br />
10<br />
0 1 2 3 4 5 6<br />
Mass (kg)<br />
Mass<br />
(kg)<br />
0<br />
1<br />
2<br />
Dose of<br />
Pentothal (mg)<br />
Record the data from the graph in a table.<br />
Include masses up to 6 kg.<br />
Add a third column to the table to show the first differences<br />
in the drug dose.<br />
➢ What do you notice about the first differences? Explain.<br />
➢ Select 2 points on the graph. Determine the rate of change.<br />
What does this rate of change represent?<br />
➢ Compare the first differences and the rate of change.<br />
What do you notice?<br />
Reflect<br />
➢ Is this a linear relation? How do you know?<br />
➢ Explain how you could determine the drug dose for any mass.<br />
What assumptions did you make?<br />
6.3 Other Rates of Change 201
Connect the Ideas<br />
The graph shows the average fuel efficiency for an<br />
older sport utility vehicle (SUV) and a new Smart car.<br />
Average Fuel Efficiency for Two Vehicles<br />
(15, 360)<br />
Distance driven (km)<br />
300<br />
200<br />
100<br />
(5, 120)<br />
Smart car<br />
(10, 90)<br />
SUV<br />
(20, 180)<br />
0<br />
5 10 15 20<br />
Volume of fuel used (L)<br />
The rate of change can be found for each vehicle.<br />
For the Smart car:<br />
Choose any two points on the line: (5, 120) and (15, 360)<br />
The rise is: 360 km 120 km 240 km<br />
The run is: 15 L 5 L 10 L<br />
rise<br />
Rate of change <br />
run<br />
240 km<br />
<br />
10 L<br />
24 km/L<br />
The Smart car drives 24 km for every litre of fuel it uses.<br />
For the sport utility vehicle:<br />
Choose any two points on the line: (10, 90) and (20, 180)<br />
The rise is: 180 km 90 km 90 km<br />
The run is: 20 L 10 L 10 L<br />
rise<br />
Rate of change <br />
run<br />
90 km<br />
<br />
10 L<br />
9 km/L<br />
The sport utility vehicle drives 9 km for every litre of fuel it uses.<br />
Both rates of change are positive.<br />
The more efficient car has a greater rate of change and a steeper<br />
line on the graph. It travels farther for each litre used.<br />
202 CHAPTER 6: Linear Relations
Practice<br />
1. Determine each rate of change.<br />
a) Gas Consumption for a Car<br />
b)<br />
Distance driven (km)<br />
150<br />
120<br />
90<br />
60<br />
30<br />
Cost ($)<br />
Catering Costs for<br />
Dinner Guests<br />
1000<br />
800<br />
600<br />
400<br />
200<br />
0 5 10<br />
0<br />
Gas used (L)<br />
10 20 30 40<br />
Number of guests<br />
2. What does each rate of change in question 1 represent?<br />
3. Use the data in Connect the Ideas, page 202.<br />
The Smart car’s gas tank holds 33 L of fuel.<br />
The sport utility vehicle’s gas tank holds 80 L.<br />
Determine how far each vehicle could travel on a full tank of gas.<br />
4. Sami conducted an experiment.<br />
He measured the length of a spring when different masses<br />
were placed on one end of it.<br />
Sami then calculated how much the spring stretched<br />
each time.<br />
These are his results:<br />
Mass (g) 0 5 10 15 20 25<br />
Stretch (cm) 0 2 4 6 8 10<br />
a) Graph Stretch against Mass.<br />
b) Does the graph represent a linear relation? Explain.<br />
c) Determine the rate of change of the stretch of the spring with mass.<br />
What does the rate of change represent?<br />
5. Assessment Focus Copy this graph on grid paper.<br />
a) Name two quantities that could be represented by this graph.<br />
b) Label each axis.<br />
Give the graph a title.<br />
c) Determine the rate of change.<br />
Explain what it means.<br />
6.3 Other Rates of Change 203
A rate of change can be negative.<br />
Example<br />
Solution<br />
The graph shows how the height of a small plane changes with time.<br />
a) What is the plane’s initial height?<br />
Height of Small Plane<br />
b) Determine the rate of change.<br />
1800<br />
c) What does the rate of change tell you<br />
1600<br />
about the plane’s flight?<br />
1400<br />
a) The plane’s initial height is 1800 m.<br />
This is the height when the time is 0.<br />
b) Choose any two points on the line:<br />
(0, 1800) and (4, 1200)<br />
The rise is: 1200 m 1800 m 600 m<br />
The run is: 4 min 0 min 4 min<br />
rise<br />
run<br />
<br />
600 m<br />
4 min<br />
1200<br />
1000<br />
150 m/min<br />
The rate of change is 150 m/min.<br />
c) The height is decreasing at an average rate of 150 m per minute.<br />
The plane is descending.<br />
Height (m)<br />
0<br />
1 2 3 4<br />
Time (min)<br />
6. Suppose the plane in the Guided Example continues to descend at the same rate.<br />
How many minutes will it take until the plane lands? Explain your answer.<br />
7. The Jasper Tramway is a cable car in the Canadian Rockies.<br />
The graph shows how the cable car’s height<br />
changes on a 7-min trip.<br />
a) What are the initial and final heights, to the nearest 100 m?<br />
b) Determine the approximate rate of change.<br />
c) What does the rate of change tell you<br />
about the cable car’s trip?<br />
Height (m)<br />
Jasper Tramway Trip<br />
2400<br />
2000<br />
1600<br />
1200<br />
0 1 2 3 4 5 6 7<br />
Time (min)<br />
8. Take It Further The graph shows the costs of a skating party.<br />
a) Determine the rate of change for each portion of the graph.<br />
b) What do the different rates of change tell you about<br />
the costs?<br />
c) Suppose you have a skating party for 8 people.<br />
How much will you pay for each person?<br />
Cost ($)<br />
25<br />
20<br />
15<br />
10<br />
0<br />
Skating Party Costs<br />
2 4 6 8 10 12 14<br />
Number of people<br />
Give an example of a rate of change that is not an average speed.<br />
Describe what the rate of change measures. Include a graph.<br />
204 CHAPTER 6: Linear Relations
6.4 Direct Variation<br />
Local councils send out leaflets with their water bills.<br />
These leaflets describe how water is wasted.<br />
Investigate<br />
Interpreting a Graph that Passes Through the Origin<br />
A faucet leaks. The volume of water wasted and the times when<br />
the volume was measured are shown.<br />
➢ What patterns do you see in the table?<br />
➢ Graph the data. Plot Volume of water wasted against Time.<br />
Describe the graph.<br />
Time Volume of water<br />
➢ Choose two points on the graph. (s) wasted (mL)<br />
Determine the rate of change.<br />
➢ Repeat the rate of change<br />
calculation using two different<br />
points on the line.<br />
What do you notice?<br />
Explain what the rate of change<br />
represents.<br />
0 0<br />
10 15<br />
20 30<br />
30 45<br />
40 60<br />
50 75<br />
➢ Determine the first differences.<br />
How are they related to the rate of change?<br />
How are the first differences related to the change in times?<br />
➢ How could you determine the volume of water wasted after<br />
each time: 100 s? 15 s? 1 s? 22 s?<br />
➢ Suppose you know the time since measuring began.<br />
How can you determine the volume of water wasted?<br />
Write a rule to determine this volume.<br />
Reflect<br />
➢ Suppose you know the volume of water wasted in 20 min.<br />
How could you determine the volume wasted in 40 min?<br />
➢ About how much water would be wasted by the leaking<br />
faucet in one day? Explain how you know.<br />
6.4 Direct Variation 205
Connect the Ideas<br />
Rhonda bought sesame snacks at the bulk food store.<br />
The cost was $1.10 per 100 g.<br />
Here is a table of costs for different masses.<br />
When the mass of<br />
sesame snacks<br />
doubles, the cost<br />
doubles.<br />
When the mass of<br />
sesame snacks halves,<br />
the cost halves.<br />
Mass of sesame 200 400 600 800<br />
snacks (g)<br />
Cost ($) 2.20 4.40 6.60 8.80<br />
Graph the data<br />
Recall the work in<br />
Chapter 4 on<br />
proportional<br />
reasoning. The cost<br />
of sesame snacks is<br />
directly proportional<br />
to their mass.<br />
The graph is a straight line that<br />
passes through the origin (0, 0).<br />
This illustrates direct variation.<br />
We say that the cost varies directly<br />
as the mass.<br />
When two quantities vary directly,<br />
they are proportional.<br />
The cost is directly proportional to<br />
the mass.<br />
Cost ($)<br />
Cost of Sesame Snacks<br />
8<br />
6<br />
4<br />
(600, 6.60)<br />
rise<br />
2<br />
run<br />
(200, 2.20)<br />
0 200 400 600 800<br />
Mass (g)<br />
Determine the<br />
rate of change<br />
Write a rule<br />
Choose any two points on the graph: (200, 2.20) and (600, 6.60)<br />
The rise is: $6.60 $2.20 $4.40<br />
The run is: 600 g 200 g 400 g<br />
rise<br />
run<br />
<br />
$4.40<br />
400 g<br />
$0.011/g<br />
The rate of change is $0.011/g.<br />
The rate of change is the unit price of sesame snacks.<br />
Cost of sesame snacks in $ (0.011) (mass of snacks)<br />
the rate of change<br />
in dollars per gram<br />
the mass<br />
in grams<br />
We can use the rule to determine how much Rhonda has to pay for<br />
350 g of sesame snacks.<br />
Substitute 350 for the mass of snacks.<br />
Cost of sesame snacks in $ 0.011 350<br />
3.85<br />
The cost of 350 g of sesame snacks is $3.85.<br />
206 CHAPTER 6: Linear Relations
Practice<br />
1. Does each graph represent direct variation? Explain how you know.<br />
a) Heating of a Chemical<br />
b) Scuba Diver’s Depth<br />
Temperature (°C)<br />
40<br />
30<br />
20<br />
10<br />
Depth (m)<br />
8<br />
6<br />
4<br />
2<br />
0<br />
2 4 6 8<br />
Time (min)<br />
0<br />
10 20 30<br />
Time (s)<br />
c) Reid’s Earnings<br />
d)<br />
Height of a Ball<br />
Pay ($)<br />
40<br />
30<br />
20<br />
10<br />
Height (m)<br />
3<br />
2<br />
1<br />
0<br />
1 2 3 4 5<br />
Time worked (h)<br />
0<br />
0.4 0.8 1.2 1.6<br />
Time (s)<br />
2. The perimeter of a square varies directly as its side length.<br />
Side<br />
a) Complete a table to show the perimeters of squares with length (cm)<br />
side lengths from 0 cm and 5 cm.<br />
b) Graph the data. Determine the rate of change.<br />
c) Write a rule to determine the perimeter when you know the side length.<br />
d) What is the perimeter when the side length is 11 cm?<br />
Perimeter<br />
(cm)<br />
3. About one-third of all water used in homes is for toilet flushes.<br />
The table shows water use for a standard toilet manufactured after 1985.<br />
Number of flushes 5 10 15 20 25 30<br />
Water use (L) 65 130 195 260 325 390<br />
a) Graph the data.<br />
Is this a direct variation situation? Explain.<br />
b) Determine the rate of change.<br />
What does the rate of change represent?<br />
c) Write a rule to determine the water use when you know<br />
the number of flushes.<br />
d) How much water is used for 17 flushes?<br />
6.4 Direct Variation 207
4. “Nature’s Best” sells bird seed for $0.86 per kilogram.<br />
a) Copy and complete this table for masses<br />
from 1 kg to 6 kg.<br />
b) Graph the data.<br />
Does the graph represent direct variation? Explain.<br />
Mass of bird<br />
seed (kg)<br />
Cost ($)<br />
c) Write a rule to determine the cost when you know the mass of seed.<br />
d) How much would it cost to buy 13 kg of seed?<br />
e) Will the cost for 26 kg be twice the cost for 13 kg? Explain your thinking.<br />
To check your answer, use your rule to determine the cost for 26 kg.<br />
You can use an equation to calculate values.<br />
Example<br />
Gas for a car is sold by the litre.<br />
Here are the costs of gas for<br />
Volume of gas (L) Cost ($)<br />
5 customers at a gas station.<br />
10 8.50<br />
a) Graph the data.<br />
16 13.60<br />
Does the graph represent direct<br />
variation? Explain.<br />
b) Determine the rate of change.<br />
Explain what it represents.<br />
c) Write an equation for this relation.<br />
6<br />
24<br />
18<br />
5.10<br />
20.40<br />
15.30<br />
d) Use the equation to determine the cost of 25.8 L of gas.<br />
Solution<br />
a)<br />
Cost ($)<br />
20<br />
15<br />
10<br />
5<br />
Gasoline Costs<br />
(18, 15.30)<br />
run<br />
(6, 5.10)<br />
rise<br />
0<br />
10 20<br />
Volume of gas (L)<br />
Yes, this graph represents direct variation.<br />
The graph is linear and passes through the origin.<br />
b) From the graph<br />
The rise is: $15.30 $5.10 $10.20<br />
The run is: 18 L 6 L 12 L<br />
The rate of change is:<br />
rise<br />
run<br />
<br />
$10.20<br />
12 L<br />
$0.85/L<br />
The rate of change is the change in price for each litre of gas.<br />
So, the rate of change is the unit cost of gas; that is, the cost for 1 L.<br />
208 CHAPTER 6: Linear Relations
c) The cost of buying gas can be described by the rule:<br />
Cost of gas in $ (unit price in $/litre) (volume of gas in litres)<br />
Let C represent the cost in dollars.<br />
The unit price is $0.85/L.<br />
Let v represent the volume of gas in litres.<br />
Then an equation is: C 0.85 v<br />
or, C 0.85v<br />
d) Use the equation: C 0.85v<br />
To determine the cost of 25.8 L of gas, substitute: v 25.8<br />
C 0.85 25.8<br />
21.93<br />
25.8 L of gas cost $21.93.<br />
5. Kaitlin works planting trees in Northern Ontario.<br />
She is paid 16¢ for each tree she plants.<br />
a) Complete a table to show how much Kaitlin<br />
would earn for planting up to 1000 trees.<br />
b) Graph Kaitlin’s earnings.<br />
Does the graph represent direct variation?<br />
Explain.<br />
c) What is the rate of change?<br />
What does it represent?<br />
d) Write an equation for this relationship.<br />
e) An experienced planter can plant between<br />
1000 and 3000 trees a day.<br />
Use the equation to determine how much Kaitlin<br />
would earn when she plants 1700 trees in one day.<br />
6. Jamal measured several circles.<br />
He used thread to measure the circumference<br />
and a ruler to measure the diameter.<br />
Here are his results.<br />
a) Graph the data.<br />
Does the graph represent direct variation?<br />
Explain.<br />
b) Determine the rate of change.<br />
Explain what it represents.<br />
c) Write an equation for this relationship.<br />
d) Use the equation to estimate the circumference<br />
of a circle with diameter 13 cm.<br />
Number Earnings,<br />
of trees, n E ($)<br />
0 0<br />
100<br />
diameter<br />
Diameter, d<br />
(cm)<br />
circumference<br />
Circumference, C<br />
(cm)<br />
0 0<br />
12 37.2<br />
2 6.2<br />
7 21.7<br />
5 15.5<br />
6.4 Direct Variation 209
7. Drew filled three bags of trail mix at the bulk store.<br />
250 g for 150 g for 220 g for<br />
$<br />
3.75 $<br />
2.25 $<br />
3.30<br />
a) Graph Cost against Mass for the trail mix.<br />
Does the graph represent direct variation? Explain.<br />
b) Determine the rate of change. Explain what it represents.<br />
c) Write an equation for this relation.<br />
Use m for the mass of trail mix in grams and C for the cost in dollars.<br />
d) Determine the cost of 340 g of trail mix. How did you do this?<br />
e) Write a question you could answer using the graph or equation.<br />
Answer the question.<br />
8. Assessment Focus Look back at the situations and the equations<br />
that represent them. Use these to help you with this question.<br />
Describe a situation that could be modelled by each equation.<br />
a) C 0.90v b) d 90t c) C 5.50n<br />
9. Find a flyer from a grocery store or<br />
bulk food store that lists prices per 100 g.<br />
Choose an item from the flyer.<br />
Write a question about the item.<br />
Follow the style of question 7.<br />
Prepare a sample solution for your question.<br />
Exchange questions with a classmate.<br />
Answer the question you receive.<br />
Check each other’s work.<br />
10. Take It Further Anastasia drives 55 km to work.<br />
One day, she left home at 7:00 a.m. and arrived at work at 8:15 a.m.<br />
a) What would a graph of distance against time look like<br />
for Anastasia’s drive to work?<br />
Do you have enough information? Explain.<br />
b) What is Anastasia’s average speed? Explain.<br />
How do you know when a graph represents direct variation?<br />
Explain with examples of graphs and equations.<br />
210 CHAPTER 6: Linear Relations
6.5 Partial Variation<br />
Carlo works for a car-sharing co-operative.<br />
The co-op owns a few cars.<br />
Co-op members can arrange to use the cars<br />
by the hour, day, or weekend.<br />
Investigate<br />
A Linear Relation Involving a Fixed Cost<br />
For car sharing:<br />
Total<br />
<br />
fixed cost depending on<br />
cost cost<br />
<br />
distance driven<br />
The co-op pays for gas and other expenses.<br />
Carlo prepared a table to show the total<br />
cost to use a car for a day.<br />
Some parts of the table are blank<br />
because coffee was spilled on it.<br />
Work with a partner to complete the table.<br />
➢ What patterns do you see in the table?<br />
➢ What is the fixed cost?<br />
What is the cost per kilometre?<br />
➢ Graph the data.<br />
Car Co-op Costs<br />
Distance Total<br />
driven (km) cost ($)<br />
0<br />
10<br />
20<br />
30<br />
40<br />
50<br />
60 49.00<br />
70 50.50<br />
80 52.00<br />
90 53.50<br />
100 55.00<br />
➢ Write a rule to calculate the total cost when you know the<br />
distance driven.<br />
➢ Write an equation. Use C for the total cost in dollars and<br />
n for the distance driven in kilometres.<br />
Reflect<br />
Compare your completed table with that of another pair of students.<br />
➢ What strategies did you use to complete the table?<br />
➢ How do the patterns in the table help you determine the fixed cost?<br />
The cost per kilometre?<br />
➢ Use your equation to check the cost when a car is driven 90 km.<br />
6.5 Partial Variation 211
Connect the Ideas<br />
The cost of a pizza with tomato sauce and cheese is $9.00.<br />
It costs $0.75 for each additional topping.<br />
This table shows the cost of a pizza with up to 8 additional<br />
toppings.<br />
Make a table<br />
Toppings Cost ($)<br />
0 9.00<br />
2 10.50<br />
4 12.00<br />
6 13.50<br />
8 15.00<br />
The cost, in dollars, for a 4-topping<br />
pizza is 9 (4 0.75) 12.00<br />
Graph the data<br />
The points are joined with a broken line since we cannot order<br />
a fraction of toppings.<br />
Cost of a Pizza<br />
Cost ($)<br />
14<br />
12<br />
10<br />
8<br />
run<br />
rise<br />
0 2 4 6 8<br />
Number of toppings<br />
All points lie on a straight line.<br />
The graph does not pass through the origin.<br />
This illustrates partial variation.<br />
The cost of a pizza is the sum of a fixed cost and a variable cost.<br />
The point where the line crosses the vertical axis is the<br />
vertical intercept.<br />
On this graph, the vertical intercept is $9.00.<br />
It represents the cost of a pizza with 0 extra toppings.<br />
Determine the<br />
rate of change<br />
The rise is: $12.00 $10.50 $1.50<br />
The run is: 4 toppings 2 toppings 2 toppings<br />
The rate of change is: <br />
rise<br />
run<br />
$1.50<br />
2 toppings<br />
$0.75/topping<br />
The rate of change is equal to the cost per topping.<br />
212 CHAPTER 6: Linear Relations
Write a rule<br />
Cost of pizza in $ 9.00 (0.75 number of toppings)<br />
144424443<br />
This is the fixed cost in dollars.<br />
This is the variable cost in<br />
dollars because it depends<br />
on the number of toppings.<br />
Write an<br />
equation<br />
Let C represent the cost in dollars.<br />
Let n represent the number of toppings.<br />
Then, C 9.00 0.75n<br />
vertical intercept<br />
rate of change<br />
Practice<br />
1. Which graphs represent partial variation? How do you know?<br />
a) Kelly’s Earnings<br />
b)<br />
Earnings ($)<br />
70<br />
60<br />
50<br />
40<br />
0 10 20 30<br />
Number of<br />
subscriptions sold<br />
Number of bison<br />
4000<br />
3000<br />
2000<br />
1000<br />
Estimated Bison Population<br />
in Yellowstone Park<br />
0<br />
1970 1980 1990<br />
Year<br />
2000<br />
c) Distance Remaining in<br />
d)<br />
3000-m Race<br />
Distance remaining (m)<br />
2400<br />
1600<br />
800<br />
0 2 4 6<br />
Laps completed<br />
Cost of Buying Perennials<br />
Cost ($)<br />
80<br />
60<br />
40<br />
20<br />
0 5 10 15 20<br />
Number of plants<br />
2. For each graph in question 1 that represents partial variation,<br />
determine the vertical intercept and the rate of change.<br />
6.5 Partial Variation 213
3. When it is windy, it feels colder than the actual temperature.<br />
The table shows how cold it feels at different temperatures<br />
when the wind speed is 10 km/h.<br />
Actual temperature (°C) 20 15 10 5 0 5<br />
Wind chill equivalent 27 21 15 9 3 3<br />
temperature (°C)<br />
a) Graph Wind chill equivalent temperature against<br />
Actual temperature.<br />
b) Does this situation represent partial variation? Explain.<br />
c) Use the graph.<br />
About how cold does it feel when there is a 10-km/h wind<br />
and the actual temperature is 14°C? 3°C?<br />
4. The temperature at which water boils depends on<br />
the altitude; that is, the height above sea level.<br />
The table shows how the two quantities are related.<br />
Altitude (m) 0 1200 2400 3600 4800 6000<br />
Boiling point (°C) 100 96 92 88 84 80<br />
a) Graph Boiling point against Altitude.<br />
Did you join the points with a broken line or a<br />
solid line? Explain.<br />
b) Does this situation represent partial variation? Explain.<br />
c) Every year, tourists travel to Tanzania to climb<br />
Mount Kilimanjaro. Trekkers must boil their drinking water.<br />
Use the graph to estimate the boiling point of water at each camp:<br />
i) Machame camp, 3100 m<br />
ii) Barafu camp, 4600 m<br />
5. A school is planning an athletic banquet.<br />
The banquet hall charges a fixed cost of $500,<br />
plus $25 per person for the food.<br />
a) Make a table to show the total cost for up to 50 guests.<br />
b) Graph Cost against Number of guests.<br />
Did you join the points with a broken line or a solid line? Explain.<br />
c) Does the graph represent a partial variation? How do you know?<br />
d) What is the rate of change? What does it represent?<br />
e) How much would the banquet cost for 45 guests? 90 guests?<br />
How do you know?<br />
f) Is the cost for 45 guests one-half the cost for 90 guests? Explain.<br />
214 CHAPTER 6: Linear Relations
You have determined values by using a graph.<br />
This example shows how to determine values using an equation.<br />
Example<br />
Solution<br />
Jolanda has a window cleaning service.<br />
She charges a $12 fixed cost, plus $1.50 per window.<br />
a) Write an equation to determine the cost when the number<br />
of windows cleaned is known.<br />
b) What does Jolanda charge to clean 11 windows?<br />
a) The cost is $12.00 plus $1.50 the number of windows.<br />
Let C represent the cost in dollars.<br />
Let n represent the number of windows.<br />
The equation is: C 12.00 (1.50 n)<br />
or, C 12.00 1.50n<br />
b) Use the equation: C 12.00 1.50n<br />
To determine the cost for 11 windows, substitute: n 11<br />
C 12.00 1.50 11<br />
12.00 16.50<br />
28.50<br />
Jolanda charges $28.50 to clean 11 windows.<br />
Use the order of operations.<br />
6. A phone company charges $20 per month, plus $0.10 per minute for<br />
long distance calling.<br />
a) Write an equation to determine the total monthly charge, C dollars,<br />
for n minutes of long distance calling.<br />
b) Determine the total cost for 180 min of long distance calls one month.<br />
7. Assessment Focus Nuri is growing his hair to donate to a charity.<br />
The charity makes wigs for children with cancer.<br />
Nuri’s hair is now 25 cm long. It grows 1.3 cm every month.<br />
a) Write an equation to determine Nuri’s total hair length, h centimetres,<br />
after n months.<br />
b) How long is his hair after 6 months? 9.5 months? How do you know?<br />
c) Write a question that can be answered using the equation.<br />
Trade questions with a classmate. Answer the question you receive.<br />
8. Look back at the situations and the equations that represent them.<br />
Use these to help you with this question.<br />
a) Describe a situation that could be modelled by each equation.<br />
i) C 150 20n ii) 20w iii) C 0.75m<br />
b) Which equations in part a represent direct variation? Partial variation?<br />
How do you know?<br />
6.5 Partial Variation 215
9. A school theatre group has posters printed for a performance.<br />
The cost to print a poster is the sum of a fixed cost and a variable cost.<br />
It costs $75 to print 100 posters and $150 to print 400 posters.<br />
a) Graph Cost against Number of posters.<br />
b) What is the fixed cost? How can you determine this from the graph?<br />
c) What is the rate of change? What does it represent?<br />
d) Write an equation that describes this linear relation.<br />
e) How much does it cost to print 250 posters? How did you find out?<br />
10. A taxi company charges a fixed cost, called the initial meter fare,<br />
and a cost per kilometre.<br />
A 5-km trip costs $11.25 and a 10-km trip costs $19.75.<br />
a) Graph Cost against Distance.<br />
b) What is the fixed cost?<br />
How can you determine this from the graph?<br />
c) What is the rate of change? What does it represent?<br />
d) Write an equation that describes this linear relation.<br />
e) How much does it cost to ride 15 km?<br />
f) This company offers a flat rate fare of $90 for travel from<br />
Waterloo to Lester B. Pearson International Airport.<br />
The airport is 96 km from Waterloo.<br />
Which is cheaper: the flat rate fare or the partial variation fare?<br />
How do you know?<br />
11. Take It Further In a scavenger hunt, players have 1 h to find<br />
50 items from a list.<br />
Players are awarded 5 points for every item handed in.<br />
Players who hand in their items within 45 min are awarded a 20-point bonus.<br />
a) Suppose a player finishes within 45 min.<br />
i) Is her score an example of partial variation? Explain.<br />
ii) Write an equation to determine the total number of points<br />
when the number of items is known.<br />
b) Yvonne finishes within 45 min. She scores 220 points.<br />
Determine how many items Kevin needs to find to beat Yvonne in each case.<br />
i) Kevin also finishes within 45 min.<br />
ii) Kevin takes the full hour.<br />
What is partial variation?<br />
Use an example and a graph to explain.<br />
216 CHAPTER 6: Linear Relations
Using a Graphing Calculator<br />
to Graph an Equation and<br />
Generate a Table of Values<br />
You will need a TI-83 or TI-84 graphing calculator.<br />
Consider the Guided Example in Section 6.5, page 215.<br />
Here is the equation for Jolanda’s window cleaning service:<br />
C 12.00 1.50n<br />
where C dollars is the cost and n is the number of windows<br />
The graphing calculator uses X to represent the variable<br />
on the horizontal axis and Y to represent the variable on<br />
the vertical axis.<br />
To match this style, the cost equation is written as:<br />
Y 12.00 1.50X<br />
Follow these steps to graph the equation and generate<br />
a table of values.<br />
Since X represents<br />
the number of<br />
windows washed<br />
and Y represents the<br />
cost, we are only<br />
interested in positive<br />
values of X and Y.<br />
To make sure there are no<br />
equations in the o list:<br />
Press o.<br />
Move the cursor to any equation,<br />
then press ‘.<br />
When all equations have been<br />
cleared, position the cursor to the<br />
right of the equals sign for Y1.<br />
To enter the equation, press:<br />
¨©µµ«¨zµ„<br />
To adjust the window settings<br />
to display the graph:<br />
Press p.<br />
Set the options as shown.<br />
To set an option, clear what is there,<br />
enter the value you want,<br />
then press Í.<br />
Use the D key to scroll down the list.<br />
Technology: Using a Graphing Calculator to Graph an Equation and Generate a Table of Values 217
Press s. A graph like the one<br />
shown here should be displayed.<br />
The points lie on a line.<br />
Since X is a whole number,<br />
the graph should be a series<br />
of dots joined with a broken line.<br />
However, the calculator joins the<br />
points with a solid line.<br />
To display a table of values:<br />
Press y pto display the<br />
table setup screen.<br />
Press µ Í. This sets the<br />
initial value of X in the table to 0.<br />
Press ¨ Í. This increases<br />
the value of X by 1 each row.<br />
Press Í D Í.<br />
Your screen should look like<br />
the one shown here.<br />
Press y sto display the table.<br />
Only the first 7 rows are displayed.<br />
Use the D key to scroll down<br />
the table.<br />
Confirm that when 11 windows<br />
are washed, the cost is $28.50.<br />
In Section 6.5, question 8, page 215, you described situations that<br />
could be modelled by each of 3 equations.<br />
Complete these steps for each equation.<br />
Use pages 217 and<br />
218 as a guide.<br />
➢ Use a TI-83 or TI-84 calculator to graph the equation,<br />
using appropriate window settings.<br />
➢ Display a table of values for the graph.<br />
➢ Choose a value of X that makes sense for the situation you<br />
described in question 8.<br />
Use the table to determine the corresponding value of Y.<br />
Describe what the values represent.<br />
218 CHAPTER 6: Linear Relations
The 25-m Sprint<br />
Remember that the<br />
rise is the vertical<br />
distance between<br />
two points and the<br />
run is the horizontal<br />
distance between<br />
these points.<br />
In track and field, the 60-m sprint is<br />
the shortest race. In this game,<br />
you will be racing to 25 m.<br />
But you will not be running.<br />
Your challenge is to graph a linear<br />
relation that reaches 25 m as quickly<br />
as possible.<br />
Distance (m)<br />
Play with a partner.<br />
You will need 3 number cubes,<br />
a ruler, several copies of the grid<br />
shown at the right, and a different<br />
coloured pencil for each player.<br />
The first player rolls the number cubes<br />
and records the numbers shown.<br />
The player chooses:<br />
• one number to be the vertical intercept<br />
• another number to be the rise<br />
• the third number to be the run<br />
The first player graphs her relation:<br />
Plot the vertical intercept.<br />
Use the rise and run to plot the next point.<br />
Plot several points.<br />
Use a ruler to draw a line through them.<br />
Extend the line until it passes beyond 25 m.<br />
28<br />
24<br />
20<br />
16<br />
12<br />
8<br />
4<br />
The 25-m Sprint<br />
0 4<br />
8 12<br />
Time (s)<br />
16 20<br />
Play passes to the second player.<br />
This player rolls the number cubes and decides<br />
what the numbers will represent.<br />
The player follows the steps above to graph his relation on the<br />
same grid, using a different colour.<br />
Compare the 2 lines.<br />
Whose line reached 25 m first?<br />
This person is the winner.<br />
Play the game several times.<br />
Think about the strategies you use when you decide what the<br />
numbers rolled will represent. Describe a winning strategy.<br />
Test your ideas by playing the game again.<br />
Game: The 25-m Sprint 219
Mid-Chapter Review<br />
6.1<br />
6.3<br />
1. The table shows how the height of a<br />
small plane changes with time.<br />
Time (min)<br />
Height (m)<br />
0 0<br />
1 200<br />
2 400<br />
3 600<br />
4 800<br />
6.4<br />
6.5<br />
3. The cost of renting a kayak is<br />
$33 per day.<br />
a) Copy and complete this table to<br />
show the cost to rent a kayak for<br />
up to 10 days.<br />
Rental time Cost<br />
(days) ($)<br />
6.2<br />
a) Determine the first differences.<br />
What do they represent?<br />
b) Is the relationship linear? Explain.<br />
c) Graph Height against Time.<br />
Determine the rate of change.<br />
How does it compare with the<br />
first differences?<br />
d) At this rate, how many minutes<br />
will it take the plane to reach its<br />
cruising height of 1600 m?<br />
Explain how you found your<br />
answer.<br />
2. The fastest elevator in the world is<br />
in the Taipei 101 office tower, Taiwan.<br />
The tower is about 510 m high.<br />
It is the tallest building in the world.<br />
It takes the elevator about 30 s to<br />
reach the top.<br />
a) Graph Height against Time<br />
for the elevator.<br />
b) Determine the height after<br />
each time.<br />
i) 15 s ii) 20 s<br />
Which method did you use to find<br />
the heights?<br />
c) What is the rate of change<br />
of distance with time?<br />
d) What is the average speed<br />
for the trip?<br />
6.5<br />
b) Graph Cost against Rental time.<br />
c) Does this graph represent direct<br />
variation or partial variation?<br />
Explain how you know.<br />
d) Determine the rate of change.<br />
What does it represent?<br />
4. In a cookbook, the time to cook<br />
a turkey is given as:<br />
30 min per kilogram of turkey,<br />
plus an additional 15 min<br />
a) Complete a table like the one<br />
below for turkeys with masses<br />
up to 10 kg.<br />
Mass of turkey Cooking time<br />
(kg)<br />
(min)<br />
0 15<br />
2<br />
4<br />
b) Graph Cooking time against Mass.<br />
Use the graph to determine the<br />
time to cook a 5-kg turkey.<br />
c) Write a rule for the cooking time.<br />
d) Write an equation for the cooking<br />
time, t minutes, for a turkey with<br />
mass m kilograms.<br />
e) Determine the cooking time for a<br />
7.2-kg turkey.<br />
How many different ways could<br />
you find this time? Explain.<br />
220 CHAPTER 6: Linear Relations
6.6<br />
Changing Direct and Partial<br />
Variation Situations<br />
Investigate<br />
Making Changes to Linear Relations<br />
Your teacher will give you a copy of the graphs at the left.<br />
➢ Determine whether each graph represents direct variation,<br />
partial variation, or neither. Give reasons for your choices.<br />
➢ Match each graph with its description below.<br />
Label your copy of the graphs with as much detail as possible.<br />
• The “Creature Comforts” dog kennel costs $28 per day.<br />
• Rana rents a moped while on vacation.<br />
She is charged an initial fee of $35 plus $2 for each litre<br />
of fuel consumed.<br />
➢ Write an equation for each graph.<br />
➢ Suppose the daily cost at the dog kennel increases to $30.<br />
How does the graph change?<br />
Sketch the new graph on the grid.<br />
How does the equation change?<br />
Write the new equation.<br />
➢ When Rana rented a moped the next year,<br />
the prices had changed.<br />
The initial fee had been reduced to $28.<br />
The price for fuel had increased to $3 per litre.<br />
How does the graph change?<br />
Sketch the new graph on the grid.<br />
How does the equation change?<br />
Write the new equation.<br />
[add spot illus?<br />
6.6.2x]<br />
Reflect<br />
Compare your answers with those of other students.<br />
➢ How are graphs of direct variation and partial variation alike?<br />
How are they different?<br />
➢ How did the changes in each situation affect the graph?<br />
➢ How do these changes affect the equation?<br />
6.6 Changing Direct and Partial Variation Situations 221
Connect the Ideas<br />
Ben works part time selling<br />
newspaper ads.<br />
He is paid $18 for each ad he sells.<br />
His pay varies directly as the number<br />
of ads sold.<br />
The rate of change is $18/ad.<br />
The rule is:<br />
Pay in dollars 18 number of ads sold<br />
Let P represent the pay in dollars.<br />
Let n represent the number of ads sold.<br />
Then the equation is:<br />
P 18n<br />
Pay ($)<br />
Ben’s Earnings<br />
150 P<br />
100 P = 18n<br />
50<br />
n<br />
0 2 4 6 8<br />
Number of ads sold<br />
Ben is given a pay raise.<br />
He is now paid $22 for each ad he sells.<br />
The rate of change is now $22/ad.<br />
Here is the new graph and<br />
the original graph.<br />
The rule for the new graph is:<br />
Pay in dollars 22 number of ads sold<br />
The new equation is:<br />
P 22n<br />
Pay ($)<br />
Ben’s Earnings<br />
P<br />
200<br />
150 P = 22n<br />
100<br />
P = 18n<br />
50<br />
n<br />
0 2 4 6 8<br />
Number of ads sold<br />
Both graphs pass through the origin and go up to the right.<br />
The purple graph has the greater rate of change.<br />
The purple graph is steeper than the red graph.<br />
Beyond the origin, the purple graph lies above the red graph.<br />
Practice<br />
1. Does each situation represent direct variation or partial variation?<br />
Explain how you know.<br />
a) Lily is paid $5 per hour for raking leaves.<br />
b) The printing of brochures costs $250, plus $1.25 per brochure.<br />
c) Jordan is paid $30 per day, plus $2.00 for every magazine subscription he sells.<br />
2. Does each equation represent direct variation or partial variation?<br />
Explain how you know.<br />
a) C 4n 30 b) P 4s<br />
c) d 65t d) d 400 85t<br />
222 CHAPTER 6: Linear Relations
3. The cost for Best Cellular cell phone plan is $0.20 per minute.<br />
a) Does the cost represent direct variation or partial variation? How do you know?<br />
b) Make a table for the costs. Use intervals of 10 min from 0 min to 100 min.<br />
c) Graph the data.<br />
d) Write an equation to determine the cost, C dollars, for t minutes of calls.<br />
e) The company increases its fees to $0.25 per minute.<br />
i) How does the graph change? Draw the new graph on the grid in part c.<br />
ii) How does the equation change? Write the new equation.<br />
Changes can be made to a situation described by a partial variation.<br />
Example<br />
Jocelyn works full time selling newspaper ads.<br />
She is paid $32 a day, plus $8 for every ad she sells.<br />
a) Make a table of Jocelyn’s earnings for daily sales up to 60 ads.<br />
b) Graph the data.<br />
c) Write an equation to determine Jocelyn’s earnings, E dollars,<br />
when she sells n ads.<br />
d) There is a change in management.<br />
Jocelyn is now paid $30 per day and $10 for every ad she sells.<br />
i) Graph Jocelyn’s earnings for daily sales up to 60 ads.<br />
How is the graph different from the graph in part b?<br />
ii) Write the new equation for Jocelyn’s earnings.<br />
Solution<br />
a)<br />
b)<br />
Number Earnings ($)<br />
of ads<br />
0 32<br />
20 32 (8 20) 192<br />
40 32 (8 40) 352<br />
60 32 (8 60) 512<br />
500<br />
Jocelyn’s Earnings<br />
Pay ($)<br />
400<br />
300<br />
200<br />
100<br />
The vertical intercept is $32.<br />
The rate of change is $8/ad.<br />
0 10 20 30 40 50 60<br />
Number of ads sold<br />
c) The rule for Jocelyn’s earnings is:<br />
Earnings in dollars 32 (8 number of ads sold)<br />
An equation is: E 32 8n<br />
6.6 Changing Direct and Partial Variation Situations 223
d) i) Here is the graph<br />
with the new rate.<br />
The vertical intercept<br />
is $30.<br />
The rate of change<br />
is $10/ad.<br />
ii) The new equation is:<br />
E 30 10n<br />
Pay ($)<br />
Jocelyn’s Earnings<br />
600<br />
500<br />
400<br />
300<br />
200<br />
100<br />
0 10 20 30 40 50 60<br />
Number of ads sold<br />
4. Use the data in the Guided Example. Which pay scale was better for Jocelyn?<br />
Give reasons for your answer.<br />
5. The Best Cellular cell phone company has another plan for cell phone users.<br />
This plan costs $12 per month, plus $0.10 per minute.<br />
a) Make a table of monthly costs for calling times from 0 min to 100 min.<br />
b) Graph the data.<br />
c) Write an equation to determine the monthly cost, C dollars, for t minutes of calls.<br />
d) The company increases its fixed monthly fee to $20 but decreases its cost<br />
per minute to $0.08.<br />
i) How does the graph change? Draw the new graph on the grid in part b.<br />
ii) Write the new equation.<br />
6. Assessment Focus Use the data and your results from questions 3 and 5.<br />
For each plan, does the cost double when the time doubles? Explain.<br />
7. Take It Further A car rental agency charges a daily rate of $29.<br />
If the distance driven is more than 100 km, a charge of $0.10 per kilometre<br />
is added for each kilometre over 100 km.<br />
a) Make a table to show the cost every 50 km up to 300 km.<br />
b) Graph the data.<br />
c) Does the graph represent partial variation, direct variation, or neither?<br />
How do you know?<br />
d) Describe the graph. Explain its shape.<br />
e) How much would you have to pay if you drove 35 km? 175 km? 280 km?<br />
How are the graph and equation of a partial variation situation different<br />
from those of direct variation? Use examples in your explanation.<br />
224 CHAPTER 6: Linear Relations
Using CAS to Explore Solving<br />
Equations<br />
You will need a TI-89 calculator.<br />
Step 1<br />
➢ Clear the home screen: At the end of Step 1, your x 3<br />
ÍHOME<br />
ƒ 8 ‘ screen should look like this: 2x 6<br />
➢ Enter the equation x 3:<br />
2x 1 7 are examples<br />
ÁÁ3<br />
of equivalent equations.<br />
X Í<br />
➢ Multiply each side of<br />
Why are the equations<br />
the equation by 2:<br />
equivalent?<br />
p 2<br />
How are equivalent<br />
Í<br />
equations formed?<br />
➢ Add 1 to each side of<br />
the equation:<br />
« 1 Í<br />
Step 2<br />
In Step 1, you started with<br />
Which operations did<br />
x 3 and ended with<br />
you use to get from<br />
2x 1 7. x 3 to 2x 1 7?<br />
Suppose you start with<br />
How could you “undo”<br />
2x 1 7. What steps<br />
these operations to<br />
would you take to get get back to x 3?<br />
back to x 3?<br />
Step 3<br />
➢ Clear the home screen: At the end of Step 3, your The steps to get back to<br />
ÍHOME<br />
ƒ 8 ‘ screen should look like this: x 3 are the steps to<br />
➢ Enter the equation<br />
solve the equation<br />
2x 1 7:<br />
2x 1 7.<br />
2Á«1 X Á 7 Í At each step:<br />
➢ Subtract 1 from each side:<br />
– we are closer to<br />
| 1<br />
isolating the term<br />
Í<br />
containing the variable<br />
➢ Divide each side by 2:<br />
e 2 Í<br />
– we create a simpler<br />
equivalent equation<br />
Technology: Using CAS to Explore Solving Equations 225
Step 4<br />
➢ Clear the home screen:<br />
ÍHOME<br />
ƒ 8 ‘<br />
➢ Enter 2x 1 7:<br />
2Á«1 X Á 7 Í<br />
➢ Divide each side by 2:<br />
e 2 Í<br />
➢ Subtract 1 from each side:<br />
| 1 Í<br />
Step 5<br />
➢ Work with a partner.<br />
Repeat Step 1 with a<br />
different start equation.<br />
Multiply each side by a<br />
different number.<br />
Then add a different<br />
number to each side,<br />
or subtract a different<br />
number from each side.<br />
➢ Trade end equations with<br />
your partner.<br />
➢ Solve your partner’s<br />
equation.<br />
At the end of Step 4, your<br />
screen should look like this:<br />
Which extra step is<br />
needed to isolate x on<br />
the left side of the<br />
equation?<br />
What is the result when<br />
you isolate x?<br />
Which method, Step 3 or<br />
Step 4, is easier to use?<br />
Explain.<br />
Which strategies did you<br />
use to solve the<br />
equations?<br />
Step 6<br />
Solve these equations using To check if x 3 is a<br />
paper and pencil. solution to 2x 1 7,<br />
a) 3x 1 14 press: 2Á«1 X Á 7<br />
b) 5x 12 2 ¨ÁX<br />
Á 3 Í.<br />
c) 15 2x 3 To test x 4,<br />
Use CAS to check your work press: B04 Í<br />
and to check your solution.<br />
How does the calculator<br />
show that x 3 is<br />
a solution?<br />
How does it show that<br />
x 4 is not a solution?<br />
226 CHAPTER 6: Linear Relations
6.7 Solving Equations<br />
An equation is a statement that two expressions are equal.<br />
Each of these is an equation:<br />
3x 21<br />
12 x 4<br />
2x 7 9<br />
Investigate<br />
Using Inverse Operations to Solve an Equation<br />
Work with a partner.<br />
➢ Start with the equation x 2.<br />
This is the start equation.<br />
➢ Multiply each side of the equation by 3.<br />
Write the resulting equation.<br />
➢ Add 5 to each side of the equation.<br />
Write the resulting equation.<br />
This is the end equation.<br />
➢ Suppose you were given the end equation.<br />
What steps would you take to get back to x 2?<br />
Repeat the steps above with a different start equation.<br />
Multiply each side by a different number.<br />
Then add a different number to each side,<br />
or subtract a different number from each side.<br />
Trade end equations with your partner.<br />
Find your partner’s start equation.<br />
Reflect<br />
Share your equations with another pair of classmates.<br />
➢ Find your classmates’ start equations.<br />
What strategies did you use?<br />
➢ How are the operations used to get from the end<br />
equation to the start equation related to the operations<br />
used to get from the start equation to the end equation?<br />
6.7 Solving Equations 227
Connect the Ideas<br />
We can use mental math to solve equations like 3 x 5.<br />
We know that 3 2 5, so x 2.<br />
Equations like 4x 3 11 cannot be easily solved mentally.<br />
Here are two ways to solve the equation.<br />
Use a balance<br />
scales model<br />
Each bag contains<br />
the same number<br />
of candies.<br />
Let x represent the number of<br />
candies in each bag.<br />
There are 4 bags and 3 candies<br />
on the left pan.<br />
This is represented by the expression 4x 3.<br />
There are 11 candies on the right pan.<br />
This is represented by the number 11.<br />
So, the balance scales model the equation 4x 3 11.<br />
To solve the equation:<br />
Remove 3 candies from each pan.<br />
We now have: 4x 8<br />
Divide the candies in the right pan into 4 equal groups.<br />
Each group contains 2 candies.<br />
So, each bag contains 2 candies.<br />
The solution is x 2.<br />
Use computer<br />
algebra<br />
systems (CAS)<br />
Enter the equation 4x 3 11.<br />
To solve the equation, use inverse operations.<br />
Isolate the term 4x by “undoing”<br />
the addition.<br />
The inverse of adding 3<br />
is subtracting 3.<br />
Subtract 3 from each side<br />
of the equation.<br />
We now have: 4x 8<br />
Isolate x by “undoing”<br />
the multiplication.<br />
The inverse of multiplying by 4 is<br />
dividing by 4.<br />
Divide each side of the equation by 4.<br />
The solution is x 2.<br />
228 CHAPTER 6: Linear Relations
Practice<br />
1. Solve each equation. Explain how you did it.<br />
a) 3x 12 b) 45 5x c) x 7 11<br />
d) 2x 4 e) 4 3 x f) x 5 14<br />
2. Write the equation represented by each balance scales.<br />
Explain how to solve the equation.<br />
a) b)<br />
c) d)<br />
e) f)<br />
3. Solve each equation.<br />
a) 3x 2 17 b) 2x 5 1<br />
c) 33 4x 5 d) 7x 1 22<br />
e) 2 6x 10 f) 5x 2 38<br />
Which tools could<br />
you use to help you?<br />
Having trouble?<br />
Read Connect<br />
the Ideas.<br />
We cannot use balance scales when the solution to an equation<br />
is a negative number. Use inverse operations instead.<br />
Example<br />
Solution<br />
Solve: 3x 14 2<br />
Use an inverse operation to isolate 3x on the left side of the equation.<br />
3x 14 2<br />
Subtract 14 from each side.<br />
3x 14 14 2 14<br />
3x 12 To isolate x, divide each side by 3.<br />
3x<br />
12<br />
3 3<br />
x 4<br />
Check the solution.<br />
Substitute x 4 in 3x 14 2.<br />
L.S. 3(4) 14 R.S. 2<br />
12 14<br />
2<br />
Since the left side equals the right side, x 4 is the correct solution.<br />
6.7 Solving Equations 229
4. Solve each equation.<br />
a) 3x 4 1 b) 5 2x 3 c) 3x 4 7 d) 2 5x 17<br />
e) 7 3x 13 f) 3x 5 4 g) 24 3x 6 h) 5 4x 21<br />
5. Choose 3 equations in question 4. Check your solutions.<br />
6. An equation for the perimeter of a parallelogram is P 2b 2c.<br />
a) Determine P when b 5 cm and c 7 cm.<br />
b) Determine c when P 36 cm and b 8 cm<br />
c) Determine b when P 54 cm and c 12 cm.<br />
b<br />
c<br />
7. Assessment Focus In Canada, temperature is measured in degrees Celsius, C.<br />
In the United States, temperature is measured in degrees Fahrenheit, F.<br />
The equation 9C 5F 160 is used to convert between the two temperature scales.<br />
a) What is 30°C in degrees Fahrenheit?<br />
b) What is 14°F in degrees Celsius?<br />
Explain your work.<br />
8. An empty tanker truck has a mass of 14 000 kg.<br />
One barrel of oil has a mass of 180 kg.<br />
The equation M 14 000 180b represents<br />
the total mass of the truck, M kilograms,<br />
when it contains b barrels of oil.<br />
The truck enters a weigh station that<br />
shows its total mass is 51 080 kg.<br />
How many barrels of oil are on the truck?<br />
How do you know?<br />
9. Take It Further In each figure:<br />
a) Write an equation to relate the given measures.<br />
b) Solve the equation.<br />
i) ii) iii)<br />
70<br />
3x 7<br />
40<br />
2x<br />
5x 20<br />
50<br />
58<br />
58<br />
Choose one equation you solved in this section.<br />
Explain how you solved it.<br />
Show how to check the solution.<br />
230 CHAPTER 6: Linear Relations
6.8 Determining Values in a Linear Relation<br />
In forestry, the<br />
diameter of a tree is<br />
measured at chest<br />
height, 1.37 m above<br />
the ground.<br />
To estimate how much cut lumber<br />
a tree can provide, a forester needs to<br />
know the size of the tree.<br />
It can be difficult to measure the<br />
height of a tree.<br />
It is easier to measure the tree’s<br />
circumference, then calculate its diameter.<br />
So, it is useful to know how a tree’s<br />
height is related to its diameter.<br />
Investigate<br />
The relationship<br />
between height and<br />
diameter changes<br />
as trees age. This<br />
equation is valid<br />
for trees with<br />
diameters between<br />
5 cm and 25 cm.<br />
Determining Values Using a Table, Graph, and Equation<br />
Researchers collected data from more than<br />
100 white spruce trees on Prince Edward Island.<br />
The data were graphed and a line of best fit was drawn.<br />
The equation of the line is: d 10h 50<br />
where d is the diameter of the tree in centimetres and<br />
h is the approximate height of the tree in metres<br />
➢ Make a table to show the<br />
approximate heights of trees with<br />
diameters 5 cm and 25 cm.<br />
Approximate<br />
height, h (m)<br />
➢ Graph the data.<br />
How could you use the graph to estimate the height of a tree<br />
that is not in the table?<br />
➢ How could you use the graph to estimate the diameter<br />
of a tree that is not in the table?<br />
Diameter,<br />
d (cm)<br />
5<br />
25<br />
Reflect<br />
You have used a table, a graph, and an equation to<br />
estimate the heights and diameters of trees.<br />
Which method do you prefer? Is one method best?<br />
Explain.<br />
6.8 Determining Values in a Linear Relation 231
Connect the Ideas<br />
Janice is a piano teacher.<br />
She earns $23 per hour.<br />
Janice wants to earn $200.<br />
Here are three ways she can determine the time she has to work.<br />
Make a table<br />
Continue the table until the Earnings is $200 or greater.<br />
Time worked (h) 1 2 3 4 5 6 7 8 9<br />
Earnings ($) 23 46 69 92 115 138 161 184 207<br />
From the table, Janice has to work 9 h to earn at least $200.<br />
Draw a graph<br />
Janice earns $23/h.<br />
She earns $0 for 0 h worked.<br />
Janice earns $23 10 $230 for<br />
10 h worked.<br />
Since the relationship is a direct<br />
variation, plot the points (0, 0) and<br />
(10, 230), then draw a broken line<br />
through them.<br />
From the graph, Janice has to work<br />
about 8.5 h to earn $200.<br />
Earnings ($)<br />
Janice’s Earnings<br />
200<br />
150<br />
100<br />
50<br />
0 2 4 6 8 10<br />
Time worked (h)<br />
Use an equation<br />
Since the relationship is a direct variation, the rule is:<br />
Earnings in dollars rate of change time worked in hours<br />
The rate of change is the hourly rate: $23/h<br />
Let A dollars represent the earnings.<br />
Let n hours represent the time worked.<br />
Then, the equation is: A 23n<br />
To determine how long Janice needs to work to earn $200,<br />
substitute A 200 and solve the equation for n.<br />
Use inverse operations.<br />
200 23n Divide each side by 23.<br />
200<br />
23<br />
23n<br />
23<br />
Use a calculator to determine 200 23.<br />
8.696 n<br />
Janice has to work about 8.7 h to earn $200.<br />
Since Janice works whole numbers of hours,<br />
she has to work 9 h to earn $200.<br />
232 CHAPTER 6: Linear Relations
Practice<br />
1. a) This table shows the cost to rent a canoe.<br />
How much would it cost to rent a canoe for<br />
each time?<br />
i) 2 days ii) 4 days<br />
How did you find out?<br />
b) This table shows the earnings from ticket sales.<br />
How much is earned from the sale of each<br />
number of tickets?<br />
i) 10 ii) 30 iii) 50<br />
How did you find out?<br />
Time (days) 0 1 3 5<br />
Cost ($) 0 24 72 120<br />
Tickets sold 0 20 40 60<br />
Earnings ($) 0 160 320 480<br />
2. These data were recorded for a cheetah chasing prey.<br />
Time (s) 0 5 10 15 20<br />
Distance (m) 0 105 210 315 420<br />
a) Graph the data.<br />
b) Use the graph to determine how long<br />
it takes the cheetah to run 400 m.<br />
c) About how long will it take the cheetah to run 500 m?<br />
What assumption did you make?<br />
d) Write an equation to determine the distance, d metres, after t seconds.<br />
e) Use the equation to determine how long it will take the cheetah to run<br />
400 m and 500 m. How do your answers compare to those in parts b and c?<br />
Which method did you prefer? Explain.<br />
We can also find values for a linear relation that represents partial variation.<br />
Example<br />
Solution<br />
A candle is 13 cm long.<br />
It is lit and it burns at the rate of 0.2 cm/min.<br />
a) Write an equation for the height, H centimetres, of the candle<br />
after time, t minutes.<br />
b) How long does it take until the candle is 10 cm high?<br />
a) The rule is:<br />
Candle height initial height (rate of change time)<br />
The range of change is 0.2 cm/min.<br />
So, the equation is:<br />
H 13 (0.2 t), or<br />
H 13 0.2t<br />
6.8 Determining Values in a Linear Relation 233
) To determine how long it takes until the candle is 10 cm high,<br />
substitute H 10 in the equation, then solve for t.<br />
H 13 0.2t<br />
Use inverse operations.<br />
10 13 0.2t Subtract 13 from each side.<br />
10 13 13 13 0.2t<br />
3 0.2t<br />
Divide each side by 0.2.<br />
3 0.2t<br />
Use a calculator to divide.<br />
0.2 0.2<br />
15 t<br />
It takes 15 min until the candle is 10 cm high.<br />
3. Use the data in the Guided Example.<br />
a) Graph Height against Time.<br />
Determine when the candle is 10 cm high. How did you do this?<br />
b) Make a table of values.<br />
Use the table to determine when the candle is 10 cm high.<br />
c) Which of the 3 methods to determine the height of the candle did you prefer?<br />
Explain.<br />
4. Assessment Focus At the video arcade, Aran bought a game card with a value of $35.<br />
Every time he plays a game, $1.40 is deducted from the card.<br />
a) Make a table for the number of games played.<br />
Number of games Value of<br />
Use the table to determine when the card runs out. played, n card, V ($)<br />
b) Graph the data.<br />
Use the graph to determine when the card runs out.<br />
c) Write an equation for the value, V dollars, of the card<br />
after n games have been played.<br />
d) How many games can Aran play before his card runs out?<br />
How do you know?<br />
e) Which of the 3 methods do you prefer? Explain.<br />
5. Take It Further Aran could have bought a card that costs $10 more,<br />
but only $0.90 is deducted for each game played.<br />
a) How does this affect the graph?<br />
b) How many more games could Aran play with this card?<br />
c) Do you think it is a good deal? Explain.<br />
Describe some different ways to determine values in a linear relation.<br />
Which way do you prefer? Use an example to explain.<br />
234 CHAPTER 6: Linear Relations
6.9<br />
Solving Problems Involving<br />
Linear Relations<br />
Vimy Ridge, in Northern France, was the site<br />
of one of the most infamous battles of<br />
World War I.<br />
In 2007, groups of Canadian high school<br />
students will visit the site to commemorate<br />
the 90th anniversary of the battle.<br />
When they travel to France, students will<br />
convert their money from dollars to Euros.<br />
Investigate<br />
Developing an Equation from a Graph<br />
The price of one currency in terms of another is called the<br />
exchange rate.<br />
Exchange rates vary from day to day.<br />
This graph is based on the average exchange rate in January 2006.<br />
Your teacher will give you a copy of the graph.<br />
Dollars<br />
Relationship between<br />
Euros and Dollars<br />
140<br />
120<br />
100<br />
80<br />
60<br />
40<br />
20<br />
0 20 40 60 80 100<br />
Euros<br />
➢ Does this graph represent direct variation or partial variation?<br />
Explain how you know.<br />
➢ Use the graph.<br />
Determine the value of $70, in Euros.<br />
What is the value of 100 Euros, in dollars?<br />
➢ Determine the rate of change.<br />
What does it represent?<br />
➢ Write an equation for the value, d Canadian dollars, of E Euros.<br />
➢ Use the equation to determine the value of $100, in Euros.<br />
What is the value of 20 Euros, in dollars?<br />
Can you use the graph to determine these values? Explain.<br />
Reflect<br />
➢ What strategies did you use to write the equation of a relationship<br />
given its graph?<br />
➢ When might you want to use the equation rather than the graph?<br />
6.9 Solving Problems Involving Linear Relations 235
Connect the Ideas<br />
Alexei went on a ski trip that cost $1700.<br />
He borrowed the money from his parents to pay for the trip.<br />
Every month, he pays them back the same amount of money.<br />
Alexei’s Loan Repayments<br />
Amount owed ($)<br />
1600<br />
1200<br />
800<br />
400<br />
0<br />
(2, 1200)<br />
(5, 450)<br />
2 4 6 8<br />
Time (months)<br />
Determine the<br />
rate of change<br />
Write a rule<br />
From the graph<br />
After 2 months, Alexei owes $1200.<br />
After 5 months, he owes $450.<br />
So, the rise is: $450 $1200 $750<br />
The run is: 5 months 2 months 3 months<br />
rise<br />
Rate of change <br />
run<br />
$750<br />
3 months<br />
$250/month<br />
This means that every month, Alexei owes $250 less than the<br />
month before.<br />
That is, his payments are $250 each month.<br />
The vertical intercept is $1700.<br />
This represents the amount that Alexei borrowed;<br />
that is, the amount when measurements of time began.<br />
Amount owed $1700 ($250/month time in months)<br />
Write an<br />
equation<br />
Let A dollars represent the amount.<br />
Let t months represent the time.<br />
Then, an equation is: A 1700 250t<br />
236 CHAPTER 6: Linear Relations
We can find out when Alexei will have paid off his loan.<br />
➢ Use the graph.<br />
At 7 months, the amount owed is approximately zero.<br />
This means that Alexei has paid off the loan.<br />
When we add 250t<br />
to each side, then<br />
divide each side<br />
by 250, we are using<br />
inverse operations.<br />
➢ Use the equation.<br />
The amount Alexei owes is $0.<br />
Substitute A 0, then solve for t.<br />
A 1700 250t<br />
0 1700 250t Add 250t to each side.<br />
250t 1700 250t 250t<br />
250t 1700 Divide each side by 250.<br />
250t 1700<br />
250<br />
<br />
250<br />
t 6.8<br />
Since the number of months is a whole number,<br />
it takes Alexei 7 months to pay off his loan.<br />
Practice<br />
Your teacher will provide larger copies of the graphs in this section.<br />
1. For each graph, make a table of values.<br />
a) Taxi Fares<br />
b)<br />
Laurie’s Loan Repayments<br />
Fare ($)<br />
8<br />
6<br />
4<br />
2<br />
Amount owed ($)<br />
800<br />
600<br />
400<br />
200<br />
0 1 2 3 4 5<br />
Distance travelled (km)<br />
0 1 2 3 4 5 6<br />
Time (months)<br />
c)<br />
Relationship between<br />
Mexican Pesos and Dollars<br />
Pesos<br />
800<br />
600<br />
400<br />
200<br />
0 20 40 60 80 100<br />
Dollars<br />
6.9 Solving Problems Involving Linear Relations 237
2. Rosa made this pattern with toothpicks. She continued it for 7 frames.<br />
Frame 1 Frame 2 Frame 3<br />
Rosa drew this graph.<br />
a) Does this graph represent direct variation or<br />
partial variation?<br />
How do you know?<br />
b) Make a table of values to show how many toothpicks<br />
are needed for each frame.<br />
c) Write an equation that relates the number<br />
of toothpicks, T, and the frame number, n.<br />
d) How many toothpicks would you need to build<br />
the 17th frame in this pattern?<br />
Which method did you use to find out?<br />
Toothpicks Used in Pattern<br />
Number of toothpicks<br />
30<br />
20<br />
10<br />
0 2 4 6<br />
Frame number<br />
3. The graph below models the motion of two cars.<br />
a) Use the graph.<br />
Copy and complete the table.<br />
Distance Travelled by Two Cars<br />
Distance (km)<br />
180<br />
160<br />
140<br />
120<br />
100<br />
80<br />
60<br />
Car A<br />
Car B<br />
Time (h) Car A Car B<br />
Distance (km) Distance (km)<br />
0<br />
0.5<br />
1<br />
1.5<br />
2<br />
40<br />
20<br />
0 0.5 1 1.5 2<br />
Time (h)<br />
b) For each car, write an equation that relates<br />
distance, d kilometres, and time, t hours.<br />
c) Which car has the greater average speed? How do you know?<br />
d) How far has each car travelled after 1.75 h?<br />
e) How long does it take each car to travel 110 km?<br />
238 CHAPTER 6: Linear Relations
We can graph a relation from its description.<br />
Example<br />
Solution<br />
Ashok and Katie each recorded a distance for a ball rolling over<br />
a period of time.<br />
Ashok found that the ball rolled 9 m in 3 s.<br />
Katie found that the ball rolled 6 m in 2 s.<br />
a) Draw a distance-time graph for the ball.<br />
Assume the ball continues at the same average speed.<br />
b) When will the ball have rolled 10 m?<br />
c) Write an equation that relates the distance, d metres,<br />
and the time, t seconds.<br />
d) Use the equation.<br />
How far did the ball roll in 8 s?<br />
e) Compare your solutions in parts b and d.<br />
a) Complete a table of values.<br />
Graph the data.<br />
Time, t (s) 0 2 3<br />
Distance, d (m) 0 6 9<br />
The points lie along a straight line<br />
20<br />
that passes through the origin.<br />
15<br />
Extend the line.<br />
10<br />
b) To determine when the ball rolled<br />
5<br />
10 m, use the graph.<br />
From the graph, the ball reached 10 m<br />
Time (s)<br />
after about 3.3 s.<br />
c) The situation is modelled by direct variation.<br />
Distance in metres average speed in m/s time in seconds<br />
The average speed is the rate of change.<br />
The ball rolled 9 m in 3 s.<br />
distance<br />
Average speed <br />
time<br />
9 m<br />
3 s<br />
3 m/s<br />
0 2 4 6 8<br />
The graph will not go<br />
on forever. The ball<br />
will eventually slow<br />
down and stop.<br />
So, distance in metres 3 m/s time in seconds<br />
The equation is: d 3t<br />
d) To determine how far the ball rolled in 8 s, substitute t 8.<br />
d 3 8<br />
24<br />
The ball rolled 24 m in 8 s.<br />
Distance (m)<br />
Distance Rolled by Ball<br />
25<br />
6.9 Solving Problems Involving Linear Relations 239
e) In part b, from the graph, the answer was approximate.<br />
To determine the answer, the graph was extended to the right.<br />
Drawing the graph helps visualize the relationship between<br />
the quantities.<br />
In part d, from the equation, the answer was exact.<br />
4. Liam sells jewellery.<br />
He earns a basic wage, plus commission.<br />
Liam earned $550 when he sold $1000 worth of jewellery.<br />
He earned $750 when he sold $5000 worth of jewellery.<br />
How much does Liam earn when he sells $6000 worth of jewellery?<br />
a) Use a table to solve the problem.<br />
b) Use an equation to solve the problem.<br />
c) Which method in parts a and b do you prefer? Explain.<br />
d) How could you have solved the problem a different way? Explain.<br />
5. Assessment Focus Rain water is collected in a 350-L barrel.<br />
During one storm, the volume of water in the barrel<br />
after 1 min was 65 L.<br />
The volume after 5 min was 125 L.<br />
Suppose water continues to be collected at this rate.<br />
a) How many minutes will it take for the barrel to fill?<br />
b) How many different ways could you determine<br />
the answer to part a?<br />
Describe each way.<br />
Which way do you prefer?<br />
6. Suppose the rate of water collection in question 5 was 12 L per minute.<br />
How many minutes would it take for the barrel to fill?<br />
7. Take It Further Use the table.<br />
a) Write an equation to show the relationship<br />
between the distance, d, and time, t.<br />
b) Describe a situation that could be modelled<br />
by this table and equation.<br />
Time, t (min) 0 1 2 3 4<br />
Distance, d (m) 3 5 7 9 11<br />
Describe how to write an equation of a relationship when you are<br />
given its graph. Use an example in your answer.<br />
240 CHAPTER 6: Linear Relations
6.10 Two Linear Relations<br />
Speed skating is an Olympic sport<br />
that has grown in popularity.<br />
Investigate<br />
Exploring a Pair of Relations<br />
Mei and Zachary are junior speed skaters.<br />
Mei skates at an average speed of 10 m/s.<br />
Zachary skates at an average speed of 9 m/s.<br />
Mei and Zachary have a 1500-m race.<br />
Zachary has a head start of 100 m.<br />
Who wins the race? How do you know?<br />
Reflect<br />
➢ How did you solve the problem?<br />
If you did not draw a graph, work with a partner<br />
to use a graph to solve the problem.<br />
➢ Suppose the race was only 500 m.<br />
Who would have won? How do you know?<br />
➢ Suppose the race was 1000 m.<br />
Who would have won? How do you know?<br />
6.10 Two Linear Relations 241
Connect the Ideas<br />
Recall that<br />
1km 1000 m<br />
So, 2.5 km 2500 m<br />
Diana and Kim live 2.5 km apart.<br />
They leave their homes at the same time.<br />
They travel toward each other’s house.<br />
Diana is on rollerblades.<br />
She skates at an average speed of 250 m/min.<br />
Kim is walking at an average speed of 60 m/min.<br />
We can draw a graph to determine where and when they will meet.<br />
The table below shows the distance each person is<br />
from Kim’s house.<br />
Each minute, Kim walks 60 m and Diana skates 250 m.<br />
Graph the data for each person on the same grid.<br />
Time (min) Kim’s Diana’s<br />
distance (m) distance (m)<br />
0 0 2500<br />
1 60 2250<br />
2 120 2000<br />
3 180 1750<br />
4 240 1500<br />
Distance (m)<br />
Distance from Kim’s House<br />
2500<br />
2000<br />
1500<br />
1000<br />
500<br />
Diana<br />
Kim<br />
0 2 4 6 8 10<br />
Time (min)<br />
How else could this<br />
problem have been<br />
solved?<br />
The lines intersect at approximately (8, 500).<br />
The point of intersection shows where and when the people meet:<br />
after about 8 min and about 500 m from Kim’s house.<br />
Practice<br />
1. One hot air balloon is descending.<br />
Another is ascending.<br />
The graph shows their heights over time.<br />
a) What is the starting height of the<br />
descending balloon?<br />
b) Where do the lines intersect?<br />
What does this point represent?<br />
Height (m)<br />
Hot Air Balloon Heights<br />
300<br />
200<br />
100<br />
0 1 2 3 4 5 6 7<br />
Time (min)<br />
242 CHAPTER 6: Linear Relations
2. Nyla and Richard are travelling toward each other along the same bike path.<br />
Nyla jogs at an average speed of 100 m/min.<br />
Richard bikes at an average speed of 300 m/min.<br />
The table shows their distances, in metres,<br />
relative to Richard’s starting position.<br />
a) To begin, how far apart are they?<br />
b) Copy and complete the table for times up to 30 min.<br />
Graph the data.<br />
c) Where do the lines intersect? What does this point represent?<br />
3. Assessment Focus Hatef and Sophie are participating in a swim-a-thon.<br />
Swimmers may complete a maximum of 50 laps.<br />
Hatef has collected pledges totalling $13 per lap.<br />
Sophie has collected $96 in cash and pledges totalling $5 per lap.<br />
a) Make a table to show how much money each swimmer collects<br />
for completing up to 50 laps. Graph both sets of data on the same grid.<br />
b) What is the most money each person can collect?<br />
c) Where do the lines intersect? What does this point represent?<br />
Two lines on a graph can be used to help make business decisions.<br />
Time Nyla’s Richard’s<br />
(min) distance (m) distance (m)<br />
0 4000 0<br />
5<br />
10<br />
Example<br />
Solution<br />
Julie started a business making bracelets.<br />
Her costs are $180 for tools and advertising, plus $2 in materials<br />
per bracelet. Each bracelet is sold for $17.<br />
a) Write an equation for the total cost, C dollars, to make n bracelets.<br />
b) Write an equation for the revenue, R dollars,<br />
from the sale of n bracelets.<br />
c) Graph both equations on the same grid.<br />
d) Where do the lines intersect?<br />
What does this point represent?<br />
Revenue is the<br />
money Julie gets<br />
when she sells<br />
the bracelets.<br />
a) Total cost (initial costs) (materials cost)<br />
The initial costs are $180.<br />
The materials cost is $2 per bracelet.<br />
The equation is: C 180 2n<br />
b) Revenue (selling price per bracelet) (number of bracelets sold)<br />
The selling price is $17, so R 17n<br />
c) To draw each graph, use the vertical intercept and one other point.<br />
For Total cost, the vertical intercept is 180.<br />
Plot the point (0, 180).<br />
Substitute n 10 in the equation C 180 2n.<br />
C 180 (2 10) 200<br />
Plot the point (10, 200).<br />
6.10 Two Linear Relations 243
Join the points with a broken line and extend the line to the right.<br />
For Revenue, the vertical intercept is 0.<br />
Plot the point (0, 0).<br />
Julie’s Jewellery Business<br />
Substitute n 10<br />
in the equation<br />
R 17n.<br />
R 17 10 170<br />
Plot the point (10, 170).<br />
Join the points<br />
with a broken line<br />
and extend the<br />
line to the right.<br />
250<br />
200<br />
150<br />
100<br />
50<br />
Total cost<br />
Revenue<br />
Number of bracelets<br />
d) The lines intersect at approximately (12, 200).<br />
This is the point where the total cost equals the revenue.<br />
To the left of this point, the Revenue graph is below<br />
the Total cost graph, so Julie makes a loss.<br />
To the right of this point, the Revenue graph is above<br />
the Total cost graph, so Julie makes a profit.<br />
Total cost ($); Revenue ($)<br />
0 2 4 6 8 10 12 14 16<br />
4. The weekly cost of running an ice-cream cart is a fixed cost of $150,<br />
plus $0.25 per ice-cream treat. The revenue is $2.25 per treat.<br />
a) Write an equation for the weekly cost, C dollars,<br />
when n treats are sold.<br />
b) Write an equation for the revenue, R dollars,<br />
when n treats are sold.<br />
c) Graph the equations on the same grid.<br />
d) How many treats have to be sold before a profit is made?<br />
Explain.<br />
5. Take It Further Mark reads at an average rate of 30 pages per hour.<br />
Vanessa reads at an average rate of 40 pages per hour.<br />
Mark started reading a book.<br />
Vanessa started reading the same book when Mark was on page 25.<br />
a) How many hours later will they be reading the same page?<br />
How do you know?<br />
b) How many different ways can you answer part a? Describe each way.<br />
Describe a situation that can be modelled by two lines on a graph.<br />
Explain what the point of intersection represents.<br />
244 CHAPTER 6: Linear Relations
Using a Graphing Calculator to<br />
Determine Where Two Lines Meet<br />
You will need a TI-83 or TI-84 graphing calculator.<br />
Nicole joins a fitness club.<br />
The club offers two types of memberships.<br />
Nicole can pay a monthly fee of $24, plus $2 for each visit.<br />
Or, Nicole can pay $8 per visit.<br />
Which type of membership should Nicole buy?<br />
Let C dollars represent the total monthly cost.<br />
Let n represent the number of times Nicole uses the gym in a month.<br />
The equations are:<br />
C 24 2n<br />
C 8n<br />
The graphing calculator uses X to represent n and Y to represent C.<br />
To match this style, the equations are written as:<br />
Y 24 2X<br />
Y 8X<br />
Follow these steps to graph the equations and determine the<br />
point of intersection.<br />
To make sure there are no<br />
equations in the o list:<br />
Press o.<br />
Move the cursor to any equation,<br />
then press ‘.<br />
When all equations have been<br />
cleared, position the cursor to the<br />
right of the equals sign for Y1.<br />
To enter the equations, press:<br />
©y«©„Ín „<br />
We are only<br />
interested in positive<br />
values of X and Y.<br />
To adjust the window settings<br />
to display the graph:<br />
Press p.<br />
Set the plot options as shown.<br />
To set an option, clear what is<br />
there, enter the value you want,<br />
then press Í.<br />
Use the D key to scroll down the list.<br />
Technology: Using a Graphing Calculator to Determine Where Two Lines Meet 245
Press s. A graph like the one<br />
shown here should be displayed.<br />
The points lie on a line. Since X<br />
is a whole number, each line should<br />
be a series of dots joined with a<br />
broken line. However, the calculator<br />
joins the points with solid lines.<br />
To determine the point<br />
of intersection:<br />
Press y rto access the<br />
CALCULATE menu. Then press z.<br />
Your screen should look like the<br />
one shown here.<br />
Press B to move the flashing point<br />
until it is close to the point<br />
of intersection.<br />
Press ÍÍÍ.<br />
Your screen should look like the<br />
one shown here. The coordinates<br />
of the point of intersection appear<br />
at the bottom of the screen.<br />
• Where do the lines intersect?<br />
• What does this point represent?<br />
• Which type of membership<br />
would you recommend to Nicole?<br />
Explain your thinking.<br />
Use pages 245 and<br />
246 as a guide.<br />
Tyresse practises at the driving range to improve his golf swing.<br />
The driving range offers two payment options:<br />
• Tyresse can pay $6.50 for each bucket of balls he hits.<br />
• Tyresse can purchase a membership for $24.50.<br />
He will then pay $4.75 for each bucket of balls he hits.<br />
➢ Write an equation to represent each payment option.<br />
➢ Use a TI-83 or TI-84 calculator to graph the equations,<br />
using appropriate window settings.<br />
➢ Determine where the lines intersect.<br />
Explain what the point represents.<br />
➢ Which payment option would you recommend to Tyresse?<br />
Explain your thinking.<br />
246 CHAPTER 6: Linear Relations
Chapter Review<br />
What Do I Need to Know?<br />
Both direct variation and partial variation are linear relations.<br />
➢ Direct Variation<br />
A graph that represents direct variation is a straight line<br />
that passes through the origin.<br />
Cost ($)<br />
Snowboard Rental Cost<br />
30<br />
25<br />
20<br />
C = 8t<br />
15<br />
rise: $16<br />
10<br />
5<br />
run: 2 h<br />
0 1 2 3 4 5<br />
Time (h)<br />
Time Cost<br />
t (h) C ($)<br />
0 0<br />
1 8<br />
2 16<br />
3 24<br />
4 32<br />
rise<br />
Rate of change <br />
run<br />
The equation is: C 8t<br />
rate of change is $8/h<br />
First<br />
Differences<br />
8 0 8<br />
16 8 8<br />
24 16 8<br />
32 24 8<br />
Use Frayer models to<br />
show what you<br />
know about direct<br />
variation and partial<br />
variation.<br />
➢ Partial Variation<br />
A graph that represents partial variation is a straight line<br />
that does not pass through the origin.<br />
Cost ($)<br />
Pool Rental Cost<br />
240<br />
220<br />
C = 160 15t<br />
200<br />
rise: $30<br />
180<br />
run: 2 h<br />
160<br />
Time Cost<br />
t (h) C ($)<br />
0 160<br />
1 175<br />
2 190<br />
3 205<br />
4 220<br />
First<br />
Differences<br />
175 160 15<br />
190 175 15<br />
205 190 15<br />
220 205 15<br />
0<br />
1 2 3 4 6<br />
Time (h)<br />
Rate of change <br />
rise<br />
run<br />
fixed cost<br />
variable cost<br />
The equation is: C 160 15t<br />
vertical intercept is $160<br />
rate of change is $15/h<br />
Chapter Review 247
What Should I Be Able to Do?<br />
6.1<br />
1. This pattern continues.<br />
Frame 1 Frame 2 Frame 3<br />
6.4<br />
6.5<br />
3. Does each graph in question 2<br />
represent direct variation or<br />
partial variation?<br />
How do you know?<br />
6.2<br />
6.3<br />
a) Sketch the next frame in<br />
the pattern.<br />
b) Copy and complete the table<br />
below for the first 6 frames.<br />
Frame Number of First<br />
number squares differences<br />
1<br />
2<br />
3<br />
c) Is the relationship linear or<br />
non-linear? Explain.<br />
d) Graph the relationship.<br />
Does the graph support your<br />
answer to part c? Explain.<br />
2. Determine each rate of change.<br />
Explain what it means.<br />
a)<br />
Car Journey<br />
Distance (km)<br />
160<br />
120<br />
80<br />
40<br />
6.4<br />
6.5<br />
4. Ken delivers packets of flyers for<br />
local stores. His pay varies directly as<br />
the number of packets delivered.<br />
Number of 0 100 200 300<br />
packets delivered<br />
Pay ($) 0 25 50 75<br />
a) Graph Pay against Number of<br />
packets delivered.<br />
b) Determine the pay for<br />
250 packets delivered.<br />
c) Suppose Ken wants to earn $100.<br />
How many packets must<br />
he deliver?<br />
d) About how many packets does<br />
Ken have to deliver to earn $140?<br />
5. The cost to rent a snowboard for an<br />
8-h day is $28. If the snowboard is<br />
kept longer, there is an additional<br />
fee per hour.<br />
Number of 0 1 2 3 4<br />
extra hours<br />
b)<br />
Volume (L)<br />
24<br />
16<br />
8<br />
0 0.5 1 1.5 2 2.5<br />
Time (h)<br />
How Water Evaporates<br />
0 1 2 3 4 5<br />
Time (h)<br />
Rental cost ($) 28 31 34 37 40<br />
a) Graph Rental cost against<br />
Number of extra hours.<br />
b) What does the vertical intercept<br />
represent?<br />
c) What is the rate of change?<br />
What does it represent?<br />
d) Write an equation to determine<br />
the rental cost, C dollars, for<br />
t extra hours.<br />
248 CHAPTER 6: Linear Relations
6.6 6.9<br />
6.7<br />
6.8<br />
6. To set up a hot air balloon, the crew<br />
inflates the balloon with cold air.<br />
One fan can blow 450 m 3 of air<br />
in 1 min.<br />
a) Make a table of values for the<br />
volume, V cubic metres, of air in<br />
the balloon when the fan runs for<br />
up to 6 min.<br />
b) Graph the data.<br />
c) Write an equation to determine<br />
the volume V after t minutes.<br />
d) Another fan can blow only half as<br />
much air per minute.<br />
i) How does the graph change?<br />
Draw the new graph on the<br />
grid in part b.<br />
ii) Write the new equation.<br />
7. Solve each equation.<br />
Which tools could you use to<br />
help you?<br />
a) 4x 5 9<br />
b) 3 2x 5<br />
c) 17 5 3x<br />
d) 18 3 5x<br />
e) 7x 6 15<br />
f) 6x 7 23<br />
8. A small pizza with tomato sauce and<br />
cheese costs $6.00.<br />
Each additional topping costs $0.75.<br />
a) Write a rule for the cost of the<br />
pizza when you know how many<br />
additional toppings it has.<br />
b) Write an equation for the cost,<br />
C dollars, of a small pizza when<br />
n toppings are ordered.<br />
c) You have $10.00 to spend.<br />
How many toppings can<br />
you order?<br />
Use two different methods to<br />
find out. Show your work.<br />
6.10<br />
9. The length of a person’s foot is<br />
approximately 15% of his height.<br />
a) What is the approximate foot<br />
length of a person who is<br />
180 cm tall?<br />
b) What is the approximate height<br />
of a person whose foot is<br />
21 cm long?<br />
c) How can you use an equation to<br />
answer these questions?<br />
d) What other methods could you<br />
use to answer parts a and b?<br />
10. Jo-Anne is choosing an Internet<br />
service provider.<br />
• Speed Dot Company costs $2.40<br />
for every hour of Internet use.<br />
• Communications Plus costs $12<br />
per month plus $0.90 for each<br />
hour of Internet use.<br />
a) Write an equation to model the<br />
cost for each billing system.<br />
Use C to represent the total cost,<br />
in dollars, and t to represent the<br />
time in hours.<br />
b) Make a table of values up to 10 h<br />
for each relationship.<br />
Graph both relationships<br />
on the same grid.<br />
c) What are the coordinates of the<br />
point of intersection?<br />
What do they represent?<br />
d) Jo-Anne will use the Internet<br />
about 7 h per month.<br />
Which company should she<br />
choose? Explain your choice.<br />
Chapter Review 249
Practice Test<br />
Multiple Choice: Choose the correct answer for questions 1 and 2.<br />
1. Which equation represents partial variation?<br />
A. C 20n B. C 20n 2 C. C 20n 5 D. C 20n<br />
2. Which equation has the solution x 5?<br />
A. 2x 6 7 B. 2x 5 9 C. 2x 4 11 D. 2x 3 13<br />
Show your work for questions 3 to 6.<br />
3. Knowledge and Understanding<br />
Andy’s pay varies directly as the number of hours he works.<br />
He earns $24 for working a 3-h shift.<br />
a) Graph Andy’s pay against time.<br />
b) Determine the rate of change.<br />
c) How much does Andy earn in 36 h? Explain.<br />
d) How long does it take Andy to earn $216? Explain.<br />
4. Communication The cost to rent a banquet hall<br />
is shown in the graph.<br />
Write 5 different things you can determine<br />
from the graph.<br />
5. Application<br />
400<br />
One ad in a local newspaper cost $70.<br />
200<br />
The ad had 25 words.<br />
Another ad in the same newspaper cost $100.<br />
It had 40 words.<br />
How much would it cost to place an ad with 30 words?<br />
a) Use a graph to solve the problem.<br />
b) Use an equation to solve the problem.<br />
c) Which did you prefer: using a graph or using an equation? Explain.<br />
6. Thinking The school store wants to distribute brochures<br />
describing its products.<br />
The store manager gets bids from two printers.<br />
Printer A charges an initial fee of $280 plus $1 per brochure.<br />
Printer B charges an initial fee of $90 plus $2 per brochure.<br />
Which printer should the manager choose? Explain.<br />
Cost ($)<br />
Cost of Banquet Hall Rental<br />
1000<br />
800<br />
600<br />
0 10 20 30 40 50<br />
Number of guests<br />
250 CHAPTER 6: Linear Relations
What<br />
You’ll Learn<br />
To use different tools to<br />
simplify algebraic expressions<br />
and to solve equations<br />
And Why<br />
To provide further<br />
strategies for problem solving<br />
Project<br />
Link<br />
• It’s All in the Game<br />
Key Words<br />
• zero pair<br />
• term<br />
• like terms<br />
• polynomial<br />
• constant term<br />
• distributive law<br />
• monomial<br />
• coefficient
Doing Your Best on a Test<br />
Taking a math test may be stressful.<br />
Here are some tips that can help you do your best without<br />
getting too stressed.<br />
Getting Ready<br />
– Find out what will be covered on the test.<br />
– Give yourself lots of time to review.<br />
– Look over your notes and examples. Make sure they are complete.<br />
– Get help with difficult questions.<br />
– Make study notes. Use a mind map or a Frayer model.<br />
When You First Get the Test<br />
– Listen to the instructions carefully.<br />
– Ask questions about anything that is not clear.<br />
– Look over the whole test before you start.<br />
– Write any formulas you have memorized at the top of the page<br />
before you begin.<br />
Answering Multiple-Choice Questions<br />
– Read the question and the possible answers carefully.<br />
– Eliminate any possible answer that cannot be correct.<br />
– Answer the question, even if you have to guess.<br />
Answering Other Questions<br />
– Make three passes through the test:<br />
1. Answer all the quick and easy questions.<br />
2. Answer all the questions that you know how to<br />
do but take some work.<br />
3. Work through the more difficult questions.<br />
– Read the questions carefully.<br />
Underline or highlight important information.<br />
Look for key words such as:<br />
compare, describe, determine, explain, justify<br />
– Pace yourself! Don’t get stuck in one place.<br />
When You Have Finished<br />
– Make sure you have answered all the questions.<br />
– Look over your written solutions. Are they reasonable?<br />
Did you show all your thinking and give a complete solution?<br />
252 CHAPTER 7: Polynomials
7.1 Like Terms and Unlike Terms<br />
Algebra tiles are integer tiles and variable tiles.<br />
Positive tiles<br />
represents 1<br />
represents x<br />
Negative tiles<br />
represents –1<br />
represents –x<br />
represents x<br />
2<br />
represents –x<br />
2<br />
Any two opposite tiles add to 0. They form a zero pair.<br />
0 0<br />
0<br />
Investigate<br />
Using Algebra Tiles to Model Expressions<br />
Work with a partner. Repeat each activity 5 times.<br />
Use at least<br />
2 different kinds of<br />
red tiles. Vary the<br />
number and kind of<br />
tiles used.<br />
➢ Place some red algebra tiles on your desk.<br />
Group like tiles together.<br />
Describe the collection of tiles in words and<br />
as an algebraic expression.<br />
➢ Place some red and blue tiles on your desk.<br />
Group like tiles together.<br />
Remove any zero pairs.<br />
Describe the remaining collection of tiles in words and<br />
as an algebraic expression.<br />
Reflect<br />
➢ What are like tiles?<br />
Why can they be grouped together?<br />
➢ How would you represent like tiles algebraically?<br />
➢ Why can you remove zero pairs?<br />
➢ How do you know you have given the simplest name<br />
to a collection of tiles?<br />
7.1 Like Terms and Unlike Terms 253
Connect the Ideas<br />
To organize a collection of algebra tiles, we group like tiles.<br />
There are two x 2 -tiles, three x-tiles, and five 1-tiles.<br />
These tiles represent the expression 2x 2 3x 5.<br />
When a collection contains red and blue tiles,<br />
we group like tiles and remove zero pairs.<br />
0<br />
0<br />
One x 2 -tile, three x-tiles, and two 1-tiles are left.<br />
We write 1x 2 3x 2.<br />
We could also write x 2 3x 2.<br />
The expression x 2 3x 2 has 3 terms: x 2 ,3x, and 2<br />
Terms are numbers, variables, or the products of numbers<br />
and variables.<br />
Terms that are represented by like tiles are called like terms.<br />
The numerical part of<br />
a term is its<br />
coefficient. The<br />
coefficient of 3x 2<br />
is 3. It tells us<br />
that there are<br />
three x 2 -tiles.<br />
x 2 and 3x 2 are like terms.<br />
Each term is modelled with<br />
x 2 -tiles.<br />
In each term, the variable x is<br />
raised to the exponent 2.<br />
–x 2 :<br />
3x 2 :<br />
x 2 and 3x are unlike terms.<br />
Each term is modelled with different<br />
sized tiles.<br />
Each term has the variable x, but the<br />
exponents are different.<br />
–x 2 :<br />
3x :<br />
same shape<br />
different shapes<br />
An expression is simplified when all like terms are combined,<br />
and any zero pairs are removed.<br />
x 2 3x 2 simplifies to 2x 2 .<br />
x 2 3x cannot be simplified.<br />
0<br />
254 CHAPTER 7: Polynomials
Practice<br />
1. Which expression does each group of algebra tiles represent?<br />
a) b) c)<br />
d) e) f)<br />
2. Use algebra tiles to model each expression. Sketch the tiles you used.<br />
a) x 5 b) 2x 2 3 c) x 3<br />
d) x 2 4x e) 4x 2 3x 2 f) 2x 2 x 5<br />
3. The diagram shows the length and width of the 1-tile, x-tile, and x 2 -tile.<br />
1<br />
x<br />
1 1<br />
Determine the area of each tile.<br />
Use your answer to explain the name of the tile.<br />
4. Use algebra tiles to show 2x and 4x.<br />
Sketch the tiles you used.<br />
Are 2x and 4x like terms? Explain.<br />
5. Use algebra tiles to show 3x and 3x 2 .<br />
Sketch the tiles you used.<br />
Are 3x and 3x 2 like terms? Explain.<br />
6. a) Identify terms that are like 3x:<br />
5x,3x 2 ,3,4x, 11, 9x 2 , 3x,7x, x 3<br />
b) Identify terms that are like 2x 2 :<br />
2x, 3x 2 ,4,2x, x 2 , 2, 5, 3x 2<br />
x<br />
x<br />
c) Explain how you identified like terms in parts a and b.<br />
7. In each part, combine like terms. Write the simplified expression.<br />
a) b) c)<br />
d) e) f)<br />
7.1 Like Terms and Unlike Terms 255
8. Combine like terms. Use algebra tiles.<br />
a) 3x 1 2x 3 b) 3x 2 2x 5x 4x 2 c) 2x 2 3x 2x 4 x 2<br />
9. Write an expression with 5 terms that has only 2 terms when it is simplified.<br />
When we need many tiles to simplify an expression, it is easier to use<br />
paper and pencil.<br />
Example<br />
Solution<br />
Simplify.<br />
15x 2 2x 5 10x 8 9x 2<br />
15x 2 2x 5 10x 8 9x 2<br />
15x 2 9x 2 2x 10x 5 8<br />
6x 2 8x 3<br />
Visualize algebra tiles.<br />
Group like terms.<br />
To combine like terms, add their coefficients.<br />
10. a) Simplify each expression.<br />
i) 2 4x 2x 3<br />
ii) 2x 2 3x 4x 2 6x<br />
iii) 3x 2 4x 2 x 2 2x 1<br />
iv) x 2 4x 3 2 5x 4x 2<br />
b) Create an expression that cannot be simplified.<br />
Explain why it cannot be simplified.<br />
Which tools could<br />
you use to help you?<br />
11. Assessment Focus<br />
a) Determine the volume of this cube.<br />
x<br />
b) Use the volume to suggest a name for the cube.<br />
c) Simplify. How can you use cubes to do this?<br />
x<br />
x<br />
i) x 3 2x 3 5x 3 ii) 3x 3 3x x 3 5x iii) 5 2x 3 3x 2 5x 3<br />
12. Take It Further Many kits of algebra tiles contain a second variable tile<br />
called a y-tile.<br />
a) Why does a y-tile have a different length than an x-tile?<br />
b) Sketch algebra tiles to represent 2x 5y 1 4y 7x 4.<br />
c) Write the expression in part b in simplest form.<br />
How do you know it is in simplest form?<br />
x<br />
–x y –y<br />
Create a Frayer model for like terms.<br />
Explain how like terms can be used to write an expression in simplest form.<br />
Use diagrams and examples in your explanation.<br />
256 CHAPTER 7: Polynomials
7.2 Modelling the Sum of Two Polynomials<br />
Expressions such as 3x 2 ,2x 1, and 4x 2 2x 3 are polynomials.<br />
A polynomial can be one term, or the sum or difference of two or<br />
more terms.<br />
Investigate<br />
Using Algebra Tiles to Add Polynomials<br />
Work with a partner.<br />
You will need algebra tiles and a paper bag.<br />
➢ Put the red algebra tiles in a bag.<br />
Take turns to remove a handful of tiles,<br />
then write the polynomial they model.<br />
Add the two polynomials.<br />
Write the resulting polynomial.<br />
➢ Repeat the previous activity with red and blue tiles.<br />
Reflect<br />
➢ How do you model addition with algebra tiles?<br />
➢ Which terms can be combined when you<br />
add polynomials?<br />
Why can these terms be combined?<br />
➢ Compare the original polynomials and the polynomial<br />
for their sum.<br />
What remains the same? What changes? Explain.<br />
7.2 Modelling the Sum of Two Polynomials 257
Connect the Ideas<br />
To add the polynomials 2x 2 5x 3 and x 2 3x 2,<br />
we write (2x 2 5x 3) (x 2 3x 2).<br />
Use algebra tiles<br />
Model each polynomial.<br />
2x 2 5x 3<br />
x 2 3x 2<br />
Combine like terms.<br />
0<br />
0<br />
The remaining tiles represent 3x 2 2x 1.<br />
So, (2x 2 5x 3) (x 2 3x 2) 3x 2 2x 1<br />
Use paper<br />
and pencil<br />
Group like terms and simplify.<br />
(2x 2 5x 3) (x 2 3x 2) Remove the brackets.<br />
2x 2 5x 3 x 2 3x 2 Group like terms.<br />
2x 2 x 2 5x 3x 3 2<br />
Combine like terms.<br />
3x 2 2x 1<br />
You can also add polynomials vertically.<br />
(2x 2 5x 3) (x 2 3x 2)<br />
Align like terms.<br />
Combine like terms.<br />
2x 2 5x 3<br />
x 2 3x 2<br />
3x 2 2x 1<br />
258 CHAPTER 7: Polynomials
Practice<br />
1. Which polynomial sum does each set of tiles represent?<br />
a) b)<br />
<br />
<br />
2. Use algebra tiles to add these polynomials.<br />
Sketch the tiles you used.<br />
a) (2 x 2 ) (3x 2 5) b) (2 x 2 ) (3x 2 5)<br />
c) (2 x 2 ) (3x 2 5) d) (2 x 2 ) (3x 2 5)<br />
3. Add. Use algebra tiles if it helps.<br />
a) (2x 3) (4x 5) b) (9x 5) (7 6x)<br />
c) (x 2) (5x 1) d) (3x 3) (4x 5)<br />
e) (8x 2) (6x 6) f) (3x 2) (x 6)<br />
4. Add. Use algebra tiles if it helps.<br />
a) (3x 2 4x) (5x 2 7x 1) b) (3x 2 4x 2) (5x 2 8x 7)<br />
c) (x 2 2x 1) (3x 2 x 2) d) (x 2 5) (2x 2 2x 3)<br />
e) (3x 2 x 5) (8x 2 3x 1) f) (3x 2 2x 1) (2x 2 3x 4)<br />
5. Add: (3x 3 2x 2 x 1) (2x 3 6x 2 4x 3)<br />
Explain how you did it.<br />
Which tools could<br />
you use to help you?<br />
Polynomials can be used to represent side lengths of figures.<br />
Example<br />
Write a simplified expression for the<br />
perimeter of this rectangle.<br />
2x 3<br />
3x 5<br />
Solution<br />
The perimeter is the sum of the measures of the four sides.<br />
2x 3<br />
2x 3<br />
3x 5<br />
3x 5<br />
10x 16<br />
The perimeter is 10x 16.<br />
7.2 Modelling the Sum of Two Polynomials 259
6. Write an expression for the perimeter of each figure.<br />
Simplify the expression.<br />
a) b)<br />
2x 3 2x 1<br />
x 5<br />
7x 3<br />
Need Help?<br />
Read the Example<br />
on page 259.<br />
5 2x<br />
c) d)<br />
2x 3<br />
x 1<br />
3x 1<br />
7. Choose one of the figures in question 6.<br />
a) Evaluate the unsimplified expression for the perimeter when x 8.<br />
b) Evaluate the simplified expression for the perimeter when x 8.<br />
c) Is it better to substitute into an expression before it is simplified or<br />
after it is simplified? Explain.<br />
8. Create a polynomial that is added to 2x 2 3x 7 to get each sum.<br />
a) 4x 2 5x 9 b) 3x 2 4x 8<br />
c) 2x 2 3x 7 d) x 2 2x 6<br />
e) x 5 f) 4<br />
9. Assessment Focus Two polynomials are added.<br />
Their sum is 3x 2 2x 5.<br />
Write two polynomials that have this sum.<br />
How many different pairs of polynomials can you find?<br />
Which tools did you use to help you?<br />
10. Take It Further The sum of 2 polynomials is 2x 2 7x 3.<br />
One polynomial is 3x 2 5x 2.<br />
What is the other polynomial?<br />
Explain how you found it.<br />
Write two things you know about adding polynomials.<br />
Use an example to illustrate.<br />
260 CHAPTER 7: Polynomials
Using CAS to Add and<br />
Subtract Polynomials<br />
You will need a TI-89 calculator.<br />
Step 1<br />
➢ Clear the home screen:<br />
ÍHOME<br />
ƒ8 ‘<br />
➢ Enter 1 1 1:<br />
1 « 1 « 1 Í<br />
➢ Enter x x x:<br />
«««««Í<br />
X X X<br />
➢ Enter x 2 x 2 x 2 :<br />
«Z2 X ««Z2 X ««Z2 X<br />
Í<br />
➢ Enter 1 x x 2 :<br />
1 ««««Z2 X X Í<br />
Step 2<br />
To add 6x 2 and 3x 4,<br />
we write: (6x 2) (3x 4)<br />
➢ Clear the home screen:<br />
ÍHOME<br />
ƒ8 ‘<br />
➢ Enter (6x 2) (3x 4):<br />
c6« X «2d «c3« X<br />
« 4d Í<br />
➢ Enter (3x 5) (2x 3):<br />
c3« X «5d «c2« X<br />
« 3d Í<br />
➢ Enter (2x 7) (5x 3).<br />
➢ Enter (4x 8) (7x 2).<br />
Step 3<br />
Use paper and pencil to<br />
add these polynomials:<br />
➢ (5x 6) (8x 3)<br />
➢ (3x 3) (2x 5)<br />
Use CAS to check your work.<br />
At the end of Step 1, your<br />
screen should look like this:<br />
At the end of Step 2, your<br />
screen should look like this:<br />
Record the first 3 lines<br />
of the screen on paper.<br />
What patterns do<br />
you see?<br />
Use algebra tiles to<br />
explain the patterns.<br />
Record the last line of<br />
the screen on paper.<br />
Use algebra tiles to<br />
explain why the terms<br />
could not be simplified.<br />
Record the screen<br />
on paper.<br />
Which terms are<br />
combined when<br />
polynomials are added?<br />
What remains the same<br />
when the terms are<br />
combined?<br />
What changes when<br />
the terms are<br />
combined?<br />
Explain any mistakes you<br />
made. How could you<br />
avoid making the same<br />
mistakes in the future?<br />
Technology: Using CAS to Add and Subtract Polynomials 261
Step 4<br />
➢ Clear the home screen:<br />
ÍHOME<br />
ƒ 8 ‘<br />
➢ Enter 3x x:<br />
3« X |«Í X<br />
➢ Enter 3x 2x:<br />
3« X |2« X Í<br />
➢ Enter 3x 3x:<br />
3« X |3« X Í<br />
➢ Continue the pattern until<br />
your screen is like the one<br />
at the right.<br />
Step 5<br />
At the end of Step 4, your<br />
screen should look like this:<br />
Record the screen<br />
on paper.<br />
What remains the<br />
same when terms are<br />
subtracted?<br />
What changes when<br />
terms are subtracted?<br />
To subtract 3x 2 from 6x 4, At the end of Step 5, your Record the screen<br />
we write: screen should look like this: on paper.<br />
(6x 4) (3x 2)<br />
Explain each result.<br />
➢ Clear the home screen:<br />
ÍHOME<br />
ƒ 8 ‘<br />
➢ Enter (6x 4) (3x 2):<br />
c6« X «4d |c3« X<br />
« 2d Í<br />
➢ Enter (3x 5) (2x 3):<br />
c3« X «5d |c2« X<br />
« 3d Í<br />
➢ Enter (2x 3) (5x 7).<br />
➢ Enter (4x 8) (x 2).<br />
Step 6<br />
Use CAS to subtract these<br />
polynomials:<br />
➢ (x 8) (2x 3)<br />
➢ (3x 5) (2x 1)<br />
Explain any mistakes<br />
you made. How could<br />
you avoid making the<br />
same mistakes in the<br />
future?<br />
262 CHAPTER 7: Polynomials
7.3<br />
Modelling the Difference<br />
of Two Polynomials<br />
Investigate<br />
Using Algebra Tiles to Subtract Polynomials<br />
Work with a partner.<br />
You will need algebra tiles.<br />
➢ Subtract.<br />
6 4<br />
5x 2x<br />
(4x 6) (2x 3)<br />
(2x 2 5x 3) (x 2 2x 2)<br />
➢ Subtract.<br />
Add zero pairs so you have enough tiles to subtract.<br />
4 8<br />
2x 3x<br />
(2x 4) (3x 8)<br />
(x 2 2x 1) (3x 2 4x 3)<br />
Reflect<br />
➢ How did you use algebra tiles to subtract polynomials?<br />
➢ Why can you use zero pairs to subtract?<br />
➢ How do you know how many zero pairs you need,<br />
to be able to subtract?<br />
7.3 Modelling the Difference of Two Polynomials 263
Connect the Ideas<br />
To determine: (x 2 2x 1) (2x 2 4x 3)<br />
Use algebra tiles to model x 2 2x 1:<br />
To subtract 2x 2 4x 3, we need to take away<br />
2 red x 2 -tiles, 4 red x-tiles, and 3 blue 1-tiles.<br />
But we do not have these tiles to take away.<br />
So, we add zero pairs that include these tiles.<br />
Adding these tiles<br />
has not changed<br />
the polynomial<br />
represented.<br />
Zero pair for 2x 2 :<br />
Zero pair for 4x:<br />
Zero pair for 3:<br />
Now we can take away the tiles for 2x 2 4x 3.<br />
2x<br />
2<br />
4x<br />
3<br />
The remaining tiles represent 3x 2 6x 4.<br />
So, (x 2 2x 1) (2x 2 4x 3) 3x 2 6x 4<br />
We get the opposite<br />
polynomial by<br />
changing all the<br />
signs of the<br />
coefficients of a<br />
polynomial.<br />
When we subtracted 2x 2 4x 3,<br />
we ended up adding a<br />
polynomial with opposite signs.<br />
That is, we added the opposite<br />
polynomial, 2x 2 4x 3:<br />
This is true in general.<br />
To subtract a polynomial, we add its opposite.<br />
264 CHAPTER 7: Polynomials
Practice<br />
1. Which polynomial difference is represented by these tiles?<br />
2. Simplify these polynomials. Use algebra tiles.<br />
a) (5x 3) (3x 2) b) (5x 3) (3x 2)<br />
c) (5x 3) (3x 2) d) (5x 3) (3x 2)<br />
3. Simplify these polynomials. Use algebra tiles.<br />
a) (3x 2 2x 4) (2x 2 x 1) b) (3x 2 2x 4) (2x 2 x 1)<br />
c) (3x 2 2x 4) (2x 2 x 1) d) (3x 2 2x 4) (2x 2 x 1)<br />
4. Show the opposite of each polynomial using algebra tiles.<br />
Write the opposite polynomial.<br />
a) 3x 2 b) 2x 2 3x c) 4x 2 7x 6 d) x 2 5x 4<br />
We can subtract polynomials using paper and pencil.<br />
Example<br />
Solution<br />
Subtract: (5x 2 2x 4) (7x 2 10x 8)<br />
(5x 2 2x 4) (7x 2 10x 8)<br />
To subtract 7x 2 10x 8, add its opposite 7x 2 10x 8.<br />
(5x 2 2x 4) (7x 2 10x 8)<br />
5x 2 2x 4 (7x 2 10x 8)<br />
5x 2 2x 4 7x 2 10x 8<br />
5x 2 7x 2 2x 10x 4 8<br />
2x 2 12x 12<br />
To check, add the difference to the second polynomial:<br />
(2x 2 12x 12) (7x 2 10x 8)<br />
2x 2 7x 2 12x 10x 12 8<br />
5x 2 2x 4<br />
The sum is equal to the first polynomial.<br />
So, the difference is correct.<br />
5. Simplify.<br />
a) (x 7) (x 5) b) (x 7) (x 5)<br />
c) (x 7) (x 5) d) (x 7) (x 5)<br />
6. Simplify. Check your answers by adding.<br />
a) (2x 2 3) (x 2 1) b) (3x 2 2x) (2x 2 x)<br />
c) (7 4x 2 ) (8 2x 2 ) d) (5x 7x 2 ) (2x 2 2x)<br />
Which tools can you<br />
use to help you?<br />
7.3 Modelling the Difference of Two Polynomials 265
7. Simplify. How could you check your answers?<br />
a) (3x 2 x 1) (x 2 2x 5) b) (x 2 x 1) (x 2 x 1)<br />
c) (2x 2 x 3) (x 2 3x 4) d) (x x 3 5) (7 x x 3 )<br />
e) (7 3x 2x 3 ) (4 3x 3x 3 ) f) (2x 2 3x 5) (2x 2 3x 5)<br />
8. Assessment Focus John subtracted these polynomials:<br />
(2x 2 4x 6) (3x 2 2x 4)<br />
a) Explain why his solution is incorrect.<br />
(2x 2 4x 6) (3x 2 2x 4)<br />
2x 2 4x 6 3x 2 2x 4<br />
2x 2 3x 2 4x 2x 6 4<br />
x 2 2x 2<br />
b) What is the correct answer? Show your work.<br />
c) How could you check your answer?<br />
9. a) Simplify.<br />
i) (3x 2 x) (2x 2 3x) ii) (2x 2 3x) (3x 2 x)<br />
iii) (4x 3 5) (7 2x 3 ) iv) (7 2x 3 ) (4x 3 5)<br />
v) (2x x 3 ) (x 3 2x) vi) (x 3 2x) (2x x 3 )<br />
b) What patterns do you see in the answers in part a? Explain.<br />
c) Write two polynomials.<br />
Subtract them in different orders.<br />
What do you notice?<br />
10. a) i) Write a polynomial.<br />
ii) Write the opposite polynomial.<br />
b) Subtract the two polynomials in part a.<br />
What do you notice about your answer?<br />
c) Compare your answer with those of your classmates.<br />
Is there a pattern? Explain.<br />
11. Take It Further One polynomial is subtracted from another.<br />
The difference is 2x 2 4x 5.<br />
Write two polynomials that have this difference.<br />
How many different pairs of polynomials can you find?<br />
What did you find difficult about subtracting two polynomials?<br />
Use examples to show how you overcame this difficulty.<br />
266 CHAPTER 7: Polynomials
I Have… Who Has?<br />
A game card looks like this:<br />
➢ Divide the class into two teams.<br />
Toss a coin to see which team starts.<br />
Distribute a game card to each student.<br />
Materials<br />
2 sets of game<br />
cards: green<br />
for Team A<br />
and yellow for<br />
Team B<br />
➢ A student from the team that won the coin toss starts.<br />
The student reads her card.<br />
“I have . . . x 1.<br />
Who has . . . 5x 2 3x 2 simplified?”<br />
➢ All students on the second team simplify the expression.<br />
The student whose card has the solution 8x 4 says:<br />
“I have . . . 8x 4.<br />
Who has . . . the opposite of 3x 2 4x 1?”<br />
➢ A team makes a mistake when a student does not respond<br />
or responds incorrectly.<br />
➢ The game ends when all the cards have been called.<br />
The team with the fewer mistakes wins.<br />
Game: I Have . . . Who Has? 267
Mid-Chapter Review<br />
7.1<br />
1. Renata simplified an expression and<br />
got 7 4x 2 2x.<br />
Her friend simplified the same<br />
expression and got 4x 2 2x 7.<br />
Renata thinks her answer is wrong.<br />
Do you agree? Explain.<br />
2. Which expression does each group<br />
of tiles represent?<br />
a) b)<br />
c) d)<br />
7. Add.<br />
a) (5x 4) (3x 5)<br />
b) (4x 3) (5 2x)<br />
c) (7x 2 4x) (3x 2 2)<br />
d) (5x 2 2x 1) (x 2 3x 5)<br />
e) (2x 2 x 1) (x 2 4x 2)<br />
f) (3x 2 4x 2) (4x 2 3x 5)<br />
8. Which polynomial must be added to<br />
5x 2 3x 2 to get 7x 2 5x 1?<br />
9. Write a simplified expression for the<br />
perimeter of each figure.<br />
a)<br />
3. Combine like terms.<br />
a) 5x 6 3x<br />
b) 3x x 2<br />
c) 2x 2 6 x 2 3<br />
d) 5 x 3 2x<br />
e) x 4 6 5x<br />
f) 3x 3 x 2x 3 3x<br />
g) 4x 2 3x 5 5x 2 2x 7<br />
Which tools could<br />
you use to help you?<br />
b)<br />
3x 2<br />
2x 4<br />
x 2<br />
2x 1<br />
7.2<br />
4. Cooper thinks 5x 2 simplifies to 7x.<br />
Is he correct? Explain.<br />
Sketch algebra tiles to support<br />
your explanation.<br />
5. Write an expression with 4 terms<br />
that has only 1 term when it is<br />
simplified.<br />
Explain your thinking.<br />
6. Which polynomial sum do these tiles<br />
represent?<br />
<br />
7.3<br />
10. Write the opposite polynomial.<br />
a) x 3<br />
b) 3x 2 5x<br />
c) 2x 2 3x 7<br />
d) 5x 2 2x 1<br />
11. Subtract.<br />
How could you check your answers?<br />
a) (x 3) (x 4)<br />
b) (7x 2 4x) (x 2 2x)<br />
c) (3x 2 2x 7) (5x 2 3x 2)<br />
d) (2x 2 4x 1) (3x 2 2x 1)<br />
e) (4x 2 2x 1) (4x 2 5x 8)<br />
268 CHAPTER 7: Polynomials
7.4<br />
Modelling the Product of a Polynomial<br />
and a Constant Term<br />
Algebra tiles are area tiles.<br />
The name of the tile tells its area.<br />
Tile Dimensions (units) Area (square units)<br />
1<br />
1-tile 1<br />
(1)(1) = 1<br />
x<br />
x-tile 1<br />
(1)(x) = x<br />
x 2 x<br />
-tile (x)(x) = x<br />
2<br />
x<br />
Investigate<br />
Using Algebra Tiles to Multiply<br />
Work with a partner.<br />
Use algebra tiles.<br />
In each case, sketch the tiles you used.<br />
Remember that<br />
multiplication is<br />
repeated addition.<br />
➢ Display the polynomial 3x 1.<br />
Use more tiles to display the product 2(3x 1).<br />
Combine like tiles.<br />
Write the resulting product as a polynomial.<br />
➢ Display the product 3(3x 1).<br />
Combine like tiles.<br />
Write the resulting product as a polynomial.<br />
➢ Follow the steps above for these products:<br />
4(3x 1)<br />
5(3x 1)<br />
Reflect<br />
➢ What patterns do you see in the polynomials and<br />
their products?<br />
➢ Use these patterns to write the product 6(3x 1)<br />
as a polynomial.<br />
➢ Use the patterns to find a way to multiply without using<br />
algebra tiles.<br />
7.4 Modelling the Product of a Polynomial and a Constant Term 269
Connect the Ideas<br />
Use a model<br />
We can model 3(2x 4) as the area of a rectangle in two ways.<br />
The rectangle has length 2x 4 and width 3.<br />
• Use algebra tiles to label<br />
the length and width.<br />
Use the labels as a guide.<br />
Fill in the rectangle.<br />
2x 4 2x 4<br />
3 3<br />
Six x-tiles and twelve 1-tiles have a combined area of 6x 12.<br />
So, 3(2x 4) 6x 12<br />
• Draw and label a rectangle.<br />
The length of the rectangle is 2x 4.<br />
The width of the rectangle is 3.<br />
So, the area of the rectangle is 3(2x 4).<br />
2x 4<br />
3<br />
A<br />
B<br />
2x 4<br />
We divide the rectangle into two rectangles.<br />
Rectangle A has area: 3(2x) 6x<br />
Rectangle B has area: 3(4) 12<br />
The total area is: 6x 12<br />
So, 3(2x 4) 6x 12<br />
Use paper<br />
and pencil<br />
In algebra, a term<br />
without a variable<br />
is called a<br />
constant term.<br />
We can also determine 3(2x 4) using paper and pencil.<br />
Each term in the brackets is multiplied by the<br />
constant term 3 outside the brackets.<br />
This process is called expanding.<br />
3(2x 4) 3(2x) 3(4)<br />
6x 12<br />
This illustrates the distributive law.<br />
When we use the distributive law to multiply a polynomial<br />
by a constant term, we expand the product.<br />
270 CHAPTER 7: Polynomials
Practice<br />
1. Write the product modelled by each set of tiles. Determine the product.<br />
a) b) c)<br />
2. Use algebra tiles to determine each product. Sketch the tiles you used.<br />
a) 2(4x 1) b) 2(3x 1) c) 5(2x 3) d) 4(4x 3)<br />
3. Write the product modelled by each figure. Determine the product.<br />
a) 2x<br />
7<br />
b)<br />
1 4x<br />
3<br />
3<br />
c) 2x 9<br />
d)<br />
x 8<br />
5<br />
5<br />
4. Use the calculator screens below.<br />
What patterns do you see? Explain each pattern.<br />
Write the next 2 lines in each pattern.<br />
a) b)<br />
We can also use paper and pencil to expand a product.<br />
Example<br />
Solution<br />
Expand: 3(2x 2 3x 4)<br />
3(2x 2 3x 4)<br />
Multiply each term in the brackets by 3.<br />
3(2x 2 3x 4) (3)(2x 2 ) (3)(3x) (3)(4)<br />
(6x 2 ) (9x) (12)<br />
6x 2 9x 12<br />
7.4 Modelling the Product of a Polynomial and a Constant Term 271
5. Expand: 100(4x 2 x 4)<br />
Visualize algebra tiles. Are they useful to determine this product?<br />
Explain.<br />
6. Jessica expands 3(x 2 4x 2) and gets 3x 2 4x 2.<br />
Choose a tool.<br />
Use the tool to explain why Jessica’s answer is incorrect.<br />
7. Multiply.<br />
a) 7(3x 1) b) 3(4x 5) c) 2(6x 4)<br />
d) 5(5x 2 3x) e) 4(2x 2 3) f) 9(x 2 x 6)<br />
8. Expand.<br />
a) 2(4x 2) b) 3(5x 2 3) c) 2(x 4)<br />
d) 7(x 2 5) e) 2(5x 2 x) f) 6(3 2x)<br />
9. Assessment Focus Multiply. Which tools did you use? Explain.<br />
a) 2(x 2 2x 4) b) 3(x 2 3x 7) c) 2(4x 3 2x 2 x)<br />
d) 8(3x 3 2x 2 3) e) 6(2x 2 x 5) f) 4(x 2 3x 3)<br />
10. Square A has side length 4x 1.<br />
Square B has side length that is 3 times as great as that of Square A.<br />
3(4x 1) B<br />
4x 1<br />
A<br />
a) Write an expression for the perimeter of each square.<br />
Simplify each expression.<br />
b) What is the difference in perimeters?<br />
11. Take It Further Explain how you could use algebra tiles to multiply<br />
a polynomial by a negative constant term.<br />
Illustrate with an example.<br />
When can you use algebra tiles to determine the product of a<br />
constant term and a polynomial?<br />
When do you use paper and pencil?<br />
Include examples in your explanation.<br />
272 CHAPTER 7: Polynomials
Using CAS to Investigate<br />
Multiplying Two Monomials<br />
You will need a TI-89 calculator.<br />
Step 1<br />
➢ Clear the home screen: At the end of Step 1, your Record the screen<br />
ÍHOME<br />
ƒ8 ‘ screen should look like this: on paper.<br />
➢ Enter x x:<br />
Write the next 2 lines<br />
in the pattern.<br />
«««Í<br />
X X<br />
➢ Enter x x x:<br />
B««Í X<br />
➢ Continue the pattern of<br />
adding x until your screen<br />
is like the one at the right.<br />
Step 2<br />
➢ Clear the home screen:<br />
ÍHOME<br />
ƒ8 ‘<br />
➢ Enter x times x:<br />
«p«Í<br />
X X<br />
➢ Enter x times x times x:<br />
Bp«Í X<br />
➢ Continue the pattern of<br />
multiplying by x until<br />
your screen is like the one<br />
at the right.<br />
Step 3<br />
At the end of Step 2, your<br />
screen should look like this:<br />
➢ Clear the home screen: At the end of Step 3, your Record the screen<br />
ÍHOME<br />
ƒ8 ‘ screen should look like this: on paper.<br />
➢ Enter x 2x:<br />
Write the next 2 lines<br />
in the pattern.<br />
««2« X X Í<br />
➢ Enter 2x 3x:<br />
2« «3« Í<br />
X<br />
X<br />
➢ Continue the pattern until<br />
your screen is like the one<br />
at the right.<br />
Record the screen<br />
on paper.<br />
Write the next 2 lines<br />
in the pattern.<br />
Compare the results of<br />
Step 1 and Step 2.<br />
How are they different?<br />
Explain.<br />
Technology: Using CAS to Investigate Multiplying Two Monomials 273
Step 4<br />
➢ Clear the home screen:<br />
ÍHOME<br />
ƒ8 ‘<br />
➢ Multiply x by 2x:<br />
pp2p X X Í<br />
➢ Multiply 2x by 3x:<br />
2pX<br />
p3pX<br />
Í<br />
➢ Continue the pattern until<br />
your screen is like the one<br />
at the right.<br />
Step 5<br />
At the end of Step 4, your<br />
screen should look like this:<br />
➢ Clear the home screen: At the end of Step 5, your Record the screen<br />
ÍHOME<br />
ƒ8 ‘ screen should look like this: on paper.<br />
➢ Multiply x by 2x 2 :<br />
Write the next 2 lines<br />
pp2pZ2<br />
in the pattern.<br />
X X Í<br />
Explain the pattern.<br />
➢ Multiply 2x by 3x 2 :<br />
2pX<br />
p3pZ2 X Í<br />
➢ Continue the pattern until<br />
your screen is like the one<br />
at the right.<br />
Step 6<br />
Record the screen<br />
on paper.<br />
Write the next 2 lines<br />
in the pattern.<br />
A polynomial, such as<br />
2x or 3x, is called a<br />
monomial. How is<br />
multiplying monomials<br />
different from adding<br />
monomials?<br />
Use CAS to multiply.<br />
➢ (2x)(6x)<br />
➢ (2x)(6x)<br />
➢ (2x)(6x)<br />
➢ (2x)(6x)<br />
➢ (5x)(5x)<br />
➢ (8x)(3x 2 )<br />
➢ (2x 2 )(3x)<br />
(2x)(6x) means<br />
2x multiplied by 6x.<br />
How could you use<br />
paper and pencil<br />
to multiply two<br />
monomials?<br />
274 CHAPTER 7: Polynomials
7.5 Modelling the Product of Two Monomials<br />
Investigate<br />
Using Algebra Tiles to Multiply Monomials<br />
Use algebra tiles.<br />
In each case, sketch the tiles you used.<br />
Recall that (x)(2x)<br />
means x times 2x.<br />
➢ Build a rectangle x units wide and 2x units long.<br />
Which tiles did you use?<br />
What is the area of the rectangle?<br />
Simplify: (x)(2x)<br />
➢ Show the product: (2x)(2x)<br />
Simplify: (2x)(2x)<br />
➢ Show the product: (3x)(2x)<br />
Simplify: (3x)(2x)<br />
➢ Show the product: (4x)(2x)<br />
Simplify: (4x)(2x)<br />
➢ Show the product: (5x)(2x)<br />
Simplify: (5x)(2x)<br />
Reflect<br />
➢ What patterns do you see in the terms and<br />
their products?<br />
➢ Use these patterns to simplify: (6x)(2x)<br />
➢ Use the patterns to find a way to multiply without using<br />
algebra tiles.<br />
7.5 Modelling the Product of Two Monomials 275
Connect the Ideas<br />
A polynomial with one term is called a monomial.<br />
Here are some monomials: 2x,5,3, 6x 2 , x 3<br />
Use algebra tiles<br />
We can use algebra tiles to determine the product of<br />
some monomials.<br />
To determine (3x)(4x), draw two sides of a rectangle whose length<br />
is 4x and whose width is 3x.<br />
Use paper<br />
and pencil<br />
The term x has<br />
coefficient 1; that is,<br />
x can be written as 1x.<br />
4x<br />
4x<br />
3x<br />
3x<br />
Use algebra tiles to fill the rectangle.<br />
We need twelve x 2 -tiles.<br />
So, (3x)(4x) 12x 2<br />
Look at the product:<br />
4x<br />
(3x)(4x)<br />
The numbers 3 and 4 are coefficients.<br />
3x<br />
To multiply two monomials,<br />
multiply the coefficients: (3)(4) 12<br />
multiply the variables: (x)(x) x 2<br />
So, (3x)(4x) 12x 2<br />
We cannot use algebra tiles to determine a product such as:<br />
(x)(2x 2 )<br />
We use paper and pencil instead.<br />
Multiply the coefficients: (1)(2) 2<br />
Multiply the variables: (x)(x 2 ) (x)(x)(x)<br />
x 3<br />
So, (x)(2x 2 ) 2x 3<br />
Area: 12x<br />
2<br />
276 CHAPTER 7: Polynomials
Practice<br />
1. Write the product modelled by each set of tiles.<br />
Determine the product.<br />
a) b) c)<br />
2. Look at the statements and products in question 1.<br />
How are they alike?<br />
How are they different?<br />
3. Write the product modelled by each set of tiles.<br />
Determine the product.<br />
a) b) c)<br />
Having Trouble?<br />
Read Connect<br />
the Ideas<br />
4. Use algebra tiles to multiply.<br />
a) (x)(3x) b) (x)(5x) c) (3x)(5x) d) (4x)(x)<br />
e) (x)(4x) f) (2x)(6x) g) (7x)(2x) h) (3x)(3x)<br />
5. Look at the calculator screens below.<br />
What patterns do you see?<br />
Explain each pattern.<br />
Write the next 3 lines in each pattern.<br />
a) b)<br />
6. Multiply.<br />
a) (2x 2 )(3x) b) (4x)(x 2 ) c) (x)(3x 2 ) d) (x 2 )(x)<br />
e) (6x 2 )(4x) f) (2x)(8x 2 ) g) (3x 2 )(8x) h) (3x)(3x 2 )<br />
7.5 Modelling the Product of Two Monomials 277
We can use paper and pencil to multiply monomials when there is a negative coefficient.<br />
Example<br />
Solution<br />
Multiply: (3x 2 )(7x)<br />
(3x 2 )(7x)<br />
Multiply the coefficients: (3)(7) 21<br />
Multiply the variables: (x 2 )(x) (x)(x)(x)<br />
x 3<br />
So, (3x 2 )(7x) 21x 3<br />
7. Multiply.<br />
a) (3)(2x) b) (4x)(4) c) (8)(x) d) (5x)(7)<br />
e) (2x)(9) f) (5)(2x) g) (9x)(9) h) (3x)(6)<br />
8. Multiply.<br />
a) (2x 2 )(3x) b) (3x)(4x 2 ) c) (4x)(5x 2 ) d) (x 2 )(x)<br />
e) (4x 2 )(8x) f) (2x)(2x 2 ) g) (x)(12x 2 ) h) (3x)(12x 2 )<br />
Which tools<br />
can you use<br />
to help you?<br />
9. Students who have trouble with algebra often make these mistakes.<br />
➢ They think x x equals x 2 .<br />
➢ They think (x)(x) equals 2x.<br />
Choose a tool.<br />
Use the tool to show how to get the correct answers.<br />
10. Assessment Focus<br />
a) Determine each product.<br />
i) (3x)(5x) ii) (3x)(5x) iii) (3)(5x) iv) (3x)(5)<br />
v) (5x 2 )(3) vi) (5x 2 )(3) vii) (5x 2 )(3) viii) (5x 2 )(3x)<br />
b) List the products in part a that can be modelled with algebra tiles.<br />
Justify your list.<br />
c) Sketch the tiles for one product you listed in part b.<br />
11. Take It Further The product of two monomials is 36x 3 .<br />
What might the two monomials be?<br />
How many different pairs of monomials can you find?<br />
Suppose you have to multiply two monomials.<br />
How do you know when you can use algebra tiles?<br />
When do you have to use paper and pencil?When can you use CAS?<br />
Include examples in your answer.<br />
278 CHAPTER 7: Polynomials
7.6<br />
Modelling the Product of a Polynomial<br />
and a Monomial<br />
Investigate<br />
Using Models to Multiply a Polynomial by a Monomial<br />
Work with a partner.<br />
➢ Determine each product by using algebra tiles and<br />
by using an area model.<br />
2(x 3)<br />
2x(x 3)<br />
➢ Write a different product that involves a monomial and<br />
a polynomial.<br />
Have your partner model your product with algebra tiles<br />
and with a rectangle.<br />
➢ Repeat the previous step for 4 other products.<br />
Take turns to write the product, then model it.<br />
Reflect<br />
➢ What patterns do you see in the products you created<br />
and calculated?<br />
➢ Did you write any products that could not be modelled<br />
with algebra tiles?<br />
If your answer is yes, how did you determine the product?<br />
If your answer is no, try to create a product that you<br />
cannot model with algebra tiles.<br />
Try to find a way to determine the product.<br />
7.6 Modelling the Product of a Polynomial and a Monomial 279
Connect the Ideas<br />
There are 3 ways to expand 3x(2x 4).<br />
Use algebra tiles<br />
Make a rectangle with width 3x and length 2x 4.<br />
Fill in the rectangle with tiles.<br />
2x 4<br />
3x<br />
We use six x 2 -tiles and twelve x-tiles.<br />
So, 3x(2x 4) 6x 2 12x<br />
Use an area<br />
model<br />
Sketch a rectangle with width 3x and length 2x 4.<br />
The area of the rectangle is: 3x(2x 4)<br />
Divide the rectangle into 2 rectangles.<br />
2x 4<br />
3x<br />
A<br />
B<br />
2x 4<br />
Rectangle A has area: (3x)(2x) 6x 2<br />
Rectangle B has area: (3x)(4) 12x<br />
The total area is: 6x 2 12x<br />
So, 3x(2x 4) 6x 2 12x<br />
Use paper<br />
and pencil<br />
3x(2x 4)<br />
Multiply each term in the brackets by the term outside<br />
the brackets.<br />
3x(2x 4) (3x)(2x) (3x)(4)<br />
6x 2 12x<br />
Use the<br />
distributive law.<br />
280 CHAPTER 7: Polynomials
Practice<br />
1. Write the product modelled by each set of tiles.<br />
Determine the product.<br />
a) b)<br />
c) d)<br />
2. Write the product modelled by the area of each rectangle.<br />
Determine the product.<br />
a) 3x 4<br />
b) 2x 3<br />
2x<br />
x<br />
c) 2x 1<br />
d)<br />
x 4<br />
3x<br />
3x<br />
3. Use algebra tiles to expand.<br />
a) x(3x 2)<br />
b) x(4x 6)<br />
c) 3x(2x 1)<br />
d) 4x(3x 4)<br />
4. Use an area model to expand.<br />
a) 4x(x 3)<br />
b) x(2x 3)<br />
c) 2x(x 6)<br />
d) 3x(5x 2)<br />
5. Use the calculator screen at the right.<br />
a) What patterns do you see?<br />
Explain the patterns.<br />
b) Write the next 2 lines in the patterns.<br />
7.6 Modelling the Product of a Polynomial and a Monomial 281
6. Assessment Focus Alex thinks that x(x 1) simplifies to x 2 1.<br />
Choose a tool.<br />
Use the tool to explain how to get the correct answer.<br />
When we cannot use area models, we use paper and pencil.<br />
Example<br />
Solution<br />
Expand: 2x(4x 2 2x 3)<br />
Multiply each term of the polynomial by the monomial.<br />
2x(4x 2 2x 3)<br />
(2x)(4x 2 ) (2x)(2x) (2x)(3)<br />
8x 3 (4x 2 ) (6x)<br />
8x 3 4x 2 6x<br />
7. Expand.<br />
a) 2x(6x 2) b) x(8x 2) c) 5x(x 7) d) x(4x 3)<br />
e) 2x(3x 2 4) f) 4x(2x 3) g) 3x(2x 4) h) x(x 1)<br />
8. Expand.<br />
a) 2x(x 3) b) x(2x 1) c) x(2x 7) d) 3x(2 x)<br />
e) 7x(4x 9) f) –x(2x 3) g) 2x(3x 5) h) 6x(2x 3)<br />
9. Expand. Which method did you use each time?<br />
a) 2x(x 2 2x) b) 3x(3x 2 5x)<br />
c) 4x(8x 2 6) d) 7x(2x 2 3x 1)<br />
e) 2x(4x 2 5x 7) f) 3x(4x 2 3x 9)<br />
g) 2x(x 3x 2 1) h) x(x 2 9 x)<br />
10. Take It Further<br />
This figure shows one rectangle inside another.<br />
Determine an expression for the shaded area.<br />
Simplify the expression.<br />
9x 7<br />
6x 4<br />
x<br />
5x<br />
How is multiplying a polynomial by a monomial like<br />
multiplying a polynomial by a constant?<br />
How is it different?<br />
Use examples to explain.<br />
282 CHAPTER 7: Polynomials
7.7<br />
Solving Equations with More than<br />
One Variable Term<br />
Investigate<br />
Using An Equation to Solve a Problem<br />
Jackie plans to start a business selling silk-screened T-shirts.<br />
She must purchase some equipment at a cost of $3500.<br />
Jackie will spend $6 per shirt on materials.<br />
Jackie’s total cost, in dollars, can be represented by the expression<br />
3500 6x, where x is the number of T-shirts she makes.<br />
Jackie sells each shirt for $11.<br />
Her income in dollars is represented by the expression 11x.<br />
Which tools could<br />
you use to help you?<br />
When Jackie’s income is equal to her total cost, she breaks even.<br />
This situation can be modelled by the equation:<br />
11x 3500 6x<br />
➢ Solve the equation.<br />
How many T-shirts does Jackie need to sell to break even?<br />
Reflect<br />
➢ What strategies did you use to solve the equation?<br />
➢ If you did not use CAS, explain how you could use it to<br />
solve the equation.<br />
➢ Suppose Jackie sold each T-shirt for $13.<br />
What would the equation be?<br />
What would the solution be?<br />
7.7 Solving Equations with More than One Variable Term 283
Connect the Ideas<br />
Each bag contains<br />
the same number<br />
of candies.<br />
We can use balance scales to model the steps to solve an equation.<br />
Let x represent the number of candies in a bag.<br />
There are 6 bags and 2 candies on the left pan.<br />
This is represented by the expression 6x 2.<br />
There are 4 bags and 10 candies on the right pan.<br />
This is represented by the expression 4x 10.<br />
So, the balance scales model the equation: 6x 2 4x 10<br />
To solve the equation, remove<br />
4 bags from each pan.<br />
We now have: 2x 2 10<br />
Remove 2 candies from each pan.<br />
We now have: 2x 8<br />
Divide the candies on the right pan<br />
into 2 equal groups.<br />
Each group contains 4 candies.<br />
So, each bag contains 4 candies.<br />
The solution is: x 4<br />
284 CHAPTER 7: Polynomials
Practice<br />
1. Write the equation represented by each balance scales.<br />
Solve the equation.<br />
Tell how you did it.<br />
a) b)<br />
c) d)<br />
You can use a balance strategy to solve equations with pencil and paper.<br />
Example<br />
Solution<br />
When we<br />
add the<br />
opposite<br />
term, we<br />
use inverse<br />
operations.<br />
Solve: 3 x 4x 42<br />
Check the solution.<br />
3 x 4x 42<br />
There are variables on both sides of the equals sign.<br />
Perform the same operations on each side until the variables<br />
are on one side of the equals sign.<br />
3 x 4x 42 To remove 4x, add 4x to each side.<br />
3 x 4x 4x 42 4x Simplify.<br />
3 5x 42 To remove 3, add 3 to each side.<br />
3 5x 3 42 3<br />
5x 45 To isolate x, divide by 5.<br />
5x<br />
<br />
45<br />
5 5<br />
x 9<br />
Check the solution.<br />
Substitute x 9 in 3 x 4x 42.<br />
L.S. 3 x R.S. 4x 42<br />
3 (9) 4(9) 42<br />
3 9 36 42<br />
6<br />
6<br />
The left side equals the right side.<br />
So, the solution is correct.<br />
7.7 Solving Equations with More than One Variable Term 285
2. Solve. Explain your steps.<br />
a) 7 x 2x b) 3x 4 2x c) 6 2x x<br />
d) 6x 2 7x e) 4x 7 3x f) 3x 2x 8<br />
3. Solve.<br />
a) 3x 4 2x 3 b) 5 9x 11 5x<br />
c) 2 7x 2x 3 d) x 12 30 2x<br />
e) 5 7x 3x 9 f) 11 6x 6x 13<br />
g) 4x 12 2x 18 h) 50 7x 8x 1<br />
4. Choose two of the equations you solved in question 3.<br />
Check your solution.<br />
5. Solve each equation.<br />
a) 2x 12 x 20 b) 6x 15 x 5<br />
c) 12 18x 3x 3 d) 2x 3x 4x 9<br />
e) 5 6x 12 14 7x f) 4x 5x 7 2x 14<br />
6. Assessment Focus Solve each equation.<br />
Show your work.<br />
a) 3x 5 7 3x b) 12 3x x 14<br />
c) 6x 10 3x 8 d) x x 6<br />
e) 9 6x x 2 f) 8x 4 3x 11 4x<br />
7. An auto parts manufacturer buys a machine to produce a specific part.<br />
The machine costs $15 000.<br />
The cost to produce each part is $2.<br />
The parts will sell for $5 each.<br />
Let x represent the number of parts produced and sold.<br />
To break even, the cost, in dollars, 15 000 2x must equal the income 5x.<br />
This can be modelled by the equation: 15 000 2x 5x<br />
Solve the equation.<br />
What does the solution represent?<br />
8. Take It Further Solve each equation.<br />
a) 4(x 3) 3x b) 12(5 x) 72 c) 3(2x 5) x 5<br />
How many different ways can you solve an equation?<br />
Use an example to illustrate your answer.<br />
286 CHAPTER 7: Polynomials
Chapter Review<br />
What Do I Need to Know?<br />
Polynomial<br />
A polynomial is the sum or difference of one or more terms.<br />
Algebra Tiles<br />
We can represent a polynomial with algebra tiles.<br />
2x 2 4x 3<br />
Monomial<br />
A monomial is a polynomial with one term.<br />
2, 3x, 4x 2 , and 5x 3 are examples of monomials.<br />
Constant Term<br />
A constant term is a term without a variable; for example, 5.<br />
Like Terms<br />
Like terms are represented by the same type of algebra tile.<br />
These are like terms:<br />
3x 2 and 2x 2 x and 2x 3 and 2<br />
3x 2 :<br />
x:<br />
3:<br />
2:<br />
2x 2 :<br />
2x:<br />
The Distributive Law<br />
Each term in the brackets is multiplied by the term outside the brackets.<br />
2(4x 2 3x 2) 8x 2 6x 4<br />
Solving an Equation<br />
To solve an equation means to determine the value of the variable that makes<br />
the equation true.<br />
Chapter Review 287
What Should I Be Able to Do?<br />
7.1<br />
7.2<br />
1. Explain why x 2 and 2x are not<br />
like terms.<br />
2. Which expression does each group<br />
of tiles represent?<br />
a)<br />
b)<br />
c)<br />
3. Use algebra tiles to show each<br />
expression.<br />
Sketch the tiles you used.<br />
a) 3x 2 4x 2<br />
b) x 2 6x<br />
4. Simplify.<br />
a) 5 7x 2<br />
b) 4x 6 3x<br />
c) 2x 2 8x x 2 3x<br />
d) 6 3x 3 2x<br />
e) 2x 3 3 6 5x 3<br />
f) 2x 3 x 3x 3 5x<br />
5. Write an expression with<br />
5 terms that has only 3 terms<br />
when simplified.<br />
6. Add. Use algebra tiles.<br />
a) (4x 3) (3x 5)<br />
b) (x 2 6x) (3x 2 7x)<br />
c) (3x 2 1) (2x 2 3)<br />
d) (x 4) (2x 7)<br />
e) (3x 2 2x 5) (4x 2 5x 7)<br />
f) (5x 2 7x 3) (2x 2 3x 2)<br />
g) (x 2 3x 4) (3x 2 4x 3)<br />
7.3<br />
7.4<br />
7. Add. Which tools can you use?<br />
a) (6x 2) (3x 1)<br />
b) (2x 2 6x) (3x 2 2x)<br />
c) (3x 2 6x 8) (5x 2 x 4)<br />
d) (x 2 2x 8) (4x 2 x 3)<br />
8. Subtract. How could you check your<br />
answers?<br />
a) (x 8) (4 x)<br />
b) (x 2 4) (3x 2 5)<br />
c) (7x 2 2x) (5x 2 3x)<br />
d) (4x 2 3x 1) (2x 2 5x 3)<br />
e) (6x 2 5x 1) (2x 2 x 4)<br />
f) (2x 2 7x 9) (x 2 3x 3)<br />
9. Expand.<br />
a) 5(3x 2 4)<br />
b) 4(7 2x)<br />
c) 3(x 3 2x 2 2)<br />
d) 8(2x 2 3x 4)<br />
e) 7(2x 3 1)<br />
10. Expand.<br />
a) 6(x 2)<br />
b) 7(x 2 4)<br />
c) 2(2x 2 1)<br />
d) 5(3x 3 2x 3)<br />
e) 3(x 3 2x 2 4)<br />
Which tools could<br />
you use to help you?<br />
11. Write the next 3 lines in the pattern<br />
shown on the calculator screen.<br />
288 CHAPTER 7: Polynomials
7.5<br />
12. Use algebra tiles to explain why:<br />
a) 3x 2x equals 5x<br />
b) (3x)(2x) equals 6x 2<br />
13. a) Simplify.<br />
i) (8x)(3x)<br />
ii) (2x)(6x)<br />
iii) (4x 2 )(3x)<br />
iv) (9x)(2x 2 )<br />
b) For which products in part a can<br />
you use algebra tiles? Explain.<br />
7.7<br />
17. a) Let x represent the number<br />
of candies in each bag.<br />
Write the equation represented<br />
by the scales.<br />
b) Solve the equation.<br />
c) How many candies are in<br />
each bag?<br />
7.6<br />
14. Expand. For which products can you<br />
use algebra tiles? Explain.<br />
a) x(3x 4)<br />
b) 3x(x 2 8)<br />
c) 2x(4 x)<br />
d) 6x(3x 2 4x 2)<br />
15. Expand.<br />
a) 3x(2x 3)<br />
b) 2x(x 2 5)<br />
c) 5x(3x 7)<br />
d) 2x(4x 2 5x 3)<br />
16. Write the next 3 lines in the pattern<br />
shown on each screen.<br />
a)<br />
b)<br />
18. Solve each equation.<br />
a) 5x 8 x<br />
b) 3x 3 x 7<br />
c) 2x 10 4<br />
19. Solve each equation.<br />
a) 5x 4 8 3x<br />
b) 6 3x x 2<br />
c) 12 x 2x 9<br />
d) 2x 3 6 x<br />
20. A fund-raiser is organized for<br />
hurricane victims. With the purchase<br />
of a $100 ticket, each person is given<br />
a souvenir bracelet (value $20) and<br />
the chance to win a car.<br />
Let x represent the number of<br />
tickets sold.<br />
Then, the income, in dollars, from<br />
ticket sales is 100x.<br />
The expenses, in dollars, are<br />
20 000 20x.<br />
The organizers of the fundraiser<br />
would like to raise $60 000 after all<br />
expenses. This can be modelled by<br />
the equation:<br />
100x 60 000 20 000 20x<br />
a) Solve the equation.<br />
b) What does the solution<br />
represent?<br />
Chapter Review 289
Practice Test<br />
Multiple Choice: Choose the correct answer for questions 1 and 2.<br />
1. Which polynomial is simplified?<br />
A. 3x 4 x 2 8 B. 3x 3 2x x 2 x<br />
C. x 2 6 x D. x 6x x 2 7<br />
2. What is the solution to 80 10x 30x 20?<br />
A. x 3 B. x 3.5<br />
C. x 5 D. x 5<br />
Show your work for questions 3 to 6.<br />
3. Knowledge and Understanding Simplify.<br />
a) (3x 2 4x 1) (2x 2 8x 4)<br />
b) (x 2 3x 2) (2x 2 x 2)<br />
c) 3(x 4)<br />
d) (2x)(3x 2 )<br />
e) 4x(x 2 5x 3)<br />
Which tools could<br />
you use to help?<br />
4. Application The cost to rent a hall for the prom<br />
is $400 for the hall and $30 per person for the meal.<br />
This can be modelled by the equation C 400 30x,<br />
where x is the number of students attending.<br />
a) Suppose 150 students attend.<br />
What will be the cost of the prom?<br />
b) The prom committee has $10 000.<br />
What is the greatest number of students that can<br />
attend with this budget?<br />
5. Communication How can you tell if a polynomial<br />
can be simplified?<br />
Include examples in your explanation.<br />
6. Thinking Joe subtracted (4x 2 3x) (2x 2 5x 4).<br />
He got the answer 2x 2 8x 4.<br />
a) What mistake did Joe likely make? Explain.<br />
b) Determine the correct answer.<br />
c) How could you check your answer is correct?<br />
290 CHAPTER 7: Polynomials
Chapters 1–7<br />
Cumulative Review<br />
CHAPTER<br />
1<br />
1. Determine the perimeter and area of<br />
each figure. The curve is a semicircle.<br />
a)<br />
10 cm<br />
6 cm<br />
7 cm<br />
8 cm<br />
b)<br />
5. A patio is to be built on the side<br />
of a house using 48 congruent<br />
square stones. It will then be<br />
surrounded by edging on the<br />
3 sides not touching the house.<br />
Which designs require the<br />
minimum amount of edging?<br />
Include a labelled sketch in<br />
your answer.<br />
2. Determine the volume of each object.<br />
c)<br />
6 cm<br />
a) 4 cm b)<br />
6 cm<br />
5 cm<br />
2 cm<br />
10 cm<br />
3<br />
6. Can a right triangle have an obtuse<br />
angle? Explain.<br />
7. Determine the angle measure<br />
indicated by each letter.<br />
Justify your answers.<br />
a)<br />
d<br />
30<br />
105<br />
a<br />
8 cm<br />
8 cm 20 cm<br />
b)<br />
b c<br />
d) 13 cm e)<br />
5 cm<br />
12 cm<br />
x<br />
y z<br />
100<br />
a d<br />
b c<br />
2<br />
3. a) For each perimeter, determine the<br />
dimensions of the rectangle with<br />
the maximum area.<br />
i) 40 cm ii) 68 m iii) 90 cm<br />
b) Calculate the area of each<br />
rectangle in part a. How do you<br />
know each area is a maximum?<br />
4. Determine the dimensions of a<br />
rectangle with area 144 cm 2 and<br />
the minimum perimeter.<br />
What is the minimum perimeter?<br />
c)<br />
m<br />
p<br />
50<br />
8. Determine the measure of one<br />
exterior angle of a regular polygon<br />
with each number of sides.<br />
Show your work.<br />
a) 5 sides b) 9 sides c) 10 sides<br />
n<br />
Cumulative Review 291
CHAPTER<br />
4<br />
5<br />
9. Determine the value of each variable.<br />
a) 25 = 6n b) 3b = 742<br />
c) a15 = 410 d) 912 = 15m<br />
10. Determine each unit rate.<br />
a) 288 km driven in 4 h<br />
b) $3.79 for 3 kg of apples<br />
c) $51 earned for 6 h of work<br />
d) 9 km hiked in 2.5 h<br />
e) $3.49 for 6 muffins<br />
11. Maria is swimming lengths. She swims<br />
2 lengths in 1.5 min. At this rate:<br />
a) How far can she swim in 9 min?<br />
b) How long will it take her to swim<br />
30 lengths?<br />
12. A bathing suit is regularly priced at<br />
$34.99. It is on sale at 30% off.<br />
a) What is the sale price?<br />
b) How much does the customer pay,<br />
including taxes?<br />
13. Tomas borrows $2500 for 6 months.<br />
The annual interest rate was 3%.<br />
a) How much simple interest does<br />
Tomas pay?<br />
b) What does the loan cost Tomas?<br />
14. Your teacher will give you a large<br />
copy of the scatter plot below.<br />
Distance (m)<br />
72<br />
70<br />
68<br />
Women’s Discus<br />
Throw World Records<br />
66<br />
0<br />
1972 1976 1980<br />
Year<br />
a) What does the scatter plot show?<br />
b) What was the world record in<br />
women’s discus in 1975? In 1980?<br />
c) In what year was the world record<br />
about 70 m?<br />
d) Draw a line of best fit.<br />
e) Estimate the world record in 1984.<br />
Explain how you did this.<br />
15. Here are the dimensions of some<br />
rectangles with perimeter 30 cm.<br />
Width (cm) 1 2 3 4 5 6 7<br />
Length (cm) 14 13 12 11 10 9 8<br />
a) Is the relationship between<br />
length and width linear?<br />
Justify your answer.<br />
b) Graph the data.<br />
Does the graph illustrate your<br />
answer to part a? Explain.<br />
c) Use the graph.<br />
i) Determine the length when<br />
the width is 5.5 cm.<br />
ii) Determine the width when<br />
the length is 13.5 cm.<br />
d) Write a rule for the relationship.<br />
16. A baseball is thrown up into the air.<br />
Its height is measured every 0.2 s.<br />
Time (s) 0 0.2 0.4 0.6 0.8 1.0 1.2<br />
Height (m) 1.0 2.1 2.8 3.0 2.9 2.5 1.6<br />
a) Graph the data.<br />
b) Draw a curve or line of best fit.<br />
c) What is the greatest height<br />
the ball reaches?<br />
d) When will the ball hit the ground?<br />
e) At what times is the ball 2 m<br />
above the ground?<br />
292 Chapters 1–7
CHAPTER<br />
6<br />
17. The graph shows Tyler’s distance from<br />
his home as he drives to his cottage.<br />
Distance from home (km)<br />
120<br />
90<br />
60<br />
30<br />
Tyler’s Drive<br />
B<br />
A<br />
0 50 100<br />
Time (min)<br />
a) Describe Tyler’s drive.<br />
b) Tyler makes 2 stops:<br />
one to buy gas and another<br />
to pick up his cousin.<br />
Which part of the graph do you<br />
think represents each stop?<br />
Justify your answers.<br />
18. This pattern is made of toothpicks.<br />
It continues.<br />
C<br />
D<br />
E<br />
F<br />
Frame 1 Frame 2 Frame 3<br />
a) Sketch the next frame in the<br />
pattern.<br />
b) Copy and complete the table<br />
below for the first 6 frames.<br />
Is the relation linear or non-linear?<br />
Explain.<br />
Frame<br />
number<br />
1<br />
2<br />
3<br />
Number of<br />
toothpicks<br />
First<br />
differences<br />
c) Graph the relationship.<br />
Does the graph support your<br />
answer to part b? Explain.<br />
19. The table shows the value in<br />
Philippine pesos of different amounts<br />
in Canadian dollars in early 2006.<br />
Amount in dollars 10 55 48 20 36<br />
Amount in pesos 450 2475 2160 900 1620<br />
a) Graph the data.<br />
Does the graph represent<br />
direct variation? Explain.<br />
b) Determine the rate of change.<br />
Explain what it represents.<br />
c) Write an equation for the value,<br />
p pesos, of d dollars.<br />
d) Determine the value of $175.<br />
e) Determine the value of 7500 pesos.<br />
f) How did you answer parts d and e?<br />
Did you use the table, graph,<br />
or equation? Explain.<br />
20. Refer to question 19.<br />
In early 1999, $1 was worth about<br />
25 Philippine pesos.<br />
a) How would the graph change?<br />
Draw the new graph on the grid<br />
in question 19.<br />
b) How would the equation change?<br />
Write the new equation.<br />
21. Sunil is joining a tennis club for<br />
the summer. The club offers a special<br />
10-week summer membership for<br />
students. It costs $50, plus $3.50 per<br />
hour of court time.<br />
a) Make a table. Show the total costs<br />
for times played from 0 h to 60 h.<br />
Cumulative Review 293
CHAPTER<br />
b) Graph the data. Does the graph<br />
represent direct variation? Explain.<br />
c) Write an equation to determine<br />
the total cost, C dollars, when<br />
n hours of tennis are played.<br />
d) Suppose Sunil has budgeted<br />
$200 for tennis costs.<br />
How many hours can he play?<br />
How did you determine your<br />
answer?<br />
22. Refer to question 21. The tennis<br />
club also offers a special 10-week<br />
summer membership for adults.<br />
It costs $75, plus $4.00 per hour<br />
of court time.<br />
a) How would the graph change?<br />
Draw the new graph on<br />
the grid in question 21.<br />
b) How would the total cost equation<br />
change? Write the new equation.<br />
c) How many hours could an<br />
adult play if her budget for<br />
tennis is $200?<br />
23. The daily cost of running a sausage<br />
cart is a fixed cost of $40,<br />
plus $1 per sausage.<br />
The revenue is $3 per sausage.<br />
a) Write an equation for the daily<br />
cost, C dollars, in terms of n,<br />
the number of sausages sold.<br />
b) Write an equation for the revenue,<br />
R dollars, in terms of n.<br />
c) Graph the equations on the<br />
same grid.<br />
d) How many sausages have to be<br />
sold before a profit is made?<br />
Explain.<br />
7<br />
24. What expression does each group<br />
of algebra tiles represent?<br />
a)<br />
b)<br />
25. Simplify each expression by<br />
combining like terms.<br />
a) 8x 3 x<br />
b) 3x 2 7x x 2 4x<br />
c) 10 2x 5 2x<br />
d) 3x 3 6x 2x 3 2x<br />
26. Add. Which tools can you use?<br />
a) (5x 3) (6x 7)<br />
b) (2x 2 9x) (4x 3x 2 )<br />
c) (x 2 3x 1) (3x 2 7x 2)<br />
27. Subtract.<br />
How could you check your answers?<br />
a) (2x 5) (x 2)<br />
b) (7x 2 8) (6x 2 – 3)<br />
c) (5x 2 x 2) (2x 2 3x 3)<br />
28. Expand.<br />
a) 6(5 2x) b) 2(x 3 3x 2 3)<br />
c) 3(3x 1) d) 4(2x 3 5x 2 )<br />
e) x(2x 7) f) 3x(7 3x)<br />
g) 2x(2x 2 3) h) 2x(3x 2 4x 5)<br />
29. Solve each equation.<br />
How could you check your answer?<br />
a) 7x 6 10 3x<br />
b) 8 5x x 4<br />
c) 9 3x 5x 3<br />
d) 2x 2 4 x<br />
294 Chapters 1–7
Chapter 1 Measuring Figures and Objects<br />
1.1 Measuring Perimeter and Area, page 5<br />
1. a) P = 28 m; A = 45 m 2<br />
b) P =Æ 50.27 cm; A =Æ 201.06 cm 2<br />
c) P = 60 cm; A = 120 cm 2<br />
2. a) P = 26 cm; A = 24 cm 2<br />
b) P = 62 cm; A = 204 cm 2<br />
c) P =Æ 25.7 cm; A =Æ 39.27 cm 2<br />
3. a) P = 13 cm; A = 10.36 cm 2<br />
b) P = 11.2 cm; A = 3.9 cm 2<br />
c) P = 33.3 cm; A =Æ 51.8 cm 2<br />
4. The area of the sail is about 2.6 m 2 .<br />
5. About 2356 cm; 23.56 m<br />
Reanne needs about 24 m of plastic tubing.<br />
6. 369.6 cm 2<br />
7. a) 8 cm b) 4 cm<br />
8. 6 m<br />
5. a) The offset is about 34 cm long.<br />
b) The result is reasonable. The offset should<br />
be greater than 24 cm.<br />
6. 4.5 m<br />
7. a) Yes; 3 2 + 4 2 = 5 2<br />
b) No; 2.5 2 + 5.6 2 ≠ 6.4 2<br />
c) Yes; 9.6 2 + 12.8 2 = 16 2<br />
8. a) 12 cm<br />
b) About 2.5 m<br />
c) 2 m<br />
9. About 5.7 cm or about 2.8 cm<br />
10. a)<br />
9. a) 120 cm<br />
b) 105 cm<br />
The sum of the lengths of the 3 sides<br />
is 300 cm.<br />
10. a) About 38 cm<br />
b) No. Since the diameter of the circle of wire is<br />
about 38 cm, it will not fit around a circular tube<br />
with diameter 40 cm.<br />
1.2 Measuring Right Triangles, page 9<br />
1. a) 10 cm<br />
b) 13 cm<br />
c) About 11.3 m<br />
2. a) About 6.8 cm b) About 6.5 m<br />
c) About 16.6 m<br />
3. About 3.4 km<br />
4. P = 36 cm<br />
The ladder reaches up the wall about 4.8 m.<br />
Yes. One quarter of 4.8 m is 1.2 m. The ladder<br />
is positioned safely.<br />
1.3 Area of a Composite Figure, page 12<br />
1. a) 16 cm 2 b) 12 cm 2<br />
c) 14 cm 2<br />
2. a) 25 cm 2 b) 48 cm 2<br />
c) 29 cm 2<br />
3. a) 600 cm 2 b) 24 m 2<br />
c) 1575 cm 2<br />
4. a) 151 m 2 b) About 317.5 cm 2<br />
5. a) 33 m 2 b) 94.5 m 2<br />
c) About 31.4 m 2<br />
The answers are reasonable. Justifications may<br />
vary. For example: In part a, the area of the<br />
composite figure should be less than the area of a<br />
square with side length 6 m. In part b, the area of<br />
the composite figure should be a little less than the<br />
area of a parallelogram with base 15 m and height<br />
7 m. In part c, the area of the composite figure<br />
should be less than the area of the semicircle<br />
with radius 6 m, but greater than the area of the<br />
semicircle with radius 4 m.<br />
6. a) 13.5 m 2<br />
b) 135 000 cm 2<br />
ANSWERS 311
7. a)<br />
c) 900 cm 2<br />
d) 150 tiles; 135 000 cm 2 ÷ 900 cm 2 = 150<br />
6. Answers may vary. For example:<br />
b) 39 m 2<br />
c) 156 bags<br />
d) $357.24<br />
1.4 Perimeter of a Composite Figure, page 16<br />
1. a) i) 24 cm<br />
ii) 24 cm<br />
iii) 22 cm<br />
iv) 22 cm<br />
b) The perimeters in part a are equal in pairs:<br />
i and ii, iii and iv.<br />
All 4 composite figures start from a 6-cm by<br />
4-cm rectangle, but:<br />
Part i: has an extra equilateral triangle on one<br />
of the 4-cm sides<br />
Part ii: has an equilateral triangle on one of the<br />
4-cm sides removed<br />
Part iii: has an isosceles triangle on one of the<br />
6-cm sides removed<br />
Part iv: has an extra isosceles triangle on one<br />
of the 6-cm sides<br />
So, the areas are different.<br />
2. About 26.2 m<br />
3. a) P =Æ 117.2 cm<br />
b) Yes, the result is reasonable. The perimeter of<br />
the composite figure should be at least double<br />
the perimeter of the interior square.<br />
4. a) About 60.1 cm<br />
b) About 86.8 cm<br />
5. a) i) About 52.6 m<br />
40 m of edging are needed for the<br />
rectangular patio, about 12.6 m of edging<br />
are needed around the circular fish pond.<br />
ii) About $252<br />
b) i) About 83.4 m 2<br />
ii) About $3753<br />
c) I made the assumption that I could buy<br />
fractions of a metre of edging and fractions of a<br />
square metre of sandstone.<br />
P = 23 cm<br />
P = 23 cm<br />
A = 19.5 cm 2 A = 28.5 cm 2<br />
7. a) 17 m<br />
b) About 4 rolls<br />
c) About $60<br />
Chapter 1 Mid-Chapter Review, page 20<br />
1. a) A = 6.25 m 2 ; P = 10 m<br />
b) A =Æ 6.16 m 2 ; P =Æ 8.8 m<br />
c) A = 5.04 m 2 ; P = 9.4 m<br />
2. Answers may vary. For example: Yes, I used the<br />
formulas for the area and perimeter of a square,<br />
a circle, and a trapezoid.<br />
3. a) A =Æ 565 cm 2 ; P =Æ 30.85 cm<br />
b) A =Æ 15.6 cm 2 ; P = 18 cm<br />
4. a) About 8.1 m b) About 13.2 cm<br />
5. a) P = 43 cm<br />
b) P = 43.4 cm<br />
6. a) c = 17 m b) h = 6.6 m<br />
7. a) P = 52 cm; A = 104 cm 2<br />
Explanations may vary. For example: I know<br />
my results are reasonable because the area<br />
should be less than the area of a 12-cm by<br />
10-cm rectangle.<br />
b) P = 25.4 m; A = 40.3 m 2<br />
Explanations may vary. For example: I know<br />
my results are reasonable because the area<br />
should be less than the area of a 6-m by 8-m<br />
rectangle.<br />
8. Andrew needs just a little more than 6 cans of paint.<br />
1.5 Volumes of a Prism and a Cylinder, page 23<br />
1. a) 216 cm 3<br />
b) 3456 cm 3<br />
c) 512 cm 3<br />
2. a) 36 cm 3<br />
b) 192 cm 3<br />
c) 1728 m 3<br />
3. a) About 4423.4 m 3<br />
b) About 942.5 cm 3<br />
c) About 1131 cm 3<br />
312 ANSWERS
4. a) 486 cm 3<br />
5. a)<br />
b) Yes. The party-pack box of pasta serves<br />
32 people. If each dimension is doubled, the<br />
volume is 2 × 2 × 2, or 8 times as great; so, the<br />
party-pack will serve 8 times as many people<br />
as the regular size: 4 × 8 = 32<br />
The cylindrical bale has a greater volume.<br />
V rectangular bale = 21 000 cm 3 , or 0.021 m 3<br />
V cylindrical bale = 2 120 575 cm 3 , or about 2.1 m 3<br />
b) About 100<br />
6. a) 684 m 3<br />
b) Yes; 0.021 m 3 × 1000 = 21 m 3<br />
21 m 3 < 684 m 3<br />
c) No; 2.1 m 3 × 1000 = 2100 m 3<br />
2100 m 3 > 684 m 3<br />
7. a) V = 70 cm 3<br />
b) V = 78 cm 3<br />
8. a) About 5132 cm 3<br />
b) About 6.2 kg<br />
1.6 Volume of a Pyramid, page 26<br />
1. Prism: V = 216 cm 3 ; pyramid: V = 72 cm 3<br />
2. a) 1500 cm 3<br />
b) About 46.7 m 3<br />
c) 2250 cm 3<br />
3. a) 80 m 3<br />
4. a)<br />
b) 306 cm 3<br />
c) 522.5 m 3<br />
b) About 167 517 m 3 of rock have been lost,<br />
perhaps due to wind and water erosion.<br />
5. a) About 11 m 3<br />
b) Answers may vary.<br />
6. a) 208 cm 3<br />
b) Explanations may vary. For example: There is<br />
probably some air inside the package as well.<br />
Water expands as it freezes.<br />
7. a) About 15.3 cm<br />
b) About 999.6 cm 3<br />
8. About 452 m<br />
1.7 Volume of a Cone, page 31<br />
1. a) 14 cm 3<br />
b) 6.4 cm 3<br />
2. a) About 9.42 cm 3 (cylinder); about 3.14 cm 3<br />
(cone)<br />
b) About 92.4 cm 3 (cylinder); about 30.8 cm 3<br />
(cone)<br />
3. a) About 301.6 cm 3<br />
b) About 28.3 cm 3<br />
c) About 194.4 m 3<br />
4. About 113.1 cm 3<br />
5. a) h = 4 cm; V = 37.7 cm 3<br />
b) h = 7.1 m; V = 285.8 m 3<br />
c) h = 7.5 cm; V = 502.7 cm 3<br />
6. a) About 13.2 m 3<br />
b) Answers may vary. For example: It should be<br />
one-third the volume of a related cylinder.<br />
7. About 153 million cubic metres, or 0.15 km 3<br />
1.8 Volume of a Sphere, page 35<br />
1. Cylinder: about 785.4 cm 3 ; sphere: about 523.6 cm 3<br />
2. About 1436.8 cm 3<br />
3. a) About 4188.8 cm 3<br />
b) About 268.1 m 3<br />
c) About 179.6 cm 3<br />
4. a) About 3053.6 m 3<br />
b) About 1436.8 cm 3<br />
c) About 310.3 cm 3<br />
5. a) About 4 breaths; I assumed the student<br />
emptied only part of his lungs with one breath.<br />
b) Answers will vary. For example: It usually takes<br />
me 5 or 6 breaths to blow up a balloon.<br />
6. a) 2744 cm 3<br />
b) 14 cm<br />
c) About 1436.8 cm 3<br />
d) 1307.2 cm 3<br />
Answers may vary. For example: I assumed<br />
Lyn will make the largest possible wooden ball<br />
and that her ball will be spherical.<br />
7. a) About 19 scoops<br />
b) About 23¢ per scoop<br />
c) 17¢ per cone; single-scoop ice-cream cone:<br />
40¢ (or about 50¢); double-scoop ice-cream<br />
cone: 63¢ (or about 75¢). I rounded up to<br />
the nearest quarter so Meighan could make<br />
a profit.<br />
Chapter 1 Review, page 38<br />
1. a) P = 30 cm; A = 40 cm 2<br />
b) C = 37.7 cm; A = 113.1 cm 2<br />
2. a) 4356 cm 2<br />
b) 3744 cm 2<br />
3. a) 15 cm<br />
b) 18 cm<br />
4. About 4.9 m<br />
ANSWERS 313
5. About 61.6 cm 2<br />
6. About 5731.83 cm 2<br />
7. About 81.2 cm<br />
8. a) About 51.4 cm<br />
b) The answer is reasonable. The perimeter<br />
should be a little longer than the perimeter of a<br />
10-cm by 10-cm square; that is, a little larger<br />
than 40 cm<br />
9. a) 1820 cm 3<br />
b) About 2152.8 cm 3<br />
10. a) 16 people; the new volume is 2 × 2, or 4 times<br />
as great. 4 people × 4 = 16 people<br />
b) 32 people; the new volume is 2 × 2 × 2, or<br />
8 times as great. 4 people × 8 = 32 people<br />
11. 560 cm 3<br />
12. a) 1880 m 3<br />
b) The volume of the pyramid is one-third the<br />
volume of a square prism with a 20-m by 20-m<br />
square base and height 14.1 m.<br />
V pyramid = 1 3 × Vprism<br />
1880 = 1 3 × 5640<br />
The answer is reasonable.<br />
13. a) 28 cm 3<br />
b) 6 cm<br />
c) 2 cm; 14 cm 2 × 2 cm = 28 cm 3<br />
14. h = 51.5 cm; V = 26 102.4 cm 3<br />
15. a) About 2482.7 cm 3<br />
b) About 7238.2 m 3<br />
16. a) About 43 396.8 cm 3<br />
b) Answers may vary. For example: the volume<br />
of the sphere is two-thirds the volume of a<br />
cylinder into which the sphere just fits.<br />
Chapter 1 Practice Test, page 40<br />
1. C<br />
2. C<br />
3. a) About 16.6 cm<br />
b) About 8.9 m<br />
4. a) The hypotenuse of the right triangle: about<br />
640 m; park’s area: 292 000 m 2<br />
b) About 2151 m<br />
5. No. 24 2 + 17 2 ≠ 29 2<br />
6. About 12 bags. I assumed that there was no room<br />
left between the bags in the cylindrical cooler.<br />
Chapter 2 Investigating Perimeter and Area<br />
of Rectangles<br />
2.1 Varying and Fixed Measures, page 45<br />
1. a) The lengths of line segments AP and PB vary.<br />
b) The length of line segment AB stays the same.<br />
2. a) The measures of arc AB and of ∠BOA vary.<br />
b) The lengths of radii OA and OB stay the same.<br />
The circumference stays the same.<br />
3. a) The lengths of line segments AC, AD, and<br />
AB, and the measures of ∠BAC, ∠DAB, and<br />
∠CBA vary.<br />
b) The lengths of line segments BC and CD and<br />
the measure of ∠ACB remain the same.<br />
4. a) P = 120 cm, A = 875 cm 2<br />
b) Answers may vary. For example:<br />
The perimeter will stay the same (the sum of<br />
width and length stays the same). The area<br />
will change.<br />
c) P = 120 cm, A = 800 cm 2<br />
Yes. The perimeter stays the same.<br />
The area decreases.<br />
5. a) The perimeter will increase. The area will stay<br />
the same, since length × width stays the same.<br />
b) Yes. P = 165 cm, A = 875 cm 2<br />
6. a) Answers may vary. For example:<br />
1 unit by 9 units, 2 units by 8 units, 3 units by<br />
7 units, 4 units by 6 units, 5 units by 5 units<br />
b) Answers may vary. For example:<br />
1 unit by 15 units, 2 units by 14 units, 3 units by<br />
13 units, 4 units by 12 units, 5 units 11 units<br />
314 ANSWERS
7. a) Answers may vary.<br />
b) Line segment AC and ∠C stay the same.<br />
b) Answers may vary.<br />
2.2 Rectangles with Given Perimeter or Area, page 51<br />
1. a)<br />
8. a)<br />
Length<br />
(cm)<br />
Width<br />
(cm)<br />
Perimeter<br />
(cm)<br />
Area<br />
(cm 2 )<br />
4 4 16 16<br />
5 3 16 15<br />
6 2 16 12<br />
7 1 16 7<br />
b) No. Rectangles with the same perimeter have<br />
different areas.<br />
c)<br />
b) i and iii have the same perimeter, 20 cm.<br />
The sum of the length and width is equal, 10 cm.<br />
ii and iv have the same perimeter, 22 cm.<br />
The sum of the length and width is equal, 11 cm.<br />
c) ii and iii have the same area. The product of the<br />
length and width is 24 cm 2 .<br />
d) Yes. For example: i and iii have the same<br />
perimeter, 20 cm, but different areas: i) 16 cm 2<br />
and iii) 24 cm 2<br />
e) Yes. For example: ii and iii have the same area,<br />
24 cm 2 , but different perimeters: ii) 22 cm and<br />
iii) 20 cm<br />
2. a), b)<br />
Width<br />
(cm)<br />
Length<br />
(cm)<br />
Perimeter<br />
(cm)<br />
Area<br />
(cm 2 )<br />
4 4 16 16<br />
2 8 20 16<br />
1 16 34 16<br />
d) No. Rectangles with the same area have<br />
different perimeters.<br />
9. a) The area stays the same if one dimension is<br />
multiplied by a number and the other dimension<br />
is divided by the same number. For example:<br />
the length is doubled and the width is halved.<br />
b) I list factors whose product equals the given<br />
area.<br />
10. a) The lengths of line segments AB and BC, and<br />
the measures of ∠A and ∠B change.<br />
d) As area increases, the dimensions get closer<br />
in value, and the rectangles become more<br />
like a square.<br />
3. a), b)<br />
ANSWERS 315
2.3 Maximum Area for a Given Perimeter, page 55<br />
1. a), b)<br />
d) As the perimeter increases, the difference<br />
between length and width increases, and<br />
the rectangles become long and narrow.<br />
4. a)<br />
b)<br />
c) i) 2 cm by 2 cm<br />
ii) 3 cm by 3 cm<br />
iii) 6 cm by 5 cm<br />
2. a), b)<br />
c) The square has the greatest area.<br />
5. a) Each rectangle has area 36 cm 2 .<br />
b) Rectangle C has the least perimeter. Its length<br />
and width are closest in value. Rectangles A<br />
and E have the greatest perimeter.<br />
The difference between their length and width<br />
is the greatest.<br />
c) A: 30 cm; B: 26 cm; C: 24 cm; D: 26 cm;<br />
E: 30 cm<br />
Yes. Rectangle C has the least perimeter,<br />
24 cm. Rectangles A and E have the greatest<br />
perimeter, 30 cm.<br />
6. a) Each rectangle has perimeter 18 cm.<br />
b) Rectangles D and E have the greatest area.<br />
Their length and width are closest in value.<br />
Rectangles A and H have the least area.<br />
The difference between their length and<br />
width is the greatest.<br />
c) A: 8 cm 2 ; B: 14 cm 2 ; C: 18 cm 2 ; D: 20 cm 2 ;<br />
E: 20 cm 2 ; F: 18 cm 2 ; G: 14 cm 2 ; H: 8 cm 2<br />
Yes. Rectangles D and E have the greatest<br />
area, 20 cm 2 . Rectangles A and H have the<br />
least area, 8 cm 2 .<br />
7. No. Two rectangles with the same perimeter and<br />
the same area are congruent.<br />
c) The 3-m by 4-m garden has the maximum area.<br />
Its length and width are closest in value.<br />
The garden cannot be a square.<br />
The sides are whole numbers only.<br />
3. a) 81 cm 2 (9 cm by 9 cm)<br />
b) 225 cm 2 (15 cm by 15 cm)<br />
c) 351.5625 cm 2 (18.75 cm by 18.75 cm)<br />
4. The maximum area occurs when the rectangle is a<br />
square, with dimensions 10.5 m by 10.5 m.<br />
The greatest area for a rectangle with perimeter<br />
42 m is 110.25 m 2 .<br />
5. Explanations may vary.<br />
For example: Yes. For a given perimeter,<br />
the maximum area occurs when<br />
length and width are closest in value<br />
(the rectangle is as close to a square as possible).<br />
Among all possible rectangles with perimeter 16 cm,<br />
the 4-cm by 4-cm square has the maximum area.<br />
316 ANSWERS
6. a) A table that seats 20 people can be<br />
represented as a rectangle with perimeter<br />
20 units. That is, the sum of its length and width<br />
is 10. There are 5 possible rectangular<br />
arrangements: 1 by 9, 2 by 8, 3 by 7, 4 by 6,<br />
5 by 5.<br />
5.<br />
b) The arrangement with greatest area (5 by 5)<br />
requires the most tables: 25. The arrangement<br />
with least area (1 by 9) requires the fewest<br />
tables: 9<br />
c) If you use the 1 by 9 table, the person at one<br />
end of the table won’t be able to speak to the<br />
person at the other end. The square is closest<br />
to a circle, which is the best shape for<br />
communicating around a table.<br />
7. a) Area of square flowerbed: 4 m 2 ; area of circular<br />
flowerbed: about 5.1 m 2<br />
b) Bonnie’s; the area of a circle with perimeter P is<br />
always greater than the area of a rectangle with<br />
the same perimeter. Students’ answers should<br />
include drawings.<br />
Chapter 2 Mid-Chapter Review, page 60<br />
1. a) Both the area and the perimeter increase.<br />
b) Both the area and the perimeter decrease.<br />
c) Both the area and the perimeter increase.<br />
d) Both the area and the perimeter decrease.<br />
e) The perimeter stays the same and the<br />
area increases.<br />
2. a) All rectangles have the same perimeter: 16 cm<br />
b) The area varies. From least to greatest: 7 cm 2 ,<br />
12 cm 2 , 15 cm 2 , 16 cm 2 . The 4-cm by 4-cm<br />
square has the greatest area.<br />
3. a) i) 1 m by 30 m, 2 m by 15 m, 3 m by 10 m,<br />
5 m by 6 m<br />
ii) 1 m by 64 m, 2 m by 32 m, 4 m by 16 m,<br />
8 m by 8 m<br />
b) i) 62 m, 34 m, 26 m, 22 m<br />
ii) 130 m, 68 m, 40 m, 32 m<br />
4. Students’ answers should include diagrams and<br />
calculations.<br />
a) The perimeter stays the same.<br />
The area decreases by 27 cm 2 .<br />
b) The area stays the same.<br />
The perimeter doubles.<br />
6.<br />
a) A first paddock = 30 m × 30 m = 900 m 2<br />
A second paddock = 10 m × 90 m = 900 m 2<br />
b) No; 120-m of fencing are needed for the 30-m<br />
by 30-m paddock. 200-m of fencing are needed<br />
for the 10-m by 90-m paddock.<br />
7. The maximum area is 2025 m 2 (for a 45-m by 45-m<br />
square lot).<br />
2.4 Minimum Perimeter for a Given Area, page 63<br />
1. a) b)<br />
2. a)<br />
c) No. The perimeter of the 5-cm by 12-cm<br />
rectangle is greater than the perimeter of<br />
rectangle A.<br />
b)<br />
ANSWERS 317
c) The 12-cm by 12-cm square has the minimum<br />
perimeter for the given area.<br />
b) The arrangement that seats the most people<br />
is the rectangle with the maximum perimeter:<br />
12 by 1 arrangement<br />
The arrangement that seats the fewest people<br />
is the rectangle with the minimum perimeter:<br />
4 by 3 arrangement<br />
c) The rectangular arrangement with the minimum<br />
perimeter seats the fewest people.<br />
10. a), b) Answers may vary.<br />
3. a) The minimum perimeter occurs when length<br />
and width are closest in value.<br />
i) 5 by 5, P = 20 units<br />
ii) 10 by 5, P = 30 units<br />
iii) 15 by 5, P = 40 units<br />
iv) 10 by 10, P = 40 units<br />
b) i) P = 600 cm<br />
ii) P = 900 cm<br />
iii) P = 1200 cm<br />
iv) P = 1200 cm<br />
4. a) Start at 25. The area increases by 25 stones<br />
each time.<br />
b) No. There is no pattern in the perimeters.<br />
5. a) About 21.9 m<br />
b) About 31.0 m<br />
c) About 38.0 m<br />
d) About 43.8 m<br />
6. Both the length and width of a rectangle with the<br />
least possible perimeter are about 31.6 m. The least<br />
possible perimeter for a rectangle with area 1000 m 2<br />
is approximately 126.5 m.<br />
7. a) The minimum perimeter occurs when the length<br />
and width are closest in value: 8 tiles by 7 tiles.<br />
The minimum perimeter is 30 units.<br />
b) No; 56 tiles do not form a square. We cannot<br />
use fractions of a square tile.<br />
8. No. Explanations may vary. For example: For a<br />
given area, rectangles whose lengths and widths<br />
are closest in value have the least perimeter.<br />
9. a)<br />
c) No. For a given area, a square has the<br />
minimum perimeter.<br />
2.5 Problems Involving Maximum or Minimum<br />
Measures, page 67<br />
1. a) 8 m; 6 m; 4 m; 2 m; students’ answers should<br />
include diagrams.<br />
b) 4 m by 8 m; A = 32 m 2 ; the length is twice the<br />
width.<br />
2. a) Students’ answers should include diagrams of<br />
9 possible rectangles: 1 m by 18 m;<br />
2 m by 16 m; 3 m by 14 m; 4 m by 12 m;<br />
5 m by 10 m; 6 m by 8 m; 7 m by 6 m;<br />
8 m by 4 m; 9 m by 2 m.<br />
b)<br />
Width (m) Length (m) Area (m 2 )<br />
1 18 18<br />
2 16 32<br />
3 14 42<br />
4 12 48<br />
5 10 50<br />
6 8 48<br />
7 6 42<br />
8 4 32<br />
9 2 18<br />
c) 5 m by 10 m; the length is twice the width.<br />
318 ANSWERS
3. a) i) 20 m by 20 m<br />
ii) 20 m by 40 m<br />
Chapter 2 Review, page 70<br />
1. a) The length of the ladder stays the same.<br />
The right angle between the floor and the<br />
wall remains the same.<br />
b) The distance from the top of the ladder to<br />
the floor decreases; the horizontal distance<br />
from the ladder to the wall increases.<br />
The angle that the ladder makes with the floor<br />
decreases, the angle that the ladder makes<br />
with the wall increases.<br />
2. a)<br />
Width (cm) Length (cm) Area (cm 2 )<br />
b) i) Length equals width.<br />
ii) Length is twice the width.<br />
4. The 6-units by 12-units arrangement has the<br />
minimum distance: 24 units.<br />
5 45 225<br />
10 40 400<br />
15 35 525<br />
20 30 600<br />
25 25 625<br />
b) For a rectangle with perimeter 100 cm, with<br />
each 5-cm increase of the width, the length<br />
decreases by 5 cm. The sum of the width and<br />
length is always equal to 50 cm. The area<br />
increases as the length and width become<br />
closer in value.<br />
3. a)<br />
5. The minimum edging is required when the<br />
dimensions are closest in value: 8 units by 9 units.<br />
Width (cm) Length (cm) Perimeter<br />
(cm)<br />
2 36 76<br />
4 18 44<br />
6 12 36<br />
8 9 34<br />
6. a)<br />
b) If the width is multiplied by a number, the length<br />
is divided by the same number. The perimeter<br />
decreases as the length and width become<br />
closer in value.<br />
4. a) P = 16 cm; A = 16 cm 2<br />
b) There are 3 possible rectangles with the same<br />
perimeter as square B: 1 cm by 7 cm, 2 cm by<br />
6 cm, 3 cm by 5 cm<br />
Sections<br />
along each of<br />
3 sides<br />
Sections<br />
along each of<br />
2 sides<br />
Overall area<br />
(m 2 )<br />
2 10 20<br />
4 7 28<br />
6 4 24<br />
b) 4 sections along 3 sides, and 7 sections<br />
along the other 2 sides for a maximum area<br />
of 28 m 2 .<br />
c) No. For a given perimeter, the maximum area<br />
occurs when the rectangle has equal length<br />
and width (it is a square).<br />
ANSWERS 319
5. a) OABC and ODEF have equal perimeters:<br />
24 units, but different areas.<br />
A OABC = 32 square units,<br />
A ODEF = 27 square units<br />
b)<br />
11. a)<br />
c) For a given perimeter, when the length<br />
decreases by 1 unit, the width increases by<br />
1 unit.<br />
d) i) A max = 36 square units (6 units by 6 units)<br />
ii) A min = 11 square units (1 unit by 11 units)<br />
e) No for part d) i): For a given perimeter of<br />
24 units, the rectangle with the maximum area<br />
is always the one that has equal length and<br />
width (the 6-units by 6-units square).<br />
Yes for part d) ii): More rectangles are possible<br />
if the width can be less than 1 unit.<br />
For example: 0.5 units by 11.5 units<br />
6. a) i) 2 cm by 2 cm<br />
ii) 8.5 cm by 8.5 cm<br />
iii) 13.5 cm by 13.5 cm<br />
b) For a rectangle with a given perimeter,<br />
the maximum area occurs when the<br />
dimensions are equal.<br />
i) 4 cm 2<br />
ii) 72.25 cm 2<br />
iii) 182.25 cm 2<br />
7. a) 14.5 m by 14.5 m<br />
b) 210.25 m 2<br />
8. a) 14 m by 15 m<br />
b) 210 m 2<br />
9. a) i) 4 m by 4 m<br />
ii) About 4.9 m by 4.9 m<br />
iii) About 7.1 m by 7.1 m<br />
b) For a rectangle with a given area, the minimum<br />
perimeter occurs when the dimensions are<br />
closest in value.<br />
i) 16 m<br />
ii) 19.6 m<br />
iii) 28.4 m<br />
10. 14 cm by 14 cm; P = 56 cm<br />
b) The 8-m by 7-m arrangement requires<br />
minimum fencing. The dimensions are<br />
closest in value.<br />
12. a) 50 m<br />
b) 230 m<br />
c) 100 m by 200 m; the maximum area is<br />
20 000 m 2 . Given a fixed length for 3 sides of a<br />
rectangle, the rectangle with greatest area has<br />
length double its width.<br />
Chapter 2 Practice Test, page 72<br />
1. D<br />
2. A<br />
3. a)<br />
b) The patio with dimensions that are closest in<br />
value requires the minimum amount of edging:<br />
4 m by 6 m (P = 20 units).<br />
4. a) 49 cm 2<br />
b) 462.25 cm 2<br />
5. Students’ answers should include diagrams.<br />
a) For a rectangle with a given area, the minimum<br />
perimeter occurs when the dimensions are<br />
closest in value.<br />
b) For a rectangle with a given perimeter, the<br />
maximum area occurs when the dimensions<br />
are closest in value.<br />
6. a) 4 sections by 5 sections. The maximum area<br />
is 20 m 2 .<br />
b) Workers should use the 2 sections to make a<br />
5-m by 5-m rectangular storage, with an area<br />
of 25 m 2 . The maximum area occurs when the<br />
rectangle has equal length and width (it is<br />
a square).<br />
7. 4 m by 10 m, or 5 m by 8 m<br />
320 ANSWERS
Chapter 3 Relationships in Geometry<br />
3.1 Angles in Triangles, page 77<br />
1. This shows the property that the sum of the angles<br />
in a triangle is 180°.<br />
2. a) ∠C = 50°<br />
b) ∠E = 46°<br />
c) ∠K = 23°<br />
3. a) Yes, since 41° + 67° + 72° = 180°<br />
b) No, since 40° + 60° + 100° Ã<br />
c) No, since 100° + 45° + 30° Ã<br />
4. No, a triangle cannot have two 90° angles. Since<br />
90° + 90° = 180°, the third angle would be 0°.<br />
Also, if there are two 90° angles then two sides<br />
would be parallel, and they can never intersect,<br />
so the triangle cannot be formed.<br />
5. a) The acute angles in a right triangle have a sum<br />
of 90°.<br />
b) The sum of the angles in any triangle is 180°.<br />
If one of the angles is a right angle, the other<br />
two angles must have a sum of 180° – 90° = 90°.<br />
c)<br />
$<br />
i) ∠ D=<br />
30<br />
ii)<br />
$<br />
∠ P = 36<br />
$<br />
iii) ∠ C=<br />
45<br />
6. The angles opposite the equal sides in an isosceles<br />
triangle are equal.<br />
7. a) i) ∠A + 50° + ∠B = 180°<br />
ii) ∠A = ∠B = 65°<br />
b) i)<br />
$ $<br />
∠ A +∠ B+ 90 = 180<br />
ii) ∠A = ∠B = 45°<br />
c) i)<br />
$ $<br />
∠ A +∠ B + 31 = 180<br />
ii) ∠A = 118°, ∠B = 31°<br />
d) i)<br />
$ $<br />
∠ A +∠ B+ 66 = 180<br />
ii) ∠A = 48°, ∠B = 66°<br />
8. a) 100°<br />
b) Since each of the lower angles increases by<br />
2° from 40° to 42°, the upper angle decreases<br />
by 4° from 100° to 96°.<br />
The upper angle is 96°.<br />
9. 180° ÷ 3 = 60°; each angle measures 60°.<br />
10. a)<br />
$<br />
∠ A = 97<br />
b)<br />
$<br />
∠ D=<br />
62<br />
c)<br />
$<br />
∠ F=<br />
80<br />
$<br />
∠ B = 83<br />
$<br />
∠ E = 36<br />
$<br />
∠ G = 100<br />
$<br />
∠ C=<br />
69<br />
$<br />
∠ H=<br />
40<br />
3.2 Exterior Angles of a Triangle, page 83<br />
1. i) a) ∠ A and ∠ B<br />
b) ∠ BCD =∠ A +∠ B<br />
ii) a) ∠ D and ∠ E<br />
b) ∠ DFG =∠ D +∠ E<br />
iii) a) ∠ H and ∠ K<br />
b) ∠ KJM =∠ K +∠ H<br />
2. a) ∠ CAD =∠ B +∠ C<br />
= 118°<br />
b) ∠ EGH =∠ E +∠ F<br />
= 111°<br />
c) ∠ JKM = ∠ J +∠ H<br />
= 72°<br />
d) ∠ MRP =∠ M +∠ N<br />
= 92°<br />
e) ∠ QST = ∠ Q +∠ R<br />
= 143°<br />
f) ∠ XVU =∠ X +∠ W<br />
= 120°<br />
3. a)<br />
$<br />
∠BAC = 55°, ∠ C=<br />
55<br />
b) ∠ F=<br />
79<br />
$<br />
, ∠FGE = 60°<br />
c) ∠H = 49°, ∠JKH = 109°<br />
4. The plate angle is 40°; each exterior angle of a<br />
triangle is equal to the sum of the two opposite<br />
interior angles.<br />
5. ∠HJK = 28°, ∠GHK = 56°, ∠DEK = 90°,<br />
∠DFE = 72°, ∠ABF = ∠JHK = 124°,<br />
∠BFA = ∠HKJ = 28°,<br />
∠BCF = ∠HGK = ∠BFC = ∠HKG = 62°,<br />
∠FCD = ∠KGD = 118°, ∠CDF = ∠GDK = 44°,<br />
∠CFD = ∠GKD = 18°, ∠FDE = ∠KDE = 18°<br />
6. a) 128°<br />
b) The sum of the 3 exterior angles is 360°.<br />
c) The triangles have the same angles but the<br />
triangles have different sizes.<br />
7. a) x = 125°<br />
8.<br />
b) x = y = 145°<br />
c) x = 47°, y = 133°, z = 142°<br />
For example, 130° + 150° + x = 360°; x = 80°<br />
a + 130° = 180°; a = 50°<br />
c + 150° = 180°; c = 30°<br />
b = 180° – a – c = 100°<br />
Also, a + b = 150°; b + c = 130°, c + a = x<br />
Or, a + b + c = 180°<br />
3.3 Angles Involving Parallel Lines, page 89<br />
1. I used these relationships:<br />
• opposite angles are equal<br />
ANSWERS 321
• angles that form a straight angle have a sum<br />
of 180°<br />
• when parallel lines are intersected by a<br />
transversal, corresponding angles are equal<br />
a) ∠BCH = ∠GCD = ∠EBC = 62°,<br />
∠ABE = ∠FBC = ∠BCG = ∠DCH = 118°<br />
b) ∠EBC = 62°<br />
∠ABE = ∠FBC = 118°<br />
2. a) b = 60°, a = 15°<br />
b) d = e = 86°, f = 94°, g = 141°, h = 39°<br />
c) a = 55°, b = c = 65°, d = 120°<br />
3. Yes, Petra is correct.<br />
• a = b = c = d<br />
So, all the acute angles are equal.<br />
• e = f = g = h<br />
So, all the obtuse angles are equal.<br />
• c + f = b + g = 180°<br />
e + b = a + f = 180°<br />
So, the sum of an acute angle and an obtuse<br />
angle is 180°.<br />
4. ∠BCD = 133°<br />
5. 34° + 145° = 179°, not 180°, so the boards are<br />
not parallel.<br />
6. ∠CED = 88°, ∠ECD = ∠EDC = 46°<br />
7. a) The sum of the interior angles is 180°.<br />
The sum of the exterior angle and the adjacent<br />
interior angle is 180°.<br />
The exterior angle is equal to the sum of the<br />
opposite interior angles.<br />
The sum of the exterior angles of a triangle<br />
is 360°.<br />
b) Corresponding angles are equal.<br />
Alternate angles are equal.<br />
Interior angles have a sum of 180°.<br />
c) Students’ answers should include a design.<br />
8. a) a + c = b<br />
b) Yes. As long as the top and bottom lines are<br />
parallel, a, b, and c are always related so that<br />
a + c = b.<br />
c) If you draw a third parallel line through B, and<br />
use the property that alternate angles are<br />
equal, the sum of a and c is always equal to b.<br />
Chapter 3 Mid-Chapter Review, page 92<br />
1. When you arrange the three angles of a triangle<br />
next to each other, they form a straight line.<br />
That is, the angles in a triangle have a sum<br />
of 180°.<br />
2. a = 50°, b = 40°<br />
3. Students’ answers may show diagrams with<br />
congruent angles labelled.<br />
4. a) a = c = 58°, b = 122°<br />
b) e = 115°, f = 65°, g = 72°, h = 43°<br />
5. Angle measures will vary according to students’<br />
drawings.<br />
6. x = 55°, y = 125°, z = 55°<br />
Assumptions: The flag is a rectangle; the horizontal<br />
line segments are parallel.<br />
7. a) a = b = c, c = e, f + b + e = 180°, g + h = 90°,<br />
e + d = 90°, a = f, c + d = 90°, g + 90° = 143°<br />
b) a = b = c = 60°, d = 30°, e = 60°,<br />
f = 60°, g = 53°, h = 37°<br />
3.4 Interior and Exterior Angles of Quadrilaterals,<br />
page 97<br />
1.<br />
2. a) a = 75° b) b = 27° c) c = 61°<br />
3. a) They have a sum of 180°.<br />
b) The angles that are between the parallel lines<br />
on the same side of a transversal are interior<br />
angles and have a sum of 180°.<br />
4. a) a = 91° b = 89° c = 91°<br />
b) d = 53° e = 127° f = 53°<br />
c) h = 132° j = 48° k = 132°<br />
5. The opposite angles in a parallelogram are equal.<br />
6. a), b) The sum of all the angles is 360°, because it<br />
is a quadrilateral. If we draw the diagonal that forms<br />
2 congruent triangles, we see that one pair of<br />
opposite angles are equal.<br />
7. a) a = 86°<br />
b) b = 54°<br />
c) d = 124°<br />
8. a) ∠R + ∠O + ∠S + ∠E = 360°<br />
∠R = ∠E, ∠O = ∠S<br />
∠O + ∠R = 180°, ∠S + ∠E = 180°<br />
b) Students can measure angles with a protractor<br />
to demonstrate the relationships in part a.<br />
322 ANSWERS
3.5 Interior and Exterior Angles of Polygons,<br />
page 101<br />
1.<br />
2. a) 900° b) 1440° c) 3960°<br />
3. a) x = 148° b) x = 55°<br />
4. a) 108° b) 135°<br />
c) 144° d) 162°<br />
5. a) 72° b) 45° c) 36° d) 18°<br />
6. a) The Canadian loonie has 11 sides.<br />
b) About 147°<br />
7. a) The sum S of the interior angles in an n-sided<br />
polygon is S = (n – 2) × 180°.<br />
If the polygon is a regular polygon, then the<br />
measure of each interior angle is:<br />
$<br />
( n − 2) × 180<br />
n<br />
The exterior angles in any polygon have a sum<br />
of 360°.<br />
If the polygon is a regular polygon with n sides, then<br />
the measure of each exterior angle is:<br />
360°<br />
n<br />
At each vertex, the interior angle and the<br />
exterior angle have a sum of 180°.<br />
b) Students’ answers should include designs.<br />
8. a), b) Students’ answers should include drawings.<br />
c) Quadrilateral: 360°, pentagon: 540°<br />
d) Yes, the number of triangles the polygon can<br />
be divided into is still 2 less than the number<br />
of sides.<br />
9. a) Regular pentagons and regular hexagons<br />
b) 120°<br />
c) 108°<br />
d) 348°; the sum is close to, but not equal to,<br />
360°. This is because the surface is curved.<br />
10. a) 6 × 180° = 1080°<br />
b) 360°; this is the sum of the angles at the point<br />
inside the hexagon. These angles are not<br />
interior angles of the hexagon.<br />
c) n × 180° – 360° = (n – 2) × 180°<br />
Chapter 3 Review, page 106<br />
1. If you cut off the corners (angles) of a triangle and<br />
arrange them side by side, they form a straight<br />
angle, which has a measure of 180°.<br />
2. No. If a triangle had 2 obtuse angles, the sum of<br />
those two angles would be greater than 180°.<br />
3. a) x = 59°<br />
b) x = y = 69°<br />
c) x = 48°<br />
4. a = 44°, b = 44°, c = 63°, d = 63°, e = 63°<br />
5. a) No. Alternate angles are not equal.<br />
b) Yes. The interior angles 116° and 64° have a<br />
sum of 180°.<br />
6. x = 49° y = 49°<br />
7. a) x = 89°<br />
b) x = 21°, y = 40°, z = 119°<br />
c) y = 85°<br />
d) x = 105°<br />
8. a) 1080°<br />
b) i) 135°<br />
ii) 45°<br />
9. a) 720°<br />
b) 1800°<br />
c) 2880°<br />
10. a) 540°<br />
b) The sum of the exterior angles of a pentagon<br />
is 360°.<br />
c) Yes<br />
11. Interior angle: 176.4°; exterior angle: 3.6°<br />
Chapter 3 Practice Test, page 108<br />
1. B<br />
2. B<br />
3. Cut out and arrange the corners next to each other;<br />
draw a diagonal and add the interior angles of the<br />
2 triangles formed by the diagonal.<br />
4. a) a = 81°<br />
b) a = 34°, b = 49°, c = 34°, d = 131°<br />
c) x = 135°, y = 45°<br />
5. a) 540°<br />
b) 135°<br />
6. ∠PRS = ∠PSR (because it is an isosceles triangle)<br />
∠PRQ + ∠PRS = 180°<br />
∠RST + ∠PSR = 180°<br />
So, ∠PRQ = ∠RST<br />
Chapter 4 Proportional Reasoning<br />
4.1 Equivalent Ratios, page 112<br />
1. a) 4:6 b) 8:6 c) 12:15 d) 30:25<br />
2. a) 3:5 b) 3:1 c) 5:4 d) 1:2<br />
3. a) 4:10, 20:50 b) 1:4, 25:100<br />
c) 20:2, 100:10 d) 150:100, 15:10<br />
4. a) b)<br />
c) No, 18:26 is not equivalent to 6:8.<br />
5. The ramp should have dimensions in the ratio 2:24.<br />
It could be 20 cm high and 240 cm long.<br />
ANSWERS 323
6. a) 24:16, 24:15<br />
b) Megan’s punch uses less ginger ale for the<br />
same amount of concentrate.<br />
7. a) Punch B; it uses concentrate and water in the<br />
ratio 5:8, punch A uses a ratio of 4:8.<br />
b) Punch B; it uses concentrate and water in the<br />
ratio 5:6, punch A uses a ratio of 4:6.<br />
8. a) Set B; explanations may vary.<br />
b) Set B;<br />
Set A uses blue and clear liquid in the ratio 3:2.<br />
Set B uses blue and clear liquid in the ratio 4:2.<br />
c) Sketches may vary. The ratio of blue to clear<br />
liquid must be equivalent to 3:2. For example:<br />
9. 15 cm by 24 cm<br />
10. a) 0.5 cm b) 0.4 cm<br />
4.2 Ratio and Proportion, page 117<br />
1. a) First terms: 125 = 25 × 5; first ratio: 20 = 4 × 5<br />
b) First terms: 120 = 12 × 10;<br />
first ratio: 10 = 10 × 1<br />
c) Second terms: 100 = 4 × 25; first ratio: 75 = 3 × 25<br />
d) Second terms: 48 = 16 × 3; first ratio: 3 = 3 × 1<br />
2. a) n = 20 b) n = 3 c) n = 3 d) n = 30<br />
3. a) z = 6 b) z = 15 c) z = 7 d) z = 8<br />
4. Yes, the ratios are equivalent, so the number of the<br />
songs is proportional to the amount of memory.<br />
5. 18 L<br />
6. 25 h<br />
7. 15 potatoes<br />
8. a) c = 45 b) n = 30<br />
c) y = 8 d) z = 15<br />
9. a) 84 cm<br />
b) Calculate 28 ÷ 17 =Æ 1.65 and then<br />
51 × 1.65 =Æ 84.<br />
10. 276 times<br />
11. a) 84 teeth b) 189 teeth<br />
12. a) 500 girls, 400 boys b) 15 girls, 12 boys<br />
4.3 Unit Rates, page 123<br />
1. a) 2 goals scored per game<br />
b) $10 per hour c) $0.50 per orange<br />
d) 110 km/h<br />
2. a) $0.50 per CD b) $0.79 per apple<br />
c) 1.5 kg lost per week<br />
d) 4.4 km/h<br />
3. 150 L/h<br />
4. The hardwood is more expensive at $44.12/m 2 .<br />
5. e-Tunes is the most economical music club at $1.05<br />
per song.<br />
6. No. The can from the machine costs 3 times as<br />
much as the cans in the 12-pack.<br />
7. Can C<br />
8. a) 144 tea bags for $5.39<br />
b) Use equivalent ratios.<br />
c) Sue might not use 144 bags of tea before they<br />
go stale.<br />
9. a) Price (in dollars) per 100 g<br />
b) $0.62 per 100 g, $0.57 per 100 g<br />
c) Dee’s Delight<br />
Chapter 4 Mid-Chapter Review, page 126<br />
1. a) equivalent b) not equivalent<br />
c) not equivalent d) equivalent<br />
2. a) Pitcher B<br />
b) A pitcher containing 6 parts concentrate and<br />
4 parts water<br />
3. No, the ratios are not equivalent.<br />
4. a) n = 40 b) m = 20<br />
c) y = 3 d) r = 12<br />
5. 160 mL<br />
6. a) 3:10<br />
b) 168 male doctors<br />
c) 51 female doctors<br />
d) The ratio of female doctors to male doctors<br />
remains the same.<br />
7. a) 15 km/L b) 30 words/min<br />
c) $18.50/h d) 87.5 km/h<br />
8. Beckie<br />
9. a) $1.04, $1.08 b) Cereal A<br />
4.4 Applying Proportional Reasoning, page 129<br />
1. a) $15 b) $195<br />
2. a) $56 b) $616<br />
3. $480<br />
4. a) 14 cases b) Use equivalent ratios.<br />
5. a) 300 km b) 10 L<br />
6. a) 7500 books b) 58 min<br />
7. a) 750 cm, or 7.5 m b) 100 cm<br />
8. a) 45 points b) 38 points<br />
c) Answers may vary. For example: Chloë and her<br />
father scored 19 baskets each.<br />
9. a) $191.25 US<br />
b) $11.76 Can; The exchange rate remains<br />
the same.<br />
10. Too dry<br />
4.5 Using Algebra to Solve a Proportion, page 133<br />
1. a) n = 9 b) n = 3 c) n = 15<br />
d) n = 40 e) n = 10<br />
2. a) c = 27 b) m = 7<br />
c) y = 105 d) a = 175<br />
3. a) 0.83 m b) 7.4 m<br />
4. $445.00<br />
5. a) 160 000 tickets b) 23.44 min<br />
6. a) 2.03 m b) 95.4 cm<br />
c) Answers may vary.<br />
324 ANSWERS
4.6 Percent as a Ratio, page 137<br />
1. a) 0.07 b) 0.15 c) 0.35<br />
d) 0.8 e) 1.2<br />
2. a) $36.50 b) 12.5 kg<br />
c) 14 m d) 150 g<br />
3. $111.99<br />
4. 10 000 vehicles<br />
5. a) $8.40 b) $68.39<br />
6. $219.45<br />
7. a) 216 spectators b) 173 spectators<br />
8. $300<br />
9. a) $6.67 b) $506.67<br />
10. a) $53.26 b) $953.26<br />
11. 8% per year<br />
Chapter 4 Review, page 140<br />
1. a) 6:10, 9:15 b) 6:7, 12:14<br />
c) 3:2, 6:4 d) 45:7, 90:14<br />
2. a) No<br />
b) Any spinner with the same ratio of red sectors<br />
to total sectors would be equivalent.<br />
For example, a spinner with 16 sectors, 6 of<br />
which are red or 24 sectors, 9 of which are red<br />
3. Mix A. It uses more concentrate for the same<br />
amount of water.<br />
4. a) n = 12 b) a = 7<br />
c) e = 42 d) m = 24<br />
5. 240 mL<br />
6. a)<br />
1<br />
1 cups b) 45 cookies<br />
2<br />
7. a) 48 km/h b) 35 words/min<br />
c) $0.40/min d) $1.58/kg<br />
e) 30 pages/min<br />
8. B: 130 mL for $1.99 is the better buy.<br />
9. a) 9 kg b) $42.40<br />
10. a) About 9 days b) 22.5 rows<br />
11. a) 360 km b) 35 L<br />
12. 15 copies<br />
13. a) $11.40 b) $53.35<br />
c) $27.00 d) $9.47<br />
14. a) $51.99 b) $59.27<br />
15. 84 h<br />
16. a) $8.75 b) $358.75<br />
17. a) $90 b) $1590<br />
Chapter 4 Practice Test, page 142<br />
1. C<br />
2. C<br />
3. a) a = 25 b) b = 5<br />
c) c = 20 d) n = 8.4<br />
4. 18 oranges<br />
5. a) $12.50 b) $2512.50<br />
6. You can measure your height and the length of your<br />
shadow. Then measure the length of the shadow of<br />
the flagpole and use equivalent ratios to find the<br />
height of the flagpole.<br />
Cumulative Review Chapters 1–4, page 143<br />
1. a) P = 30 cm, A = 30 cm 2<br />
b) P = 24 cm, A = 28 cm 2<br />
2. A =Æ 137.1 cm 2<br />
P =Æ 52.6 cm<br />
3. a) 108 cm 3 b) About 22 m 3<br />
c) About 205.3 cm 3 d) About 904.8 cm 3<br />
4. a) 112 cm 3 b) 12 cm c) 4 cm<br />
5. 1 cm, 20 cm; 2 cm, 10 cm;<br />
4 cm, 5 cm; 8 cm, 2.5 cm<br />
6. a) 4.5 m by 4.5 m b) 20.25 m 2<br />
c) i) 4.5 m by 9 m ii) 40.5 m 2<br />
7. a) i) 5 cm by 5 cm<br />
ii) About 5.7 cm by 5.7 cm<br />
iii) About 8.8 cm by 8.8 cm<br />
b) i) 20 cm ii) About 22.8 cm<br />
iii) About 35.2 cm<br />
For a given area, the rectangle with the minimum<br />
perimeter is always a square.<br />
8. 73° and 73°, or 34° and 112°<br />
9. a) q = 77°, p = 135°, r = 58°, s = 122°<br />
b) a = c = y = 30°,<br />
b = d = x = z = 150°<br />
c) a = b = 105°, c = d = 75°<br />
10. a) 720°<br />
b) The hexagon can be divided into 4 triangles.<br />
Each triangle has interior angles measuring 180°.<br />
180 × 4 = 720°; the answer is the same as for<br />
part a.<br />
c) i) 120° ii) 60°<br />
11. Answers may vary.<br />
a) 4:14; 6:21 b) 3:11; 9:33<br />
c) 7:3; 14:6 d) 25:6; 50:12<br />
12. a)<br />
3<br />
4<br />
b) 54<br />
13. 775 g for $5.49<br />
14. 412.5 km<br />
15. a) $39.00 b) $4.13 c) $86.20<br />
16. a) $16.50 b) $566.50<br />
Chapter 5 Graphing Relations<br />
5.1 Interpreting Scatter Plots, page 148<br />
1. a) 26.1°, 29.8° b) 40 m<br />
c) The scatter plot shows a downward trend;<br />
as the depth increases, the temperature<br />
decreases.<br />
2. a) The average daily temperature in March for<br />
several Ontario cities and towns<br />
b) 2°C c) About 175 m<br />
d) There are no trends in the data.<br />
3. a) i) 154 cm ii) 2 students<br />
b) i) 177 cm ii) 5 students<br />
iii) 2 students<br />
ANSWERS 325
c) There is an upward trend; as the height<br />
increases, the arm spans increase.<br />
4. a) i) 14 h<br />
ii) 3<br />
iii) Yes, the student who earned a little less<br />
than $150 worked for 12 h; the coordinates<br />
of the point are approximately (12, 145).<br />
b) i) About $240<br />
ii) 20 h<br />
iii) Yes, the student who worked 21 h earned<br />
$200; the coordinates of the point are<br />
approximately (21, 200).<br />
c) There is an upward trend in the data; the points<br />
tend to go up to the right; as the time increases,<br />
the earnings increase.<br />
5. a) i) $72 ii) $9/h<br />
b) The point (4, 48) represents a person who<br />
earns $12/h. The point (5, 40) represents a<br />
person who earns $8/h.<br />
5.2 Line of Best Fit, page 153<br />
1. Graph b; in this graph, the number of points above the<br />
line is close to the number of points beneath the line.<br />
2. Answers will depend on the data students collected<br />
in Investigate.<br />
3. a) Temperature against Latitude; there is no trend<br />
in the Temperature against Elevation scatter<br />
plot, so we may not draw a line of best fit.<br />
b) Answers may vary. For example: At a latitude<br />
of 44ºN, the temperature is about 5.5ºC.<br />
d) 1.8 m; 6.2 m.<br />
e) Answers may vary. For example: From which<br />
height should the ball be dropped so its<br />
rebound height is 2.5 m? Answer: About 3.4 m<br />
5. a) Yes, the taller the person, the greater her/his<br />
knee height.<br />
b), c), d) Answers will depend on students’ data<br />
from Investigate.<br />
6. Yes, the taller the person, the greater her/his<br />
shoe size.<br />
a), b) Answers will depend on students’ data.<br />
7. Answers will vary, depending on the measures chosen.<br />
8. No, the number of points above and below the line<br />
will vary.<br />
9. a) As the years increase, the record time<br />
decreases.<br />
Year<br />
Time (s)<br />
1983 36.68<br />
1983 36.57<br />
1987 36.55<br />
1988 36.45<br />
1992 36.43<br />
1993 36.41<br />
1993 36.02<br />
1994 35.92<br />
1996 35.76<br />
1998 35.39<br />
1998 35.36<br />
1999 34.76<br />
2000 34.63<br />
2001 34.32<br />
b)<br />
4. a) An upward trend; the rebound height increases<br />
as the drop height increases.<br />
b), c) Yes, the graph shows an upward trend.<br />
c) About 37.3 s. The actual world record in 1981<br />
was 36.91 s.<br />
d) Questions may vary. For example:<br />
What might the world record time be in 2005?<br />
Answer: About 34.2 s<br />
326 ANSWERS
5.3 Curve of Best Fit, page 160<br />
1. a) As the time increases, the height increases,<br />
then decreases.<br />
b)<br />
b) As the time increases, the number of animals<br />
increases.<br />
c) About 12.0 h d) About 15.6 h<br />
d) Answers will vary. From your birth date on the<br />
horizontal axis move up to the graph, then<br />
across to the vertical axis to find the number<br />
of hours of daylight.<br />
3. a) As the time increases, the number of hosts<br />
increases. Each year, the number is about 3 or<br />
4 times the number the year before, until about<br />
2000, when the number doubles, then it is<br />
multiplied by 1.5 each year.<br />
b)<br />
c) As the time increases, the height increases,<br />
then levels off.<br />
c) About 110 million<br />
d) About 2008<br />
4. a) As the time increases, the height decreases.<br />
b)<br />
2. a) The number of daylight hours increases<br />
from January to July, then decreases from<br />
July to December.<br />
c) After about 1.5 s<br />
d) Extend the graph until it reaches the Time axis:<br />
a little more than 2.1 s<br />
ANSWERS 327
5. a)<br />
c) 7 boys, 2 boys<br />
d) In the top left corner of the graph<br />
e) As the time played increases, the number of<br />
points scored increases; the points go up to<br />
the right.<br />
2. a) There is an upward trend indicating that the<br />
taller the dog, the greater its mass.<br />
b)<br />
b) Line of best fit females: each year, the number<br />
of people increases by about 1000 or 2000.<br />
Curve of best fit males: for most years, the<br />
increase is greater than the year before.<br />
c) Extend the line and the curve to the year 2003:<br />
About 232 000 males, about 23 000 females<br />
c) Yes, the line of best fit goes up to the right;<br />
as the height increases, the mass increases.<br />
d) 42 cm e) 22 kg<br />
f) Assume that the data for the dogs in parts d<br />
and e lie on the line of best fit.<br />
3. a) The population increases as years go by; in<br />
later years, the population increases by a<br />
greater amount in each 10-year interval.<br />
b)<br />
Technology: Using a Graphing Calculator to Draw a<br />
Curve of Best Fit, page 166<br />
1. Quadratic curve<br />
2. Exponential curve<br />
Chapter 5 Mid-Chapter Review, page 168<br />
1. a) Each point represents a boy. The horizontal<br />
coordinate represents the time played in<br />
minutes and the vertical coordinate represents<br />
the points he scored.<br />
b) 7 points<br />
c) About 2.0 billion, about 4.0 billion<br />
d) About 1.3 billion<br />
e) About 7.3 billion<br />
f) The data for the years in parts c, d, and e lie on<br />
the line of best fit.<br />
5.4 Graphing Linear Relations, page 171<br />
1. a) Yes, the relationship is linear because the<br />
points lie on a straight line.<br />
b) 77°F<br />
c) –20°C<br />
d) Use a thermometer that shows the temperatures<br />
in Fahrenheit and Celsius degrees<br />
e) Questions may vary. For example: What is the<br />
Celsius temperature for 50°F? Answer: 10°C<br />
2. a) Yes, since the relationship for a pyramid<br />
is linear.<br />
328 ANSWERS
) Square Prisms with Base Area 9 cm 2<br />
Height h<br />
(cm)<br />
Volume V<br />
(cm 3 )<br />
1 9<br />
2 18<br />
b) As one angle increases, the other angle<br />
decreases by the same amount; the points<br />
lie on a straight line.<br />
c) 60°, 50°<br />
4. a)<br />
c)<br />
3 27<br />
4 36<br />
5 45<br />
Frame<br />
number<br />
Number of<br />
toothpicks<br />
1 3<br />
2 5<br />
3 7<br />
4 9<br />
5 11<br />
6 13<br />
d) As the height increases, the volume increases;<br />
the relationship is linear.<br />
e) The volume is 9 times the height.<br />
f) 31.5 cm 3 . Use the formula or the graph.<br />
3. a) Acute Angles in a Right Triangle<br />
b) Yes, as the frame number increases by 1, the<br />
number of toothpicks increases by 2.<br />
c) The relationship is linear; the points lie on a<br />
straight line.<br />
One<br />
acute<br />
angle (°)<br />
Other<br />
acute<br />
angle (°)<br />
5 85<br />
10 80<br />
15 75<br />
20 70<br />
25 65<br />
d) Add 2 more rows to the table; 17 toothpicks<br />
e) The number of toothpicks is 1 more than two<br />
times the frame number.<br />
f) Extend the pattern; or extend the table; or use<br />
the rule: 31 toothpicks<br />
5. a) Yes, the length decreases by 1 cm, the width<br />
increases by 1 cm.<br />
b) Yes, the points lie on a straight line.<br />
ANSWERS 329
c) The length plus the width of the rectangle<br />
is 12 cm.<br />
d) i) 7.5 cm ii) 1.5 cm<br />
e) Use the rule or the graph.<br />
b)<br />
6. a), b), c)<br />
Celsius<br />
temperature<br />
(ºC)<br />
Fahrenheit<br />
temperature<br />
(ºF)<br />
–20 –10<br />
–15 0<br />
–10 10<br />
–5 20<br />
0 30<br />
5 40<br />
10 50<br />
15 60<br />
20 70<br />
25 80<br />
30 90<br />
c) As the height increases, the volume increases.<br />
The relationship is linear because the points lie<br />
on a straight line.<br />
d) Calculate or use the graph: 40 cm 3<br />
e) Extend the graph: 11.25 cm<br />
f) The volume is one-third the height multiplied<br />
by 16.<br />
5.5 Graphing Non-Linear Relations, page 177<br />
1. a) Linear, because the points lie on a straight line<br />
b) Non-linear, because the points lie on a curve<br />
2. a) i) 135 calories, about 202 calories<br />
ii) About 8 million, about 4 million<br />
b) Questions may vary. For example: By how<br />
much did the population increase from 1960<br />
to 1980? Answer: About 3 million<br />
3. a) Yes, because as the width increases by 1,<br />
the length decreases by a different amount<br />
each time.<br />
b) Yes, the points lie on a curve.<br />
d) The rule “double and add 30” is useful from<br />
about 0ºC to 20ºC; beyond that, in either<br />
directions, the temperature the rule gives is more<br />
than 2ºC different from the true temperature.<br />
7. a) Square Pyramids with Base Area 16 cm 2<br />
Height<br />
(cm)<br />
Volume<br />
(cm 3 )<br />
4. a)<br />
c) i) 7.2 cm ii) 4.5 cm<br />
d) Length times width is 36; or length is 36 divided<br />
by width; or width is 36 divided by length.<br />
1 5. 3<br />
2 10. 6<br />
3 16.0<br />
4 21. 3<br />
5 26. 6<br />
330 ANSWERS
) Side length<br />
(cm)<br />
Area (cm 2 )<br />
1 1<br />
2 4<br />
3 9<br />
4 16<br />
5 25<br />
c) As the edge length increases, the number of<br />
cubes increases; each increase is much<br />
greater than the preceding increase.<br />
d) i) Multiply:<br />
edge length × edge length × edge length<br />
ii) The number of cubes is equal to the volume<br />
in cubic units.<br />
f)<br />
6 36<br />
c) As the side length increases by 1, the area<br />
increases by a greater amount each time;<br />
the increases are consecutive odd numbers:<br />
3, 5, 7, 9, 11<br />
g) V = e 3 or V = e × e × e<br />
h) 8 i) 1000<br />
j) Extend the graph; or use the rule; or extend<br />
the pattern.<br />
6. a) The graph will go down to the right. It will not<br />
be a straight line because the value of the car<br />
decreases by a different amount each time.<br />
b)<br />
d) About 20 cm 2<br />
e) About 56 cm 2<br />
f) Multiply each side length by itself.<br />
5. a) The edge length of each cube increases by<br />
1 unit each time.<br />
b))<br />
Edge length<br />
(cm)<br />
Number of<br />
cubes<br />
1 1<br />
2 8<br />
3 27<br />
4 64<br />
c) The graph goes down to the right; the points lie<br />
on a curve.<br />
d) Extend the graph: between 7 and 8 years<br />
7. Answers will vary depending on students’ data; the<br />
mass does not affect the time to complete 6 swings.<br />
8. Answers will vary depending on the measurements<br />
chosen.<br />
9. Answers will vary. For example:<br />
a) I estimate my total daily caffeine intake<br />
is 70 mg.<br />
5 125<br />
6 216<br />
7 343<br />
ANSWERS 331
) Time (h) Mass of caffeine (mg)<br />
0 70<br />
6 35<br />
12 17.5<br />
18 8.75<br />
24 4.375<br />
work and school and use water at a faster rate than<br />
it enters the reservoir.<br />
5. From 0 min to 7 min, the temperature remains the<br />
same. All the heat is used to melt the ice, so the<br />
temperature does not change.<br />
From 7 min to 17 min, the water is heated to its<br />
boiling point of 100ºC.<br />
From 17 min to 20 min, the water continues to boil,<br />
and the heat is used to create steam, so the<br />
temperature does not change.<br />
Chapter 5 Review, page 186<br />
1. a) How the price of a used car changes with age<br />
b) 3 years<br />
c) $9000 and $12 000; The $12 000 car may be<br />
in better condition, and have less mileage<br />
d) There is a downward trend; as the age of a car<br />
increases, its price decreases.<br />
2. a), b) As the time increases, the height increases.<br />
c) Answers may vary. For adult family members,<br />
the initial data may be greater, but the graph<br />
has the same shape.<br />
10. The relationship is non-linear.<br />
5.6 Interpreting Graphs, page 182<br />
1. a) Graph C b) Graph A c) Graph B<br />
2. a) Walk at a constant speed toward the CBR for<br />
3 s, stop for 4 s, then continue to walk toward<br />
the CBR at a slower speed.<br />
b) Walk away from the CBR at a steady speed for<br />
3 s, stop for 4 s, then continue to walk at the<br />
same speed toward the CBR.<br />
c) Walk very slowly toward the CBR for 2.5 s,<br />
stop for 4 s, then walk away from the CBR at<br />
a faster speed.<br />
3. From A to B: walks 200 m for 3 min<br />
From B to C: stops for 1 min<br />
From C to D: walks 300 m for 6 min<br />
From D to E: stops at the store for 7 min<br />
From E to F: walks 500 m home in 11 min<br />
4. From 5:00 a.m. to 9:00 a.m., the volume decreases<br />
from 1 million litres to 500 000 L; people are having<br />
baths and showers, watering lawns, washing<br />
clothes and dishes.<br />
From 9:00 a.m. to 11:00 a.m., the volume remains<br />
constant, the water entering the reservoir is equal to<br />
that being used.<br />
From 11:00 a.m. to 2:00 p.m., more water enters<br />
the reservoir than leaves it, and the volume<br />
increases to 700 000 L.<br />
From 2:00 p.m. to 3:00 p.m., the volume is constant.<br />
From 3:00 p.m. to 10:00 p.m., the volume<br />
decreases to 300 000 L. People are home from<br />
c) i) About 18 mm ii) 50 mm<br />
d) About 12 days<br />
e) No, the seedling will probably not continue to<br />
grow at the same rate.<br />
3. a) From 1996 to 1998, sales increased. From<br />
1998 to 2001, sales decreased. From 2001 to<br />
2003, sales decreased very slowly.<br />
b)<br />
c) About $1.4 billion, about $950 million<br />
d) About $940 million; I assume the point lies<br />
on the graph that moves down gradually to<br />
the right.<br />
332 ANSWERS
4. a) As time increases, the temperature decreases.<br />
c) As the frame number increases by 1, the<br />
number of squares increases by 3. I think<br />
the graph will be linear.<br />
d)<br />
b) A curve of best fit<br />
c) At 1 min, the temperature will suddenly fall,<br />
then continue to decrease. Graphs may vary.<br />
e) The number of squares is 1 more than 3 times<br />
the frame number.<br />
f) Extend the table or graph; draw the next<br />
2 frames; or use the rule: 25 squares<br />
g) The 9th frame; I added 3 squares to the<br />
8th frame to get the next frame.<br />
6. a) As the resistance increases, the current<br />
decreases.<br />
5. a)<br />
b)<br />
b) Frame<br />
number<br />
Number of<br />
squares<br />
1 4<br />
2 7<br />
3 10<br />
4 13<br />
5 16<br />
6 19<br />
c) About 8 A<br />
d) About 12 ohms<br />
7. From A to B, Hasieba travels 200 m in 2 min. From<br />
B to C, she walks slower and travels 150 m in 4 min.<br />
From C to D, Hasieba stops for 4 min. From D to E,<br />
Hasieba walks 250 m in 3 min. From E to F, she<br />
stops for 3 min. From F to G, Hasieba walks 600 m<br />
home in 9 min.<br />
Chapter 5 Practice Test, page 188<br />
1. C<br />
2. C<br />
ANSWERS 333
3. a) Line of best fit, because when the depth<br />
increases by 5 m, the increase in pressure is<br />
always 50 kPa.<br />
b) 12.5 m, 30 m c) 100 kPa<br />
d) As the depth increases, the pressure increases.<br />
4. a) As the number of bounces increases, the<br />
height decreases.<br />
b) Curve of best fit, because when the number<br />
of bounces increases by 1, the decrease in<br />
height changes.<br />
Chapter 6 Linear Relations<br />
6.1 Recognizing Linear Relations, page 194<br />
1. a) 6, 6, 6, 6; linear relation because all the first<br />
differences are equal<br />
b) 1.0, 0.8, 0.7, 0.7; non-linear relation because<br />
the first differences are not equal<br />
c) 5, 5, 5, 5; linear relation because all the first<br />
differences are equal<br />
2. Answers may vary.<br />
a) The cost to rent a canoe at $6/h<br />
b) The mass of a baby from 0 to 4 months<br />
c) The distance driven at an average speed<br />
of 15 m/s<br />
3. a)<br />
Frame<br />
number<br />
Area<br />
(square<br />
units)<br />
1 2<br />
2 6<br />
3 12<br />
4 20<br />
5 30<br />
6 42<br />
First<br />
differences<br />
4<br />
6<br />
8<br />
10<br />
12<br />
b) See the table in part a. The relation is not linear<br />
because the first differences are not equal.<br />
c) Yes, the points lie on a curve.<br />
c) Extend the graph to the left to 0 bounces.<br />
The height is about 3.2 m.<br />
d) Answers may vary. Extend the graph to the<br />
right to find the height of the 7th bounce, which<br />
is about 0.2 m.<br />
5. If the points lie on a straight line, it is a linear<br />
relation. If the points lie on a curve, it is a non-linear<br />
relation. If the points are scattered on a grid and do<br />
not lie on a line or a curve, there is no relationship.<br />
6. William has a head start of about 40 m. He runs for<br />
10 s, slows down for 8 s, then runs for 12 s and<br />
slows down until he reaches the finish line at 40 s.<br />
Rhiannon runs for 12 s, slows down for 8 s, runs for<br />
10 s, overtakes William, and wins the race in 34 s.<br />
4. a)<br />
Frame<br />
number<br />
Number<br />
of tiles<br />
1 1<br />
2 3<br />
3 5<br />
4 7<br />
5 9<br />
6 11<br />
First<br />
differences<br />
2<br />
2<br />
2<br />
2<br />
2<br />
334 ANSWERS
) See the table in part a. The relation is linear<br />
because the first differences are equal.<br />
c) Yes, the points lie on a straight line.<br />
d) The graph is a curve that goes up to the right.<br />
d) Extend the graph or the table: 17 tiles<br />
5. a) –4, –4, –4, –4; the volume of water in litres that<br />
leaks out every hour<br />
b) The relation is linear because the first<br />
differences are equal.<br />
c) Yes, the points lie on a straight line.<br />
e) 75 cm 2<br />
7. a) 5<br />
b) 125, 125, 125, 125; the distance in metres for<br />
5 lengths of the pool<br />
c) The relation is linear because the first<br />
differences are equal.<br />
d) Yes, the points lie on a straight line.<br />
6. a)<br />
d) 22 L; I assume water continues to leak at the<br />
rate of 4 L/h.<br />
e) Answers may vary. For example: When is there<br />
20 L of water in the barrel? Answer: After 5.5 h<br />
e) 25 m<br />
8. Answers will depend on the pattern drawn.<br />
6.2 Average Speed as Rate of Change, page 199<br />
1. a) 80 km/h b) 15 km/h<br />
2. a) The average speed of the car<br />
b) The average speed of the cyclist<br />
3. The rate of change is 75 km/h.<br />
4. a)<br />
b) 9, 15, 21<br />
c) The relation is non-linear because the first<br />
differences are different.<br />
b) 1.2 km/min<br />
ANSWERS 335
c) 1.2 km/min; the average speed is equal to the<br />
rate of change<br />
d) 72 km/h<br />
5. a)<br />
Time<br />
(min)<br />
Distance<br />
(km)<br />
0 0<br />
30 2<br />
60 4<br />
90 6<br />
120 8<br />
150 10<br />
180 12<br />
210 14<br />
240 16<br />
b) Yes, the points lie on a straight line through<br />
the origin.<br />
c) 0.4 cm/g; for every increase in mass of 1 g,<br />
the spring stretches 0.4 cm.<br />
5. Answers will vary depending on the quantities<br />
chosen; for example, the rate of change could<br />
represent the average speed in kilometres per hour.<br />
a), b) Cost of party on the vertical axis; number of<br />
guests on the horizontal axis<br />
c) The rate of change is $5 per guest; this means<br />
that each guest costs $5 after $100 has been<br />
paid to rent the hall.<br />
6. It will take 12 min in total, or 8 min from when the<br />
plane is at 1200 m<br />
7. a) Approximately 2300 m and 1300 m<br />
b) Approximately –143 m/min<br />
c) The height is decreasing at a rate of 143 m<br />
per minute.<br />
8. a) For the horizontal portion of the graph, the rate<br />
of change is 0. For the sloping portion of the<br />
graph, the rate of change is $1.25/person.<br />
b) The cost is constant at $20 for any number of<br />
people from 0 to 10.<br />
For 11 or more people, the cost increases by<br />
$1.25 per person.<br />
c) $2.50<br />
6.4 Direct Variation, page 207<br />
1<br />
b) 0.06<br />
km/min or , the distance the hikers<br />
15<br />
walk in 1 min<br />
c) Use the graph or table, 225 min<br />
d) 4 km/h<br />
e) Answers may vary. For example: How far have<br />
hikers travelled after 2.5 h? Answer: 10 km<br />
6. Make a table of values; draw a graph; calculate<br />
each average speed: Keta because her average<br />
speed is 10.5 km/h.<br />
6.3 Other Rates of Change, page 203<br />
1. a) 15 km/L b) $25 per guest<br />
2. a) The distance driven on 1 L of gas<br />
b) The cost for 1 guest<br />
3. Smart car: 792 km; SUV: 720 km<br />
4. a)<br />
1. a) No, the graph does not pass through origin.<br />
b) Yes, the graph passes through the origin.<br />
c) Yes, the graph passes through the origin.<br />
d) No, the graph is not a straight line.<br />
2. a)<br />
Side<br />
length<br />
(cm)<br />
b) 4 cm/cm<br />
Perimeter<br />
(cm)<br />
0 0<br />
1 4<br />
2 8<br />
3 12<br />
4 16<br />
5 20<br />
336 ANSWERS
c) The perimeter is 4 times the side length.<br />
d) 44 cm<br />
3. a) This is a direct variation situation because the<br />
graph is a straight line through the origin<br />
5. a)<br />
Number of<br />
trees, n<br />
Earnings,<br />
E ($)<br />
0 0<br />
100 16<br />
200 32<br />
300 48<br />
400 64<br />
500 80<br />
600 96<br />
4. a)<br />
b) 13 L/flush; one toilet flush uses 13 L of water.<br />
c) The water use in litres is 13 times the number<br />
of flushes.<br />
d) 221 L<br />
Mass of bird<br />
seed (kg)<br />
Cost<br />
($)<br />
700 112<br />
800 128<br />
900 144<br />
1000 160<br />
b) Yes. The graph is a straight line through<br />
the origin.<br />
1 0.86<br />
2 1.72<br />
3 2.58<br />
4 3.44<br />
5 4.30<br />
6 5.16<br />
b) Yes, the graph is a straight line passing through<br />
the origin.<br />
c) $0.16 per tree; the earnings for planting 1 tree<br />
d) E = 0.16n where E is the earnings in dollars<br />
and n is the number of trees planted<br />
e) $272<br />
6. a) Yes, the graph is a straight line through<br />
the origin.<br />
c) The cost in dollars is 0.86 times the mass<br />
in kilograms.<br />
d) $11.18<br />
e) Yes, when 2 quantities are related by direct<br />
variation, when you double one quantity, the<br />
other quantity also doubles: the cost is $22.36.<br />
b) 3.1; the increase in circumference when the<br />
diameter increases by 1 cm; it is an<br />
approximate value of π.<br />
c) C = 3.1d, where C is the circumference and d is<br />
the diameter.<br />
d) About 40.3 cm<br />
ANSWERS 337
7. a) Yes, the graph is a straight line through<br />
the origin.<br />
4. a) Join the points with a solid line because all<br />
altitudes and temperatures are possible.<br />
b) $0.015/g; the cost of 1 g of trail mix<br />
c) C = 0.015m<br />
d) $5.10<br />
e) Questions may vary: How much trail mix could<br />
you buy with $4.00? Answer: About 270 g<br />
8. Answers may vary. For example:<br />
a) The cost in dollars of v kilograms of apples that<br />
cost $0.90 for 1 kg<br />
b) The distance in kilometres driven at 90 km/h<br />
for t hours<br />
c) The cost in dollars for n books that each<br />
cost $5.50<br />
9. Answers may vary.<br />
10. a) We cannot tell, because Anastasia might have<br />
stopped for a coffee on the way to work.<br />
b) 44 km/h<br />
6.5 Partial Variation, page 213<br />
1. a) Yes, the graph is a straight line not passing<br />
through the origin.<br />
b) No, the graph is not a straight line.<br />
c) Yes, the graph is a straight line not passing<br />
through the origin.<br />
d) No, the graph passes through the origin so it<br />
represents direct variation.<br />
2. a) $45; $1/subscription<br />
c) 3000 m; –400 m/lap<br />
3. a)<br />
5. a)<br />
b) Yes, the graph is a straight line not passing<br />
through the origin.<br />
c) i) About 90°C<br />
ii) About 83°C<br />
Number<br />
of guests<br />
Cost<br />
($)<br />
0 500<br />
10 750<br />
20 1000<br />
30 1250<br />
40 1500<br />
50 1750<br />
b) Join the points with a broken line because<br />
a fraction or decimal number of guests is<br />
not possible.<br />
b) Yes, the graph is a straight line not passing<br />
through the origin.<br />
c) About –19°C, about 1°C<br />
c) Yes, the graph is a straight line not passing<br />
through the origin.<br />
d) $25/person; the extra cost for each<br />
extra person<br />
e) $1625, $2750<br />
f) No, the situation is not represented by direct<br />
variation, so the cost is not proportional to the<br />
number of guests.<br />
6. a) C = 20 + 0.10n<br />
b) $38.00<br />
7. a) h = 25 + 1.3n<br />
b) 32.8 cm, 37.35 cm<br />
338 ANSWERS
c) Questions may vary. How much did Nuri’s hair<br />
grow in 3 months? Answer: 3.9 cm<br />
8. Answers may vary.<br />
a) i) The cost in dollars of a party when the hall<br />
rental costs $150 and the cost per person<br />
is $20<br />
ii) The length in centimetres of a rectangle<br />
when the length is 20 times the width<br />
iii) The cost in dollars for m items, when<br />
1 item costs $0.75<br />
b) Equations ii and iii represent direct variation<br />
because their graphs are straight lines that<br />
pass through the origin.<br />
Equation i represents partial variation because<br />
its graph is a straight line that does not pass<br />
through the origin.<br />
9. a)<br />
11. a) i) Yes, the number of points is a fixed number<br />
plus a number that depends on the number<br />
of items handed in<br />
ii) P = 5i + 20, where P is the total number<br />
of points when i items are handed in within<br />
45 min<br />
b) i) 41 or more items<br />
ii) 45 or more items<br />
Chapter 6 Mid-Chapter Review, page 220<br />
1. a) The height increase in 1 min<br />
4. a)<br />
Time<br />
(min)<br />
Height<br />
(m)<br />
0 0<br />
1 200<br />
2 400<br />
3 600<br />
4 800<br />
First<br />
differences<br />
200<br />
200<br />
200<br />
200<br />
b) Yes, all first differences are equal.<br />
c) The rate of change is 200 m/min; it has the<br />
same numerical value as the first differences.<br />
10. a)<br />
b) $50; it is the vertical intercept.<br />
c) $0.25/poster; the cost per poster after the fixed<br />
cost has been paid<br />
d) C = 50 + 0.25p, where C is the cost in dollars<br />
for p posters sold<br />
e) $112.50<br />
d) 8 min from when the plane took off<br />
2. a)<br />
b) $2.75; it is the vertical intercept.<br />
c) $1.70/km; the cost per kilometre after the fixed<br />
cost has been paid<br />
d) C = 2.75 + 1.70d, where C is the cost in dollars<br />
for a ride that is d kilometres<br />
e) $28.25<br />
f) The flat rate fare (the partial variation fare is<br />
$165.95)<br />
b) i) 255 m<br />
ii) 340 m<br />
c) 17 m/s<br />
d) 17 m/s<br />
ANSWERS 339
3. a)<br />
b)<br />
Rental<br />
time<br />
(days)<br />
Cost<br />
($)<br />
0 0<br />
2 66<br />
4 132<br />
6 198<br />
8 264<br />
10 330<br />
6.6 Changing Direct and Partial Variation Situations,<br />
page 222<br />
1. a) Direct variation; there is no fixed or initial cost.<br />
b) Partial variation; there is a fixed cost plus a cost<br />
that depends on the number of brochures printed.<br />
c) Partial variation; there is a fixed amount plus<br />
an amount that depends on the number of<br />
subscriptions sold.<br />
2. a) Partial variation<br />
b) Direct variation<br />
c) Direct variation<br />
d) Partial variation<br />
3. a) Direct variation<br />
b)<br />
Time<br />
(min)<br />
Cost<br />
($)<br />
0 0<br />
10 2.00<br />
20 4.00<br />
30 6.00<br />
4. a)<br />
c) Direct variation because the graph is a straight<br />
line passing through the origin<br />
d) $33/day; the daily cost to rent a kayak<br />
Mass of<br />
turkey<br />
(kg)<br />
b) 165 min<br />
Cooking<br />
time<br />
(min)<br />
0 15<br />
2 75<br />
4 135<br />
6 195<br />
8 255<br />
10 315<br />
c), e)<br />
40 8.00<br />
50 10.00<br />
60 12.00<br />
70 14.00<br />
80 16.00<br />
90 18.00<br />
100 20.00<br />
c) Cooking time is 30 min plus 30 min times the<br />
mass in kilograms<br />
d) t = 30m + 15<br />
e) 231 min<br />
d) C = 0.20t<br />
e) i) The new graph is steeper than the original<br />
graph; the rate of change increases from<br />
$0.20/min to $0.25/min.<br />
ii) The rate of change increases as in part i:<br />
C = 0.25t<br />
4. The second pay scale is better because Jocelyn<br />
earns more money when she sells 2 or more ads.<br />
340 ANSWERS
5. a)<br />
Time<br />
(min)<br />
Cost<br />
($)<br />
b)<br />
0 12.00<br />
10 13.00<br />
20 14.00<br />
30 15.00<br />
b), d)<br />
40 16.00<br />
50 17.00<br />
60 18.00<br />
70 19.00<br />
80 20.00<br />
90 21.00<br />
100 22.00<br />
c) C = 12 + 0.10t<br />
d) i) The new graph is less steep and its vertical<br />
intercept is greater.<br />
ii) C = 20 + 0.08t<br />
6. For the plan in question 3, the cost doubles when<br />
the time doubles because the plan is represented by<br />
direct variation and the cost is proportional to the time.<br />
For the plan in question 5, the cost does not<br />
double when the time doubles because the plan<br />
is represented by partial variation and the cost is<br />
not proportional to the time.<br />
7. a)<br />
Distance<br />
(km)<br />
Cost<br />
($)<br />
0 29.00<br />
c) Neither; the graph is not a straight line.<br />
d) The graph has 2 segments: one horizontal<br />
segment that represents a fixed cost of<br />
$29 up to 100 km, and a sloping segment<br />
that shows how the cost changes as the<br />
distance increases.<br />
e) $29.00, $36.50, $47.00<br />
6.7 Solving Equations, page 229<br />
1. a) x = 4 b) x = 9 c) x = 18<br />
d) x = 2 e) x = 1 f) x = 9<br />
2. a) x + 4 = 9; x = 5<br />
b) 2x + 5 = 13; x = 4<br />
c) 3x = 18; x = 6<br />
d) 6 = x + 3; x = 3<br />
e) 11 = 2x + 3; x = 4<br />
f) 2x = 8; x = 4<br />
3. a) x = 5 b) x = 3 c) x = 7<br />
d) x = 3 e) x = 2 f) x = 8<br />
4. a) x = –1 b) x = –1 c) x = –1<br />
d) x = –3 e) x = –2 f) x = –3<br />
g) x = –10 h) x = –4<br />
6. a) 24 cm b) 10 cm<br />
c) 15 cm<br />
7. a) 86°F b) –10°C<br />
8. 206 barrels<br />
9. a) i) 2x + 40 + 70 = 180<br />
ii) 5x + 20 = 50<br />
iii) 58 + 58 + 3x + 7 = 180<br />
b) i) x = 35<br />
ii) x = 6<br />
iii) x = 19<br />
6.8 Determining Values in a Linear Relation, page 233<br />
1. a) i) $48 ii) $96<br />
b) i) $80 ii) $240 iii) $400<br />
2. a)<br />
50 29.00<br />
100 29.00<br />
150 34.00<br />
200 39.00<br />
250 44.00<br />
300 49.00<br />
ANSWERS 341
) About 19 s<br />
c) About 24 s; assume cheetah maintains an<br />
average speed of 21 m/s<br />
d) d = 21t<br />
e) About 19 s; about 23.8 s<br />
Using the formula is easier and more precise<br />
than using the graph.<br />
3. a) 15 min<br />
b) After 25 games<br />
5.<br />
c) V = 35 – 1.40n<br />
d) 25 games<br />
e) Answers may vary.<br />
b)<br />
Time<br />
(min)<br />
Height<br />
(cm)<br />
0 13.0<br />
5 12.0<br />
10 11.0<br />
15 10.0<br />
20 9.0<br />
c) Answers may vary. For example:<br />
The table is the easiest way.<br />
4. a) After 25 games<br />
Number<br />
of games<br />
played, n<br />
Value<br />
of<br />
card, V<br />
($)<br />
1 35.00<br />
2 28.00<br />
3 21.00<br />
4 14.00<br />
a) The vertical intercept changes from $35 to $45.<br />
The graph is less steep.<br />
b) 50 games in total, so 25 more games<br />
c) Answers may vary. For example: The $45 card<br />
is the better deal.<br />
6.9 Solving Problems Involving Linear Relations,<br />
page 237<br />
1. a)<br />
Distance<br />
travelled<br />
(km)<br />
Fare<br />
($)<br />
0 2.00<br />
1 3.50<br />
2 5.00<br />
3 6.50<br />
4 8.00<br />
5 9.50<br />
5 7.00<br />
6 0<br />
342 ANSWERS
)<br />
c)<br />
Time<br />
(months)<br />
Amount<br />
($)<br />
0 900<br />
1 750<br />
2 600<br />
3 450<br />
4 300<br />
5 150<br />
6 0<br />
Dollars<br />
Pesos<br />
0 0<br />
20 180<br />
40 360<br />
60 540<br />
80 720<br />
e) Car A: About 1.2 h; car B: about 1.8 h<br />
4. $800<br />
a)<br />
Sales, s<br />
($)<br />
Earnings,<br />
E ($)<br />
1000 550<br />
2000 600<br />
3000 650<br />
4000 700<br />
5000 750<br />
6000 800<br />
b) Use E = 500 + 0.05s; $800<br />
c) Answers may vary. d) Drawing a graph<br />
5. a) 20 min<br />
b) Use: a graph; an equation; a table of values<br />
6. 25 min<br />
7. a) d = 3 + 2t<br />
b) Answers may vary. For example: The distance a<br />
ball travels at an average speed of 2 m/s, and the<br />
ball has rolled 3 m before the time is measured.<br />
100 900<br />
2. a) Partial variation because the points lie on a line<br />
not passing through the origin.<br />
b)<br />
3. a)<br />
Frame<br />
Toothpicks<br />
1 6<br />
2 11<br />
3 16<br />
4 21<br />
5 26<br />
6 31<br />
7 36<br />
c) T = 5n + 1 d) 86 toothpicks<br />
Time (h)<br />
Car A<br />
distance (km)<br />
Car B<br />
distance (km)<br />
6.10 Two Linear Relations, page 242<br />
1. a) About 290 m<br />
b) About (5.5, 250); the two balloons meet after<br />
5.5 min at a height of about 250 m.<br />
2. a) 4000 m or 4 km<br />
b)<br />
Time (min)<br />
Nyla’s<br />
distance (m)<br />
Richard’s<br />
distance (m)<br />
0 4000 0<br />
5 3500 1500<br />
10 3000 3000<br />
15 2500 4500<br />
20 2000 6000<br />
25 1500 7500<br />
30 1000 9000<br />
0 0 0<br />
0.5 45 30<br />
1 90 60<br />
1.5 135 90<br />
2 180 120<br />
b) Car A: d = 90t; car B: d = 60t<br />
c) Car A; the average speed is the rate of change.<br />
d) Car A: 157.5 km; car B: 105 km<br />
ANSWERS 343
c) (10, 3000); Nyla and Richard meet after 10 min,<br />
when Richard has travelled 3000 m, and Nyla<br />
is 3000 m from where Richard started.<br />
3. a)<br />
Laps<br />
Sophie’s<br />
pledges ($)<br />
Hatef’s<br />
pledges ($)<br />
0 96 0<br />
10 146 130<br />
20 196 260<br />
30 246 390<br />
40 296 520<br />
50 346 650<br />
Chapter 6 Review, page 248<br />
1. a)<br />
b)<br />
Frame<br />
number<br />
Number of<br />
squares<br />
1 1<br />
2 4<br />
3 9<br />
4 16<br />
5 25<br />
6 36<br />
First<br />
differences<br />
3<br />
5<br />
7<br />
9<br />
11<br />
c) Non-linear relationship because the first<br />
differences are not equal<br />
e) The points lie on a curve so the relationship is<br />
non-linear.<br />
b) Hatef: $650; Sophie: $346<br />
c) (12, 156); when both people have swum<br />
12 laps, each has earned $156 in pledges.<br />
4. a) C = 150 + 0.25n b) R = 2.25n<br />
c)<br />
2. a) 70 km/h; average speed of a car<br />
b) –2 L/h; the rate at which water evaporates<br />
3. a) Direct variation because the graph is a straight<br />
line passing through the origin<br />
b) Partial variation because the graph is a straight<br />
line not passing through the origin<br />
4. a)<br />
d) 75 treats<br />
5. a) In 2.5 h; each person has read 100 pages.<br />
b) Answers may vary; table of values; graph<br />
b) $62.50<br />
c) 400 packets<br />
d) 560 packets<br />
344 ANSWERS
5. a)<br />
10. a) Speed Dot Company: C = 2.40t<br />
Communications Plus: C = 12 + 0.90t<br />
b)<br />
Time (h) Cost ($)<br />
Speed Dot<br />
Company<br />
Cost ($)<br />
Communication<br />
Plus<br />
0 0.00 12.00<br />
2 4.80 13.80<br />
4 9.60 15.60<br />
6 14.40 17.40<br />
6. a)<br />
b) The rental cost when a snowboard is rented<br />
for 8 h<br />
c) $3/h; the extra cost ($3 per hour) for renting<br />
a snowboard beyond 8 h<br />
d) C = 3t + 28<br />
8 19.20 19.20<br />
10 24.60 21.00<br />
Time<br />
(min)<br />
Volume<br />
of air (m 3 )<br />
b), d)<br />
0 0<br />
1 450<br />
2 900<br />
3 1350<br />
4 1800<br />
5 2250<br />
6 2700<br />
c) (8, 19.20); for 8 h of use, both plans cost the<br />
same amount, $19.20<br />
d) Jo-Anne should choose Speed Dot Company<br />
because it is cheaper for 7 h.<br />
Chapter 6 Practice Test, page 250<br />
1. C<br />
2. D<br />
3. a)<br />
c) V = 450t<br />
d) i) The new graph is less steep.<br />
ii) V = 225t<br />
7. a) x = 1 b) x = –4 c) x = 4<br />
d) x = –3 e) x = 3 f) x = –5<br />
8. a) Cost in dollars is 6 plus 0.75 times the number<br />
of toppings.<br />
b) C = 6.00 + 0.75n<br />
c) 5 toppings; use a table, a graph, or the<br />
equation<br />
9. a) 27 cm b) 140 cm<br />
c) L = 0.15h, where L is the length of the foot in<br />
centimetres and h is the height in centimetres<br />
d) Make a table; draw a graph.<br />
b) $8/h c) $288 d) 27 h<br />
4. Answers may vary. For example:<br />
The cost of hall rental before any guests are<br />
included ($250)<br />
The cost for each guest, above the hall rental<br />
($15/person)<br />
The cost for 10 guests ($400); 20 guests ($550);<br />
30 guests ($700); 40 guests ($850);<br />
50 guests ($1000)<br />
ANSWERS 345
5. $80<br />
a)<br />
10. a) i) 2x + 1 ii) 6x 2 – 9x<br />
iii) 4x 2 + 6x + 3 iv) –3x 2 + x + 1<br />
b) Answers may vary. For example: –5x 2 – 1<br />
There are no like terms.<br />
11. a) x 3<br />
b) x 3 cube<br />
c) i) 8x 3 ii) 4x 3 + 8x iii) 3x 3 + 3x 2 + 5<br />
12. a) To ensure it has a different area. The y-tile<br />
represents a variable different from x.<br />
b)<br />
b) C = 20 + 2a; the ad will cost $80.<br />
c) Answers may vary.<br />
6. For 190 brochures, the costs are equal ($470).<br />
For less than 190 brochures, printer B is cheaper.<br />
For more than 190 brochures, printer A is cheaper.<br />
c) –5x – y + 3. There are no like terms.<br />
7.2 Modelling the Sum of Two Polynomials, page 259<br />
1. a) –x + 5 b) 3x 2 + 2x – 3<br />
2. a) –2x 2 – 3<br />
Chapter 7 Polynomials<br />
7.1 Like Terms and Unlike Terms, page 255<br />
1. a) 2x 2 b) 2x + 3<br />
c) –2x + 4 d) –x 2 + 3x – 2<br />
e) 4x 2 + 6x – 1 f) –3x 2 – x – 2<br />
2. a) b)<br />
b) 2x 2 + 3<br />
c) –2x 2 + 3<br />
c) d)<br />
d) –4x 2 + 7<br />
e) f)<br />
3. 1, x, x 2 ; the name of the tile describes its area.<br />
4. 2x and –4x are like terms.<br />
They are modelled by like tiles.<br />
5. 3x 2 and 3x are unlike terms. They are modelled by<br />
different sized tiles.<br />
6. a) –5x, 4x, –3x, 7x b) –3x 2 , x 2 , 3x 2<br />
c) Like terms have the same variable raised to the<br />
same exponent.<br />
7. a) x + 4 b) 2 + x c) –2x 2 – x – 1<br />
d) 3x 2 + x + 1 e) 2x + 4 f) x 2 + 2x + 1<br />
8. a) 5x + 4 b) 7x 2 + 3x c) x 2 + x + 4<br />
9. Answers may vary. For example: x – 4x + 3 + 5x – 1,<br />
which simplifies to 2x + 2.<br />
3. a) 6x + 2 b) 3x + 2 c) 4x + 1<br />
d) –x – 2 e) 2x – 8 f) 2x + 4<br />
4. a) 8x 2 + 3x – 1 b) 2x 2 – 12x – 5<br />
c) 4x 2 – x + 1 d) –x 2 + 2x – 8<br />
e) –5x 2 + 2x + 4 f) x 2 + 5x – 3<br />
5. x 3 – 4x 2 + 3x – 2. I combined like terms.<br />
6. a) 5x + 9 b) 18x + 16<br />
c) 8x + 12 d) 8x + 4<br />
7. a) Choose part a: 49 b) 49<br />
c) Evaluate after simplification because there is<br />
less arithmetic to do.<br />
8. a) 2x 2 + 2x + 2 b) x 2 + x + 1<br />
c) 0 d) –x 2 – x – 1<br />
e) –2x 2 – 2x – 2 f) –2x 2 – 3x – 3<br />
9. For example, (x 2 + x + 1) + (2x 2 – 3x + 4). There is<br />
no limit to the number of polynomials that can be<br />
found. Algebra tiles help.<br />
10. –x 2 – 2x + 5. I used algebra tiles.<br />
346 ANSWERS
7.3 Modelling the Difference of Two Polynomials,<br />
page 265<br />
1. x 2 – x + 1<br />
2. a) 2x + 1 b) 2x + 5<br />
c) 8x + 1 d) 8x + 5<br />
3. a) x 2 + x + 3 b) x 2 – x – 5<br />
c) 5x 2 – 3x – 3 d) x 2 – x + 3<br />
4. a) –3x + 2 b) 2x 2 – 3x<br />
c) –4x 2 + 7x – 6 d) x 2 – 5x + 4<br />
5. a) 2 b) 12<br />
c) 2x + 2 d) 2x + 12<br />
6. a) x 2 – 4 b) x 2 + x<br />
c) –1 – 2x 2 d) 3x – 9x 2<br />
7. a) 2x 2 + 3x – 6 b) –2x + 2<br />
c) x 2 + 4x – 7 d) –2 + 2x – 2x 3<br />
e) 3 + 6x – 5x 3 f) 0<br />
8. a) John did not properly subtract each term of the<br />
second polynomial.<br />
b) –x 2 – 6x + 10<br />
c) Check by adding (3x 2 + 2x – 4) to the answer to<br />
obtain 2x 2 – 4x + 6.<br />
9. a) i) x 2 + 4x ii) –x 2 – 4x iii) –12 + 2x 3<br />
iv) 12 – 2x 3 v) 0 vi) 0<br />
b) The answers in each pair are opposite<br />
polynomials.<br />
c) Answers may vary. For example:<br />
(x + 1) – (3x 2 + 3) = –3x 2 + x – 2<br />
(3x 2 + 3) – (x + 1) = 3x 2 – x + 2<br />
The answers are also opposite polynomials.<br />
10. a) i) For example, 3x + 4 ii) – 3x – 4<br />
b) 6x + 8. It is the polynomial in part a) i) added<br />
to itself.<br />
c) There is a pattern. Subtracting the opposite<br />
polynomial is the same as adding the opposite<br />
of the opposite polynomial, which is the original<br />
polynomial. The result will always be the<br />
original polynomial added to itself.<br />
11. Answers may vary. For example:<br />
(x 2 + 6x – 6) – (3x 2 + 2x – 1)<br />
There is no limit to the number of possible<br />
polynomials.<br />
Chapter 7 Mid-Chapter Review, page 268<br />
1. No. The order in which the terms are written does<br />
not matter.<br />
2. a) 4x – 2 b) 1 – x 2<br />
c) 2x 2 + 3x – 2 d) –4x 2 + 5x – 3<br />
3. a) 8x + 6 b) 2x + 2<br />
c) 3x 2 – 3 d) –2 – x<br />
e) –4x + 2 f) 5x 3 + 2x<br />
g) –x 2 + x – 2<br />
4. No. The terms are unlike.<br />
5. Answers may vary.<br />
For example: 3x + 6x – 5x + 4x, which simplifies<br />
to 8x. I used only like terms.<br />
6. x 2 + 2x – 1<br />
7. a) 8x + 9 b) 2x + 2<br />
c) 10x 2 – 4x – 2 d) 6x 2 – x – 4<br />
e) –x 2 + 3x – 1 f) –x 2 + x – 3<br />
8. 2x 2 + 2x + 3<br />
9. a) 5x + 7 b) 12x + 8<br />
10. a) –x – 3 b) –3x 2 + 5x<br />
c) –2x 2 – 3x – 7 d) 5x 2 + 2x + 1<br />
11. a) 7 b) 6x 2 – 2x<br />
c) –2x 2 + x + 9 d) –5x 2 – 6x + 2<br />
e) 3x + 7<br />
7.4 Modelling the Product of a Polynomial and a<br />
Constant Term, page 271<br />
1. a) 2(2x + 2) = 4x + 4<br />
b) 3(2x + 1) = 6x + 3<br />
c) 2(3x + 2) = 6x + 4<br />
2. a) 8x + 2<br />
b) 6x + 2<br />
c) 10x + 15<br />
d) 16x + 12<br />
3. a) 3(2x + 7) = 6x + 21<br />
b) 3(1 + 4x) = 3 + 12x<br />
c) 5(2x + 9) = 10x + 45<br />
d) 5(x + 8) = 5x + 40<br />
4. a) The coefficient of x increases by 2 and the<br />
constant term increases by 1 each time.<br />
12x + 6; 14x + 7<br />
b) The constant term increases by 1 and<br />
coefficient of x increases by 2 each time.<br />
6 – 12x; 7 – 14x<br />
ANSWERS 347
5. –400x 2 – 100x + 400; Algebra tiles are not useful<br />
because you would need too many tiles.<br />
6. Use CAS. The screen shows 3x 2 + 12x – 6.<br />
Jessica forgot to multiply every term by 3.<br />
7. a) 21x – 7 b) 12x – 15 c) 12x – 8<br />
d) 25x 2 – 15x e) –8x 2 + 12<br />
f) 9x 2 + 9x – 54<br />
8. a) –8x – 4 b) –15x 2 + 9 c) –2x – 8<br />
d) –7x 2 + 35 e) 10x 2 – 2x f) 18 – 12x<br />
9. a) –2x 2 + 4x – 8 b) 3x 2 – 9x + 21<br />
c) 8x 3 – 4x 2 – 2x d) 24x 3 + 16x 2 – 24<br />
e) –12x 2 + 6x – 30 f) 4x 2 – 12x – 12<br />
I used paper and pencil and the distributive law.<br />
10. a) Square A: P = 4(4x + 1) = 16x + 4<br />
Square B: P = 4 × 3 × (4x + 1) = 48x + 12<br />
b) 32x + 8<br />
11. I would start by modelling the multiplication by the<br />
opposite (positive) constant.<br />
Then, I would replace each tile by its opposite<br />
and write the result.<br />
For example: –2(x + 1). First model 2(x + 1)<br />
Replace each tile by its opposite to model –2(x + 1).<br />
–2(x + 1) = –2x – 2<br />
7.5 Modelling the Product of Two Monomials,<br />
page 277<br />
1. a) 12 b) 12x c) 12x 2<br />
2. All have coefficient 12. The first product has no<br />
factor of x, each of the other products has a<br />
different power of x.<br />
3. a) 2x 2 b) 4x 2 c) 6x 2<br />
4. a) 3x 2 b) 5x 2 c) 15x 2 d) 4x 2<br />
e) 4x 2 f) 12x 2 g) 14x 2 h) 9x 2<br />
5. a) The coefficients increase by 2 each time: 12x 2 ,<br />
14x 2 , 16x 2<br />
b) The coefficients increase by 3 each time: 18x 3 ,<br />
21x 3 , 24x 3<br />
6. a) 6x 3 b) 4x 3 c) 3x 3 d) x 3<br />
e) 24x 3 f) 16x 3 g) 24x 3 h) 9x 3<br />
7. a) –6x b) –16x c) –8x d) –35x<br />
e) –18x f) –10x g) –81x h) 18x<br />
8. a) –6x 3 b) –12x 3 c) 20x 3 d) –x 3<br />
e) –32x 3 f) –4x 3 g) –12x 3 h) 36x 3<br />
9. Use algebra tiles.<br />
10. a) i) 15x 2 ii) –15x 2 iii) 15x<br />
iv) 15x v) 15x 2 vi) –15x 2<br />
vii) 15x 2 viii) 15x 3<br />
b) All the products in part a except viii) 15x 3 .<br />
An x 3 term cannot be modelled with algebra tiles.<br />
c)<br />
11. Eighteen different pairs of monomials are possible:<br />
(1)(36x 3 ); (x)(36x 2 ); (x 2 )(36x); (x 3 )(36); (2)(18x 3 );<br />
(2x)(18x 2 ); (2x 2 )(18x); (2x 3 )(18); (3)(12x 3 );<br />
(3x)(12x 2 ); (3x 2 )(12x); (3x 3 )(12); (4)(9x 3 ); (4x)(9x 2 );<br />
(4x 2 )(9x); (4x 3 )(9); (6)(6x 3 ); (6x)(6x 2 )<br />
7.6 Modelling the Product of a Polynomial and a<br />
Monomial, page 281<br />
1. a) x 2 + 3x b) 2x 2 + 6x<br />
c) 2x 2 + x d) 4x 2 + 2x<br />
2. a) 2x(3x + 4) = 6x 2 + 8x<br />
b) x(2x + 3) = 2x 2 + 3x<br />
c) 3x(2x + 1) = 6x 2 + 3x<br />
d) 3x(x + 4) = 3x 2 + 12x<br />
3. a) 3x 2 + 2x b) 4x 2 + 6x<br />
c) 6x 2 + 3x d) 12x 2 + 16x<br />
4. a) 4x 2 + 12x b) 2x 2 + 3x<br />
c) 2x 2 + 12x d) 15x 2 + 6x<br />
5. a) Each first term is x 2 . The coefficients of x<br />
increase by 1 each time.<br />
b) x 2 + 7x; x 2 + 8x<br />
6. Use an area model.<br />
The area of the rectangle is x 2 + x.<br />
7. a) 12x 2 – 4x b) 8x 2 – 2x c) 5x 2 – 35x<br />
d) –4x 2 + 3x e) 6x 3 – 8x f) –8x 2 – 12x<br />
g) 6x 2 – 12x h) –x 2 – x<br />
8. a) –2x 2 – 6x b) –2x 2 – x c) 2x 2 + 7x<br />
d) –6x + 3x 2 e) –28x 2 + 63x f) –2x 2 – 3x<br />
g) –6x 2 + 10x h) –12x 2 – 18x<br />
9. a) 2x 3 + 4x 2 b) –9x 3 + 15x 2 c) 32x 3 + 24x<br />
d) 14x 3 + 21x 2 – 7x e) –8x 3 + 10x 2 – 14x<br />
f) 12x 3 – 9x 2 – 27x g) –2x 2 + 6x 3 – 2x<br />
h) x 3 – 9x + x 2<br />
10. 5x(9x + 7) – x(6x + 4) = 39x 2 + 31x<br />
7.7 Solving Equations with More than One Variable<br />
Term, page 285<br />
1. a) x = 1 b) x = 3 c) x = 4<br />
d) x = 2<br />
2. a) x = 7 b) x = –4 c) x = –6<br />
d) x = –2 e) x = 1 f) x = 8<br />
3. a) x = –7 b) x = 4 c) x = –1<br />
d) x = 6 e) x = –1 f) x = 2<br />
g) x = –1 h) x = 49<br />
348 ANSWERS
4. Substitute to check. a) L.S = –17; R.S. = –17<br />
b) L.S. = 31; R.S. = 31<br />
5. a) x = 8 b) x = 2 c) x = 1<br />
d) x = –3 e) x = 21 f) x = 7<br />
6. a) x = 2 b) x = –13 c) x = –2<br />
d) x = –3 e) x = 1 f) x = 15<br />
7. x = 5000. The number of parts that must be made<br />
and sold for the business to break even<br />
8. a) x = 12 b) x = –1 c) x = 2<br />
Chapter 7 Review, page 288<br />
1. x has different exponents in each monomial.<br />
2. a) –5x + 3 b) 2x 2 + 4x – 2<br />
c) 3x 2 + 3x – 1<br />
3. a)<br />
b)<br />
4. a) 7x + 7 b) 7x + 6 c) 3x 2 – 5x<br />
d) 3 + x e) –3x 3 + 3 f) x 3 + 4x<br />
5. For example, 2x 2 + x + 3 + x 2 – 3x<br />
6. a) 7x – 2 b) –2x 2 – x<br />
c) 5x 2 – 2 d) 3x + 11<br />
e) 7x 2 + 3x – 2 f) 3x 2 + 4x – 1<br />
g) 4x 2 – 7x + 1<br />
7. Use algebra tiles.<br />
a) 9x – 3 b) –x 2 + 4x<br />
c) –2x 2 – 7x + 12 d) 3x 2 – 3x + 11<br />
8. a) –12 b) –2x 2 + 9<br />
c) 2x 2 – 5x d) 2x 2 + 2x + 2<br />
e) –8x 2 + 6x + 5 f) x 2 – 4x + 6<br />
9. a) 15x 2 + 20 b) 28 + 8x<br />
c) 3x 3 – 6x 2 + 6 d) 16x 2 + 24x – 32<br />
e) 14x 3 – 7<br />
10. a) –6x – 12 b) –7x 2 + 28<br />
c) –4x 2 – 2 d) –15x 3 + 10x + 15<br />
e) –3x 3 + 6x 2 – 12<br />
11. 16x – 4; 20x – 4; 24x – 4<br />
12. a) b)<br />
c) –15x 2 – 35x d) 8x 3 + 10x 2 – 6x<br />
16. a) 12x 3 ; 14x 3 ; 16x 3<br />
b) 4x 2 – 12x; 5x 2 – 15x; 6x 2 – 18x<br />
17. a) 6x + 1 = 2x + 13 b) x = 3 c) 3<br />
18. a) x = 2 b) x = 2 c) x = –3<br />
19. a) x = 6 b) x = –4<br />
c) x = –1 d) x = 3<br />
20. a) x = 1000<br />
b) The number of tickets that must be sold to raise<br />
$60 000 after expenses.<br />
Chapter 7 Practice Test, page 290<br />
1. C<br />
2. C<br />
3. a) 5x 2 – 4x – 5 b) –x 2 + 2x<br />
c) 3x + 12 d) 6x 3 e) 4x 3 – 20x 2 + 12x<br />
4. a) $4900 b) 320 students<br />
5. A polynomial can be simplified if it contains like<br />
terms. For example, 2x + 4 + 3x simplifies to 5x + 4.<br />
6. a) Joe forgot to subtract every term of the<br />
second polynomial.<br />
b) 2x 2 + 2x – 4<br />
c) Add the difference to the second polynomial.<br />
Cumulative Review Chapters 1–7, page 291<br />
1. a) P =Æ 29.7 cm; A = 51 cm 2<br />
b) P =Æ 31.4 cm; A =Æ 33.9 cm 2<br />
2. a) About 62.8 cm 3 b) About 23.9 cm 3<br />
c) 1440 cm 3 d) 400 cm 3<br />
e) About 7238.2 cm 3<br />
3. a) i) 10 cm by 10 cm<br />
ii) 17 m by 17 m<br />
iii) 22.5 cm by 22.5 cm<br />
b) i) 100 cm 2 ii) 289 m 2<br />
iii) 506.25 cm 2<br />
For a given perimeter, the rectangle with the<br />
greatest area is a square.<br />
4. 12 cm by 12 cm; 48 cm<br />
5. 20 units<br />
13. a) i) 24x 2 ii) 12x 3 iii) –12x 2 iv) 18x 3<br />
b) Parts i and iii. The other parts would require<br />
cubes.<br />
14. a) 3x 2 + 4x b) 3x 3 – 24x<br />
c) 8x – 2x 2 d) –18x 3 + 24x 2 + 12x<br />
You can use algebra tiles for parts a, b, and c. You<br />
cannot use them for part d because no tile<br />
represents x 3 .<br />
15. a) 6x 2 – 9x b) –2x 3 + 10x<br />
6. No; the sum of the angles in a triangle is 180°.<br />
The largest angle in a right triangle is 90°.<br />
7. a) a = 75°, b = 75°, c = 105°, d = 150°<br />
b) y = b = d = 100°; a = c = x = z = 80°<br />
c) m = 90°, n = p = 110°<br />
8. a) 72° b) 40° c) 36°<br />
9. a) n = 15 b) b = 18<br />
c) a = 6 d) m = 20<br />
ANSWERS 349
10. a) 72 km/h b) About $1.26/kg<br />
c) $8.50/h d) 3.6 km/h<br />
e) About $0.58/muffin<br />
11. a) 12 lengths b) 22.5 min<br />
12. a) $24.49 b) $28.16<br />
13. a) $37.50 b) $2537.50<br />
14. a) World records for women’s discus throw<br />
b) About 70.2 m, about 71.5 m<br />
c) 1974<br />
d)<br />
From C to D, Tyler drives at an average speed<br />
of 80 km/h for 45 minutes, and travels 60 km.<br />
From D to E, Tyler stops driving for 5 min.<br />
From E to F, Tyler drives at an average speed<br />
of 60 km/h for 40 min and travels 40 km.<br />
b) From B to C, Tyler buys gas (it is a longer<br />
stop). From D to E, Tyler picks up his cousin<br />
(it is a shorter stop).<br />
18. a)<br />
b) The relation is linear because the first<br />
differences are equal.<br />
Frame<br />
number<br />
Number of<br />
toothpicks<br />
First<br />
differences<br />
e) Extend the graph to the right: About 73.5 m<br />
15. a) Yes, as the width increases by 1 cm, the length<br />
decreases by 1 cm.<br />
b) Yes, the graph is a straight line.<br />
1 3<br />
2<br />
2 5<br />
2<br />
3 7<br />
2<br />
4 9<br />
2<br />
5 11<br />
2<br />
6 13<br />
c) Yes, the points lie on a straight line.<br />
c) i) 9.5 cm ii) 1.5 cm<br />
d) Length plus width is 15 cm.<br />
16. a), b)<br />
19. a) Yes, the graph is a straight line that passes<br />
through the origin.<br />
c) About 3.0 m d) About 1.39 s<br />
e) At about 0.18 s and at about 1.12 s<br />
17. a) From A to B, Tyler drives at an average speed<br />
of 60 km/h for 30 min and travels 30 km.<br />
From B to C, Tyler stops driving for about 15 min.<br />
350 ANSWERS
) 45 pesos/$; for $1, you can get 45 pesos.<br />
c) p = 45d<br />
d) 7875 pesos<br />
e) About $166.67<br />
f) Answers may vary.<br />
20. a) The new graph would be less sharp. (Refer to<br />
graph in question 19 part a).<br />
b) p = 25d<br />
21. a)<br />
23. a) C = 40 + n b) R = 3n<br />
c)<br />
Time (h) Cost ($)<br />
0 50<br />
10 85<br />
20 120<br />
30 155<br />
40 190<br />
50 225<br />
60 260<br />
b) No, the graph does not pass through the origin.<br />
c) C = 50 + 3.5n d) About 42 h<br />
22. a) The vertical intercept is greater and the graph<br />
is steeper. (Refer to graph in question 21<br />
part b).<br />
b) C = 75 + 4n c) About 31 h<br />
d) 20 sausages; then revenue is equal to cost.<br />
24. a) x 2 + 6x – 5<br />
b) –2x 2 – 3x + 2<br />
25. a) 7x + 3<br />
b) 2x 2 – 3x<br />
c) 5<br />
d) 5x 3 + 4x<br />
26. a) 11x – 4<br />
b) –x 2 – 5x<br />
c) 2x 2 – 4x + 1<br />
27. a) x + 3<br />
b) x 2 – 5<br />
c) 7x 2 – 2x + 1<br />
28. a) 30 + 12x<br />
b) 2x 3 – 6x 2 + 6<br />
c) –9x – 3<br />
d) –8x 3 + 20x 2<br />
e) 2x 2 + 7x<br />
f) 21x – 9x 2<br />
g) –4x 3 + 6x<br />
h) 6x 3 – 8x 2 + 10x<br />
29. a) x = 1<br />
b) x = –3<br />
c) x = –3<br />
d) x = 2<br />
ANSWERS 351