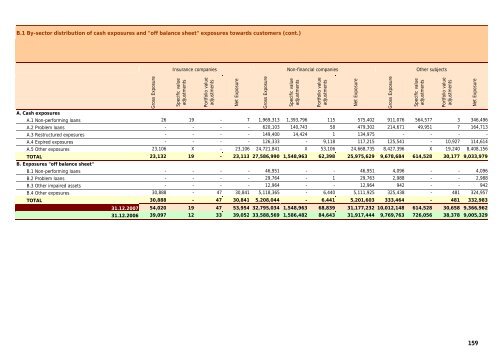
B.1 By-sector distribution of cash exposures and "off balance sheet" exposures towards customers (cont.)Insurance companies Non-financial companies Other subjectsA. Cash exposuresGross ExposureSpecific valueadjustmentsPortfolio valueadjustmentsNet ExposureA.1 Non-performing loans 26 19 - 7 1,969,313 1,393,796 115 575,402 911,076 564,577 3 346,496A.2 Problem loans - - - - 620,103 140,743 58 479,302 214,671 49,951 7 164,713A.3 Restructured exposures - - - - 149,400 14,424 1 134,975 - - - -A.4 Expired exposures - - - - 126,333 - 9,118 117,215 125,541 - 10,927 114,614A.5 Other exposures 23,106 X - 23,106 24,721,841 X 53,106 24,668,735 8,427,396 X 19,240 8,408,156TOTAL 23,132 19 - 23,113 27,586,990 1,548,963 62,398 25,975,629 9,678,684 614,528 30,177 9,033,979B. Exposures "off balance sheet"B.1 Non-performing loans - - - - 46,951 - - 46,951 4,096 - - 4,096B.2 Problem loans - - - - 29,764 - 1 29,763 2,988 - - 2,988B.3 Other impaired assets - - - - 12,964 - - 12,964 942 - - 942B.4 Other exposures 30,888 - 47 30,841 5,118,365 - 6,440 5,111,925 325,438 - 481 324,957TOTAL 30,888 - 47 30,841 5,208,044 - 6,441 5,201,603 333,464 - 481 332,983Gross ExposureSpecific valueadjustments31.12.2007 54,020 19 47 53,954 32,795,034 1,548,963 68,839 31,177,232 10,012,148 614,528 30,658 9,366,96231.12.2006 39,097 12 33 39,052 33,588,569 1,586,482 84,643 31,917,444 9,769,763 726,056 38,378 9,005,329Portfolio valueadjustmentsNet ExposureGross ExposureSpecific valueadjustmentsPortfolio valueadjustmentsNet Exposure159
B.2 Breakdown of Loans to Non-Financial Resident EnterprisesBreakdown by branch of economic activity 31.12.2007Other services for sale 6,926,426Sales, recovery and repairs 4,188,973Construction and public works 2,894,681Agricultural and industrial machines 1,020,044Electric material and equipment 768,763Other branches of activity 9,386,264TOTAL 25,185,151B.3 National distribution of cash exposures and "off balance sheet" exposures towards customersITALYOTHER EUROPEANCOUNTRIESAMERICA ASIA REST OF WORLDExposures/Geographical areasGrossNet Gross Net Gross Net Gross Net Gross NetExposure Exposure Exposure Exposure Exposure Exposure Exposure Exposure Exposure ExposureA. Cash exposuresA.1 Non-performing loans 2,897,709 934,334 6,382 3,092 47 12 3,117 87 957 132A.2 Problem loans 833,392 640,317 146,826 79,133 406 86 - - - -A.3 Restructured exposures 149,400 134,975 - - - - - - - -A.4 Expired exposures 251,922 231,870 899 795 3 2 2 2 1 1A.5 Other exposures 34,584,592 34,504,061 590,488 583,398 338,912 338,162 14,115 14,082 4,338 4,140TOTAL 38,717,015 36,445,557 744,595 666,418 339,368 338,262 17,234 14,171 5,296 4,273B. Exposures "off balance sheet"B.1 Non-performing loans 51,047 51,047 - - - - - - - -B.2 Problem loans 32,578 32,577 200 200 - - - - - -B.3 Other impaired assets 14,037 14,037 - - - - - - - -B.4 Other exposures 5,840,076 5,828,292 92,127 92,076 45,017 45,014 3,420 3,415 - -TOTAL 5,937,738 5,925,953 92,327 92,276 45,017 45,014 3,420 3,415 - -31.12.2007 44,654,753 42,371,510 836,922 758,694 384,385 383,276 20,654 17,586 5,296 4,27331.12.2006 45,043,803 42,601,172 896,878 883,940 356,751 355,393 11,265 10,830 2,833 2,421B.4 Geographical distribution of cash exposures and "off balance sheet" exposures towards banksExposures/Geographical areasA. Cash exposuresGrossExposureITALYNetExposureOTHER EUROPEANCOUNTRIESGrossExposureNetExposureGrossExposureAMERICA ASIA REST OF WORLDNetExposureGrossExposureNetExposureGrossExposureNetExposureA.1 Non-performing loans - - 19,465 7,457 20,383 273 - - - -A.2 Problem loans - - - - - - - - - -A.3 Restructured exposures - - - - - - - - - -A.4 Expired exposures - - - - - - - - - -A.5 Other exposures 6,181,515 6,181,515 2,181,056 2,180,533 9,923 9,923 1,951 1,951 516,784 516,777TOTAL 6,181,515 6,181,515 2,200,521 2,187,990 30,306 10,196 1,951 1,951 516,784 516,777B. Exposures "off balance sheet"B.1 Non-performing loans - - - - - - - - - -B.2 Problem loans - - - - - - - - - -B.3 Other impaired assets - - - - - - - - - -B.4 Other exposures 423,890 422,838 317,851 317,808 18,000 17,998 7,918 7,917 1,929 1,929TOTAL 423,890 422,838 317,851 317,808 18,000 17,998 7,918 7,917 1,929 1,92931.12.2007 6,605,405 6,604,353 2,518,372 2,505,798 48,306 28,194 9,869 9,868 518,713 518,70631.12.2006 4,639,772 4,639,490 1,388,701 1,375,027 48,469 28,125 25,742 16,310 10,154 10, 144160
- Page 1:
\\ItAntonvenetaAnnualReport2007XII
- Page 6:
Board of DirectorsChairman * France
- Page 12:
GROUPSTRUCTUREANTONVENETAANTONVENET
- Page 18 and 19:
The Macroeconomic ScenarioDear Shar
- Page 20 and 21:
• Santander: Business unit in Lat
- Page 22 and 23:
Performance in 2007Comparability wi
- Page 24 and 25:
As at 31 December 2007, loans to cu
- Page 26 and 27:
In detail, 19 new issues of unit-li
- Page 28 and 29:
The economic and financial performa
- Page 30 and 31:
Impaired and performingloansNET POS
- Page 32 and 33:
Income StatementThe 2007 income sta
- Page 34 and 35:
Performance of the main Antonveneta
- Page 36 and 37:
Antenore Finance Società dicartola
- Page 38:
Relevant events occurred after clos
- Page 51 and 52:
CONSOLIDATED FINANCIAL STATEMENTSCo
- Page 53 and 54:
Consolidated Income Statement€/th
- Page 55 and 56:
Statement of changes in consolidate
- Page 62 and 63:
A.1 - GENERAL PARTSection 1 - PREPA
- Page 64:
investments are originally recognis
- Page 67 and 68:
loans past due for over 180 days ac
- Page 69 and 70:
Valuation criteria and recognition
- Page 71 and 72:
Financial liabilities held for trad
- Page 73 and 74:
Prepaid tax assets and deferred tax
- Page 78 and 79:
ASSETSSection 1Cash and cash equiva
- Page 80 and 81:
2.2 Financial assets held for tradi
- Page 82 and 83:
Section 3Financial assets designate
- Page 84 and 85:
Section 4Financial assets available
- Page 86 and 87:
4.5.1 Financial assets available fo
- Page 88 and 89:
Section 7Loans to customers - Entry
- Page 90 and 91:
Section 8Hedging derivative contrac
- Page 92 and 93:
Section 12Tangible fixed assets - E
- Page 94 and 95:
12.3.3 Fixed assets for functional
- Page 96 and 97:
Section 14Tax assets and liabilitie
- Page 98 and 99:
14.5 Changes in prepaid taxes (offs
- Page 100 and 101:
Section 16Other assets - Entry 1601
- Page 102 and 103:
Section 2Due to customers - Entry 2
- Page 104 and 105:
3.3 Securities issued: securities u
- Page 106 and 107:
4.4.1 Trading financial liabilities
- Page 108 and 109:
Section 8Tax liabilities - Entry 80
- Page 110 and 111: The actuarial assumptions used in t
- Page 112 and 113: • discount rate. The financial ba
- Page 114 and 115: 12.3.2 Personnel pension fund (ex-B
- Page 116 and 117: 15.5 Income reserves: other informa
- Page 118 and 119: Section 16Minority interests - Entr
- Page 120 and 121: OTHER INFORMATION1. Guarantees and
- Page 122 and 123: 121
- Page 124 and 125: Section 1Interest - Entries 10 and
- Page 126 and 127: Section 2Commissions - Entries 40 a
- Page 128 and 129: Section 3Dividends and similar inco
- Page 130 and 131: Section 5Net profit on hedging - En
- Page 132 and 133: Section 7Net change in value of fin
- Page 134 and 135: Section 11Administrative expenses -
- Page 136 and 137: Section 12Net allowances for risks
- Page 138 and 139: Section 14Net value adjustments to
- Page 140 and 141: Section 16Profits (Losses) from inv
- Page 142 and 143: Section 20Taxes on income from cont
- Page 144 and 145: Section 22Third party profit (loss)
- Page 146 and 147: 145
- Page 148 and 149: A. PRIMARY REPORTINGA.1. Distributi
- Page 150 and 151: This section provides information w
- Page 152 and 153: Section 1CREDIT RISKQUANTITATIVE IN
- Page 154 and 155: A.1.5 Cash Exposures to Banks: Tren
- Page 156 and 157: A.3 DISTRIBUTION OF GUARANTEED EXPO
- Page 158 and 159: A.3.4 Impaired "off balance sheet"
- Page 162 and 163: C. SECURITISATIONS AND TRANSFER OF
- Page 164 and 165: THEANO FINANCE SPASUMMARY STATEMENT
- Page 166 and 167: GIOTTO FINANCE 2 SPASUMMARY STATEME
- Page 168 and 169: 2.3 PRICE RISKREGULATORY TRADING PO
- Page 170 and 171: 2.5 EXCHANGE RATE RISKQUANTITATIVE
- Page 172 and 173: 2.6 DERIVATIVE FINANCIAL INSTRUMENT
- Page 174 and 175: A.2 Bank Portfolio: notional values
- Page 176 and 177: A.4 "Over the counter" financial de
- Page 178 and 179: A.6 Residual duration of "over the
- Page 180 and 181: Currency: STERLINGEntry/Time bandOn
- Page 182 and 183: 2. Distribution of financial liabil
- Page 184 and 185: 183
- Page 186 and 187: Section 1Shareholders' equityA. QUA
- Page 188 and 189: B. QUANTITATIVE INFORMATIONExposure
- Page 190 and 191: 189
- Page 192 and 193: 1 - Information on directors' and e
- Page 194 and 195: 193
- Page 196 and 197: INDIVIDUAL FINANCIAL STATEMENTS DAT
- Page 198 and 199: 197
- Page 200 and 201: Dear Shareholders,In addition to il
- Page 202 and 203: Banca Antonveneta in 2007, a new se
- Page 204 and 205: Distribution ChannelsDuring 2007, B
- Page 206 and 207: The Economic and Financial TrendsDe
- Page 208 and 209: INDIRECT DEPOSITS(in millions of Eu
- Page 210 and 211:
Financial Assets(€/thousand)31.12
- Page 212 and 213:
Income StatementThe Income Statemen
- Page 214 and 215:
Relevant events occurred after the
- Page 216 and 217:
215
- Page 218 and 219:
217
- Page 220 and 221:
219
- Page 222 and 223:
4. During the fiscal year 2007, the
- Page 224 and 225:
223
- Page 226 and 227:
225
- Page 228 and 229:
Balance Sheet - Liabilities and sha
- Page 230 and 231:
Statement of changes in consolidate
- Page 232 and 233:
CASH FLOW STATEMENT (Direct method)
- Page 234 and 235:
233
- Page 236 and 237:
235
- Page 238 and 239:
A.1 - GENERALSection 1 - Statement
- Page 240 and 241:
the accumulated profit or loss are
- Page 242 and 243:
Recognition and derecognition crite
- Page 244 and 245:
Intangible fixed assets include goo
- Page 246 and 247:
Valuation criteria and recognition
- Page 248 and 249:
247
- Page 250 and 251:
ASSETSSection 1Cash and cash equiva
- Page 252 and 253:
2.2 Financial assets held for tradi
- Page 254 and 255:
Section 3Financial assets designate
- Page 256 and 257:
Section 4Financial assets available
- Page 258 and 259:
4.5 Financial assets available for
- Page 260 and 261:
Section 7Loans to customers - Entry
- Page 262 and 263:
Section 8Hedging derivative contrac
- Page 264 and 265:
10.3 Investments: annual changes31.
- Page 266 and 267:
11.3 Fixed assets for functional us
- Page 268 and 269:
Section 12Intangible fixed assets -
- Page 270 and 271:
13.2 Deferred tax liabilities: brea
- Page 272 and 273:
13.5 Changes in prepaid taxes (offs
- Page 274 and 275:
Section 15Other assets - Entry 1501
- Page 276 and 277:
Section 2Due to customers - Entry 2
- Page 278 and 279:
3.3 Securities issued: securities u
- Page 280 and 281:
4.4 Trading financial liabilities:
- Page 282 and 283:
Section 8Tax liabilities - Entry 80
- Page 284 and 285:
The actuarial assumptions used in t
- Page 286 and 287:
• discount rate. The financial ba
- Page 288 and 289:
12.3.2 Personnel pension fund (ex-B
- Page 290 and 291:
14.5 Income reserves: other informa
- Page 292 and 293:
Other information1. Guarantees and
- Page 294 and 295:
293
- Page 296 and 297:
Section 1Interest - Entries 10 and
- Page 298 and 299:
Section 2Commissions - Entries 40 a
- Page 300 and 301:
Section 3Dividends and similar inco
- Page 302 and 303:
Section 5Net profit on hedging - En
- Page 304 and 305:
Section 7Net profit/(loss) from fin
- Page 306 and 307:
Section 9Administrative expenses -
- Page 308 and 309:
Section 10Net allowances for risks
- Page 310 and 311:
Section 14Profits (Losses) from inv
- Page 312 and 313:
Section 19Income (loss) after tax f
- Page 314 and 315:
313
- Page 316 and 317:
Section 1CREDIT RISKQUALITATIVE INF
- Page 318 and 319:
As a final measure, specific regula
- Page 320 and 321:
In this type of control, typical cr
- Page 322 and 323:
A.1.3 Exposure to Cash and Off-Bala
- Page 324 and 325:
A.2 CLASSIFICATION OF EXPOSURES BY
- Page 326 and 327:
A.3.3 Impaired cash exposures towar
- Page 328 and 329:
B. DISTRIBUTION AND CONCENTRATION O
- Page 330 and 331:
C. SECURITISATIONS AND TRANSFER OF
- Page 332 and 333:
C.1.2 Exposures deriving from princ
- Page 334 and 335:
C.1.7 Service activities - revenue
- Page 336 and 337:
Section 2MARKET RISK2.1 INTEREST RA
- Page 338 and 339:
Risk controlRisk control is carried
- Page 340 and 341:
2.2 INTEREST RATE RISKBANK PORTFOLI
- Page 342 and 343:
QUANTITATIVE INFORMATIONSensitivity
- Page 344 and 345:
2. Regulatory trading portfolio: di
- Page 346 and 347:
transactions, (iii) comparable tran
- Page 348 and 349:
2.5 EXCHANGE RATE RISKQUALITATIVE I
- Page 350 and 351:
2.6 DERIVATIVE FINANCIAL INSTRUMENT
- Page 352 and 353:
A.3 Derivatives: Purchase and Sale
- Page 354 and 355:
A.5 "Over the counter" financial de
- Page 356 and 357:
SECTION 3LIQUIDITY RISKQUALITATIVE
- Page 358 and 359:
Currency: SterlingEntry/Time bandOn
- Page 360 and 361:
2. Distribution of financial liabil
- Page 362 and 363:
• attributing the regular segment
- Page 364 and 365:
363
- Page 366 and 367:
Section 1Company assetsA. QUALITATI
- Page 368 and 369:
B. QUANTITATIVE INFORMATIONExposure
- Page 370 and 371:
Breakdown of net shareholders' equi
- Page 372 and 373:
371
- Page 374 and 375:
Fees to directors, board of auditor
- Page 376 and 377:
Information required by art. 2497 b
- Page 378 and 379:
377
- Page 380 and 381:
EQUITY INVESTMENTS Situation at 31
- Page 382 and 383:
INTERNATIONAL ACCOUNTING STANDARDS
- Page 384 and 385:
383
- Page 386 and 387:
385
- Page 388:
387