grant lake hydroelectric project detailed feasibility analysis
grant lake hydroelectric project detailed feasibility analysis
grant lake hydroelectric project detailed feasibility analysis

Create successful ePaper yourself
Turn your PDF publications into a flip-book with our unique Google optimized e-Paper software.
Alaska Power AuthorityLI BAARY COpyGRANT LAKEHYDROELECTRIC PROJECTDETAILED FEASIBILITY ANALYSISVOLUME 2ENVIRONMENTAL REPORTEBt6COEBASCO SERVICES INCORPORATEDJanuary 1984~_ ALASKA POWER AUTHORITY_---'
..LIST OF TABLES..No. T1t1e Page..2-1 ANALYTICAL METHODS USED IN WATER QUALITYMONITORING PROGRAM 2-6..III2-2 WATER QUALITY CRITERIA AND APPLICABLESTANDARDS 2-9 2-3 TRACE METALS: MONITORING PROGRAM RESULTSAND APPLICABLE STANDARDS 2-11•2-4 MONITORING PROGRAM RESULTS 2-12-•2-5 GRANT LAKE WATER CLARITY 2-13 ..2-6 GRANT LAKE TEMPERATURES (OC) COLLECTED DURINGTHE 1981-82 MONITORING PROGRAM 2-24-2-1 GRANT LAKE TEMPERATURES (OC) COLLECTED DURING IIITHE 1982 SUPPLEMENTAL DATA COLLECTION PROGRAM 2-25..2-8 TEMPERATURE COMPARISONS FOR PROJECT WATER-BODIES 2-262-9 DISSOLVED OXYGEN MEASUREMENTS FOR GRANT LAKE 2-28..2-10 LAKE AND STREAM CHARACTERISTICS FOR PRE- filiiAND POST-PROJECT CONDITIONS 2-293-1 COMPOSITION AND DENSITY OF PHYTOPLANKTON ..FROM GRANT LAKE 1982 3-4 II3-2 COMPOSITION AND RELATIVE ABUNDANCE OFPERIPHYTON FROM GRANT CREEK 1982 3-63-3 COMPOSITION AND DENSITY OF ZOOPLANKTON..".FROM GRANT LAKE 1981-1982 3-93-4 COMPOSITION AND DENSITY OF BENTHOS FROMGRANT LAKE 1981-1982 3-12III3-5 COMPOSITION AND DENSITY OF BENTHOS FROMGRANT CREEK 1981-1982 3-14..•3-6 FISH SPECIES REPORTED TO OCCUR IN THE KENAIRIVER SYSTEM 3-16-III3-1 LIFE HISTORIES OF PACIFIC SALMON KNOWN ORSUSPECTED TO SPAWN IN GRANT CREEK 3-19vii•.-I.--!II!II-!II•
-..LIST OF TABLES- •No. Title Page- 3-8 REGRESSION EQUATION TO ESTIMATE FISH YIELDFROM GRANT LAKE 3-233-9 PEAK SALMON SPAWNING GROUND COUNTS FOR GRANT-CREEK 1952-1982 3-25•-3-10 JUVENILE FISH COLLECTED BY MINNOWTRAP IN GRANT CREEK JULY 1959 THROUGHJANUARY 1961 3-29•-3-11 SPORT FISH CATCH FOR GRANT CREEK ASREVEALED BY CREEL CENSUS AT THE MOUTH 1964 3-29•3-12 RESULTS OF MINNOW TRAPPING AND ELECTROSHOCKING... EFFORTS IN GRANT CREEK OCTOBER 1981 AND MARCH,., JUNE, AND AUGUST 1982 3-30-.. 3-13 ESTIMATES OF TROUT PRODUCTION FROM SOMENORTHWEST STREAMS 3-353-14 PLANT SPECIES IDENTIFIED FROM THE GRANT LAKE-STUDY AREA 3-52•3-15 AMOUNT AND PERCENTAGE OF MAPPING UNIT THAT-WOULD BE AFFECTED BY THE PROJECT 3-61• 3-16 AVIFAUNA WHICH PROBABLY INHABIT OR MIGRATETHROUGH THE STUDY AREA 3-66-- --3-173-18COMPARISON OF AVIFAUNA HABITAT TYPES TOVEGETATION MAPPING UNITS 3-69MAMMALS OF THE STUDY AREA 3-74- 4-1 CULTURAL RESOURCES IDENTIFIED THROUGH THELITERATURE SEARCH 4-35-1 HISTORICAL POPULATION - KENAI PENINSULA- BOROUGH, CENSUS SUBAREAS, AND CENSUS•DESIGNATED PLACES WITHIN THE SOCIOECONOMICIMPACT AREA 5-4- 5-2 NON-AGRICULTURAL EMPLOYMENT BY QUARTER -SEWARDDIVISION 1979-1980 5-7- •- •vi i i...- -
•No.TitleLIST OF TABLES5-3 MONTHLY CIVILIAN LABOR FORCE ANDEMPLOYMENT - SEWARD DIVISION5-4 AVERAGE MONTHLY WAGES BY QUARTER -SEWARD DIVISION 1979-19805-5 POPULATION PROJECTIONS - SOCIOECONOMICIMPACT AREA 1980-19955 -f> EMPLOYMENT PROJECTIONS - SOCIOECONOMICIMPACT AREA 1980-19956-1 CHARACTERISTICS OF SEISMIC SOURCES7-1 RECREATION USE FOR SELECTED SITES, SEWARDRANGER DISTRICT, FISCAL YEAR 19817-2 GRANT LAKE HYDROELECTRIC PROJECT RECREATIONPLAN - CONCEPTUAL COST ESTIMATE9-1 STUDY AREA BY DRAINAGE9-2 AREAS REQUIRED FOR PROJECT FACILITIESPage5-95-115-135-146-117-57-199-19-8•- ..---..- •-•- ..- ..- •.. ..,• .."IIIIIIII;x•..-..- ..
....- •..1-1•1-21-3-•LIST OF FIGURESPROJECT LOCATION MAP1-2PROJECT SITE AND VICINITY1-3SELECTED PROJECT ARRANGEMENT SITE PLAN1-4.. 2-1WATER QUALITY SAMPLING LOCATIONS2-4•..2-2 TURBIDITY AND SUSPENDED SOLIDS2-142-3 MAJOR ION CONCENTRATIONS2-15•..2-4 NITRATE LEVELS2-162-5 CONDUCTIVITY AND TOTAL DISSOLVED SOLIDS2-17..•2-6 TEMPERATURE PROFILES, GRANT LAKE LOWERBASIN2-22•2-7 TEMPERATURE PROFILES, GRANT LAKE UPPER...BASIN2-23..• 2-8 GRANT CREEK AND PROJECTED PROJECT DISCHARGETEMPERATURES2-36• 2-9 GRANT LAKE UPPER BASIN TURBIDITY VS DEPTH 2-38....3-1 TOTAL SPORT AND COMMERCIAL HARVEST OF CHINOOKSALMON BOUND FOR THE KENAI RIVER 1974-813-17.. 3-2 SPORT HARVEST OF ALL SALMONIDS FROM THE KENAIRIVER BY SPECIES 1976-813-18•..3-3 LOCATIONS OF SPAWNING GRAVELS AND OBSERVED-..ADULT SOCKEYE AND CHINOOK SALMON IN GRANT CREEK1981-82 3-273-4 MAJOR BROWN BEAR FORAGE RESOURCES ANDDENNING HABITAT IN THE STUDY AREA 1982 3-84•-3-5 MOOSE RANGES IN THE STUDY AREA 1982 3-89MOUNTAIN GOAT OBSERVATIONS IN THE STUDY AREA1982 3-92DALL'S SHEEP OBSERVATIONS IN THESTUDY AREA 19823-94-x..• 3-6..•3-7-•
•- -•LIST OF FIGURES (Continued) No. Title Page-4-1 AREAS COVERED IN ARCHAEOLOGICAL FIELD SURVEY 4-55-1 SOCIOECONOMIC IMPACT AREA 5-2 -6-1 REGIONAL GEOLOGIC MAP OF STUDY AREA•6-26-2 GEOLOGIC FEATURES OF STUDY AREA 6-5-6-3 DEPTH TO BEDROCK POWERHOUSE COVE 6-7•7-1 RECREATION RESOURCES 7-2 ..7-2 RECREATION DEVELOPMENT 7 -15 •-8-1 POWERHOUSE COVE 8-4•8-2 LOWER TRAIL LAKE 8-5-8-3 VISUAL QUALITY MANAGEMENT OBJECTIVES 8-8•9-1 LAND USE 9-2- •..sJIlllit..III'•-..xi- •---•..••
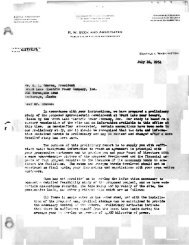
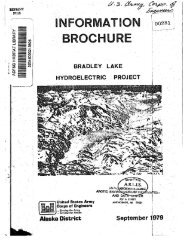
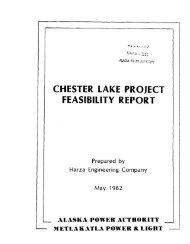
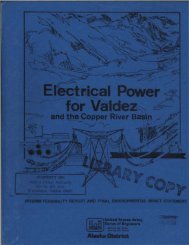
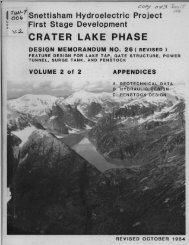
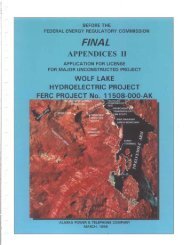
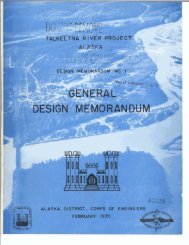
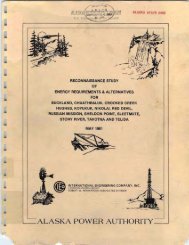
- •- •-..1.0 GENERAL DESCRIPTION OF THE LOCALE...-- ..-- -----..-•- •..•- •--•The site of the proposed Grant Lake Hydroelectric Project is situatedin a relatively undeveloped part of the Kenai Peninsula in southcentra1Alaska. Figure 1-1 shows the regional location of the Project, amountainous and largely forested area between Anchorage and Sewarddrained by the Kenai River. A vicinity map of the Project showing theProject site is presented in Figure 1-2. The Project site and vicinityis an area of moderate precipitation, varied flora and fauna, generallyshallow and stable soils, relatively sparse population, rich history,and mostly pristine landscapes. The area immediately surrounding theProject site offers limited recreational opportunities due to lack ofaccess routes and developed facilities, although the surrounding regionreceives considerable recreational use .The proposed Project will require construction of no new impoundment.Water will be taken from the existing Grant Lake through an underwaterintake and will then flow through a power tunnel to a powerhouselocated near the eastern shore of Upper Trail Lake. These features areshown on Figure 1-3.1.1 LOCATIONThe Project site lies near the community of Moose Pass, approximately25 miles north of Seward just east of the Anchorage-Seward Highway,State Highway 9. Anchorage, A1aska ' s largest city, is approximately102 miles north along the Anchorage-Seward Highway, which becomes StateHighway 1 about 10 miles northwest of Moose Pass. Paralleling thehighway is the Alaska Railroad, which connects Seward with Anchorageand central and northcentral Alaska. From outside southcentra1 Alaskathe Project site is reached by air or water to Anchorage or by water toSeward, then by highway or rail.1-1
- ----•ANCHORAGE....- •..- --- • ....IIIII•..•,.••..ALASKA POWER AUTHORITYPROJECT LOCATION MAP•- •- ..•
. ,DATUM-MSLo" .. ... ,3000' .NOTETOPOGRAPHIC DATA FROM US.G.S. MAPS,SEWARD ~ 6- 87IALASKA POWER AUTHORITYGRANT LAKE HYDROELECTRICPROJECT'" " //.PROJECT SITEAND VICINITYJ.. /1-31-2EBASCO SERVICES INCORPORATED
N ....LEGEND:- - - - PIPELINE AND TUNNEL===== ACCESS ROAD• • NEW liS ltV TRANSMISSION LINE.. -----.. EXISTING 24.9iV TRANSMISSIONLINENOTES:I. TOPOGRAPHY IS BASED ON MAPPING PREPAREDBY NORTH PACIFIC AERIAL SURVEYSI.INC.,AND SURVEYS CONDUCTED BY R a~CONSULTANTS, INC., IN 1981 AND 1982.2. VERTICAL CONTROL IS BASED ON US.a.8.DATUM 'MEAN SEA LEVEL). HORIZONTALCONTROL IS BASED ON THE ALASKA STATEPLANE GRID SYSTEM, ZONE 4.3. ALL ROADS ARE CLASS B EXCEPT THEPRIMAY ACCESS ROAD FROM THE SEWARDANCHORAGE HIGHWAY TO THE POWERHOUSE, WHICH IS CLASS A.400'I •0'I400' 1200'SCALEALASKA POWER AUTHORITYGRANT LAKE HYDROELECTRIC PRO-ECT-- ----------Oi , __ --------~,--------------------1r",..------ ------.----- ----GRANT LAKE 7 ------___ _SWITCHING STATION\.. EXISTING CEA 2 .... 9 KV~ TRANSMISSION LINESELECTEDPROJECT ARRANGEMENTSITE PLANFIGURE 1- '3EBASCO SERVICES INCORPORATED
-•- •------..Grant Lake lies approximately one and one-half miles south and east ofMoose Pass at an elevation of about 696 ft above mean sea level (MSL).f400se Pass lies slightly above elevation 500 ft. The <strong>lake</strong> is fed byInlet Creek at its headwaters and several other glacial-fed,intermittent streams flowing mainly from the east. Grant Lake isdrained at its south end by Grant Creek, which flows west about onemi 1 e and empti es into the narrows between Upper a nd Lower Trai 1 Lakes.Falls Creek, located about two miles south of the south end of GrantLake, flows into the Trail River a short distance below Lower TrailLake. The Trai 1 River then enters Kenai Lake, which empties into theKenai River.and the premier sport and subsistence fishing river in southcentralAlaska, flows into Cook Inlet near the City of Kenai.1.2 PHYSICAL FEATURESGrant Lake, with a surface area of approximately 2.6 square miles,reaches depths of nearly 300 ft. During periods of heavy runoff,primarily the summer months, the <strong>lake</strong>'s waters are quite opaque duelargely to glacial flour received from glaciers that cap the ring ofmountains comprising its watershed. Because the <strong>lake</strong> is partiallydivided into two basins by a narrow and relatively shallow channellocated near the <strong>lake</strong>'s mid-point, the upper bas'in is slightly moreturbid than the lower basin. The mountains bordering the <strong>lake</strong> on theto 5,500 ft. They are part of the Kenai Mountain Range. The totaldrainage area of Grant Lake is approximately 44 square miles.cubic ft per second (cfs). Water quality is satisfactory for bothaquatic life and human usage. Stream waters are soft, neutral in pH,highly oxygenated, nutrient poor, and quite cold with temperaturesra rely above 55 degrees F.-1-5••-•- -•- -..-----..•-•-..-..The Kenai River, the largest river on the Kenai Peninsulanorth, east, and south are steep and tall, reaching elevations of 4,500The average flow of Grant Creek, Grant Lake's only outlet, is about 200
- --..The geology of the Project site and vicinity is associated with theupper cretaceolls age of the mesozoic era and is 64 to 100 million years01 d. Most of Grant Lake and other Project waters are underl ai n bylow-grade metamorphozed sedimentary rock, predominantly graywacke andslate. The area is within the general band of earthquake activitycalled the Pacific Earthquake Zone that extends well into the AleutianIsland range (Hartman and Johnson 1978).- - - ----- --•1.3 ECOLOGICAL SETTINGThe ecological setting of the Project site and vicinity reflects thearea's low average temperatures, prolonged freezing in the winter, andthe relative geographic isolation of the Kenai Peninsula from theprincipal land mass of Alaska. Low overall temperatures limitbiological productivity of both plant and animal connunities, while thecold and lengthy winters significantly constrain carrying capacity forresident species. The area's geographic isolation has limited thediversity of plant and animal species.Grant Creek, a tributary of Trail River, and the sole outlet stream ofGrant Lake possesses a mixture of resident and anadromous salmonids,including salmon, trout, and char, as well as other fish species. Mostfish populations are relatively small. Grant Lake, though lackingsalmonids because of an impassable falls at its outlet, possesses anapparently robust population of threespine stickleback and sculpi n.The lower reaches of Grant Creek possess small runs of sockeye salmon,chinook salmon, coho salmon, and populations of Dolly Varden char andresident rainbow trout.The Project lies within a vegetational transition zone between borealand coastal coniferous forests dominated by Sitka spruce and hemlock asclimax species. These and most other plant species occur at relativelylow elevations. Timberline lies between 1,000 and 1,500 ft elevation.•.. ".. "•..•- •- •..•..-..---..1-6
- -,.-................- ....Floral species possessing special adaptation to snow avalanches,dessication, and freezing occur at higher elevations. Willow and alderoften occupy intervening areas between forest and alpine species.The dominant herbivores of the Project site and vicinity are moose andmountain goat. Major carnivores are brown and black bear and wolf. Noendangered or threatened species are known to occur •1.4 HUMAN RESOURCESThe Project site and vicinity has been heavily influenced by thehistoric development of the Alaska Railroad and gold mining activities,both dating from near the beginning of the twentieth century. Near theProject site the Alaska Railroad follows the path of the historicIditerod Trail, the first overland transportation route fromsouthcentral Alaska to Nome and interior Alaska. Numerous remains ofgold mining operations, and some more recent claims, can be found inthe Project vici nity •Seward, a town of approximately 2,000 people, is the nearestincorporated city to the Project. The only other communities in theProject vicn1ty with significant populations are Moose Pass, less thantwo miles distant from the Project, and Cooper Landing, locatedapproximately 24 miles northwest of the Project.- - ---..........- ..-The principal outdoor recreational pursuits in the Project vicinity arefishing, hunting, camping, and hiking. While the Kenai Riverdownstream of Kenai Lake is the dominant sport fishing river insouthcentra1 Alaska, the Project vicinity does support limited sportfi shi ng nea r the mouth of Grant Creek and some hunti ng, campi ng, andhiking activity near Grant Lake •The Project site is characteristic of most undeveloped lands along thehighway between Anchorage and Seward and offers a relatively pristineand unspoiled landscape to travellers along the highway and1-7
ecreationists using the area. There are few roads of any lengthleading from the highway, and little major development away fromthe highway and the railroad.At the present time the Project site lies within the Chugach NationalForest. However, in the near future, much of the western portion ofthe Project site will be deeded to the state and, subsequent to thataction, conveyed to the Kenai Peninsula Borough. While land uses inthe conveyed lands may be altered from their present forest andmultiple use functions, necessary Project easements will be retained bythe United States Government for the operation of Forest Servicefacilities and by the State of Alaska for the operation and maintenanceof the Grant Lake Hydroelectric Project.1.5 PROPOSED PROJECT DEVELOPMENTThe proposed Grant Lake Hydroelectric Project, depicted in Figure 1-3,is composed of the following principal facilities:0 Grant Lake intake0 Power tunnel and penstock0 Gate shaft0 Powerhouse0 Tailrace0 Transmission line0 Recreation area0 Access roads to powerhouse, gate shaft-intake area, andrecreation area0 Fisheries facilities........................ ....The earliest Project construction could begin is the spring of 1985,with completion in the spring of 1981. The Project will generate anaverage of approximately 25,400,000 kilowatt-hours of electric powerannually, possessing a peaking capacity of approximately 1 megawatts.1B3881-8B/20/85..•....
--- ..----- ----- ..•- •- -This section summarizes the available information on water use andwater quality in the Project vicinity, the expected impacts of theProject on water use and water quality, and mitigating measures tominimize these impacts. For purposes of discussion, the water qualitystudy area is defined as waters of Grant Creek, Grant Lake and FallsCreek.2.1 EXISTING AND PROPOSED WATER USEStreamflow data for Grant Creek are based on an 1l.5-year record ofU.S. Geological Survey (USGS) gage 15246000. Streamflow data for FallsCreek are based on a 0.5-year record of a gage near the mouth of thecreek, and on statistical relationships between the Grant and Fallscreek watersheds. Information on water use was obtained from review ofwater rights and mining permits, field reconnaissance, aerialphotographs, and published maps.2.1.1 Existing Water Use2.1. 1.1 Grant LakeA seasonal mlnlng operation located on the north shore of Grant Lake'slower basin (see land-use map, Figure 9-1) uses <strong>lake</strong> water from Maythrough November. Most of the water; s used for placer mining,although presumably a small amount is used for domestic purposes.Limited use of Grant Lake water ;s also made by hunting parties thatoccasionally occupy the cabin at the eastern end of the upper basin2.0 REPORT ON WATER USE AND QUALITY•--- •---•-•(Figure 9-1).Chapter 7.2.1.1.2 Grant CreekRecreational uses of Grant Lake are discussed inRecreational use of Grant Creek consists primarily of fishing along thelower one-half mile. No domestic use is made of Grant Creek water.194282-1
2.1.1.3 Falls CreekFalls Creek is used extensively for placer mining during the summermonths. Land adjacent to Falls Creek is almost continuously claimedfor placer mining from elevation 1300 ft to the mouth of the creek, asshown in Figure 9-1. Several cabins located within two miles of thecreek confluence with Trail River operate under Forest Service specialuse permits that identify no domestic water use. Because most of thesecabins are used only on weekends or for vacations, it is likely thatmost of the water used is carried in from outside the Project vicinity(Qui1liam 1982)...- -..- ..- --..2.1.2 Water RightsUnder Alaska state law, water rights can be obtained only by applyingto the Alaska Department of Natural Resources, and receiving either aPermit to Appropriate Water or a Certificate of Appropriation. liTheuse of water without a permit or certificate does not give the userdefensible legal rights to the water, no matter how long the water hasbeen in use or conti nues to be in use ll (A1 aska Depa rtment of NaturalResources 1981). Two Permits to Appropriate Water have been issued forthe Project vicinity. The first is for a placer mining operation onFalls Creek at approximately elevation 1200 ft. The appropriatedamount is one cubic foot per second (cfs). The second appropriation isfor the mining operation located on the north shore of Grant Lake'slower basin and consists of 160 gallons per minute (0.36 cfs) to betaken from Grant Lake and an unnamed stream flowing into Grant Lake.The appropriation does not specify how the water right is dividedbetween the stream and the <strong>lake</strong>.2.1.3 Proposed Uses of Project WatersThe Alaska Department of Fish and Game (ADF&G) has constructed a salmonhatchery on Upper Trail Lake, well outside the Project vicinity. The2-2- -..- •IIIJ...•....- ..- .. ....-............
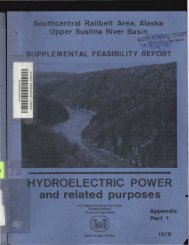
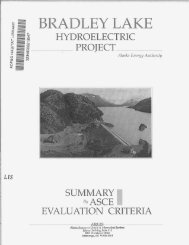
--•,.hatchery uses groundwater as its water supply. ADF&G is planning to---use Grant Lake as rearing habitat for salmon originating from thehatcher-v, as discussed in Chapter 3.2.2 EXISTING WATER QUALITY2.2.1 Water Quality Data Sources...2.2.1.1 Hi storical Data•between 1959 and 1981. A limno1ogical survey by the U.S. Fish andincluding pH, nutrients, dissolved solids, and temperature. Theresults of these studies are discussed in Section 2.3.2.2.1.2 Monitoring Program- duri ng August 25-29, 1982. Samples were collected from Grant Lake,Grant Creek, and Falls Creek at the locations shown in Figure 2-1.Grant and Falls creeks samples were obtained from near the streamsurface, approximately one to two ft from shore.---...---•- - - - --•----A limited amount of water quality data was collected in the study areaWildlife Service (USFWS) in 1961 obtained temperature and dissolvedoxygen data at Grant Lake, Grant Creek, and Falls Creek. ADF&G (1981)and the Forest Service (Qu i 11 i am 1982) conducted a 1 imno10gica1 surveyof Grant Lake in 1981, and also collected data on dissolved oxygen andtemperature. The U.S. Geological Survey (USGS 1981) has collected alimited amount of water quality data on the Project waters since 1950,To establish baseline water quality conditions in the study area, ayear-long water quality monitoring program was conducted at Grant Lakeand Grant and Falls creeks (AEIDC 1982). Sampling dates were October12-15, 1981 and March 1-3, June 8-10, and August 2-4, 1982.Supplemental temperature, turbidity, and sediment data were obtainedAdditional Grant Laketemperature profiles are planned to be collected during the winter of1982-83.In2-3
o ~NDATUM-MSLo 3000''rOO'.... / .c·~ .NOTETOPOGRAPHIC DATA FROM U.S.G.S. MAPS,SEWARD B 6- B7LEGENDALASKA POWER AUTHORITYGRANT LAKE HYDROELECTRICPROJECTo GRANT LAKE SAMPLING LOCATIONS , •.• cL-------.!..~~~ _______1COMPOSITE STREAM SAMPLINGWATER QUALITYLOCATIONSSAMPLING LOCATIONSFIGURE 2-1EBASeO SERVICES INCORPORATED2-4
,"••'.'.- - ---..-...- -...-- -----..Water qual; ty parameters measured and analytical techni ques used on thesamples are listed in Table 2-1. For Grant and Falls creeks one samplewas obtained from each stream reach shown in Figure 2-1 and compositedin the field so that one <strong>analysis</strong> was made for each parameter perstream. Grant Lake measurements of temperature and di sso 1 ved oxygenwere taken at 3.28 ft (1 m) intervals from the surface to 164 ft (50 m)in depth. All other parameters were measured at the surface of the twobasins. The upper and lower basin samples were composited for theOctober 1981 and March 1982 sampling dates, but were analyzedseparately for June and August 1982 for all parameters except tracemetals. In addition to surface samples, measurements of suspendedsolids and turbidity in the upper and lower basins of Grant Lake wereobtained at a 164 ft (50 m) depth during June and August 1982.In situ water quality measurements were obtained with a YSI Model 33salinity/conductivity/temperature meter, a pocket thermometer (_35° to50°C), a YSI Model 516 dissolved oxygen meter, a Horizon analog pHmeter, and a Secchi disc. A 1.2 liter Kemmerer sampling bottle wasused for collecting water samples. Composite samples were placed in apolyethylene carboy and one liter samples were drawn in polyethylenecontainers, stored in an ice cooler, and returned within 24 hours toAnchorage for <strong>analysis</strong>. Samples for trace metals were placed inmetal-free containers and fixed with nitric acid. All in situ data wascollected by Arctic Environmental Information and Data Center (AEIDC).Trace metals were analyzed by Am Test, Inc. of Seattle, Washington withthe exception of the October, 1981 samples, which were analyzed byChemical and Geological Laboratories of Alaska, Inc. of Anchorage,Alaska. All other parameters were analyzed by Chemical and GeologicalLaboratories of Alaska, Inc.2.2.2 Water Quality StandardsNone of the water bodies in the study area have been classified intowater use categories by the state. The Alaska water quality standards..2-5
2-6ParameterTABLE 2-1ANALYTICAL METHODS USED IN WATER QUALITY MONITORING PROGRAMMethodSheet 1 of 2Detecti onLimi t~/Ni tratePhosphate (ortho, as P)Alkalinity (as CaC0 3 )Hardness (as CaC0 3)Turbi di ty (NTU)Conducti vi typHDissolved oxygenTotal dissolved solidsSuspended solidsColiform bacteriaSilverAlumi numCalciumCadmiumChromiumCopperIronMercuryPotassi umMagnesiumSodiumLeadZi ncChlorideSulfateBruci neColorimetric, AscorbicAcid, Single reagentTi trati onCa 1 cul ati onNephelometerWheatstone BridgeElectrometricMembrane ElectrodeGravimetricGravimetricMembrane fi 1terICAP,.!?.! Graphite Furnace A/I£./ICAP, Flame AAICAP, Flame AAICAP, Graphite Furnace AAleAP, Graphite Furnace AAICAP, Graphite Furnace AAICAP, Graphite Furnace AAICAP, Cold Vapor TechniqueICAP, Flame AAICAP, Flame AAICAP, Flame AAICAP, Graphite Furnace AAICAP, Fl ame AAMercuric NitrateTurbidimetricO. 10.012.01.00.05 NTU1.0 mho/cm0.05 pH unitsO. 11.01.00/100 ml0.05, 0.00030.05, 0.10.05, 0.020.01, 0.00010.05, 0.00050.05, 0.0010.02, 0.050.05, 0.00020.05, 0.010.05, 0.010.05, 0.0020.05, 0.0010.05, 0.0050.21.0.,.."•..••• ...,.- •-•- •-a/ mg/l unless otherwise indicated.b/ ICAP - Inductivel,Y coupled Argon Plasma Scan. This method was usedwas used only for selected parameters in the October, 1981 samples.£/ AA - Atomic Absorption- -•- •
TABLE 2-1 (continued),..ParameterMethodDetect jonLimit!Sheet 2 of 2'* Arsenic leAP 0.05"' Gold leAP 0.05IIBoron leAP 0.05..Bari urn leAP 0.05'"Bismuth leAP 0.05Cobal t ICAP 0.05'.".,_,.~1anganese ICAP 0.05Molybdenum ICAP 0.05Nickel ICAP 0.05Phosphorous ICAP 0.05- Pl ati num ICAP 0.05Antimony ICAP 0.05-Selenium ICAP 0.05Silicon ICAP•1.0.. -Tin ICAP O. 1Strontium ICAP 0.02-Ti tanium leAP 0.05..Tungsten ICAP 1.0-Vanadium leAP 0.05Zi rconi um ICAP 0.05..-- --------• 2-7
(Tables 2-2 and 2-3) state that all unclassified fresh waters shallmeet the standards for: 1) Water Supply, including drinking water,2} Water Recreation, including swimming, and 3) Growth and Propagationof Fish, Shellfish, and other Aquatic Life, and Wildlife (18 AAC70.0S0). When the water quality standards vary for the threecategories, the most stringent applies (Hayden 1982). The U.S.Environmental Protection Agency (EPA) criteria for freshwater aquaticlife and the National Drinking Water Regulations are also presented inTables 2-2 and 2-3.2.2.3 Summary and Discussion of Study Area Water QualityExisting water quality data indicate that study area waters aregenerally of good quality and meet all applicable water qualitystandards. Certain trace metal concentrations, however, occasionallyexceeded the 24-hour average EPA criteri a for freshwater aquatic 1 Heas discussed below. Study area water characteristics are similar toother water bodies in the Kenai River Drainage. Grant Lake isoligotrophic (low in nutrients) as are most deep wilderness <strong>lake</strong>s ofsouthcentra1 Alaska. Study area waters are slightly acidic to neutralin pH, soft, and low in suspended and dissolved solids. A <strong>detailed</strong>discussion of the chemical, physical, and bacteriological datacollected to date is given below. Data collected during the monitoringprogram is presented in Tables 2-3, 2-4, and2-S, and also showngraphically in Figures 2-2 to 2-S. All values given for Grant Lakerepresent a composite sample of upper and lower basin surface water,unless otherwise noted.2.2.3.1 Water Clarity and Suspended SolidsSeveral small glaciers drain into Grant Lake resulting in blue-greencolored water typical of glacial drainages. Turbidity and suspendedsolids levels, however, have been consistently low throughout themonitoring period. Water clarity data (Secchi disc readings,turbidity, and suspended solids levels) are listed in Table 2-S forGrdnt Lake and shown graphically for Grant Lake, Grant Creek, and FallsCreek in Figure 2-2.-..• ...•••• ..•••-II•
TABLE 2-2WATER QUALITY CRITERIA AND APPLICABLE STANDARDSSheet I of 2ParameterAlaska Standar~EPA Crfteri aE!EPA DMnk! ng Water Regulations£!Hi trdte (mg/I)No standardNu recOflioondationLess than 10 mg/IPhosphate (Orthu 1No standardNo recommendatiunNu regul ati onTotdl Hardness (as CaC03in mg/11Nu standardNu recommendationHo regul ationAlkalinity (as C
ParaneterA laska Standard!!TABLE 2-2 (continued)WATER QUALITY CRITERIA AND APPLICABLE STANDARDSEPA Cn ten aP..!Sheet 2 of 2EPA Dri nkl ng Water Regulat! on~/Arsenic 440 mg/lV 440 mg/lGold No Standard!!.! No recommendationBoron No Standaro~.! No recommendationBarf un No Stand aro!!! No recommendationBl smuth No Standard~/ No recommendationCobalt No Standard~/ No recommendationManganese No Standard~/ No recommendationMo lybdenun No Stand aro!!l No recommendationNickel 643 mg/I!!1 643 mg/lPhosphorous No Stand aro!!/ No recommendationPI ati nun No Standard!!! No recoomendati onAntimol1Y No Standard!!.! No recommendationSe leni urn 260 mg/l!!1 260 mg!1Si licon No Standard!!/ No recommendationTin No Standard!!1 No recommendationStrontium No Standaro!!l No recommendationTi tani un No Standard:!1 No recommendationTung sten No Standard!!.! No recommendationVanadi urn No St and aro!!! No recommendationZi rconi urn No Stand aro!!! No recoomendationNo regu lati onNo regul atl onNo regulationNo regulati onNo regulati onNo regulation0.05 mg/lNo regulati onNo regulati onNo regulationNo regulati onNo regulati onNo regulationNo regulationNo regulati onNo regulationNo regulati onNo regulati onNo regulationNo regulation••.,••-•••..2-10111III•..•..•..•••..• ..
I I • I I •• I I I I I I I I I • I • I • I • I I j i •TABLE 2-3TRACE METALS: MO~ITORrNG PROGRAM RESULTS AND APPLICABLE STANDARDSAPPLICABLE STANDAR~ OR CRITERIA Ivg/l) DATA (vgl1l 198#/EPA On nki ng A laska Water Grant Lake Grant Creek Falls Creel
TABLE 2-4I~ONITO~IN(iPRUGRAN RESULTS(ira nt Lake - Su rf ace Wa terFa 11 s CreekParameterOc tober Ma rch1981 1982June 1982LOl'/er Upper8asin BasinAugust 1982LOller UpperBasi n Basi nOctober1981 1982~larchJune1982August1982October1981June1982August1982Ni tra te (1I1g/1)0.210.34v.31 0.38 0.11
GRANT LAKE WATER CLARITYPa rameter October 1981 March 1982 June 1982TABLE 2-5LowerLowerBasi nBasin..•..Secchi Oi sc (ft) 6.6NM~/---Turbidity (NTU)surface3.80.46--50-m depthNMNMSuspended Solids(mg/l).. -surface8.64.050-m depthNMNM-III a/ NM = Not measured- ----- --•LowerBasi n16.40.240.281.31.1UpperBasi n8.20.400.432.01.9August 1982Lower UpperBasi n Basin6.6 1.60.67 1.90.24 0.461.3 1.30.3 1.02-13
I'~----~~~~==~==------,888" 6ILoRIITU7853" 6ILoR" TU7I543,." 6ILoRIITU287852ItT 81ItT 8111M 82 .... 82 U82SNfI..III6 DATEFALLS CIIEEX11M 82 .... 82 U82SNfI..III6 DATESource: AEIDC 1982zItT 81 11M 82 .... 82 U82(I) NOT MEASURED(2) FALLS CREEK FROZEN MARCH 1982ALASKA POWER AUTHORITYGRANT LAKE HYDROELECTRIC PROJECTTURBIDITY AND SUSPENDED SOLIDSFIGURE 2-2EBASCO SERVICES INCORPORATE.D.'•.,-••...•••..•..••lit-....- •..2-14
IIIANJ LAKEItUI me aNINTRAlDIISIIIANJ am14smIlII 14SIIlBIIPOTASSIIII~POTASSIIIIIIMJ£S1.UIIIMJ£S1.UIC12 CALClIII0 SIlFATE 0 SIlFATENNC..CE 18E IINNT"TRRA 8 A I"TT41 I I0 0..fitG•~12 CALClIII CN• II•"4 " 6Il1/1 2 2...-1IR82SMflJHG-•fALLS•• •.DI82 AlG82 1IR82 .DI82 682DATE SNfI.lJI o.TEamIIAJII me aNINTRATIIIIS..14smIlIIPOTASSIIIIIIMJ£S1.UIC012.. -SIlFATE" CE-IIIITRA IT•-I0II e• ..II64IL (I) FALLS CREEK FROZEN MARCH 1982-2ALASKA POWER AUTHORITY~CALClIII• •-GRANT LAKE HYDROELECTRIC PROJECT1IR82 .DI82 682SNfI.lJI o.TE•- -Source:EBASCOAm Test, Inc.• 2-15IL4MAJOR ION CONCENTRATIONSFIGURE 2-3SERVICES INCORPORATED
GRANT LAKE PRO£:T : VATER 00AlIlY DATAI.S ...--____--=.::HAJOR=~ION~CONCENT=::.:..:.;RA=TI::;:ONS:..:;:.....________,coNCENTRATIoN" 6IL1.4 .1.3e.2 .e.1,,,,,•..•rt./ -..,..~''-'ttl. ..I. ",,Ii A GRANT LAKE8----EJ GRANT CREEK...---. FALLS CREEK' .."'"''''.... , , ,.. ,'\ , ," , ,.. , , , ,(NO DATA IN MA~~~.) ............... _ \ ...•............................... . ........................ ....:,.-DETECTION LIMIT--------- -.-e ~--_,---------r_-------~-------~--~ 111 IOCT 81 MAR 82 ~ 82 AUG 82SAIRING DATE,..'•- •..•lit• ..• ...-..•ALASKA POWER AUTHORITY•..GRANT LAKE HYDROELECTRIC PROJECT NITRATE LEVELS ..- ..Source: AEIDC 1982 FIGURE 2-42-16 ..EBASCO SERVICES INCORPORATED..
" ICRo" KoSIC"oRL -•--- --" IC---Ro" HoSIC-"o- R-•- -•- •11515812515" 58 IiI2511515812518815" 58 6IL25OCT IIIIWfJ IJKEClIIUTMTY MIl TOTAl. DIm.YfD nmsDRJBJmru;mm 0IltIUHJS/00TOTAl. DISSIUED SUDS CIIGIl)FAlLS am:CIIIlOCTMlY MIl TOTAl. DIm.YfD nmso aKU:lIVm 0IltIUHJS/00IIfBI-TOTAl. DISSIlYfD SIllDS CIIG/l)-SNf\..IN6 DATESource: AEIDC 19822-17" ICRo" KoSIC"oR11515812515"658 r-IL25IIWfJ am:CIIIlItTMTY MIl TOTAl. DIm.YfD nms1W!82 JJl82 AlU2SNfllNB DATE(I) NOT MEASURED(2) FALLS CREEK FROZEN MARCH 1982ALASKA POWER AUTHORITYGRANT LAKE HYDROELECTRIC PROJECTCONDUCTIVITY AND TOTALDISSOLVED SOLIDSFIGURE 2-6EBASCO SERVICES INCORPORATED
' ..It should be noted that thepresence of "true color" (water color due to dissolved substances thatabsorb light) can cause measured turbidities to be low (APHA 1981).However, suspended solids levels in Grant Lake were also low, rangingGrant Lake turbidity values ranged from 0.24 to 3.8 NTUs, with thehighest value occurring in October 1981.from 0.3 to 8.6 mg/l.show a seasonal trend, the low precision of suspended solidsmeasurements (a standard deviation of approximately 5 mg/1 at aconcentration of 15 mg/l suspended solids [APHA 1981]) precludesdrawing conclusions on seasonal variations. Secchi disc readings--..--Grant Creek turbidity values ranged from 0.40 to 0.80 NTUs andsuspended solids ranged from 0.6 to 4.3 mg/l... -surface outflow from Grant Lake, Grant Creek water quality valuescorrespond closely to those of Grant Lake's lower basin.-..solids levels varied from less than 1 to 8.6 mg/l.-.. 2.2.3.2 Dissolved Solids-The predominant ions present in the Grant Lake system are calcium,bicarbonate.Figure 2-3.----•- •-..- ..Although the suspended solids data appear toranged from 1.6 to 16.4 ft. The lower basin is consistently slightlyclearer, less turbid, and generally lower in suspended solids than theupper basin, suggesting some settling in the upper basin.Because Grant Creek is aFalls Creek turbidity values ranged from 0.35 to 6.0 NTUs and suspendedSuspended solidslevels were presented during June, the high flow period of the year.sulfate, magnesium, aluminum, potassium, sodium, chloride, iron, andObserved concentrations for five ions are presented inThe major ionic concentrations for Grant Lake were consistently low andremai ned essenti ally constant throughout the monitori ng period.Calcium ranged from 9.9 to 12.5 mg/l and sulfate from 4.5 to 6.5 mg/1 •All other ionic concentrations were less than 2 mg/1.2-18
Grant Creek ionic concentrations were similar to those of Grant Lakeand showed very little seasonal variation. Falls Creek data showedsimilar ionic concentrations, although calcium levels were somewhatlower, ranging from 7.7 to 8.5 mg/l.Alkalinity levels were low in all study area waters, indicating a lowbuffering capacity. Alkalinities ranged from 15 to 28 mg/l as CaC03'with the highest values occurring in March. The pH values ranged from6.2 to 7.5, with the lowest values occurring in August. Study areawaters are slightly acidic to neutral in pH, characteristic of waterwith a low buffering capacity.Nutrients measured during the monitoring program were nitrate (Figure2-4) and orthophosphate. Grant Lake nitrate concentrations ranged fromless than 0.1 to 0.38 mg/l. Nitrate concentrations rose during thesummer, reflecting low nitrate demand, and declined during the winter,reflecting nitrate consumption. Orthophosphate levels were below thedetection limit of 0.01 mg/l for all samples except in March, 1982,when a value of 0.13 mg/l was measured.Nutrient values in Grant Creek closely followed those of Grant Lake, asshown in Figure 2-4. Orthophosphate levels in Grant Creek were below0.01 mg/l except during March, when the concentratiion was 0.04 mg/l.tJutrient levels in Falls Creek were consistently near the detection1 imits of 0.1 mg/l for nitrates and 0.01 mg/l for orthophosphates.Total dissolved solids concentrations (Figure 2-5) should closelyapproximate the sum of all the major ionic components of the sampledwater. For most of the samples, however, the sum of the ioniccomponents was significantly less than total dissolved solidsconcentrations. The percentage of total dissolved solids representedby the ions ranged from 44 to 123 percent, with only two samplesbetween 85 and 115 percent. Because the major ion concentrations wereconsistent, it is assumed that the total dissolved solids data aresomewhat in error. This;s supported by the October, 1981 sampling in•••- -..•..••........ .... ..- - ..-.. ......
-•-..-..- ..which a number of additional ions were examined. Most were below".'"Conductivity values should be closely related to total dissolvedsolids.and the June reading for Falls Creek appeared unreasonably high.general, conductivity levels were low, consistent with other datashowing low ionic concentrations.2.2.3.3 Trace Metalsshown in Table 2-3 with the relevant water quality criteria andstandards. The most stringent criteria are generally the 24-houraverage concentrations for freshwater aquatic life issued by EPA .levels are associated with low hardness values. Because hardnessfor cadmium and lead...-..-..-..-......-..-....-..-..detection limits; the rest occurred at very low concentration levels.Hence, there is no significant contribution to the dissolved solidsfrom these constituents. Despite this uncertainty, however, dissolvedsolids levels were generally low. A dissolved solids range of 30-50mg/l appears to be representative, indicating a soft, slightlymineralized water.As shown .in Figure 2-5, this is true for most of the samples •Conductivity values in March, however, appeared to be unreasonably low,InTrace metal concentrati ons obtai ned duri ng the moni tori ng program areThese criteria are dependent on hardness concentrations; low toxicitylevels in the study area waters were as low as 25 mg/l, the resultingcriteria were often below analytical detection limits, as was the caseConcentrations of cadmium, copper, and zinc wereabove the 24-hour average criteria for freshwater aquatic life for onesample each (Table 2-3). Concentrations of lead were consistentlyabove the 24-hour average criterion level of 0.15 micrograms per liter(ug/l) for freshwater aquatic life, but did not exceed the maximumconcentrati on criteri a of 32 ug/l.Two trace metal concentrations appear to be a result of samplecontamination because of their inconsistency with other values; theAugust Grant Lake t'eading of 18 ug/l copper, and the March 1982 Grant2-20
Creek reading of 125 ug/l zinc. Other than these two measurements, alltrace metal concentrations were below the maximum freshwater aquaticand human health criteria, and below the Alaska water quality standards.2.2.3.4 TemperatureSeasonal temperature measurements were taken at Grant Lake, GrantCreek, and Falls Creek during the 1981-82 monitoring program. Inaddition, weekly temperature profiles were obtained during August andSeptember 1982 in Grant Lake's lower basin. A limited amount ofhistorical temperature data for study area waters is also available.Seasonal temperature profiles for the upper and lower basins of GrantLake are shown in Figures 2-6 and 2-7 and are tabulated in Tables 2-6and 2-7. Grant Lake showed thermal stratification during August andSeptember, although a classic, sharply defined thermocline did notdevelop. Summer temperatures ranged from 14°C at the surface to 5°C at98 ft depth. Fall overturn began in mid-September 1982 and October1981, as evidenced by the limited temperature variation with depth.Winter data from early March 1982 shows an inverted thermocline,ranging from 2°e near the ice/water interface to 4°C at 9.8 ft depth.Spring overturn resulted in an isothermal condition in early June, asshown by the June 1982 profile. The upper basin (Figure 2-7) displaysthe same thermal regime as the lower basin, with a smaller range intemperatures.Historical Grant Creek temperatures (Table 2-8) ranged from 13 to O°C.Grant Creek temperatures were closely related to Grant Lake surfacetemperatures; the maximum difference was less than 1.7°C.Falls Creek is generally colder than Grant Creek, ranging from 7°Ccolder in July, 1959 to 2.5°C colder in October 1981. Table 2-7compares the historical temperatures of Falls Creek to other study areawaters.2-21,....... ..- ---......- •-.. ....- ..- ..-.. ........- ..
VERTICAL TEMPERATURE PROFILES OF 9RANT LAKE - LOWER BASIN0 SOURCE. AEIDC 1982......................~'I ......0, ,-' I --"2510 • ,,"...I-"/I,• , .. fIIIO"---•501,.-20 Ii', ,/175I OCTOBER
VERTICAL TEMPERATURE PROFILES OF &RANT LAI
TABLE 2-6GRANT LAKE TEMPERATURES (OC)COLLECTED DURING THE 1981-82 MONITORING PROGRAM>/1""1
TABLE 2-7GRANT LAKE TEMPERATURES (OC) ,..,COLLECTED DURING THE 1982 SUPPLEMENTAL DATA COLLECTION PROGRAMLOWER BASIN OF GRANT LAKE NEAR THE TUNNEL INTAKE SITE...u\Deeth Date(m) (ft) 8/8/82 8/14/82 8/21/82 8/28/82 9/4/82 9/12/82 9/22/82 9/26/82 ..•1 3.3 12.3 12.9 12.7 12.7 12.5 12.3 7.3 6.9 2 6.6 12.3 12.7 12.5 12.5 12.3 12.3 7.1 6.73 9.9 12.3 12.7 12.3 12.3 12.3 12.1 7.1 6.7-4 13.1 11.9 12.7 12.3 11.9 11.9 11.9 7.1 6.75 16.4 10.9 12.5 12.1 9.5 10.9 10.3 7.1 6.56 19.7 10.5 11.9 12. 1 9.1 9.7 9.9 7. 1 6.5•7 23.0 10.1 11.7 11.1 8.9 8.9 9.1 7.1 6.58 26.2 9.9 10.7 10.5 8.7 8.9 8.7 7. 1 6.5 •9 29.5 9.7 10.5 10.3 8.7 8.7 8.7 6.9 6.310 32.8 9.5 10. 1 9.9 8.3 8.5 8.5 6.7 6.3 •..11 36.1 9. 1 9.3 9.3 8.1 8.3 8.1 6.5 6.3..12 39.4 8.5 8.7 8.7 7.5 7.9 7.7 6.5 6.3-13 42.7 8.3 8.3 8.3 7.3 7.7 7.5 6.3 6.114 45.9 8.1 8.1 7.3 7.1 7.3 7.3 6.1 6.1..15 49.2 7.7 7.7 6.7 6.9 6.7 6.9 5.9 6.116 52.5 7.3 6.7 6.1 6.5 6.5 6.5 5.7 6.1..17 55.8 7.1 6.1 6.1 6.3 6.5 6.5 5.7 6.118 59.1 6.3 5.5 5.7 6.3 6.1 6. 1 5.3 6. 119 62.3 6.3 5.3 5.5 6.1 5.9 5.9 4.7 5.920 65.6 6.1 5.3 5.3 6.1 5.5 5.5 4.5 5.9 •..UPPER TRAIL LAKE TEMPERATURES (OC)UPPER TRAIL LAKE NEAR THE TAILRACE SITE..Deeth Date..(m) (ft) 8/8/82 8/14/82 8/21/82 8/28/82 9/4/82 9/12/82 9/22/82 9/26/82'"".-..- ..1 3.3 10.1 11.1 10.9 9.7 10.1 10.3 5.5 5.3 --Source: Ebasco Supplemental Data.-- - -2-25.. ..
TABLE 2-8TEt4PERATURE COMPARISONS FOR PROJECT WATERBODIESHi'" Temperature Temperature,;Ill Difference DifferenceBetween Between.. Date Source Grant Lake Grant Fall s Grant Lake Grant Cr.Surface Creek Creek & Grant Cr. & Fall s Cr.(OC) ( °C) (OC) (OC) (Oe)*,.• 11/3/59 USFW (1961 ) 4.4 0.3 4.1- 6/8/606/17/60- 7/20/60 " 12.8 11.18/8/60IIIIII7.8 5.0 2.811.7 11.7 05.0 1.7 6. 1-11. 1 11.1 0-8/13/60-9/1/60•-II10/16/60IIII10.6 6.7 3.910.0 5.6 4.4- -10/13/81 AEIOe (l982) 7.2 6.0 3.5 1.2 2.5-"'"9/14/60 9.4 5.0 4.43/2/82IIII6.7 5.6 2.2 1.1 3.42.0 1.0 1.0II6/9/826.6 6.5 4.0 0.1 2.5II•-8/3/8214.0 12.5 5.5 1.5 7.0Average Ternperature 0.8 4.1• Difference, °C-•..•-- ..-2-26-
2.2.3.5 Dissolved OxygenDissolved oxygen levels in Grant Lake are shown in Table 2-9.Dissolved oxygen levels remained near saturation over the entire rangemeasured (0-164 ft) for all sampling dates.2.2.3.6 Coliform BacteriaColiform bacterial counts were zero per 100 ml for all samples measured.2.3 HYDROGRAPHY OF LAKES AND STREAMS AFFECTED BY THE PROJECT2.3.1 Grant Lake.'.'..••.'..Grant Lake is composed of two basins joined at right angles by arelatively narrow and shallow channel. Both basins are quite deep; theupper basin reaches 283 ft in depth and the lower basin 262 ft. Theupper basin has a surface area of 997 acres and the lower basin 688acres. Total volume of the <strong>lake</strong> is approximately 250,000 acre-feet andthe mean depth is 91 ft. The current surface elevation of Grant Lakeis 696 ft, although the <strong>lake</strong> level generally fluctuates several feetduring the year.Grant Lake is primarily fed by Inlet Creek at its headwaters, butseveral other smaller streams drain the steep mountain slopes adjacentto the <strong>lake</strong>. The sole outlet from Grant Lake is Grant Creek, locatedat the south end of the lower basin. Grant Creek has an average flowof 188 cfs, which suggests Grant Lake has a flushing rate of 672 days.After Project completion, Grant Lake surface elevation will range from660 to 691 ft. Post-Project <strong>lake</strong> volume will range from 192,800 to239,700 acre-feet, representing a reduction of 23 to 4 percent frompre-Project conditions. Total outflow would continue to average 188cfs, resulting in a minimum flushing rate of 518 days at a <strong>lake</strong>elevation of 660 ft. Pre- and post-Project characteristics for GrantLake are summarized in Table 2-10.2-27- ..- • ......----..- ..---....-
TABLE 2-9,."DISSOLVED OXYGEN MEASUREMENTS FOR GRANT LAKE~,-June 1981~7Dissolved Oxygen (mg/l)October 1981 ~ June 1982~7'k.'.Deeth Lower Upper Lower Upper Lower Upper(m) (ft) Basin Basin Basin Basin Basin Basin-- Surface 11.3 11.6 10.75 10.5 14 14.51 3.3 11 .5 11.8 13.52 6.6 11.7 11.9 13.5-3 9.9 11.8 12.0 13.54 13.1 11.8 12.0 13.5• 5 16.4 11 .9 12.1 13.56 19.7 11.9 12.0 13.5-.. 7 23.0 12.0 11.8 13.58 26.2 12. 1 11.9 13.59 29.5 12. 1 12.0 13.5-102032.8 12.1 11.9 13.515 49.2 12.2 12.4 12.965.6 12. 1 12.3 12.525 82.0 12.2 12.5- 30 98.4 12.0 12.6 12.435 114.8 12.440 131.2 12.0 12.6 12.045 147.6 11.850 164.0 11.9 12.6 11.0-52 170.6 9.75 10.854 177 .2 10.2560 196.9 12.6•- !/ Source: ADF&G 1981• ~/ Source: AEIDC 1982..- ..•- •..• 2-28..•
7 tTABLE 2-10LAKE AND STREAM CHARACTERISTICS FOR PRE- AND POST-PROJECT CONDITIONSGRANT LAKEShorelineSurface Elevation(feet)Surface Area(acres)Lake Volume(acre-feet)Length(feet).'- --...Pre-Project 696 1685 250,000 1 100,487 1Post-Project 660-691 1484~/ 192,80o!: 92,6392.STREAMSMean Average StreamFlow Length Width GradientStream (cfs) (ft) (ft) (ft/mi) SubstrateGrant CreekPre-Project 188 1 5,810 25 207 Cobble and boulderPost-Project O£ . . . ... with several gravelbarsFalls Creek~/ 38 42,240 15 418 Cobble and boulderwith some gravel,uniformly coveredwith fi ne si It2.1 Minimum value corresponding to a <strong>lake</strong> elevation of 660 feet.~I£1Not directly affected by the Project.The only flow would be from local inflow and groundwater, or fromoccasional overspills.2-29•- •...•••-•--...- ...•--...-----
2.3.2 Grant and Falls Creeks'.".-•-•- •- •- •-•- •--•---•Average annual flow for Grant Creek is currently 188 cfs. Total streamlength is 5,810 ft, with an average gradient of 207 ft/mile. TheCreek's substrate consists of cobble and boulder alluvial deposits withnumerous gravel bars. Average stream width is approximately 25 ft.Grant Creek flows into the channel between Upper and Lower Trail Lakes{Figure 2-1}.The Grant Creek streambed would be essentially dewatered after Projectcompletion. The only contribution to streamflow would be from localinflow and groundwater. Local inflow would be very low due to thesmall drainage area (less than one square mile). Groundwatercontributions are expected to also be very low due to the lack ofcontinuous surficial deposits and the low permeability of the bedrockmaterial. Project discharge will flow into Upper Trail Lakeapproximately one-half mile north of the mouth of Grant Creek (Figure1-3) •Average annual flow for Falls Creek is approximately 38 cfs, althoughthe stream freezes solid in winter. The current stream length is42,240 ft, with an average stream gradient of 418 ft/mile. Streamwidth varies considerably from headwaters to mouth, but averagesapproximately 15 ft. Falls Creek substrate consists of cobble andboulder deposits with few gravel bars and a thin blanket of fine siltnear the mouth. The Falls Creek streambed has been extensivelychannelized and modified by placer mining within the lower one mile.Falls Creek flows into Trail River approximately 1.8 miles downstreamfrom the mouth of Grant Creek (Figure 2-1).Pre- and post-Project streamflow characteristics for Grant Creek aresummarized in Table 2-10. Falls Creek is not affected by the Project.-•- •-2-30
2.4 GROUNDWATERThe Grant <strong>lake</strong> and Upper Trail <strong>lake</strong> region is characterized byglacially scoured bedrock with little or no soil cover. Isolated areasof alluvial material occur at the head of Grant <strong>lake</strong>, in part of theTrail <strong>lake</strong> valley, and as small pockets forming wetlands in bedrockdepressions. There are no extensive, continuous aquifers in the region.I, '.,....- --- •----•Bedrock permeability is fracture permeability only. Open fracturesexist, but they do not form extensive, interconnected pathways. Thefact that Grant <strong>lake</strong> and the Trail <strong>lake</strong>s differ in elevation by morethan 200 ft and are less than a mile apart attests to the lowpermeability of the bedrock ridge that separates them.little is known about the regional groundwater conditions since fewwells exist. No major springs were identified during this study. Onlya few minor seeps were noted along bedrock cliffs.Many small surface streams are active during the summer, with someoriginating within the small wetlands found along the ridge separatingGrant <strong>lake</strong> and Upper Trail <strong>lake</strong>. The presence of streams draining thesmall bogs indicates that the bogs are areas of discharge, at leastduring the summer months. These observations coupled with dataobtained during the exploratory boring program indicate that thegroundwater table is very near or at the surface over much of the areabetween Grant and Trail <strong>lake</strong>s. During the summer, both Grant and Trail<strong>lake</strong>s are also areas of groundwater discharge, with Grant Creekdraining Grant <strong>lake</strong>, and Trail <strong>lake</strong>s draining southward into the TrailRiver and into Kenai <strong>lake</strong>.Summer rains coupled with snow melt form the major source forrecharging the groundwater system. The low bedrock permeability and2-31.... ••..•III-....- ....- -..- -
,"'...•- •- - - - --...the lack of major alluvial valleys. however. suggest that much of theavailable recharge water 1s discharged as surface runoff into Grant andTrail Lakes. This suggestion is supported by the observation thatwater levels in Grant and Trail <strong>lake</strong>s rise rapidly during very warm orwet summer weather. Variations of over one foot in Grant Lake andseveral feet in Upper Trail Lake were noted during the 1981-1982 fieldseason. many times occurring in the space of a few hours.Little recharge occurs during the winter due to the combined effects ofgeologic, geomorphic, and climatic factors, including the relativelyimpermeable bedrock and sub-freezing temperatures. Little is knownabout regional groundwater conditions in the winter, although the fewsmall water supply wells in the Trail Lakes valley continue to operateyear-round. The level of Grant Lake drops several feet during thewinter until the outlet elevation is reached.2.5 POTENTIAL IMPACTS•...- -•- •-•-•..•..•..•-•This section describes the expected short-term and long-term effects ofthe Project on water quantity, water use, and water quality.2.5.1 Construction PhaseVegetation removal for tunnel installation and powerhouse and accessroad construction will increase erosion rates somewhat in the affectedareas. Where vegetation removal occurs near water bodies, such as thetunnel intake structure, increased sedimentation will result. Tominimize this process, erosion control measures will be implemented, asdiscussed in Section 2.6, Mitigation of Impacts.No contaminants other than sediment will be discharged into study areawaters. All sanitary wastes will be transported out of the study areafor proper disposal.2-32
Construction impacts will oe short-term, usually lasting only a fewmonths. The Alaska Department of Environmental Conservation willreview all construction plans and issue appropriate permits.2.5.2 Operation Phase2.5.2.1 Water QuantityAfter Project completion, Grant Lake surface elevation will range from660 to 691 ft, in contrast to its current mean elevation of 696 ft.The primary changes in the flow regime for the Grant Lake system willbe in discharge timing, and location. The timing of the regulatedmonthly di scharge wi 11 vary somewhat from pre-Project flows. Peakflows will be reduced and delayed from an average of 451 cfs (June) to360 cfs (August), and low flows will be increased from 36.1 cfs (March)to 40.0 cfs (April). The location of the discharge will be movedone-half mile north of the mouth of Grant Creek.Project discharge will represent approximately 32 percent of theaverage annual flow through the Trail <strong>lake</strong>s system at the point ofi nfl ow. Because peak flows will be reduced and low flows increasedover existing Grant Creek flows, no adverse impacts on the Trail <strong>lake</strong>sflow regime are anticipated. The Project will have no affect on theTrail Lakes hatchery or tributaries upstream.After Project completion, Grant Creek will be dewatered over its entirelength. In the affected stream reaches, erosion and sedimentdeposition due to streamflow will cease. The only change to channelconfi gurati on wi 11 be a reduced wi dth due to gradual revegetati on ofthe channel sides. The impacts of stream dewatering on fish andwildlife are discussed in Chapter 3."""..- - ..- .. ..- --..••...-..- -------- ..- --2-33
The Project is expected to cause little or no impact on the groundwaterregime because of the limited groundwater resources in the area.--•The Project will not affect the water supply to the two miningoperations possessing the water rights described in Section 2.1.2. Themine on Grant Lake's lower basin will continue to use Grant Lake water,although the <strong>lake</strong> elevation will be lower.2.5.2.2 Water Use---•Recreational use of Grant Lake water will not be affected by theProject. Because Grant Creek will be dewatered, recreational use ofGrant Creek will be affected by the Project; these impacts arediscussed in Chapter 7.-•-•---- •-•Because no groundwater use is known to occur in the Project vicinity,no impacts on groundwater use are expected.2.5.2.3 Water QualityBecause the Project is not expected to affect the main characteristicsof Grant Lake, water quality impacts are expected to be minor. Themost prominent Project impact on water quality will be the temperatureof the discharge water. Additional minor effects on suspended solidslevels and turbidity may also constitute a short-term impact. Noimpact on groundwater quality will occur because the Project should notaffect groundwater resources.General Water Quality Parameters--- •-•Because the essential characteristics of Grant Lake should not besignificantly affected, post-Project level s of nutrients and major ions---2-34
k,are not expected to change. No change in the levels of dissolved gasesdischarged to the Trail Lakes system is expected, because no spillwayis involved.TemperatureDuring late summer, Grant Lake is presently thermally stratified asevidenced by the temperature profiles shown in Figures 2-6 and 2-7.Because the dominant factors affecting thermal stratification will beunaffected by the Project (i.e., solar radiation, wind action, andgeographic location), the <strong>lake</strong> will probably continue to stratifyduring late summer after the Project is in operation.During the winter Grant Lake is cooler at the surface than at depth, asshown in Figure 2-6. This pattern will not be affected by theProject.During the fall and spring, Grant Lake is essentially isothermal asshown by temperature profiles taken in June and October, 1982(Figure 2-6). This thermal regime should be unaffected by the Project.Project discharge, released from the submarine inlet at elevation 643ft, will have a different thermal regime than Grant Creek. Historicaltemperatures recorded in Grant Creek have varied from 0 to 13°C, asshown in Figure 2-8. Assuming that Grant Lake will continue tostratify as observed in 1982, the temperature of the discharge waterwould correspond to the temperature of Grant Lake at the depth of theintake structure. In April, the intake will be 17 ft below the <strong>lake</strong>surface and in September 47 ft below the surface. The <strong>project</strong>edtemperature at the appropriate depth is plotted on Figure 2-8 so thatGrant Creek and Project discharge temperatures can be directly compared.As seen in Figure 2-8 Project discharge temperatures are expected tovary only a few degrees throughout the year, from 4°C in the winter toapproximately 8°C in the summer. Project discharge should be warmer2-35- - - ..- - - ..- ..••---..--- --..- - --
II II.t II II II II II It II IIII I. I.i li;',i .. ..15-10uGRANT CREEKTEMPERATURES•• •••1Il.LI0:::;:)~0::l.LI0...:!5l.LII-PROJECTED PROJECTDISCHARGETEMPERATURES •--------g----~---~•O~--_.~----~I--~--~----~------I------~----~------+_----~----~~----+_----~JANFEB MAR APR MAYJUNJULTIME OF YEARAUG SEP OCT NOV DECLEGEND•o•GRANT CREEK TEMPERATURE(ADFG 1961, USGS 1981, AEIDC 1982)GRANT LAKE TEMPERATURE AT DEPTHOF INTAKE (AEIDC 1982)GRANT LAKE TEMPERATURE AT DEPTHOF INTAKE (EBASCOSUPPLEMENTALTEMPERATURE DATA)ALASKA POWER AUTHORITYGRANT LAKE HYDROELECTRIC PROJECTGRANT CREEK AND PROJECTEDPROJECT DISCHARGETEMPERATURESI=IGURE 2-8E13t\SCO 'SERV'CES INCORPORATED~----------------------------------------------------------~~~.~~--------------------
"""than Grant Creek from November to May and colder than Grant Creek fromJune to October. The implications of this temperature regime onpotential fisheries mitigation programs designed for the tailrace areaare described in Chapter 3.Temperature measurements taken in August and September 1982 show UpperTrail Lake to be colder than the surface of Grant Lake (Table 2-7).The temperature of Grant Lake water at the depth of the intake (Projectdischarge temperature) is expected to be generally less than 3°C coolerthan Trail Lake water. Project discharge is therefore expected to havea minor impact on temperatures in Upper Trail Lake.Turbidity and SedimentationThree Project features could affect turbidity or sedimentation/erosionpatterns in the Project area: channel enlargement between the twoGrant <strong>lake</strong> basins, <strong>lake</strong> level fluctuations, and tailrace discharge.The naturally shallow area between the upper and lower basins of GrantLake will be deepened by 18 ft during Project construction.Post-Project channel depth will vary from 10 to 40 ft compared to theexisting depth of 28 ft. To determine if deepening the channel wouldaffect turbidity in the lower basin, turbidity measurements were takenfrom the upper basin near the channel at 6.6 ft (2 m) intervals fromthe surface to a depth of 46 ft (14 m). The results show thatturbidity decreased with depth below 13 ft and varied by less than 2NTU units between 28 and 40 ft (Figure 2-9). Based on this data, thechannel enlargement is not expected to increase turbidity downstream.Suspended solids measurements taken in June and August 1982 supportthis premise. Suspended solids concentrations varied by less than 1.5mg/1 between 0 and 164 ft depth in the upper basin, and varied by lessthan 1.0 mg/l between the upper and lower basin.2-37...... ....- .. ........- •.. •..--..- .. .......... ....
TURBIDITY (NTU)o 2 3 4. 5 60~------~----~------~~~~------~-----1'.2310-45- ---•--•,.....E6::L 7I- a.wo 8EXISTING DEPTH OF CHANNEL20 ,.....--......::LI a.wo930/0---•II-•- •121314MAXIMUM DEPTH OF CHANNEL (40 ft)------------- 40-•- •- •-..-SOURCE: EBASCO SUPPLEMENTAL DATAALASKA POWER AUTHORITYGRANT LAKE HYDROELECTRIC PROJECTGRANT LAKE lFPER BAS~1'l.RBDrTY Y8 DEPTHFIGURE 2-1EBASCO SERVICES INCORPORATED2-38
:."'"'.•....................- ......•- •...•- •-••.....Grant Lake1s surface elevation will range from 660 to 691 ft afterProject completion, resulting in a ring of shoreline that will beinundated part of the year and above the water level the remainder ofthe year. During Project operation, these <strong>lake</strong>-bottom sediments willoccasionally be above or in shallow water, making them susceptible toerosion by wave action, surface runoff, or wind action.Bathymetry of Grant Lake shows steep slopes resulting in a relativelysmall surface area between 660 and 691 ft. Significant deposits of<strong>lake</strong> bottom sediments are restricted to the few shallow bays along thewestern shore, areas near the channel between the two basins, and theInlet Creek delta. Lake bottom sediments in the lower basin sampled at10, 20, 30, and 40-ft depths showed the sediment to be fine-grained,with 54 percent of the particles having the dimension of clay orsmaller (0.005 mm diameter). Following rain storms or strong windswhen the <strong>lake</strong> level is low, localized turbidity clouds may form in thebays and shallow areas. This effect will gradually decrease with timeas the sediments above elevation 660 ft are slowly washed into GrantLake and redeposited on the <strong>lake</strong> bottom •The tailrace, which would discharge Project water into Upper TrailLake, has been specially designed to produce a very low exit velocityof less than one foot per second (fps). This one fps approximates thescour velocity for fine to medium grained non-cohesive sand (Chow1959). Particles smaller than 0.2 mm (0.008 in) will be susceptible toerosion and subsequent deposition further downstream.2.6 MITIGATION OF IMPACTSErosion and sedimentation will be controlled by several mitigationmeasures. A minimum amount of land area will be disturbed, exposing aslittle bare soil as possible to erosion effects. Access roads willavoid steep slopes wherever possible, and will incorporate adequatedrainage systems such as water bars, culverts and ditches. Disturbedareas will be revegetated and stabilized, so that soil erosion will beprimarily short-term. The bridge over Grant Creek will be constructedduring low flow.2-39
Several aspects of the Project have been designed to further minimizewater quality and use impacts. Access roads have been located toreduce overall length and to place them away from water bodies, therebydecreasing sedimentation impacts. The tailrace has been specificallydesigned to minimize scour in the receiving channel by lowering thedischarge velocity and reinforcing the channel bottom. Extensive fishmitigation facilities, described in Chapter 3, will be implemented tomitigate the dewatering of Grant Creek. Project recreation facilities,described in Chapter 7, will mitigate the loss of recreational use ofGrant Creek. Mitigation measures to reduce erosion and sedimentationwill be defined in greater detail during the final design phase of theProject.2.7 SUMMARY OF AGENCY CONTACTSThe following is a summary of pertinent Agency contacts made in supportof this report. Correspondence between the Alaska Power Authority andvarious agencies is included in Part VIII, Technical Appendix, Volume 3.Alaska Department of Environmental Conservation1) Date:Agency Representative:Location:Subject:2) Date:Agency Representative:Location:Subject:2-40September 1, 1982Dan Wilkerson and Bob MartinADEC Anchorage officeWater quality studies performedby Ebasco·s water resourcespersonnel in the Grant Lake areaduring the summer of 1982,including temperature andturbidity measurements andcollection of <strong>lake</strong> bottomsedimentsNovember 12, 1982Gary Hayden (Anchorage)(Telephone conversation)Water quality standards thatapply to the Project••••:" II......••••....... ....lilt..II
•..•-•..•-••---•-•-•- ••--••-Alaska Department of Fish and Game1) Date:Agency Representative:Location:Subject:2) Date:Agency Representative:Location:Subject:Alaska Department of Natural Resources1 ) Date:Agency Representative:Location:Subject:2) Date:Agency Representative:Location:Subject:2-41January 25, 1982Ted McHenry (Seward)(Telephone conversation)Cyanide use in hard rock miningin the Project vicinity and thepotential for contamination ofFall s CreekSeptember 1,1982Tom ArminskiADF&G Anchorage officeWater quality studies performedby Ebasco's water resourcespersonnel in the Grant Lake areaduring the summer of 1982,including temperature andturbidity measurements andcollection of <strong>lake</strong> bottomsedimentsJanuary 19, 1982John Mohorvich (Soldotna office)(Telephone conversation)EXisting water rights on FallsCreekAugust 31, 1982John MohorvichDNR Soldotna officeStatus of water rights in theProj ec t a rea
3) Date:Agency Representative:Location:Subject:u.s. Department of Agriculture. Forest Service1) Date:Agency Representative:Location:Subject:2) Date:Agency Representative:Location:Subject:u.S. Fish and Wildlife Service1) Date:Agency Representative:Location:Subject:2-42October 21. 1982Gary Prokosch (Anchorage)(Telephone conversation)The major issues regarding waterrights for Falls Creek. includingthe Federal Land Reserve.existing water rights andexisting water useAugust 30. 1982Curt Nelson and Ralph BrowningUSFS Seward officeWater quality studies performedby Ebasco's water resourcespersonnel in the Grant Lake areaduring the summer of 1982.including temperature andturbidity measurements andcollection of <strong>lake</strong> bottomsedimentsNovember 16. 1982Ron Quilliam (Seward)(Telephone conversation)Status of cabins near Falls Creeklocated on Forest Service propertySeptember 1. 1982Mary Lynn NationUSF&W office in AnchorageWater quality studies performedby Ebasco's water resourcespersonnel in the Grant Lake areaduring the summer of 1982.including temperature andturbidity measurements andcollection of <strong>lake</strong> bottomsediments....- •..• ..IIIl1li•••-..•....--..- -..••
3.0 REPORT ON AQUATIC, BOTANICAL, AND WILDLIFE RESOURCES3.1 AQUATIC RESOURCES....'.ill- •-•- •-•...•- •...•- •- •...•...•...•...•The proposed Project will directly affect Grant Lake and Grant Creek.Nearby Falls Creek will not be affected by the Project (Figure 1-3).These water bodies were defined as the principal aquatic resource studyarea and are described in the following sections.3.1.1 Existing ConditionsTo determine the existing aquatic resources of the study area, aprogram was conducted that involved the following: literature reviews,field surveys, and consultation with federal and state planning,resource management, and regulatory agencies, local residents, andrecreationists. The program was organized to provide information onthe occurrence and ecological character of aquatic macrophytes,phytoplankton and periphyton, zooplankton, benthic macroinvertebrates,and fish. The following sections describe the water bodies of thestudy area and their plant and animal communities. Findings are basedupon field studies initiated in October 1981 and completed in September1982. The sampling locations, sampling frequency, and methodology ofthese studies are summarized in the Technical Appendix, Part IX.3.1.1.1 Grant LakeThe two basins of Grant Lake are surrounded by precipitous mountains.The shoreline in most areas is chararacterized by precipitous bedrockslopes with occasional small gravel deposits formed by runoff from themountains. The steep shoreline areas have a light sediment covering(less than 0.1 in). The shoreline vegetation consists of lowbushcranberry, ferns, alders, spruce, hemlock, and a few cottonwoods nearinlet stream deltas. The shoreline is littered with floating andsunken organiC debris and patches of thick macrophyte growth (e.g.,Ranuculus spp.) in the limited littoral areas. The <strong>lake</strong> is divided3-1
into two basins by a narrow constriction about mid1ake. An island atthe constriction creates a shallow sill about 25 ft deep which hindersmixing between the two <strong>lake</strong> basins. The influence of sediment-ladenInlet Creek is slightly more pronounced in the upper basin. Waterclarity, as measured by Secchi disc transparency, is significantlyhigher in the lower basin, but turbidity and suspended solids differ byless than 1.5 NTU and 1 mgn, respectively, between basins (see Table2-5). The water surface of the <strong>lake</strong> fluctuates moderately, rising toits highest level during summer runoff and falling to a low point inwinter. The distance from the <strong>lake</strong> surface to the high water mark wasapproximately six ft in October 1981, but was above this mark in August1982. Numerous short streams, including three glacial streams,originate in the nearly vertical mountains surrounding much of the<strong>lake</strong>. Based on the 1981-82 field sampling, none of the tributariessupport fish populations and only sculpin and threespine sticklebackinhabi t the 1 ake. The abundance of zoopl ankton suggests that it mayprovide adequate habitat and food for juvenile salmonids.3.1.1.2 Grant CreekGrant Creek flows from its origin in Grant Lake approximately 1 mile ina westerly direction and discharges at the narrows between Upper andLower Trail <strong>lake</strong>s. In the upper section the creek courses over threesubstantial waterfalls, through a rocky gorge, and over large rubbleand boulders. The lower section is somewhat less turbulent with fewerboulders and more frequent gravel shoals, although the gradient of thelower O.5-mi1e segment is still fairly steep. The average width of thestream is approximately 25 ft. Cover for juvenile fish is limited tostream margins, backwaters, deep pools, and to a few small sidechannels offering reduced velocities during low flow.3.1.1.3 Aquatic MacrophytesMacrophytes supply habitat for aquatic organisms (e.g., larval insects)and a substrate for periphyton. They may also protect fish eggs andjuvenile fish (Welch 1980) as well as contribute to primary production3-2•• .."..••-• .. "•-•--•-•••
in <strong>lake</strong>s. In some cases the protection afforded juvenile fish maycause overabundance and crowding of fish species.a sedge (Carex rhynchophysa) was found in a protected cove at thenarrows between the upper and lower Grant <strong>lake</strong> basins.•- limited.•White water crowfoot (Ranucu1us trichopny11us) grows along the shore ofGrant Lake but is abundant only at the <strong>lake</strong>'s outlet. A small stand ofBoth specieshave low abundance in Grant Lake because the two factors that mostpromote macrophyte growth, low turbidity and shallow depth (B1azka eta1. 1980), are limited in Grant Lake. Because of their low abundancethe importance of the macrophytes in the Grant Lake food chain is... 3.1.1.4 Phytoplankton and Periphyton•-••-..Phytoplankton and periphyton (i .e., attached algae) constitute animportant part of the aquatic food chain by providing a food foragebase for macroinvertebrates and fistl. No background information onperiphYton or phYtoplankton in the study area streams is availableother than that collected during field programs conducted in 1982(AEIDC 1982) .-•-•...•-•-•- •..•-•The results of the 1982 phytoplankton collections in Grant Lake areshown in Table 3-1. The dominant algal genera during all seasons werediatoms, mostly Cyc10tel1a and Synedra. Similar algae have been foundin other Alaskan <strong>lake</strong>s (Poe 1980) and those in British Columbia(Stockner and Shortreed 1978) possessing sockeye salmon runs. Thedensity of algae was low compared to northern oligotrophic <strong>lake</strong>s andslightly lower than densities found in northwestern British Columbiaand Yukon area <strong>lake</strong>s with glacial silt (Stockner and Shortreed 1978).Peak cell counts, mostly diatoms, occurred in August. Duthie (1979)observed similar late summer blooms of phytoplankton, consisting mostlyof di atoms, in 1 arger subarctic Ca nadian 1 akes. Chlorophytes anddiatoms are considered preferred food organisms for zooplankton thatserve as prey for sockeye salmon (Stockner 1977). Rankin and Ashton3-3
.~TABLE 3-1COt1POSITION AND DENSITY OF PHYTOPLANKTON FROM GRANT LAKE,1982.!1,..ICell s/U ter..March June August'"•..•Chloroptt}lta (Green Algae)IIIAnkistrodesmlJs 69Chodatell a 811 1,069 103..Monoraphidium 150 •.,Cryptophyta (Cryptomonads)Cry potomona s 345IIPyrroptt}lta (Dinoflagellates)Peri diniull1 (C.F.)!Y 2,691 1,052 931•..Chrysoptt}lta (Golden Algae)Di nobryon 52 1,527 6,313 .,Diatoms ...Achnanthes 1,757 152flffiphora 123 88 lit..Aster; one 11 a 394..Cocconeis 204 152Cycl otell a 1,675 9,377 18,590..Cymbe11 a 776 219Oiatoma 327Fragi 1 a ri a 204-IIIGomphonema 531Hannea 409Na vi cu1a 123Nitzschi a 41 ..Ste~hanodiscus 4,330 2,980IIISynedra (C.F. )!/ 2,941 4,338 33,218Unidentified diatoms 163 152•Unidentified Algae 1,926 603 ..Tota 1 Cell s 19,579 21,716 59,611 •...a/ AEIDC 1982. ..E:/ Apparent genus identification....•...3-4•III
...- ••...•-•- ..- ....--•- •..•..lit......-..•(1980) found that zooplankton biomass was highly correlated withpelagic primary production in 13 British Columbia oligotrophic <strong>lake</strong>s,some of which had glacial turbidity. The International BiologicalProgram (BrylinskY 1980) also found significant positive relationshipsbetween primary production and secondary pelagic production in <strong>lake</strong>sfrom around the world, but a less distinct relationship between primaryproduction and benthic production. Therefore, although phYtoplanktondensity in Grant Lake is low, the characteristics of the algalpopulation appear sufficient to support a desirable zooplanktoncommunity and hence a fish population.The importance of organic input to the food chain from phytoplanktonproduction in Grant Lake may be significant but cannot be readilydetermined. As a general rule the relative importance of allochthonousorganic matter (i.e., organic matter originating outside the waterbody, e.g., leaves) increases inversely to the ratio of surface area ofthe <strong>lake</strong> to length of shoreline (Saunders 1980). For Grant Lake, thiswould suggest that allochthonous input may be less important thanprimary production. However, thi s may be somewhat offset by thelimiting effect of glacial flour on water transparency and hencepri mary producti on •The periphyton community in Grant Creek, sununarized in Table 3-2, wasdominated by diatom species that are typical of a flowing waterenvironment (Ruttner 1974), namely, Achnanthes and Synedra. Thehighest diatom abundance occurred in spring, which corresponds with thenormal peak diatom bloom period in other water bodies (Welch 1980) •All three filamentous green algae found in Grant Lake are alsocharacteristic of flowing water. but Bulbochaete, the dominant genusfound in February, is more characteristic of slower flowing water thanthe other two (Whitton 1975). The reason that Bulbochaete was mostabundant in February is that Grant Creek had a low discharge and mostprobably lower velocities than in other months sampled. Both Ulothrixand diatoms are highly tolerant of low light (Whitton 1975). Low lightconditions may occur in Grant Creek from glacial silt runoff, which3-5
TABLE 3-2COMPOSITION AND RELATIVE ABUNDANCE OF PERIPHYTONFROM GRANT CREEK, 198~Relative AbundanceFebrua ry MayChlorophYta (Filamentous Green Algae)Buloochaete .386T~/U1 otfiri x .076ZygnemaChrysophyta (Golden Algae)DiatomsAchnanthes .284 .472Cocconeis .007 .004eycl otel1 a .002Cymbel' a .032 .024Oiatoma .033 .159GOmphonema .020 .026Rannea .004Navicu1 a .003 .004Ni tzschi a .002 .002Synedra .231 .228Total 1.000 .999~b// AEIDC 1982.Trace.(Percent)August.190.445.003.027.035.042.015.2451.002..•.... ....I....•..•3-6....III•..III• ..
..-•- •-..•_•-•- •----•reduces light penetration to the creek bottom. ~gnema is known totolerate low pH (Whitton 1975). It may be the most abundant speciesduring mid-su~ner because the pH in Grant Creek often goes below 7.0during the high runoff of this period. Although the dominant generachanged each season, they had similar characteristics, controlledmostly by the physical environment of flowing water. PeriphYtonconstitutes a food source to some benthic insects, particularly grazersand scrappers (Cummins 1975), but as is typical of most North Americanstreams, the major source of food for benthos is allochthonous inputsuch as falling leaves and, in this case, algae and zooplankton fromGrant Lake. Typically the smaller and more shaded the stream thegreater the importance of allochthonous matter.3.1.1.5 ZooplanktonZoopl ankton are often the main source of food for fish in 1 akes. If a<strong>lake</strong> such as Grant Lake is highly influenced by glacial runoff theabundance of zooplankton is often low (Stockner and Shortreed 1978).In such systems zooplankton populations are generally comprised ofc1adocerans, particularly larger individuals or species, over copepods(Eggers 1978; Rodgers 1968; Vinyard 1981). Also none of these studiesreported feeding on rotifers even though they were available. Thesmall si ze of rotifers compared to copepods or cl adocerans is the mai nreason they are not eaten. The main reason for the selection of-•the usually larger size and easier visibility of c1adocerans for thevisual feeding sockeye salmon (Eggers 1978). In the absence or low---•..co 1 umn as opposed to those that feed on other fi sh or on bottom orsurface organisms). However, if copepods are large they may be•--copepods and rotifers with a marked absence of c1adocerans (Koenigs1982). Cladocerans are usually more common in clear water systems andare often the preferred zooplankton prey of fish. Several studies ofjuveni·le sockeye salmon food habits documented they will usually selectcladocerans appears to be better evasion by copepods (Vinyard 1981) andabundance of large c1adocerans, copepods will be eaten by planktivorousfish (i.e., fish that feed mainly on organisms that are in the water3-7
actively pursued by fish. A study of juvenile feeding coho insoutheast Alaskan <strong>lake</strong>s found that large copepods were actuallypreferred over cladocerans (Crone 1981). Cyclopoid copepods also canbe a significant food item; they exceeded 25 percent of stomachcontents (by number) in the Wood River Lakes of Alaska in August forboth sockeye salmon juveniles and threespine sticklebacks (Rodgers19(8).Table 3-3 lists zooplankton taxa and their density for each basin inGrant Lake. Two genera of rotifers and a cyclopoid copepod genus (mostprobably a small Cyclops genus) dominate the zooplankton community.There are few c1adocerans in Grant Lake. This agrees with the 1981preliminary findings by the Alaska Department of Fish and Game (Koenigs1982), also shown in Table 3-3. The near absence of cladocerans inthis glacially-fed <strong>lake</strong> appears typical. Stockner and Shortreed (1978)studied ten <strong>lake</strong>s containing sockeye salmon in northwest BritishColumbia and Yukon Territory. In three <strong>lake</strong>s possessing a high glacialsilt load, only cyclops and rotifers were abundant. These glacial1yfed<strong>lake</strong>s generally had the lowest zooplankton abundance of the tenstudied.Highest abundance of non-rotifer zooplankton (i.e., cyc10poid copepods)occurred during August 1982, although the June 1981 count by ADF&G inthe upper basin was higher. Peak zooplankton abundance would beexpected sometime after peak abundance of their algal prey. Peakcounts of algal cells occurred in August in Grant Lake. Duthie (1979)found that in subarctic <strong>lake</strong>s in Canada, important zooplanktonabundance also peaked in August or September.Predation by fish may have significant effects on zooplanktoncomposition and abundance. The abundance of large zooplankton in GrantLake was usually higher in the upper basin. It may be that threespinesticklebacks, which were ten times more abundant in the lower basinthan in the upper one (AEIDC 1982), may affect significant predation ofthe large zooplankton. Rankin and Ashton (1980) found that in a <strong>lake</strong>.',-a"-•-..•- ..•iIIr••- .. ........•.,•......3-8•• ..
II I •• ' II II I. II 11 I. II I •• , Ii II II II Ii ,"" lTABLE 3-3COMPOSITION AND DENSITY OF ZOOPLANKTON FROM GRANT LAKE, 1981-1982Numbers/m3June 1981 ~/ October 1981 ~/ March 1982 b/ June 1982 b/ August 1982 b/Lower Upper Lower Upper Lower Upper Lower Upper Lower UpperTaxa Basin Basin Basi n Basi n Basin Basin Basin Basin Basi n Basi nEucopedoda (copepods)Cyclopoida 1,558 13,654 1,831 1,197 1,165 761 1,214Copepod nauplii 2384 740 1432,7383274,225 7,859169 86wIwCladocera(water fleas) 14Rotatoria (rotifers)Ken i cott; a 2,273 4,269 183 2,606 109 211 1,738Asp1anchna 385 1,154 296 296 711,518119845 3,211338 10,563a/ Unpublished data Alaska Department of Fish and Game (Koenigs 1982).b/ AEIDC 1982.
••highly populated with threespine sticklebacks the zooplanktonpopulation was impacted. Crone (198l) found that the introduction ofjuvenile coho salmon into <strong>lake</strong>s in southeast Alaska virtuallyeliminated larger zooplankton species. It is possible that lowervisibility in the upper basin inhibits feeding by visual feedingthreespine stickleback, allowing zooplankton populations to increase.The turbidity in the upper basin was higher than the lower basin (O.24NTU vs 0.4 NTU in June and 0.07 NTU vs 1.9 NTU for August for the lowerdnd upper basin, respectively)~It would be expected that zooplankton production per unit area in GrantLake would be similar to or higher than that of benthos in the littoralregion. Morgan (1980) states that the ratio of benthic production toprimary production in <strong>lake</strong>s is typically less than the ratio ofzooplankton production to primary production except for the littoralregion where they may be similar. He also states that the zooplanktonproduction to primary production ratio is generally higher inoligotrophic <strong>lake</strong>s, such as Grant Lake. Because of the relativelysmall littoral area of Grant Lake, due to the steep sides, totalzooplankton production in the <strong>lake</strong> is expected to be considerablygreater than that of littoral benthos.3.1.1.6 Benthic MacroinvertebratesBentl1; c macroi nvertebrates (benthos) are a major group of consumers inthe aquatic ecosystem that live in or on the bottom of <strong>lake</strong>s andstreams. In Alaska the group is composed primarily of immature larvalinsects. Benthos comprise an important link in the aquatic food chainand provide food for most fish and other aquatic vertebrates such asbirds and small mammals. The food habits of the group are verydiverse; some feed on periphYton or phytoplankton, while others consumedetritus or prey upon other aquatic organisms. Changes or disruptionsin the aquatic environment of temperature regimes, turbidity, orsedimentation of the <strong>lake</strong> or stream, can markedly influence the numberand types of benthic organisms present. Such changes ultimately can3-101
' ..-- ..-•-••-..- -•-..-..-..-....-- -alter the numbers and types of fish that the water body can sustain.Because benthic macroinvertebrates are sampled easily, are sedentaryand are indicative of previous changes in water quality, they can serveas convenient indicators of water quality change (U.S. Army Corps ofEngineers 1978).Hynes (1970) stated that the benthos of streams is remarkably similarthe world over and that alpine cold-water streams are occupied bylimited populations of a few species adapted to specific conditionssharply defined by consistently low temperatures and glacial runoff.Benthos have been collected throughout Alaska by various groups (Craigand McCart 1974; Craig and Wells 1975; Elliott and Reed 1973; McCoy1974; Nauman and Kernodle 1974), but little specific information isavailable for the Kenai River drainage. The most abundant benthosfound in Alaska are the larvae of chironomidae (midges) of the insectorder Diptera. Ephemeroptera (mayflies), Plecoptera (stoneflies), andTrichoptera (caddisflies) are generally abundant in streams while01 i goctJaeta (aquati c worms) and Pel ecypoda (c1 ams) are often common in<strong>lake</strong>s. In 1959-60 the Fish and Wildlife Service, U.S. Department ofthe Interior (1961), surveyed Grant Lake at the mouths of its varioustributaries to determine the species composition of aquatic insects.Trichoptera (caddisflies), Plecoptera (stoneflies), Simu1iidae(blackflies), and Gastropoda (snails) were recorded.Benthic macroinvertebrates collected from Grant Lake in 1981 and 1982are listed in Table 3-4. Samples collected during this surveycontained relatively low densities of insects with the exception ofchironomids (midges). Also there was a low diversity of bottomorgani sms, whi ch is common for col d-water, gl act a1-fed systems withsmall 1 ittoral zones (Hynes 1970). The most conlJ1on macroinvertebrateswere midges, oligochaetes (aquatic worms), and clams. Differences inahundance between the three sample periods appeared minor, althoughgenerally there were more organisms in June and August than inOctober. The lower basin had more caddisflies, clams, and snails andfewer aqlJati c worms. Reasons for these differences between basi ns are3-11
TABLE 3-4COMPOSITION AND DENSITY OF BENTHOSFROM GRANT LAKE, 1981-198~Organi sms/m 2Octo6er 1981 June 1982[ower Upper [ower UpperTaxa Basin Basin Basin Basi nDi pteraChironomidae (midges) 201 678 488 430P1ecoptera (stoneflies) 14Tri choptera (caddisfl ies) 7 100 1401igochaeta (aquatic wonns) 21 76 86 473Nematoda (round worms) 14 14Hirudinea (leeches) 14Bivalvia (clams) 36 402 43Gastropoda (snails) 7 158 14Gammari dae (sc uds) 14a/ AEIDC 1982.3-12J!:ugus{ 1982[ower UpperBasin Basi n432 77565215 4734312965 43......-•-••..•..•..- •-- - - -••-- - •
'- ..- -....-..-..-..-..-..-..-- -•- - ..-.....•.........-unknown, but may be a function of higher quantities of sediment in theupper basin, which typically had higher suspended sedimentconcentrations (see Section 2.0), which would favor burrowing01 i gochaetes.In Alaskan <strong>lake</strong>s, midges are often heavily utilized for food byjuvenile sockeye salmon, threespine stickleback, and other fishspecies. Rodgers (1968) found that small juvenile sockeye andthreespine sticklebacks in the littoral region of Lake Aleknagik,Alaska, consumed chironomids as the largest single item in theirdiets. Stoneflies, caddisflies, and gastropods each comprised lessthan 1 percent of their stomach contents. The importance ofchi ronomi ds to these species was mi nima 1 in the 1 imneti c zone of the<strong>lake</strong>. Also as the sockeye salmon increased in size they relied more onzooplankton. Other studies have found similar use of midges in <strong>lake</strong>sby sockeye salmon fry (Goodlad et al. 1974). Some fish, like sculpins,are almost entirely dependent on benthic organisms (Eggers et al. 1978)for food. The less available oligochaetes, which live buried in thesediment, contribute negligibly to the diet of sockeye and sticklebacks(Rodgers 1968). Adult mayflies, blackflies, caddisflies, andcraneflies were observed near the <strong>lake</strong> and caddisfly larvae andHemiptera (water boatmen) were captured in fish minnow traps. Atpresent the benthic organisms probably play an important role insurvival and production of sculpin in the <strong>lake</strong> but are of minorimportance to threespine sticklebacks.The results of benthic Surber sampling in Grant Creek during the fourseasons 1981-1982 are shown in Table 3-5. To date no other publishedhistorical survey data on invertebrates in Grant Creek have beenfound. Diversity was low, which is typical for cold glacial streams .The most abundant organisms were midges, followed by moderate numbersof mayflies, stoneflies, and clams. Abundance varied between season,but without apparent temporal trends. The 1 arge numbers of midges andmoderate numbers of mayfl ies and stonefies found in Grant Creek woul dbe important food for salmonids in streams (Rodgers 1968) .3-13
-TABLE 3-5 .....cor~POSITION AND DENSITY OF BENTHOS FROM GRANT CREEK, 1981-1982~/Organi sms/m 2 ---------------- •Taxa October 1981 March 1982 May 1982 August 1982 ----------------------------------------------------------------------Grant CreekDipteraChironomidae (midges)Empididae (dance flies)Simuliidae (blackfiles)Ephemeroptera (mayflies)P1ecoptera (stonef1ies)Trichoptera (caddis flies)Coleoptera (beetles)01igochaeta (aquatic worms)Hirudinea (leeches)Bivalvia (clams)Hydracarina (water mites)Corixidae (water boatman)6,677111621831112467,457111561022261662,3872974874117271773,296271113086549....--IIIIi••-•-•Y AEIDC 1982.....3-14-•....--.. ....
-- -•3.1.1.7 Fish-•- •-•- •-•-- -•---•-•..•- •- •....•The Kenai River is one of the most important upper Cook Inlet systems;n terms of spawning habitat for commercial and game fish, whichinclude five species of Pacific salmon, Dolly Varden, eulachon, andrainbow trout. Twenty-one species of fish have been reported in theKenai River drainage (Table 3-6).The species considered most important in the study area are chinook andsockeye salmon, Dolly Varden, and rainbow trout. Historical sport andcommercial harvest data for chinook salmon compiled by AEIDC (1982) aresummarized in Figure 3-1. For the period 1974-1981, the sport harvestof chinook salmon comprised approximately 48 percent of the totalharvest; commercial and subsistence catches comprised approximately 52percent. Figure 3-1 indicates considerable fluctuation in Kenai Riverchinook salmon harvest over the past eight years. Early run fish,typical of chinook returning to Grant Creek, show a general increase inharvest over the peri od. Sport harvest data for all salmonids aresummarized in Figure 3-2. Chinook salmon comprise the greatest portionof the catch followed by coho salmon and Dolly Varden. Sport andcommercial fishing for salmon is a dominant factor in the KenaiPeninsula's economy, although the fishery in Grant Lake and FallsCreeks is of relatively minor economic importance. Grant Creek is usedby three species of salmon (chinook or king salmon, sockeye or redsalmon, and coho or silver salmon), Dolly Varden, and rainbow troutthat contribute to fisheries in the Kenai River and marine waters.The following paragraphs summarize the life histories of the moreimportant species in the Kenai River basin. Generalized life historiesare also provided for Dolly Varden and rainbow trout, important sportfish in the study area. Table 3-7 presents life history informationfor Pacific salmon utilizing Grant Creek.3-15
TABLE 3-6FISH SPECIES REPORTED TO OCCUR IN THEKENAI RIVER SYSTE~/SpeciesArctic lamprey (Lam etra japonica)Chinook (king) salmon Oncorhynchus tshawytscha)Sockeye (red) salmon (Oncorhynchus nerka)Coho (silver) salmon (Oncorh*nchus kisutch)Chum (dog) salmon (Oncorhync us keta)Pink (humpback) salmon (Oncorh nchus gorbuscha)Rainbow trout (Salmo gairdneriDolly Varden (Salvelinus malmaNorthern pike (Esox lucius)Lake trout (SalveTinus namaycush)Eulachon (Thaleichthys pacificus)Longfin smelt (Spirinchus thaleichthys)Sculpin (Cottus sp.)Slimy sculpin (Cottus cognatus)Coastrange sculpin (Cottus aleuticus)Staghorn sculpin (Leptocottus armatus)Round whitefish (Proso ium cylindracum)Threespine stickleback Gasterosteus aculeatus)Ninesp;ne stickleback (Pungitius un itiu 7)Pacific herring (Clupea harengus a11asiStarry flounder (Platichthys stellatus _7Longnose sucker (Catostomus catostomus)Arctic grayling (Thymal1us arcticus)~/ Adapted from Kenai River Review, 1978. U.S.Department of the Army, Alaska District Corpsof Engineers.Q/ Found only in intertidal area.---•--•----•-....II•..3-16•-•-•-•--•..•..
I I•• I I • I • j I I• I • I • I • , I I I• • • • , I• I i l "l. ~ Ii2M;20191817% 16(I)ii:15610%I- 9cu Z!8-....J0I.fJ 7I-(I) 6TOTAL""14013(I)LATE RUN012z~ III.fJ>0: 5C(% 40: 3I.fJm 2:E:::;)zI01974 1975 1976 1977 1978 1979 1980 1981 ~YEAREARLY RUN~ 1981 DATA ARE PRELIMINARY EBASCO SERVICES II\COR PORATE 0
- --..CHINOOK SALMON31.5%COHO SALMON21.5%DOLLY VARDEN17.3%PINK SALMON16.5%ALASKA POWER AUTHORITYNT LAKE MY OELECTRICP 0 CFIGURE 3-2EBASCO SERVICES INCORPORATED..•..•....--..•..•..,.••..-.....,..- ....- -•..•....-
t j'I" I •• , •• ij i I j • • • • • • • • • I a j II i ic '"TABLE 3-7LIFE HISTORIES OF PACIFIC SALMON KNOWN OR SUSPECTED TO SPAWN IN GRANT CREEK!/Time Spent inFresh Water AfterAverageSpecieg/of Emergence from Time Spent Age at Weight ofsalmo~ Gravel at Sea Spawning Adults£!(Months) (Years) (Years) (Pounds)AverageEggs PerFemale(NunDer)wI-'wChinook (king)salmon 3-12 1-6 3-7 30(E)-37(L)d,e/Sockeye (red)salmon 12-36 1-4 3-6 6(L)-7(E)d/Coho (Si]qer)salmo~ 12-36 1 3-4 8 (E)-10(L)e/9,OOO(E)-12,000(L)e/3,500(L)-3,700(E)e/3,700(E)-4, 100(L )e/a/ Merrell 1970, except where noted.b/ Exceptions to these general characteristics occur frequently.c/ Weight of whole or round fish (pounds).d/ Limited spawning of this species is suspected, but unconfinned.e/ Specifically for the Kenai system (Cook Inlet Regional Planning Team 1981; and Heard1982); E = Early run, L = Late run.1916B 8/20/85
Chinook salmon enter the Kenai system in two distinct runs. The firstrun enters the river in late May, peaks in mid-June. and ends 1n earlyJuly. The second run begins in early July. peaks in late July. andends by mid-August. Radio tagging experiments conducted by the u.s.Fish and Wildlife Service (USFWS) between 1919 and 1981 indicate thatearly run fish spawn exclusively in tributaries of the Kenai, includingGrant Creek. while late run fish spawn exclusively in the main-stemKenai (Burger 1981. 1982). Fertilized eggs hatch in 2 to 3 months. andthe alevins (newly hatched fish) spend two to three weeks in the gravelbefore emerging as free-swimming fry (Morrow 1980). Juvenile chinookspend one year in fresh water before migrating to sea in late June.Adults return after two to six years at sea. An estimated 50.000chinook salmon spawn in the Kenai River drainage (Burger 1981. 1982)although this estimate has not been substantiated by ADF&G .. Chinooksalmon prefer large gravel and cobble for spawning and a spawningterritory of typically 20.1 square meters per spawning pair (Burner1951) .Sockeye salmon also arrive in the Ke.nai in two discrete runs. Thefirst run begins in mid to late May and continues through late June.The second run arrives in mid-July and continues through mid-August.Newly emerged fry migrate to <strong>lake</strong>s to rear and remain for one or twoyears before migrating seaward (U.S. Army, Corps of Engineers 1918).Sockeye salmon prefer smaller gravel than chinook, but sim11ar in sizeto coho salmon. Although site specific spawning information was notIobtained from Grant Creek, sockeye salmon in other areas have beenshown to prefer a smaller spawning territory than that of chinook(Burner 1951).Coho salmon also enter the Kenai 1n two runs: the first beginning inlate July and continuing until mid-August; the second migrating frommid-August to December. Hatching occurs in roughly 150 days when watertemperature reaches 3soF. Some fry migrate immediately to sea, butmost remain in fresh water for one or two years (U.S. Army, Corps ofEngineers 1918).3-20•.. "••...................
-..-..--•-..----..-..- --....- - - - ..-•-- - ..-..Non-anadromous rainbow trout have been planted in numerous <strong>lake</strong>s andponds in Alaska (Armstrong 1969). Rainbow spawn during late winter orearly spring when water temperatures begin to increase. A redd isprepared in fine gravels by the female before she releases from 200 to8,000 eggs, depending on her size. Redd size is about 0.2 squaremeters (Hunter 1973). Rainbow trout may spawn annually for up to fiveyears. Stream dwelling fish generally stay in the natal stream while<strong>lake</strong> resident fish may migrate into and out of the <strong>lake</strong> to neighboringstreams (Armstrong 1969).Dolly Varden spawn in October and November. The female may deposit 300to over 6,000 eggs, depending on size (Morrow 1980). The eggs developslowly in cold water, hatching in March or April. In nonanadromous(non-migratory) populations in Alaska, the young may spend severalmonths to three or four years in streams, then move to a <strong>lake</strong>.Juveniles of the anadromous race rear in streams three or four yearsbefore migrating seaward in late May. Sexual maturity is reached inthree to six years in both races, with males often maturing a yearearlier than females. Not all adults migrate into fresh water to spawnand may only enter streams to feed. Dolly Varden may spawn more thanonce, returning to their natal stream from mid-July to late September.Spawning mortality in Alaska fish varies; a small number live to spawnmore than twice; but few appear to live longer than eight years(Armstrong 1969) •Grant LakePrevious investigations (USFWS 1961) indicate that Grant Lake supportsa small population of slimy sculpin and a dense population ofthreespine stickleback. A falls at the <strong>lake</strong>'s outlet blocksimmigration of other fish species. Results of fish sampling in October1981 and March, June, and August 1982 indicate that density ofthreespine sticklebacks per minnow trap set were 10 times higher in thelower basin than the upper basin (AIEDe 1982). Sculpin were alsocaptured during these surveys, but no other fiSh species were found inGrant Lake or its tributaries.3-21
The limited water transparency and cold water of Grant Lake and itstributaries limit fish production, but its large population ofsticklebacks shows that food supplies are adequate for at least somefish species. Although stickleback compete with species like sockeyesalmon (Rodgers 1968; Rankin and Ashton 1980), they cannot out-competesockeye and rainbow trout, and even constitute a significant foodresource for fish-eating species like Dolly Varden and cutthroat(Nilsson and Northcote 1981, Rogers 1968). ADF&G has been studyingKenai drainage <strong>lake</strong>s since 1976 to locate suitable sockeye nurseryareas for juveniles produced from the Trail Lakes Hatchery (scheduledfor completion in late 1982) (Flagg 1982). In 1981 ADF&G sampled GrantLake, and preliminary data suggest that it had the second highestplankton concentration of the <strong>lake</strong>s tested. Results suggest the <strong>lake</strong>may have potential for rearing salmonid fish. In addition, sockeyesalmon in the Kenai system are known to be infected with the virusinfectious hemotopoietic necrosis (IHN) (Dudiak 1980), and this viruscould conceivably hamper some types of sockeye salmon enhancementefforts planned for Grant Lake.An experimental introduction of 620,000 coho fry is scheduled forrelease into Grant Lake in June 1983. ADF&G plans a program toevaluate the development and outmigration of stocked fish in 1983(Flagg 1982, 1983). If coho salmon survival is successful, futureplants of chinook salmon fry will be conducted (Flagg 1983). Nosockeye salmon fry will be planted in the <strong>lake</strong> in the future.At present Grant Lake does not directly provide an economicallyimportant fishery, but it has potential in the future. In order toobtain a general estimate of potential production of that fishery, amodel by Schlesinger and Regier (1982) was used to estimate annual fishproduction as maximum sustainable yield (MSY) (Table 3-8). The resultsindicate an annual fish production of approximately 3.5 kg/hectare/year(3.8 lbs/acre/year), or 2268 kg/year (4990 lbs/year) for the total<strong>lake</strong>. Assuming that total production would be one year old sockeyesalmon smolts each weighing 6.6 grams (the average size of one year oldsmolts in four Alaska <strong>lake</strong>s [Eggers 1978J), the total annual yield from3-22..-.. ....- ....- -.... ••..•.. ..•.... ....-.......•-.. ..•
•..Grant Lake would be approximately 340,000 smolts. It should be notedthat the model used does not compensate for high turbidity levels,which would reduce the estimated yield; therefore, this productionestimate is probably high.-•- •- •Grant CreekThe area used as habitat for fish is most likely concentrated in thelower half mile of the stream. The upstream half-mile is characterizedby very fast water with a gorge with few pools and is bounded at thetop by two large waterfalls.Previous investigations of Grant Creek by ADF&G (1952-1981) focused onits use by salmon for spawning. All investigators have noted that thestream's glacial turbidity and turbulence severely hamper accuratesurveying and spawner enumeration. Recorded spawner counts of chinookand sockeye salmon for the years 1952-1982 are presented in Table 3-9.Peak counts during this period averaged 19 and 61 for chinook andsockeye salmon, respectively. The numbers of adult salmon and troutreturning to spawn in Grant Creek are probably higher than the data ofTable 3-9 indicate due to the infrequency of spawning ground surveys,the poor visibility due to high turbidity, and high discharge rates,which restricted survey effectiveness. Highest stream dischargetypically occurs from June through August and is still fairly high inSeptember through November (US Geological Survey 1981). This highdischarge further hampers accurate spawner counts. Grant Creek mayalso be used for spawning by coho salmon, Dolly Varden, rainbow trout,and sculpin and is definitely used as a nursery habitat. Radio tagstudies in the Kenai system indicate that tributary spawners. bothchinook and sockeye salmon, are early run fish that arrive in the KenaiRiver between mid-May and early July (Burger 1982). Previousinvestigators have concentrated their spawner surveys on Grant Creek inmid-August and early September, indicating that a delay of one to twomonths occurs between entry into the Kenai River and the arrival ofspawners at Grant Creek.3-24..- ---•- •• ..••- •-•---•...-•-
- - - - ---..TABLE 3-9PEAK SALMON SPAWNING GROUND COUNTS FOR GRANT CREEK, 1952-1982~/Numbers of SpawnersYear Chinook Salmon Sockeye Salmon---•---•---1952 0 2501953 12 131954 6 451957 8 01959 28 01961 86 Total Sa 1 mon.Q/1962 2 2341963 33 411976 29 01977 0 41978 5 01979 42 291980 5 01981 45 191982 46£/ 135£/Average 19 61~/ Alaska Department of Fish and Game unpublished data 1952-1981.~/ Not included in averages.- - - ---•£/ AEIOC 1982.-•-•-•-..3-25
-Initial field sampling in October 1981 by AElDC (1982) found no liveadult spawning fish although 10 chinook salmon carcasses wereobserved. Chinook counts in August 1981 by ADF&G recorded the highestnumbers to that date, suggesting that most if not all spawning bychinook and sockeye is complete by October. The 1982 spawning countsby AEIDC (1982) found only 12 chinook in early August, but 46 spawnerswere observed in the third week of August when observation conditionswere excellent. No other spawning fish were observed in early August,but 135 sockeye were observed later 1n August. No adult coho wereobserved during the present study (AEIDC 1982) or have been recordedhistorically in Grant Creek. It is possible that a late spawning runmay occur in November or December; however, no counts have been madeduring those months.Locations of adult salmon observed in Grant Creek in 1982 are shown inFigure 3-3. During March 1982 low flow, gravel composition wasvisually evaluated (AEIDC 1982). Substrate material was very coarsethroughout the entire length of the creek due to the high velocitywhich tends to wash away suitable gravel. Areas that offer better thanaverage potential for sa1monid spawning are also shown in Figure 3-3.Although spawning counts do not reflect the actual number of spawners,several authors have attempted to estimate escapement number from suchcounts (Gangmark and Fulton 1952; Craddock 1958). Neilson and Geen(1981) conducted intensive surveys of spawning chinook salmon in anorth-central 8ritish Columbia stream and found that the peak count ofsalmon was 52 percent of the estimated escapement. Many variables areinvolved in making such an estimate, including time spent by salmon onthe spawning ground, visibility of the stream, and timing of counts.Taking into account Neilson and Geens' work (1981), the excellentvisibility in Grant Creek, and coincidence of peak counts in 1982 withrecorded or peak accounts in Grant Creek, the actual number of spawnersin Grant Creek was estimated to be 100 chinook and 500 sockeye, orapproximately double the maximum number of fish observed during the......- ........- ...- ...- •...•..•.....•..- ...-.........3-26•...
GORGELEGEND:::::. ~ HIGH VELOCITY RAPIDS:::::::-~---•-•- ..- - - -..-..-..----........... . .. ....."••••••••••:,::::- ISLANDS•CHINOOKSPAWNING GRAVELSSALMON SPAWNERS (INDICATESONE OR MORE INDIVIDUALS-TOTALOBSERVED = 46)SOCKEYE SALMON SPAWNERS (INDICATES ONEOR MORE INDIVIDUALS - TOTALOBSERVED = 135)•-..-3-27LOCATIONS OF SPAWNINGGRAVELS & OBSERVED ADULTSOCKEYE & CHINOOK SALMONIN GRANT CREEK 1981-1982EBASCO SERVICES INCORPORATED
-period 1952 to 1983. Present information suggests that this wouldequal approximately 250 adult chinook salmon and 1,650 adult sockeyesalmon, considering catch plus escapement.--...•-••-•-•-..-----•- ...•........- - -The USFWS (1961) periodically sampled Grant Creek using minnow trapsfrom July 1959 through January 1961. Fish captured included chinooksalmon, coho salmon, Dolly Varden, and sculpin. The results of thistrapping effort are presented in Table 3-10. The USFWS (1961) alsoreported that sport fishing pressure was light due to the turbidity andinaccessibility of the stream from the Anchorage-Seward Highway. Thisreport indicates that anglers usually caught one to five fish, mostlyDolly Varden, with occasional catches of 10 to 15 fish per trip. Theonly known creel census was conducted by ADF&G at the mouth of GrantCreek during 1964 (Table 3-11). No other reliable estimate of fishingefforts is available.Moose Pass area residents estimated that 500 to 600 angler-days offishing occur on Grant Creek each year. primarily for Dolly Varden andrainbow trout (AEIDC 1982). Residents also reported that thepopulation of Dolly Varden has dropped considerably over the years .ADF&G (McHenry 1981) indicated that actual fishing pressure is probablymuch lower than local residents estimate and is due to accessdifficulty. Grant Creek is closed to sport fishing for salmon by ADF&Gregulations. although evidence of illegal fishing was observed duringfield sampling.The results of minnow trapping and electrofishing Grant Creek by AEIDC(1982) are shown in Table 3-12. Catches of trout. salmon. and charwere generally higher in the fall and summer than in winter andspring. Dolly Varden were generally the most abundant in minnow trapsfollowed by juveniles of chinook salmon. rainbow trout. and cohosalmon. Cooler temperatures in winter and spring may have been partlyresponsible for lower catches since minnow traps are passive gear thatrequire fish to come to them and fish are generally less active at coldtemperatures. Electrofishing results (Table 3-12) found juvenile3-28
TABLE 3-10JUVENILE FISH COLLECTED BY MINNOW TRAP IN GRANT CREEKJULY 1959 THROUGH JANUARY 1961~1SQeciesChinook Coho DollyMonth Salmon Salmon VardenSculpin-•-•-•January X2.1FebruaryXMarchApril X XMay N.S.£/ N.S. N.SJune X XJuly X XAugust X X XSeptember X XOctober X XNovember X XDecember N.S. N.S N.S~I USFWS 1961.2.1 Denotes presence, -- denotes absence.£1 Not surveyed = N.S.TABLE 3-11SPORT FISH CATCH FOR GRANT CREEK AS REVEALED BY CREEL CENSUSAT THE MOUTH 1964~1No. of No. of Catch perDate Anglers Spec;es~1 Fish Effort5121/64 2 Round whitefi sh 1 0.25 per hour6/4/64 3 Ra-j nbow trout 3Dolly Varden 3 0.67 per hourRound whitefish 16/9/64 3 Rainbow trout 2 0.26 per hour~I McHenry 1981.3-29XXN.S.XXXXN.S..-....-•..•....- - ....--..- ..-..-...... ..
II II I. II I. 1'1'11 II •• I. I. I. II II I. 111M Ijb/Location-TABLE 3-12RESULTS OF MINNOW TRAPPING AND ELECTROSHOCKING EFFORTS INGRANT CREEK, OCTOBER 1981 AND MARCH, JUNE, AND AUGUST 198~c/Species-OctoberMarchMayJuneSheet 1 of 2AugustMi nnow Trapp i ngWIWo1. Near mouthDolly VardenRai nbow troutChinook salmonCoho salmon2. Mid-lower quarter mile Dolly VardenRai nbow troutChinook salmonCoho salmon3. Mid-half mile4. Mouth of canyonDolly VardenRainbow troutChinook salmonCoho salmonDolly VardenRainbow troutChinook salmon10123o1217o963722314o354o1oo1o3o1o671oo3oo152o251o11o3o4214215341362628o32o2d/Total Catch-Dolly Va rdenRai nbow troutChinook salmonCoho salmon222371213649102o2434211373411Trap HoursCatch Per hourDo lly Va rdenRainbow troutChinook salmonCoho salmon800.280.290.890.033060.010.010.020.011620.060.060.01o1080.220.030.040.021260.900.060.270.09
TABLE 3-12 (Continued)Sheet 2 of 2.b/Locati on-c/Species-OctoberMarchMayJuneAugustElectroshocki ngFrom first bend upstream toU.S.G.S. gaging stationDolly VardenRai nbow troutChinook salmonCoho salmon315218116o22!!!/7!!./79!!J11 eja/ AEIDC 1982.b/ Minnow traps fished between the <strong>lake</strong> outlet and the falls caught no fish.c/ All species but coho salmon, which were collected only in quiet pools or eddies, were collected inall stream sections having suitable habitat. Sculpins were also occasionally captured.d/ Twenty additional Dolly Varden (20 to 30 cm) three rainbow trout (20 to 30 cm), and twow chinook salmon (70 and 81 mm) were taken by angling in Grant Creek.~ e/ Taken while performing the block and removal method (Zippin 1958). Most of the chinook caught wereyoung-of-the-year less than 45 mm in length that appeared to have been stimulated out of the gravelfrom shocking activities.I I I I I , I I II I I I I .1 I... 'II I I • I • , • I I I. I I I.
-....-..---..chinook salmon to be the most abundant. Comparison of relativeabundance between seasons can not be made, however, because intensityof sampling was different during the three e1ectrofishing sampleperiods.-- - ..-..-..-..---- - - - ..-..-..-..-..-- -Dolly Varden were generally more abundant near the mouth of Grant Creekexcept during peak abundance in August when distribution was fairlyuniform (Table 3-12). They were distributed in a wide variety ofhabitats. including shallows, slow water. deep pools, stream margins insections with high velocities, mid-channel in areas where largeboulders or debris protected them from high velocities. and intemporary backwaters and side channels during high flows. A variety ofsize classes were captured ranging from 55 mm to 30 cm (2.2 to 11.8in). As stated before. no spawning Dolly Varden have been observed inGrant Creek; therefore it is possible that the high abundance of fish,particularly in August. may be from fish moving into the stream fromTrail Lakes to feed and avoid the high turbidity. Although the lack ofsmall fish less than 70 mm (2.75 in) in minnow traps in May and Junesuggests that spawning does not occur in Grant Creek. small chinook orsockeye. which do spawn there, were also not captured by minnowtrapping. It is therefore possible that Dolly Varden had not emergedfrom the gravel at the time of sampling.Chinook juveniles were observed most often in the lower half of thesampling area of Grant Creek. but during the period of highestabundance (October 1981) were distributed throughout the samplingarea. The large size of fish caught by minnow trap 1n March, May, andJune [greater than 65 mm (2.6 in)] suggests they would probably smo1tin June. Captured fish ranged in size from 56 to 96 mm (2.2 to 3.8 in)in length. The catch of chinook salmon juveniles was second to DollyVarden in minnow traps (Table 3-12). Although the fish are present allyear. the low number of juveniles captured in March. May. and Junesuggests they are either very inactive during these months or they haveleft the system to rear elsewhere prior to downstream migration.possibly overwintering in the river or Kenai Lake. Rearing in theTrail Lakes is believed unlikely because of the high turbidity of the<strong>lake</strong>s (Dudiak 1980).3-32
It was apparent during the winter 1982 investigations that chinooksalmon collected by electroshocker were primarily utilizing habitat inthe interstitial spaces of the large and medium size cobble substrate(AEIDC 1982). Juveniles caught in October. 1981 generally exhibited apreference for habitat possessing moderate velocity (1 to 2 ft persecond). such as the margin of the main channel. Chinook also werepresent in areas of generally high velocity. but where large substrateor organic debris provided cover and protection from high velocities.Natural emergence of chinook salmon may be later than June because noyoung of the year were captured in minnow traps until August. Young ofthe year. however. were captured in May during e1ectrofishing but theseappeared to have been stimulated out of the gravel from the shockingactivities. It is possible that juvenile chinook were present but werenot being caught by minnow traps. Bloom (1916) caught almost nojuvenile coho less than about 50 mm (2 in) in length in the minnowtraps even though that size fish was highly abundant in the stream.Exclusive of two fish captured in October. coho salmon were alwayspresent in the lower two sampling areas of the stream but weregenerally low ;n abundance (Table 3-12). Coho juveniles were lessabundant than chinook salmon juveniles and did not utilize as wide arange of habitat as juvenile chinooks. They showed a preference forshallow water with little or no velocity and an abundance of detritalcover. This type of habitat was generally found only in the deep poolsand backwater areas ;n the lower sampling areas except at very lowflow. The extremely small size. (40 mm) (1.6 in) of several of the cohojuveniles trapped in August 1982 strongly suggests that cohos spawn inGrant Creek. These small fish generally do not venture far from theirnatal areas. and the stretch of rapid water near the mouth of GrantCreek would pose a major impedance to the immigration of such smallfish. These data would indicate that coho juveniles utilize GrantCreek for rearing but are present ;n small numbers. Older, largejuvenile cohos may be recruited to Grant Creek from the turbid watersof Trail Lake during the late summer and fall. Coho captured rangedfrom 42 to 106 mm (1.6 to 4.2 in) ;n length during the study.3-33--..- .. ....-.. ....- • ......•••..- --..- -.'..-..- ..
- - --•-..-•-.......- - .....---- - ..-- ............- --Rainbowtrout appear to be evenly distributed in Grant Creek and arefound ;n most habitat types. Rainbow captured during the study rangedfrom 43 to 10& mm in length (1.7 - 4.2 in). Highest abundance.including many small young-of-the-year of 45-50 mm length (1.8 - 2 in),occurred in October. which suggests that spring spawning of rainbow mayoccur in Grant Creek. like other salmonid young-of-the-year. many ofthese rainbow may move upstream from the Trail <strong>lake</strong>s area to rear andthey are generally inactive in the winter months. Both grayling. whichwere caught during October angling surveys. and whitefish have beenreported in Grant Creek, but they are not believed to spawn there.Because Project field studies were designed to index relativepopulation size rather than estimate the stream's annual sport fishproduction. estimates of annual production in Grant Creek were derivedfrom studies of other trout streams. The Grant Creek field data wasused as one measure of the reasonableness of the production estimate.Estimates for cold-water Pacific Northwest streams. all of whichpossessed mixed populations of salmon, trout. and other species. wereused because no such estimates are available for Alaska. Theseestimates may be expected to overestimate Grant Creek's trout and charproduction because conditions in more southern streams (e.g., higherwater temperature and total dissolved solids or nutrients) are moreconducive to fish growth. Estimates used are shown in Table 3-13.Trout production for these streams averaged 3.5 grams per m 2 peryear. Assuming that Grant Creek averages 25 ft (8 m) in width and has0.5 mile (805 m) suitable for rearing. the rearing area would beapproximately &.134 m 2 . This would equate to 21.725 grams of trout,which in terms of an 8 in (104 gram) trout. would equal 209 trout.This represents the number produced each year rather than the numberexisting at any point in time (i.e., the standing stock) and assumesthat large trout that are harvested, die. or leave the creek arereplaced by other trout that contribute to the stream's production .3-34
,... ..TABLE 3-13ESTIMATES OF TROUT PRODUCTIONFROM SOME NORTHWEST STREAMS.... .... ....SpeciesAnnual fishproduction, gramsof fish/m 2 /yearStreamReference-..- ..Cutthroat troutSteel head troutRainbow trout"Salmonids"41.54.3, 5.5, 2.4(different years)4.6Deer Creek,OregonDeer Creek,OregonBig SpringsCreek. IdahoNorthernCa 1 iforniaChapman(1965)Chapman(1965)Bjornn(1978)Burns( 1971).... ..•.... .... •.. .... ..- -..3-35- --..- ...... ..
---- - --•- •- •------ - - - --•--•- •- --..3.1.2 Potential Impacts3.1.2.1 Construction ImpactsSome minor temporary impacts to the aquatic resources of the study areamay occur from construction activities. The magnitude and longevity ofthe impacts will depend on the specific construction activity. and thetime of the year in which it occurs.Lower Trail LakeIncreased fine sediment runoff from access road, powerhouse, andpenstock construction may temporarily impact Lower Trail Lake. Effectswould be expected to be slight because Lower Trail Lake is alreadyglacially turbid, so slight additions of sediment probably would notsignificantly alter ambient levels. Although fine sediment can affectsurvival and drift of benthic invertebrates that serve as food forsalmon, trout, and char in these systems. it is expected that minimalsediment should enter these systems from Project construction and thequantity entering the system would be flushed away with high water flowin the summer.Grant LakeDeepening of the sill between the upper and lower basins of Grant Lakewill not affect any important aquatic resources as none are present.This construction activity will occur in the winter using explosivecharges to blast the rock bottom. These explosives may causemortalities of sculpin and stickleback from shock waves. For the samereason. some mortalities may occur if ADF&G proceeds with its plans tostock Grant Lake with salmon beginning in the spring of 1983 (seeSection 3.1.3 for details).Toxic materials associated with construction activities, such aspetroleum products, cement, and wastewater are not expected to enterthe Trail Lakes and Grant Lake under anticipated circumstances.3-36
3.1.2.2 Operation ImpactsProject impacts on aquatic resources of the study area are summarizedby Project alternative and water body in the following sections...-..- •- ..- --..Grant LakePresently there are no economically important aquatic resources inGrant Lake, and minimal impact should occur to any potential aquaticresources in Grant Lake from the Project. It is anticipated that thelittoral zone will experience a reduction in species diversity due tothe increased drawdown, resulting in some loss of macrophytes anddesiccation of benthic organisms. Often the loss of diversity isaugmented by an increase in abundance of organisms, typicallychironomids and oligochaetes (Hildebrand 1980), but abundance in thelittoral zone should still be below pre-Project levels (Geen 1914).Chironomids and oligochaetes are more successful in reservoirs becausethey are able to survive well in medium and fine sediment environments,typical of reservoirs, and to avoid desiccation by burrowing(Hildebrand 1980). Because of the relatively small littoral area inGrant Lake, reduced littoral productivity should be minor compared tototal production of the <strong>lake</strong> (Hildebrand 1980).Plankton production and water chemistry typically change very littlewhen <strong>lake</strong>s are used as reservoirs (Geen 1914). A flushing rateincrease can have an adverse effect on plankton if it occurs duringplankton blooms (Vernon 1958), but significant loss of phytoplanktonusually only occurs at high flushing rates (Welch 1980, Hildebrand1980). Grant Lake has a fairly slow flushing rate (once every 612days), and even with drawdown to 660 ft, flushing will still occur onlyonce every 518 days.- ..- •....•-....- ..- ..- --..During studies of Grant Lake in 1982, the highest phytoplankton densityoccurred during a high runoff period (August). The operational planfor the Project calls for reduced discharge during this period which3-31- ..- ..-
- ..-......-•....- •- - ..-..-..-..-..- • ..- •..•....-could have a positive effect on primary production. Increasedturbidity could also adversely affect primary production. It would beexpected that minor turbidity increases may occur from the firstdrawdown period as the fine littoral sediments are resuspended. Sincethe littoral zone is so limited in Grant Lake, the impact of sedimentwould be expected to be minor and would reequi1ibrate after severaldrawdown periods (Hildebrand 1980).Deepening the sill between the two basins of Grant Lake should notsignificantly impact primary production in the lower basin. Suspendedsolids do not appear to stratify with depth and subsequent drawdown ofthe <strong>lake</strong> level will reduce the amount of turbid water inflow into thelower basin to at or below pre-Project levels (see Section 2.0).Food supply for any salmonids planted into Grant Lake should not beaffected because zooplankton, the main food source, will probably notbe adversely affected. Increased flushing rate has been found toreduce zooplankton abundance, but probably only in rapidly flushedreservoirs (flushing time of weeks or months) (Hildebrand 1980).Although some adverse effects may result from a potential loss oflittoral benthic food organisms, these items are most often a smallportion of the diet of <strong>lake</strong> or reservoir dwelling fish like sockeye orcoho salmon juveniles (Crone 1981; Rodgers 1968; Hamilton et al.1966). Sculpins, which depend mainly on benthic organisms, may bereduced in number due to impacts to littoral benthos. It is alsopossible that sculpin may predate juvenile salmonids planted in the<strong>lake</strong>.Temperature regimens in Grant Lake should not change significantly, sono adverse temperature effects on fish should occur (see Section 2.0) .Duthie (1979) examined two former <strong>lake</strong>s converted to reservoirs insubarctic Canada and found no change in temperature regimens. However,there may be a slight increase in epilimnion temperature during July,August, and September during operation. This may occur because wateris being withdrawn from a depth of 43-48 ft, removing cooler water fromthe reservoir and leaving warmer surface water .3-38
Once juvenile salmon are planted in Grant Lake. impacts could occurwhen the fish attempt to migrate to sea as smolts. If no fish passageor bypass facilites are installed, fish passing through the turbinecould suffer significant mortality. A Francis type turbine will beused for the Project. Mortalities from this type of turbine are mostoften from mechanical effects. It is not known what those mortalitieswill be from the present design, but most studies on Francis turbineshave found juvenile mortalities in excess of 20 percent. These studieswere conducted on larger turbines (Turbak et al. 1980). No informationis available on fish mortalities resulting from fish passage throughthe small turbines and very little recent information has beendeveloped on any turbines since 1969 (Turbak et al. 1980). Toalleviate this potetial impact. a bypass facility will be used (seeSection 3.1.3) to prevent passage of smo1ts through the turbine.It is not known if downstream migrating smolts will have difficultyfinding the <strong>lake</strong> exit during spring outmigration. During May and Junethe intake depth will be a relatively shallow 6-26 ft. but by July thedepth will be about 43 ft. Studies in Washington and Oregon found thatsalmonid smo1ts preferred the upper 15 ft of the water column duringspring (Korn and Smith 1971). However, sockeye salmon can makesubstantial vertical migrations and go well below 67 ft during certaintimes of the year (Eggers 1978. Goodlad, et al. 1974). Studies at damson the Elwha River in Washington have shown that chinook salmonoutmi<strong>grant</strong>s will enter a tunnel outlet at a depth of 65 ft (Schoenemanand Junge 1954). At Baker Lake Dam in Washington sockeye smoltsentered a tunnel at a depth of 85 to 107 ft; however. they preferred asurface outmigration over a spillway if available (Andrew, et al.1955). The range of depth distribution of fish in <strong>lake</strong>s varies. Insome <strong>lake</strong>s presmolt sockeye have been found from surface to bottom(Cu1tus Lake, B.C.), but in another. only in the upper 39 ft (ShuswapLake, B.C.) (Goodlad et al. 1974). Whether smolts will emigratenaturally from Grant Lake cannot be predicted. Because the intake isrelatively shallow (6 to 26 ft) during the expected smolt emigration3-39..-..-..- ..- ..- ..- ..- • ..••..•.... ....- •....- ...r..-..- .. ..
.....••--..'. ....-..-..-..-..-..-..-....- ,.-..- ......-period of May - June and salmon smolts elsewhere use submarine outlets,';t is believed that they will find and use Grant <strong>lake</strong>'s submergeduut 1 et.Grant CreekBecause Grant Creek will be dewatered except for minimal periods duringoverspills, essentially all aquatic resources presently in Grant Creekwill be displaced or lost. Most spawning chinook and sockeye salmon orother fish that return to Grant Creek to spawn should instead return tothe proposed tailrace (Johannesson 1982, Krema and Farr 1974) but maybe unable to successfully spawn in that area. Under adverse natalstream conditions some salmon have been found to wander to otherstreams and spawn (Whitman et al. 1980, Sumner and Smith 1940).However, the fate of straying salmon cannot be predicted for GrantCreek stocks. Juvenile chinook and coho salmon, rainbow trout, andDolly Varden that utilize Grant Creek may be lost entirely or displacedto other areas, possibly the powerhouse tailrace or the Trail <strong>lake</strong>s .Some habitat may still remain from surface and groundwater infiltrationbelow Grant <strong>lake</strong>, but the extent is expected to be minimal. Therefore,as a conservative assumption, the entire fish population of Grant Creekwas assumed to be lost.All aquatic habitat suitable for fish ;s assumed to be lost bydewatering the creek. The dewatering of Grant Creek will cause anannual loss of an estimated 100 chinook and 500 sockeye spawnerscorresponding to approximately 250 and 1,650 adult chinook and sockeyesalmon, respectively. Habitat for trout (rainbow trout and DollyVarden char), some of which are migratory, will be eliminated,resulting in the loss of approximately 209 8-in fish. Dewatering GrantCreek will result in lost sport fishing opportunities. The exactamount of fishing pressure is not known, but is estimated to be lessthan 500 angler days per year.3-40
Although no sport fish inhabit Grant Lake the Alaska Department of Fishand Game intends to stock coho salmon fry into the <strong>lake</strong> in 1983 todetermine its potential for rearing. Without a bypass device, thesefish could suffer substantial mechanical injury and mortality bypassing thro~gh the Francis turbine on their seaward migration assmo1ts (Turbak et a1. 1980). There is the possibility that they alsomay be entrained and lost before they are ready to migrate or be unableto find the <strong>lake</strong> exit and residua1ize after the Project is operational...--......- - - - - -•- ..3.1.3 Mitigation of Impactslhe Alaska Power Authority has a policy that their <strong>project</strong>s cause "nonet losses" to fisheries resources. Significant Project impacts willbe mitigated in the manner tha.t is best biologically and economically.Fishery elements expected to incur significant impact withoutmitigation are summarized below.3.1.3.1 Mitigation ProcessDevelopment of the fish mitigation plan involved many telephoneconversations and visits with agency personnel. but the major planningprocess occurred during discussion of three fish mitigation "PlanningDocuments" during four meetings with personnel principally from thefollowing agencies: Alaska Department of Fish and Game, U.S. Fish andWildlife Service, National Marine Fisheries Service, Forest Service.and Cook Inlet Aquaculture Association. Agency contacts are chronicledin Section 3.4. These documents and minutes of each meeting arepresented in chronological order in the Technical Appendix, Part X, andare summarized below.Planning Document No.1Published July 2, 1982, this document examined the effect on Projecteconomics of providing various streamflows in Grant Creek to sustainits salmon runs. Also examined were the <strong>feasibility</strong> of several..•- -•....- .....-..-..----..3-41
- - - -•artificial propagation options for mitigating fish impacts on GrantCreek and approaches to providing safe egress of salmon smolts fromGrant Lake. This document was discussed at a July 9, 1982 meeting withfisheries agencies.-•..•--------•----•..•--..•-•..- - -Tennant I S (1976) "Montana method" was used to scope streamflowsproviding various levels of fish protection. This document alsoexplained how raising the reservoir height would have little effect onthe amount of water available for fish migration over what would bepassed through the turbine. Estimated costs of eight levels ofinstream flow were shown to increase overall costs of power from theProject from 9.5 to 108 percent. The alternative of moving thepowerhouse to an area in Grant Creek above the most usable fisherieshabitat was <strong>project</strong>ed to increase Project cost by 33-34 percent.Several alternatives for mitigating impacts to salmon were considered,assuming Grant Creek would be dewatered (e.g., spawning channel, eggincubation boxes, hatchery rearing of fry, hatchery rearing of smolts,and other stream improvements). Methods of passing salmon smoltssafely out of Grant Lake were extensively discussed (e.g., minimumstreamflow in Grant Creek, screening of intakes, and artificialattraction flow). Estimated cost was determined for several of themitigation measures presented.During discussion of Planning Document 1 (see minutes of July 9meeting, Technical Appendix, Part X), there were several commentsraised by agency personnel that led to development of a second fishmitigation planning document. The National Marine fisheries Service(NMfS) did not want minimum streamflow dismissed until all mitigationmeasures were evaluated and wanted consideration of a minimumstreamflow of 15 cfs. The Forest Service said the decision makers needa full evaluation of alternatives in the <strong>feasibility</strong> report soeffectiveness and cost could be properly assessed. Agencyrepresentatives recommended prioritization of all alternatives in theevaluation. Also, the ADF&G representative mentioned that the Alaska3-42
Power Authority (APA or Power Authority) should consult with ADF&G'sFisheries Research, Enhancement, and Development Division (F.R.E.D.) aswell as with the Cook Inlet Aquaculture Association to learn theirpreference concerning off-site mitigation.Concern over fish being entrained by the intake to the turbine in GrantLake was expressed by NMFS and ADF&G, although APA and AEIDC staff feltthe fish would not leave the <strong>lake</strong> unless carrying capacity wasexceeded. At the end of the meeting it was agreed to address agencyconcerns in a second planning document and meeting.fl~nningDocument No.2Planning Document No. 2 for fisheries mitigation was presentedAugust 11, 1982 in a second meeting attended by 18 people. Thisdocument mainly dealt with fish mitigation measures other than aminimum streamflow in Grant Creek (see Technical Appendix, Part X).The level of mitigation set for the Project was 200 chinook and 500sockeye which was based on the salmon spawning ground survey resultsfrom 1952 to 1980 and in accord with the Power Authority's policy of nonet loss to fisheries resources. The Cook Inlet AquacultureAssociation recommended that fish mitigation measures for the Projectbe restricted to the Kenai River system. This document dealt mainlywith conceptual engineering and biological assessments of mitigation<strong>feasibility</strong> and less on costs, as costs could only be approximatelyestimated at this stage of planning. Maintenance of 15 cfs flow inGrant Creek would increase Project cost by about 10 percent, which wasconsidered by the Power Authority to be the maximum incrementeconomically feasible. However. this mitigation option was notconsidered feasible biologically because of a low probability that itcould sustain existing fish stocks. Several mitigation options weredismissed because they were regarded as either too expensive,impractical biologically. or inferior to other options. Discussion waslimited to egg incubation boxes, spawning channels, <strong>lake</strong> fertilizationand monetary replacement as alternatives for fish mitigation for GrantCreek.3-43-..•..•- ..- .. ..- •.... •..•..lIP•-....- ...... ........- ..-..-
----•- •--•- • ..•-•- •- •- - -•- •-•..•- • ..- - -It was mentioned that because the ability of Grant <strong>lake</strong> to rear salmonfry has yet to be determined, final development of a method providingsafe egress of smolts would have to await the results of the fryplantings. ADF&G indicated it plans to stock Grant <strong>lake</strong> with salmonfry in spring 1983 and to evaluate their survival and condition uponseaward migration as smolts in spring 1984. The document suggestedthat the best method for fish passage would consist of installinglouvers or passive screens in the power tunnel and diverting fish intoa bypass pipe that would carry about 11 cfs and discharge within thetailrace. A fish collection barge or "gulper" was also considered forcapturing smolts instead of the bypass pipe, but was judged lessdesirable because of cost and lower probability of collecting a highpercentage of smolts.During the August 17, 1982 meeting, many Questions and statements werepresented by agency personnel. There was much discussion on the valueof Grant Creek for rearing chinook. Concern over low water temperatureat the tailrace having adverse effects on fish rearing at this locationwas also expressed. Subnormal water temperatures would delay hatchingand emergence and may even prove lethal. The Power Authority stated itwas monitoring <strong>lake</strong> temperatures through September to enhance the database for this parameter. Use of an existing Trail <strong>lake</strong>s Hatcherymodule for rearing Grant <strong>lake</strong> stock was suggested. ADF&G agreed toconsider this option and determine its compatibility with Departmentobjectives. ADF&G suggested that a smolt rearing pond be considered.Many other mitigation options were suggested by ADF&G, including use ofegg incubation boxes, rearing ponds, and use of Trail <strong>lake</strong>s Hatcheryand Grant <strong>lake</strong> for rearing.It was agreed that the next fish mitigation planning document (No.3)would cost all alternatives in comparable units. The USFWS asked thePower Authority to consider the total potential of Grant Creek salmonproduction (i.e., potential number of salmon spawners that could useGrant Creek). USFWS suggested that a cost-benefit ratio be developedfor the Project. The City of Seward representative advocateddeveloping improved fish habitat as mitigation.3-44
Discussion then focused on providing safe egress of salmon smolts fromGrant <strong>lake</strong> and post-operational monitoring of the efficacy of the fishmitigation. It was stated that either the passive screen or "gulper"appeared best for passing smolts around the turbine. ADF&G said it hadrequested state money to study the success of salmon stocking in GrantCreek, a study planned independent of the Grant <strong>lake</strong> HydroelectricProject). ADF&G suggested that it and the Power Authority meet againafter ADF&G had sufficient time to study the fish mitigation optionsthat had been discussed to determine which ones it preferred.Further discussion of fish mitigation concerned minimum streamflows inGrant Creek. The USFWS opposed the abandonment of instream flow as amitigation option. The agency felt more habitat information was neededand asked if IFIM (Instream Flow Incremental Method) studies providedata on rearing potential. The Power Authority questioned whether thiswas needed, given the wide disparity between economically feasible flow(less than 15 cfs) and that suggested as good habitat using Tennant's(1916) method (42 cfs). It was stated that an IFIM would provideuseful habitat information (depth. velocity, substrate), but likelywould not materially reduce the estimate of how much flow would beneeded in Grant Creek to sustain its existing fish stocks.September 15. 1982 MeetingA meeting was held between APA and ADF&G on September 15, 1982 todiscuss the mitigation options favored by ADF&G and to obtain ADF&Gestimates on cost of rearing fish in a module at the Trail <strong>lake</strong>sHatchery. The principal options discussed included use of one of theexisting hatchery modules at the Trail <strong>lake</strong>s Hatchery, adding a moduleto the hatchery, building a mini-hatchery at the Project tailrace, orinstalling egg boxes at the tailrace. It was agreed that an adultholding facility would be needed for any option. It was decided thatit was important to determine the thermal regime of the Grant <strong>lake</strong>reservoir as this would likely affect the survival and growth of fish.The cost of rearing salmon smolts was presented by loren Flagg of3-45..- - ..- ..- ....- ••••••....- ...,..- ..•.,..- •..
--- -•- •- •-•- •-•- - - - ---••....- •- •- •- -ADF&G. More cost and engineering information for hatchery rearingjuveniles was requested of ADF&G by the Power Authority. It wassuggested by ADF&G that Grant <strong>lake</strong> may be stocked with rainbow trout tomitigate for the lost sport fishery in Grant Creek. ADF&G indicatedits plans to plant sockeye from Quartz Creek into Grant <strong>lake</strong>. It wasstated by the APA that this would rule out any special mitigation forthe Grant Creek sockeye salmon stock because intermingling of Grant andQuartz Creek sockeye would destroy the genetic uniqueness of the formerstock. ADF&G indicated it did not consider the stock unique.ADF&G indicated it was prepared to commit one of the four fishproduction modules at the Trail <strong>lake</strong>s Hatchery for rearing Grant Creekchinook. This commitment would last 10 years. the time the Departmentestimated it would take to build the Grant Creek chinook run to thepoint where it equalled the fish production capacity of the module.The Department also suggested that APA consider building amini-hatchery at the tailrace. Problems with putting a hatchery at thepowerhouse were mentioned by APA in that it would be a remoteunattended site. The Power Authority thought it would be better tobuild a new facility (i.e.• module) at Trail <strong>lake</strong>s Hatchery. ADF&Gsaid there was room at the hatchery for adding more modules. Moreinformation was requested by USFWS on rearing salmon juveniles in GrantCreek after incubation of eggs at Trail <strong>lake</strong>s Hatchery. ADF&G was moreconfident in hatchery rearing than in egg boxes as a mitigationoption. Courses of action were discussed should the fish mitigationoptions implemented fail to achieve their desired objectives. ThePower Authority agreed that it would meet again with the agencies todefine a new strategy for correcting any deficiencies.Planning Document No.3Planning Document No. 3 was presented at a meeting on November 10,1982. It considered the biological, engineering, and cost <strong>feasibility</strong>of 22 mitigation options. Nine options considered various flow regimesfor Grant Creek, 11 addressed juvenile salmon rearing and adult3-46
spawning, and two discussed methods providing safe egress of fish fromGrant Lake. These options were all priced in equivalent units for easycomparison.....- -•- --- -,.This document summarized all major agency discussions from the previousthree meetings and telephone and personal communications. The fiveoptions that APA believed most feasible economically and biologicallywere:Option 13Chinook salmon fry reared in an existing Trail LakesHatchery module and planted into Grant Lake,Option 17Option 10Option 18Option 20Chinook salmon fry reared in new module at Trail LakesHatchery and planted into Grant Lake,Chinook salmon fry reared to smolts at existing Trail LakesHatchery module and planted from imprinting pond at Projecttailrace,Chinook salmon fry produced in egg incubation boxes andplanted into Grant Lake, andSpawning channel.All options included the passive screen smolt bypass, which wasbelived to be superior to the fish collection barge in providing safeegress of salmon smolts from Grant Lake.•,.••II•ill.. ..,...•- ..- ..- ----- ..ADF&G reiterated its main concerns at the meeting (see minutes inTechnical Appendix. Part X). They favor mitigation for 1) losses ofphysical habitat in Grant Creek and some in Grant Lake, 2) losses tocommercial and sport fishing opportunities, and 3) losses of potentialenhancement value. They were concerned about low water temperatureaffecting Grant Lake's rearing potential. They want a rainbow troutfishery and boat access in Grant Lake. This sport fishery can be3-47
.............................................maintained either by planting fry or catchable size rainbow trout .The latter is favored should fry plants experience poor survival.Lost sport fishing opportunities could be mitigated by planting fishin other <strong>lake</strong>s should competition with sockeye or other speciesoccur. ADF&G did not think chinook plants would do well in Grant Lakebecause of insufficient food in the littoral zone. They also want tomaintain the genetic integrity of Grant Creek chinook. The PowerAuthority expressed concern about trout preying on salmon in GrantLake, which would hamper interpretation of pre- and post-operationalassessments of the <strong>lake</strong>'s smo1t production. At the end of the meetingADF&G supported the following actions on the assumption that GrantLake was unsuitable for salmon rearing:oooproducing smolts in the Trail Lakes Hatchery (existing module)planting Grant Lake or another <strong>lake</strong> with catchable size fishto mitigate for lost sport fishing opportunitiesplanting another <strong>lake</strong> with sockeye fryIf it was suitable for salmon rearing then they would support:oooproducing chinook from an existing Trail Lakes Hatcherymodule and planting them in Grant Lakeplanting Grant Lake or another <strong>lake</strong> with rainbow trout fryplanting Grant Lake with sockeye fryo providing safe egress for salmon smolts from Grant Lake .The USFWS indicated that it opposes off-site mitigation if enhancementis already occurring there. The USFWS reiterated its concern that thefish mitigation plan incorporate a plan for monitoring the efficacy of3-48
...the coastal forest are western hemlock!/ and Sitka spruce. Mountainhemlock often takes the place of western hemlock, and white spruceoften replaces Sitka spruce as major components of this forest type onthe Kenai Peninsula. White spruce/Sitka spruce hybrids are found onthe Kenai Peninsula (Viereck and Little 1972). Common understoryplants include Sitka alder, rusty menziesia, various blueberries, andhighbush cranberry. Areas of poor drainage often support open bogs,typically vegetated with low shrubs, mosses, and sedges (Viereck andLittle 1972). Timberline on the Kenai Peninsula is generally at 1,000to 1,500 ft (Ruth and Harris 1979).Grant Lake lies in a valley with steep, avalanche-prone slopes. Themountain tops are essentially barren of plant life and have numerouspermanent snowfields. Barren areas are common above and neartimberline in the form of talus slopes, cliffs, rock outcrops, anddrainage areas. Alpine vegetation areas are restricted and ofteninterspersed with barren areas. The subalpine mosaic of alderthickets and grass/forb meadows is by far the most dominant vegetationpattern in the Grant Lake basin and in the Falls Creek drainage. TheGrant Lake inlet stream valley supports a mature balsam poplar standon the deltas and conifer stands further up the valley. Coniferstands occur in some avalanche-free sites around the <strong>lake</strong>. The areabetween Grant Lake and the Trail Lakes 1s forested with conifers andmixed conifer/broadleaf stands which are broken by several ponds andnumerous bogs.High snowfall and frequent avalanche activity are important forcesgoverning the distribution of plant communities in the Projectvicinity. Tall stiff-stemmed plants, such as trees, are usuallyabsent from avalanche chutes because they are regularly broken off bythe force of an avalanche. Shorter, relatively flexible plants, suchas alder and grasses, are not as easily damaged and are often pioneerspecies in revegetation of highly disturbed sites.A/ A species list appears in Table 3-14.3-51...........................................
-..- ..-..TABLE 3-14....Scientific Name~1....LichensCladonia spp .Stereocaulon spp ...ClubmossescomplanatumHorsetailsEquisetum arvenseFernsAthyrium filix-feminaWoodsia ilvensisGYnmocarpium dryopter;sConiferous Treespicea sitchensisf. glaucaP. marianaTsuga heterophylla1:. mertensianaGrasses and AlliesCalamagrostis canadensisTrisetum spicatumFestuca altaica.L.. rubraEriophorum ~Rhynchospora albaCarex microchaetaL rhynchophysaLuzula walenbergii subsp. piperiLily FamilyVeratrum virideAllium schoenoprasumFritillaria camschatcensisStreptopus amplexifoliusII AEIDC 1982 .- ..3-52..-..•-•- •---..-•- ....•-....•....L~copodiumPLANT SPECIES IDENTIFIED FROM THE GRANT LAKE STUDY AREAIICr~ograma crispa~I Botanical nomenculature follows Hulten (1968).Common Namecreeping jennyhorsetailparsley fernladyfernSitka sprucewhite spruceblack sprucewestern hemlockmountain hemlockbluejointspike trisetumtufted fescuecottongrasswhite beak rushfinely-awned sedgewood rushSheet 1 of 4fa 1 se he 11 eborewild chivechocolate 1 ilyclaspleaf twistedstalk
•- •-•TABLE 3-14 (Continued)Sc ; en t if ; c NamePoplars and WillowsPopulus balsamiferaSalix arcticaS. stoloniferaS. barclayih alaxensish pulchrah sitchensisBirches and AldersBetula nanaAlnus crispa subsp. sinuataNettle FamilyUrt ica grac 11 isBuckwheat FamilyOxyria digynaWater-Lily FamilyNuphar polysepalumButtercup FamilyA~onitum delphinifoliumAnemone richardson;;Ranunculus trichophyllus var. tr;chophyllusR. macouniiThalictrum sparsiflorumSundewsDrosera angelica~ rotundifol iaStonecropsSedum roseumSaxifrage FamilyBoykinia richardsoniiParnassia pglustrisSaxifraga tricuspidatah punctata sub~ pacificaTiarella trifoliataCurrantsRibes glandulosum~ laxiflorum~ triste3-53 .Common Namebalsam poplararctic willowovalleaf willowbarclay wi 11 owfeltleaf wi 11 owd;amondleaf willowSitka willowdwarf bi rchSitka alderslim nettlemountain sorrelyellow pond lilymonkshoodwhite water crowfootfewflower meadowruesundewroundleaf sundewroserootSheet 2 of 4Alaska boykinianorthern grass of Parnassusthreebristle saxifragelaceflowerskunk curranttrailing black currantAmerican red currant..•..-..- • ..••••..•--..-..•• ..
-..-- -•--•- •- •-..- -•---•- •-•- •-•- •- •-Scientific NameRose FamilyAmelanchier alnifoliaAruncus sylvesterLuetkea pectinataPotentilla fruticosaRosa acicularisRubus pedatusR..._ chamaemorusR. ideaeusR. spectabilisSangu;sorba stipulataSorbus sitchensisSpiraea beauverdianaLegume FamilyLupinus nootkatensisGerani urn FamilyGeranium erianthumViolet FamilyViola epipsila subsp. repensEvening Primrose FamilyEpilobium angustifoliumh 1 a t if 0 1 i urnGinseng FamilyEchinopanax horridumParsley Fami lyHeracleum lanatumDogwood FamilyCornus canadensisHeath FamilyAndromeda polifoliaArctostaphylos alpina& uva-ursiCassiope stellerianaEmpetrum nigrumLedum palustre subsp. decumbensMenziesia ferrugineaMoneses unifloraOxycoccus microcarpusPhyllodoce aleuticaVaccinium caespitosumTABLE 3-14 (Continued)3-54Common NameSheet 3 of 4serviceberrygoatsbeardlutkeashrubby cinquefoilprickly rosestrawberry-leaf blackberrycloudberryred raspberrysalmonberryburnetSitka mountain ashAlaska spireanootka lupinecranesbi 11marsh violetfireweedriver beautydevil IS clubcowparsnipbunchberrydwarf bogrosemaryalpine bearberrybearberryAlaska moss heathcrowberryLabrador tearusty menziesiasingle delightSomall cranberryAleutian mountain heatherdwarf blueberry
Scientific NameV. ova 1 if 0 1 i umV. uliginosum'L. vitis-idaeaTABLE 3-14 (Continued)Primrose Famil yPrimula cuneifolia subsp. saxifragifoliaTrientalis europaeaGentian FamilyGentiana glaucaLomatogonium rotatumBuckbean FamilyMenyanthes trifoliataPhlox FamilyPolemonium pucherrimumBorage FamilyMyosotis alpestris subsp. asiaticaFigwort FamilyPedicularis verticulataVeronica wormskjoldiiMadder FamilyGalium borealeHoneysuckle FamilyLinnaea borealisSambucus racemosaViburnum eduleHarebell FamilyCampanula rotundifoliaComposite FamilyAchillea millefoliumArn;ca frigidaArtemisia tiles;; subs~ elatorA._ arct icaHieracium tristePetasites hyperboreusTaraxacum alaskanum3-55Common Nameearly blueberrybog blueberrylingonberryprimroseEuropean starflowerglaucous gentianstar gentianbuckbeanJacob's ladderforget-me-notlousewota 1 pi ne speedwellnorthern bedstrawnorthern twinflowerPacific red elderhighbush cranberryharebe 11yarrowarnicamountain woodwormarctic sageworthawkweedsweet coltsfootAlaskan dandelionSheet 4 of 4....-..- ..- ..- ....• ....•....•......• ....•....•- ..•..iii
............- .......- - ..- -..'...-Currently, no indigenous Alaska plant species are listed by the U.S. Fishand Wildlife Service as threatened or endangered. However, there are 30species under review (Federal Register. Vol. 45. No. 242. Monday.December 15. 1980). and only one. Puccine1lia trif10ra, has been reportedon the Kenai Peninsula. This alkali grass is found in the coastalwetlands of the Cook Inlet-Kenai Peninsula area (Murray 1980). 8ecauseno habitat is available within the Project vicinity. this species is notexpected to occur and was not found during field investigations.The terrestrial botanical study area for the Project was defined as thewatersheds of Grant Lake and Creek and Falls Creek. Nine vegetationmapping units were identified in this area using 1918 NASA high-altitude,color-enhanced, infrared photography. Mapping units generally representcombinations of plant community types that could be delineated from theaerial photographs. A vegetation map was prepared after correcting thephotographs to a scale of 1:24.000 (AEIDC 1982).Floristic composition. structure, distribution, and the correspondingvegetation associations (Viereck et a1. 1982) of each mapping unit aredescribed below. These descriptions are based on field surveys of thestudy area conducted during July 1982 by AEIDC (1982), during which thepreliminary vegetation map was also field-checked. Representative areasof each mapping unit, as well as questionable areas. previously disturbedareas. and sites to be directly. impacted by Project development werevisited. A qualitative assessment of the relative abundance of dominantplants was made.3.2.1.1 Coniferous ForestThis mapping unit is represented in the study area primarily by pure ormixed stands of white spruce and western hemlock. Mountain hemlockoccurs at higher elevations. Coniferous forest occurs primarily betweenGrant Lake and Upper Trail Lake. in patches along Grant Lake's shoreline.in the valley of the Grant Lake inlet stream. and between the mouth ofthe Falls Creek valley and the Trail River. Understory shrubs are19148 8120/853-56
primarily rusty menziesia, early blueberry, and Alaska spirea. Oevi1'sclub occurs in moist areas and along drainages. Forest openings maysupport Sitka alder, serviceberry, Pacific red elder, and Sitka mountainash. Other common shrubs in this type are trailing black currant andAmerican red currant. The ground cover is primarily a carpet of Sphagnumspp. and other mosses, with five-leaf bramble and lingonberry trailingover the moss carpet. This mapping unit corresponds to the Viereck etal. (1982) Level III - closed needleleaf forest, except for the blackspruce bogs which correspond to Level II - open needleleaf forest.Areas of poor drainage may support open stands of black spruce with anunderstory of Labrador tea, lingonberry, and dwarf blueberry growing overa layer of sphagnum moss and lichens (primarily Cladonia spp.). Theseblack spruce stands occur along the Trail Lakes and are scatteredthroughout the lower elevations around ponds and adjacent to the moreopen wet meadows.3.2.1.2 Broadleaf ForestThis mapping unit is dominated by balsam poplar with an understory ofrather tall feltleaf willow, Sitka willow, Sitka alder, and occasionalwhite spruce. The ground cover is extremely sparse and consists ofscattered patches of horsetail and river beauty. Frequent flooding is avery important force in this type. This mapping unit corresponds withthe Level IV - closed balsam poplar forest - of Viereck et al. (1982).This type occurs in the study area only along the main Grant Lake inletcreek and on the small delta of another inlet creek to the west of themain creek. The main inlet creek has a poorly defined channel andappears to shift its course across the delta frequently. During July1982 the main body of the stream flowed directly through a mature poplarstand.3-51.. .......... ......... ....- ..- ......- ....
- - ..-....•......- •-•- • ....••-- •- •- ..•- ......3.2.1.3 Mixed Broadleaf/Coniferous ForestThis mapping unit is dominated by paper birch, white spruce, and westernhemlock on relatively warm, dry sites, whereas cool wet sites are oftendominated by black spruce. The common understory plants of this type arerusty menziesia, highbush cranberry, early blueberry, American redcurrant, and prickly rose. Oevil's club is found in wet places and alongstreams. Open sites often support Sitka alder thickets. The groundcover in the mixed forest is primarily mosses, bunchberry, five-leafbramble, and lingonberry. The mixed forest type occurs in the study areain a band along the Trail Lakes and in the Vagt Lake area. This mappingunit corresponds with Viereck et al. (1982) Level III - closed mixedforest.3.2.1.4 Riparian ScrubThis mapping unit consists almost entirely of willows, river beauty.fireweed, horsetail, and on drier sites. bluejoint. The unit correspondswith Viereck et al. (1982) Level III - open tall shrub scrub. Thisunit's distribution is very restricted in the study area, occurring onlyalong the Grant Lake inlet creek, on the Grant Lake delta, andinterspersed with the broadleaf forest.3.2.1.5 Upland ScrubThis mapping unit comprises most of the subalpine vegetation in the studyarea, and is composed primarily of Sitka alder thickets in a complexmosaic with the grass/forb meadow type. Because of this complexity, mostof the grass/forb meadows are included in this unit on the map. Thisclosed scrub community has an understory composed primarily of ladyfern. In some avalanche chutes the alder is mixed with willows. Rustymenziesia occurs in substantial portions of this type along theconifer/scrub interface. This mapping unit corresponds with Viereck etal. (1982) Level IV - closed tall alder scrub - and generally occurs from100 to 2,500 ft along the mountain slopes throughout the study area .3-58
3.2.1.6 Grass/Forb MeadowThis mapping unit forms a mosaic with the upland scrub type describedabove; and as stated, is mostly included in the upland scrub unit on themap because of the small size of these meadows. However, larger meadowsare mapped separately. The primary constituent of this type is bluejointgrass. Salmonberry. red raspberry. fireweed. cow parsnip, falsehellebore and goatsbeard are found throughout these meadows but generallyare sparse. Dry. rocky slopes often support prickly rose, yarrow. arcticsagewort, cranesbill, and harebells. Monkeyflower is conspic;ous alongdrainages. This mapping unit corresponds to Viereck et al. (1982) LevelIII - mesic graminoid herbaceous - and Level III - mesic forbherbaceous. These meadows are located primarily along the slopes of bothGrant Lake and Falls Creek valleys. but small meadows also can be foundin the mixed forest and coniferous forest types.3.2.1.7 Bog (Wet Meadow)Sphagnum mosses form the basis of this mapping unit. The bogs vary fromextremely wet, floating mats to firm, treed bogs with a high proportionof shrubs. Often there is a small pond or wet spot near the center ofthe bog. The wettest of these communities support sphagnum. sundews,buckbean and scattered beakrush and sedges. The ponds themselves oftensupport buckbean and yellow pond lily. The drier bogs may supportscattered black spruce, dwarf birch, labrador tea, lingonberry, dwarfblueberry, crowberry, and cloudberry. This mapping unit corresponds toLevel III - wet graminoid herbaceous - and Level IV - open low shrubscrub. ericaceous shrub sphagnum bog - of Viereck et al. (1982). Thesebogs are most common in the study area in areas of low relief in themixed and conifer forest types, often surrounding ponds or <strong>lake</strong>s. Mostof them occur between Grant Lake and the Trail Lakes. Some of thesmaller or more forested bogs are included in the forest classes.3-59..- .. ..•- ....- ..••III..•III•• II.. .... .... ....•.. .... ..
'III..........' ................-..- --13.2.1.8 Alpine TundraTundra vegetation can vary considerably depending on the microclimate ofa site. In many areas, upland scrub and grass/forb meadows intergradewith tundra types, making the map delineations somewhat arbitrary.Therefore, this description is a generalization of many types which occurin patches throughout the alpine zone. Lichens are conspicuous in manyalpine areas, the most prevalent being Cladonia spp. and Stereocaulonspp. Prostrate willows, such as ova11eaf willow and arctic willow form amat over the lichens in many alpine areas, as does bearberry .Graminoids. such as woodrush, finely-awned sedge, and fescue, areinterspersed throughout tundra areas, especially on moist sites. Alaskamoss heath, Aleutian mountain heather, and crowberry can cover largeareas on the alpine slopes. Leutkea and sweet coltsfoot grow in moistplaces such as snowbeds and along drainages. Bog blueberry grows inpatches on sunny slopes. Shrubby willows such as barclay willow,feltleaf willow, and diamond1eaf willow grow along some of the alpinedrainages. The alpine tundra mapping unit correlates to level III - opendwarf shrub scrub - of Viereck et a1. (19B2). Alpine tundra in the studyarea is limited to the steep barren mountain tops, talus slopes, andpermanent snowfields. It is most extensive on south-facing slopes above2,000 ft and is very restricted on north-facing slopes.3 . 2 . 1 .9 Ba rren....-'I.These areas are mountain tops, talus slopes, cliffs, and snowfieldshaving less than 10 percent cover by plants .3.2.2 Potential Impacts!•.. -' ,....-The amount of each mapping unit to be affected by the Project is shownand compared with the amount of each type available in the study area inTable 3-15. A descript'on of the vegetation potentially affected by eachcategory of disturbance is provided below .3-60
TABlE 3-15AMOUHT AIIO PUtENTAGE Of MAPPING UNIT THAT WOULO BE AfFECTEO BY THE PROOECTBroad-GrlsslConi fer Mixed leaf Rlparlln Upland ForbForest Forest forest Scrub Scrub Meadow Bog Alpine Barren WI tel' TotllTotll Acres 1nStuC\y Ifte!! 3,910 1,160 90 100 6,300 900 160 5,910 11,470 1,780 37,840Access l'OIds. trlns. l1nesShort-teN hall1t1t loss (ecresl!!! 9 15 25Long-teN hallttlt loss (ICreslfl 5 8 14Long-teN 'let. _ ..... t (ICresl.!!l 2 2p_rtIouse. I!!!!toc::ltl1ntlke structures! tll1ractw SItort-teN haIIttit loss (acresl!!! 2 2 5I0'\--'Long-teN hallttlt loss (acreslfl 2Grant Lilt. drllWdlMlPel'lllnent dNWCIMift (acres)!! 35 35SeUOftal drawcbln (ecresl!' 165 165Totll Ifta altered b,l P!:!!Jec:tShort-teN alteraUOII (ecres)il 10 17 0 0 0 0 3 0 0 200 230Percent of totll ICres 1n Project lrel 0.31 1.51 OS OS OS 01 1.91 01 OS 11.21 0.61Long-teN IlteratiOll 'lcrest!Y 6 11 0 0 0 0 0 0 200 218Percent of total ICres 1n Project Irea 0.21 0.91 01 01 01 01 0.61 01 OS 11.21 0.611/ StuC\y area IS defined 011 '1egetltlon "p.il Totll lrel cleared dur1ng construction.cl Arel peNlnently covered by access rolds, powerflouse, or other <strong>project</strong> flcfllUes IS indicated.iI Area along trans.tssion line In which vegetltion he1ght would be controlled.e/ Area exposed by tile peraanent drawdotm of Grlnt Like surface elevltfon fro. 700 to 690 ft above 1151.1/ Area exposed by tile selsonll drawdotm of Grant Lake surface elevation fro. 690 to 660 ft Ibove .s1.-/ Totll arel altered by the Project during construction and the Initial years of operation.Total lrel peNanently al tered by the Project.~/1916B 8/20/85I, , I• J I , I , I r I I' .. r't I I•• I I , I I• I I I I I I • I- I I
- - - ..•--Tnis road would provide access from Highway 9 to the powerhouse, theGrant Lake intake and the penstock gate shaft. It would be routedthrough conifer and mixed broadleaf/conifer forest for most of itslength. There are no unique areas affected.3.2.2.2 Powerhouse3.2.2.1 Grant Lake/Powerhouse Access Road- •--- - - ---•- •The proposed powerhouse site is in a paper birch stand at the interfacebetween a mixed forest and a bog community. The understory is almostentirely rusty menziesia. The ground cover is moss with lingonberry,five-leaf bramble, and bunchberry. The bog community ;s very shrubbywith scattered black spruce. The shrubs include shrubby cinquefoil,dwarf birch, Labrador tea and dwarf blueberry. Ground cover is mosses(primarily Sphaghum spp.) and lichens (primarily Cladonia spp.) withcrowberry, lingonberry and cloudberry. As with the other Projectstructures, the vegetation types likely to be removed are not unique inthe study area.3.2.2.3 Grant Lake Drawdown Area--•- •-•II-The area that would be exposed by the drawdown of Grant Lake isessentally barren of macrophytes with the exception of two areas. Aprotected cove at the neck between the upper and lower basins of GrantLake supports a small stand of the sedge-Carex rhynchophysa. The outletof Grant Lake has a robust stand of white water crowfoot. which provideshabitat for a great many freshwater clams and snails. Grant Lake was theonly location where the white water crowfoot was found in the studyarea. ~ rhyncophysa was also found along a Grant Creek tributarysystem. Approximately 35 acres would be permanently exposed by thedrawdown associated with power plant operation. Most of the shoreline tobe exposed by drawdown is steep and rocky; however, the area to bepermanently exposed includes alluvial and avalanche deposits whereriparian or upland scrub habitat or coniferous forest are likely to3-62
develop. especially in flatter areas such as near the inlet and outlet.Sitka alder is expected to be the first colonizing shrub in most areas.Fluctuation of the <strong>lake</strong> level during operation would seasonally(especially March. April, and May) expose up to an additional 165 acres.Most of this latter area is not likely to revegetate.3.2.3 Mitigation of ImpactsStandard construction techniques would be utilized to physicallystabilize all surfaces disturbed by construction and to create a surfacewhich will promote rapid regeneration of native vegetation. Where soilsare substantially disturbed, topsoils would be segregated and stockpiledfor use in subsequent rehabilitation. Disturbed areas would befertilized and seeded with fast-growing native grasses wherever rapidrevegetation is required for erosion control. Riparian and wetland areaswould be avoided for facility siting to the extent practical. lhe 35acres to be exposed by permanent <strong>lake</strong> drawdown would be allowed to becolonized by native plants. Natural revegetation of disturbed surfacesin the Grant Lake area is relatively rapid (within a few years). Sitkaalder is frequently an early and dominant colonizer. but some moist areaswill be colonized by willow.•- ••- •III!..•..• ....••II....II3.3. WILDLIfE RESOURCES3.3.1 Existing ConditionsIn addition to reviewing pertinent literature and interviewingknowledgeable biologists and local residents, field surveys wereperformed to gather information on wildlife resources in the Projectvicinity (AEIDC 1982). Beginning in the fall of 1981 and extendingthrough the summer of 1982, a series of reconnaissance-level foot andaerial field surveys were conducted to ascertain the presence,distribution, relative abundance, and use patterns of various species andspecies groups and to identify the distribution and relative value ofimportant seasonally-limited habitats and their relationship to Project3-63••......•-•- •- •..
-..-..-......-....-- ..-- -..-..-....................features. Foot surveys were conducted once-per-season on all siteslikely to be disturbed or modified as a result of Project construction(e.g., access road corridors. the powerhouse site, penstock, etc.). Footsurveys were also conducted through adjacent areas to compare habitats atProject construction sites to other habitats in the study area. Thetotal study area for wildife resources included the watersheds of GrantLake and Creek and Falls Creek and is the same as that mapped on thevegetation map .Data recorded during foot surveys included sightings of individualanimals and sign indicative of their presence (tracks, scat. browselines, etc.), the vegetation type in which the sighting occurred, and anappraisal of the habitat quality for each species at each observationsite. Habitat quality was subjectively evaluated at each field site byinterpreting the amount and Quality of forage items available along withindications of past use of available food resources. Systematic aerialsurveys were also conducted seasonally to assess the distribution andrelative abundance of large mammals, raptors, and waterfowl in the studyarea. Data recorded included species, numbers, sex and age composition,location. time of day, an estimate of viewing conditions, and sign(tracks in snow, excavations by bears, etc.) indicative of an animal'spresence.3.3.1.1 AmphibiansThe wood frog (Rana sylvatica) is the only amphibian known to occur inthe study area. Habitat for this species is present in the area betweenGrant and Trail Lakes. It is doubtful that other species occur in thestudy area. No reptiles are found in the region.3.3.1.2 BirdsAlaska's avifauna is vast and diverse, comprising approximately 382species (Kessel and Gibson 1978). Of these, about 130 species are foundon the Kenai Pensinsula or in its coastal waters (USDA, Forest Service,1914B 8/20/853-64
no date). It appears likely that approximately 108 species could eitherinhabit or migrate through the study area. Comprehensive avian studieshave not previously been conducted within study area boundaries.Table 3-16 lists birds that may occur in the study area, their scientificnames, breeding status, relative abundance, and breeding habitats.Abundance ratings given in the table refer only to numbers within studyarea boundaries. This information was compiled from the literature andon-site investigations. Table 3-17 compares avifauna habitat types tovegetation mapping units.During field studies, 63 species of birds were observed. This represents48 percent of the total number of species present on the Kenai Peninsulaand 58 percent of those species that may seasonally use the study area.The probability of observing all the species listed in Table 3-16 in anyone year is remote. The 63 species observed probably represents themajority of the bird species that utilized the Grant Lake study area in1981-82. They also represent the species and number of birds typicallyfound in other mountain valleys of the Kenai Mountains. Of the 63species observed, 43 species were known or probable breeders within thestudy area. Accounts of the status of the major species groups in thestudy area are presented below.Waterfowl. Loons. and GrebesA variety of swans, geese, and ducks utilize the Kenai Peninsula. Mostnesting habitat occurs west of the study area where the Kenai Peninsulaforms a broad low level plain, dotted with numerous <strong>lake</strong>s and ponds.The study area offers varied, though limited, types of waterfowlhabitat. There are areas, principally around Vagt Lake and the pondsalong the bench between Grant and Upper Trail Lakes, that are suitablefor such ground-nesting ducks as mallards and American wigeons. There isa possibility that these areas may be lightly utilized by nesting geeseor swans; however, none were observed during field studies and there are3-65il.......,- .,-...,•.. .... ....•" •IlL'............
I I I I • I I I I I I I I I• I I I I I I , , I I • I I I I I , iTABLE 3-16 ./\ VIFAUNA WHICH PROBABLY INHABIT OR MIGRATE THROUGH THE STUDY AREA (FROM AEIDC 1982)A- ~bundantC- CommonFe - Fairly commonu- UncommonR - RareXX- Primary breeding habitatBreeding HabUats In the Grant Lake Study Area'SHEET 1 OF 3X - Secondary breeding habitat ~ :! J:> ..~:5= I-< If !:"-: ia immer x x FC xx xYellow-billed Loon Gavia adamsii II xArctic Loon Gavia arctica X x u xx xRed-throated Loon Gal'ia stellata II xx XRed-necked Grebe Podiceps grisegena IIwxx XI Horned Grebe Podiceps auritus u xx x0) Whistling Swan Olor columbianus II x0'>Trumpeter Swan Olor buccinator u x xx xCanada Goose Branta canadensis u x x xxMallard A nas platyrhynchos x x C xx x x xPintail Anas acuta Fe xx x xGreen-winged Teal Anas crecca x x u xxBlue-wing Teal A nos discors R x xx xAmerican Widgeon A nas americana x x u x xx xLesser Scaup AYlhya affinis x u x xxCommon Goldeneye Bucephala clangula x x FC X X xxBarrows Goldeneye Bucephala islandica x FC x X xxBuffelhead Bucephala albeola u x x xxHarlequin Duck H istrionicus histrionicus x x R xx xx xxCommon Merganser Mergus merganser x C x x xxRed-breasted Merganser Mergus serralor x FC x X X xGoshawk Accipiter genlilis u x x xxSharp-shinned Hawk Accipiter striOlus X C X xx xRed-tailed Hawk Buteo jamaicensis u x x x x xRough-legged Hawk Buteo lagopus u xxMarsh Hawk Cirms cyaneus II xx xGolden Eagle Aquila chrysoetos x x C xx xBald Eagle Haliaeetus leucocephalus x FC xx X xMerlin Fulco columbarius R x x X xxArne! ican Kest rei Falco span'erius x R X X xxSpruce Grouse Canachites canadensis x x FC X xxWillow Ptarmigan Lagopus /agopus x x C x xx xRock Ptarmigan Lagopus mutus x x c xx xWhite-tailed Ptarmigan Lagopus leucufUs u xx xSandhill Crane Grus canadensis R xSemipalmatcd Plover Clraradrius semipa/malUs u xx xxBlack-bellied Plover P/uviailis squatarola u X xxCommon Snipe Capella gallinago x J( Fe x xx
TABLE 3-16 (CONTINUED)SHEET 2 OF 3A - AbundanrC· CommonBreeding Habltals in the Grant Lake Study Area'FC - Fairly commonU - UncommonR - RareXX· Primary breeding habitatX - Secondary breeding habitat ~C ~(I) . "abitat types follow Kessel 1979."... ."::. ."." i= C(2)- Abundance categories follow the U,S, Forest Scn'ice unpUblished, ",,01." ... '" f " ii ~'" .. " i ii g= :aE01-. 5 J! ......." ...~ ~... ...Applies 10 study area only. iill ~ ~ COl.ci= :a ..~... ~ ~ ~/:i." :0~",.-'i!Breeding ~c ;:§ ~ .c .c ... !-
I I I • I I I t I I I I I I I i I j I I I I I I I J • I I I t I • I ,jTABLE 3-16 (CONTINUED)SHEET 3 OF 3A· AbullJantc· Common Breedlllll Habitats III the Grant Lake SCudy Area'FC· Fairly commonU· UncummonR· RareXX - Primary breeding habitatX- SeconJary breeding habitat II: 0:.lIIUabitat types follow Kessel 1979. .' 0:
I I ., • I I I I I .;I • I j i i i i I..I I I I I I I • I I I • I I I I
no published reports documenting their nesting in the Grant Lake area.In addition, there are standing dead trees suitable for tree-nestingspecies such as mergansers and goldeneyes. These nest sites arescattered throughout the study area adjacent to water sources.Nine duck species were observed during field studies. An Americanwigeon nest was found along the shores of Upper Trail Lake and a commongoldeneye with a single down young was observed in Grant Lake.Harlequin ducks and green-winged teal were observed and suspected to benesting in the Grant Lake Inlet Creek area.During the period when Grant Lake is iced-over, an area at the outletof the <strong>lake</strong> remains ice-free. This area proved to be a winter feedingarea for a flock of mallards. As many as 30 birds were observed in theopening during winter 1981-82 field studies. The <strong>lake</strong> bottom in thisarea was found to be rich with white-water crowfoot, to which wasattached an abundance of freshwater snails, clams, and insect larvae.With the exception of two pools in Grant Creek. this was the only areawithin the study area boundaries remaining ice-free and possessing anabundant. available food supply during the 1981-82 winter.Four loon and two grebe species inhabit the Kenai Peninsula. Nestinghabitat in the study area is limited; but Vagt Lake. Grant Lake. and.to a lesser extent. the ponds along the bench between Grant and UpperTrail Lakes provide some nesting habitat. Several common loons wereobserved during field studies and a pair was assumed to be nesting atVagt Lake. A pair of arctic loons nested near the east end of GrantLake during 1982. This is an unusual occurrence as most arctic loonnesting takes place further north. Although limited nesting has beenreported to occur on the Kenai Peninsula, there are no publishedrecords.l1li,•-•- - - - -••• ..•II•........•..•..filii•- ••3-70- • ..
--'111--..-..-•----••§u~Jerns. and ShorebirdsGulls, terns, and shorebirds are more common along the outer KenaiPeninsula than in inland areas, such as the study area. The mew gullwas the only gull species observed during field studies in the studyarea. It did not appear to be nesting. Arctic terns were alsoobserved in the study area. This species commonly nests on the KenaiPeninsula, but did not appear to be nesting in the study area. The mewgull and arctic tern both nest at Kenai Lake and a breeding colony ofarctic terns occurs at Tern Lake (Sowls et al. 1978). Both <strong>lake</strong>s areonly short distances from the study area .Numerous shorebird species potentially occur in the study area. Fivespecies were observed during field studies and four were assumed to bebreeding. The four probable breeders are both species of ye110wlegs(in the bogs on the bench between Grant and Upper Trail Lakes), thespotted sandpiper (along the Grant Lake inlet creek), and the commonsnipe (along Upper Trail Lake).Raptors---....- - ...- ..-..- ..-..-There are five hawk species, two eagle species, two falcon species, andfive owl species that breed or migrate through the Kenai Peninsula. Ofthe hawk species, only one --- the sharp-shinned hawk -- was observedwithin the study area. This bird was observed in a small foresteddrainage along the south shore of Grant Lake's upper basin. Nestinghabitat for this species, as well as the goshawk and red-tailed hawk,occurs within the forested portions of the study area. Several cliffsin the study area appear to have suitable nesting habitat forrough-legged hawks and nesting habitat for marsh hawks is present inbog areas .A single American kestrel was observed on the north slopes of GrantLake's upper basin. It gave no indications of breeding. Peregrinefalcons, which were not observed in the study area, are discussed underthreatened and endangered species (Section 3.3.1.4) .3-71
A single bald eagle was observed during field studies. This sightingwas along Grant Lake during October 1981. No nesting platforms wereobserved. Bald eagles regularly congregate along streams with salmonidruns, generally in proportion to the quality of feeding areas andsuitability of nesting habitat. The small Grant Creek fish run is notbelieved to be of sufficient magnitude to sustain fish-eating birds inconcentrated numbers.Juvenile and adult golden eagles were regularly observed in the alpinezone of the study area. Nesting is assumed to occur in this habitat,although nest sites remain undocumented.Five species of owls are known to inhabit the Kenai Peninsula(Gabrielson and Lincoln 1959). Studies by Lewandoski and Rice (1980)indicated that great-horned owls are the most abundant species andexhibit a preference for coniferous forest habitat. No owls wereobserved during field studies; however. suitable habitat existsthroughout the Grant Lake area.Grouse and PtarmiganFour grouse species inhabit Alaska, but only the spruce grouse occurson the Kenai Peninsula. Mixed forests of black and white spruce alongwith birch and poplar, at varying successional stages, provide idealhabitat for this species (Ellison 1974). The mixed forest communitiesalong the Trail Lakes and the Vagt Lake Trail provide the best habitatin the study area. The remainder of the area provides marginalhabitat. Only eight adults and one chick were observed in the studyarea during field studies. These observations, contrasted with thehigh production figures indicated in the literature (Ellison 1974),suggest that the study area supports a low population. The fact thatmost of the better spruce grouse habitat in the study area is locatedin areas easily accessible to hunters suggests that hunting may be alimiting factor to spruce grouse numbers.3-72-..-..•..-..•..••• ....iii..••iii•..•..•1M•1M.. ....iii
- - - - - - - - - - - ---..- - ----------•these species is found throughout alpine or subalpine zones near orabove timerline. Populations of rock and willow ptarmigan in the Grant<strong>lake</strong> area are probably average for the Kenai Peninsula as a whole.Neither species appears overly abundant, but both were commonlyobserved in appropriate habitats during field studies. Although nowhite-tailed ptarmigan were seen, they may be present along steepslopes and ridges above timberline. Hunting does not appear to be amajor controlling factor for ptarmigan numbers in the study areabecause of the relative inaccessibility of alpine and subalpine zones.Other BirdsA variety of other bird species, including kingfishers, woodpeckers,and passerines, occupy the study area (Table 3-l6). Pertinent fieldobservations include the following. Belted kingfishers were commonlyobserved during field studies around the Trail <strong>lake</strong>s and Grant Creek.Several dippers were observed along flowing creeks within the studyarea and young were seen along Grant Creek and the Grant <strong>lake</strong> inletcreek, indicating breeding in these areas. A large flock of Bohemianwaxwings containing many young birds was observed feeding on insects atthe mouth of Grant Creek. Five warbler species were commonly seenthroughout the upland scrub and riparian scrub communities of the area,as well as the small patches of scrub vegetation that occurred on thebench between Grant and Trail Lakes; all were suspected to be breeding.3.3.1.3 Mammal~The mammalian fauna of the study area is comprised of a nearly equalmix of herbivore and carnivore species (Table 3-1B). This circumstanceis not unique in Alaska and is representative of the mammalian fauna ofthe Kenai Peninsula as a whole. In general, the habitat is marginalfor mammals and supports few individuals of most species. Notableexceptions are some south-facing alpine and subalpine communities,which are important to resident bovids.--- --Three species of ptarmigan inhabit the Kenai Peninsula. Habitat for3-73
lilt-..TABLE 3-18MAMMALS OF THE STUDY AREASheet 1 of 2 -IIIOccur- Subjectiverence Populationin Study...Relative Estimates,..Common Name Scientific Name Area Abundance Summer, 1982 Source~/•Shrews Soricidae ..Masked shrew Sorex cinereus P ? NE~/ 1 2~/Dusky shrew Sorex obscurus ? ? NE 2~/ ...Water shrew Sorex palustris ? ? NE 1 2~/Va<strong>grant</strong> shrew Sorex vagrans ? ? NE 1~/Pygmy shrew Microsorex hoyi P ? NE 1 ,2...Bats Vespertilionidae ..Little brown Myotis lucifugus P ? NE 1 .2myotis•..Hares LeporidiaeSnowshoe hare Lepus americanus Y9..1 CQI NE 1 .2.3•~lJirrel~ Sciuridae liltHoary marmot Marmota cal;gata Y C NE 1 ,2,3-Red squirrel Tamiascirus Y C NE 1,2,3 IIIhudsonicusNorthern flyingsquirrel Glaucomys sabri nus P ? NE 1 .2 Beavers Castoridae •Beaver Castor canadensis Y C 8-40 1 ,2,3..New World _Mice CricetidaeNorthern red- Clethrionomys Y ? NE 1 .2,3backed mouse rut; l.!!iMeadow vole Microtus P ? NE. "' ,2~./pennsylvanicus•Tundra mole Microtus P ? NE-1.2~/oeconomousSinging vole Microtus gregali~ P ? NE 1 ,2~/Brown lemming Lemmus sibiricus ? ? NE 2Northern bog Synapotomys P ? NE 1 .2 ...lemming boreal;~ ..Jumping Mice ZapodidaeMeadow jumping Zapu~ hudson;cu~" ? ? NE I ,2 •..mousePorcupine Erethizontidae •..Porcup i ne Erethizon Y C NE. 1 .2.3-dorsatum3-74..•...••
'"'.Common Name-•- •-• BearsBlack bearBrown bear-• Weasels and-A 11 iesMartenErmineWeaselMink-•-kJild CatsLynx-CervidsMoose--•9.1Q./-•- -•--•Wild CaninesCoyoteGray wolfRed foxWolverineRi ver otterBovidsMountain goatDa 111 s sheepNE = No EstimateY ~ Yes (sight records extant)P = Probable? '" UnknownTABLE 3-18 (Continued)Occurrencein Study RelativeScientific Name Area AbundanceCanidaeCanis 1atransCanis lupusVu1pes vu1pesUrsidaeUrsus americanusUrsus arctosMuste1idaeMartes americanaMuste1a ermineaMustela nivalisMuste1a visonGu10 gu10Lutra canadensisFelidaeLynx l.Y!J!.Cervidae8lces a1cesBovidaeOreamnos americanusOvis dalliYYYYYYYYYYYYYYYCCR!?/CCRCCRCRRCCCSubjectivePopulationEstimates,Summer, 1982NE6Nt20-401010-100NENE
The mammalian fauna present is highly mobile; most species aremigratory, moving seasonally between disparate ranges in response tochanging environmental and physiological conditions. Movements betweenranges are influenced to some degree by the rugged physiography of theregion and by the phenology of snow melt. Several distinct traditionalmovement corridors of large mammals were noted.Table 3-18 lists observed and likely components of the mammalian fauna,their scientific names. and their relative abundance in the studyarea. The list represents a synthesis of published and unpublishedreports, interviews with long-time area residents, and results of fieldsurveys. Subjective study area population estimates have been providedfor select species and species groups.Small MammalsTwelve species of shrews and mice are possible residents of the studyarea. Shrews appeared to be ubiquitous in all forest and scrubassociations based on field observations of sign. Shrew sign was mostabundant in older forest communities, becoming conspicuously lessnoticeable, but still present, above timberline.Vole tracks were observed on snow in March throughout the study area tothe 2,000 ft level, the altitudinal limit of foot surveys. The tundraand singing voles are probably the most common microtines ;n the area.Three northern red-backed mice were found in July 1982 along the VagtLake Trail. This;s a common mammal throughout the Kenai Peninsula.The little brown myotis is a common summer resident of southcentralAlaska. None were sighted during field surveys of the study area butthey are undoubtedly present......- -•-,.- • .." till••..- -....•......3-7f>•
--..---- - ..Snowshoe HaTeLow numbers of snowshoe hares inhabit all forest and low-lying scrubassociations within the study area based on the abundance of tracksobserved during midwinter foot surveys. Areas bordering Trail Lakesappear to constitute the center of hare distribution and abundance inthe study area. Despite their relatively low numbers, hares form thedietary mainstay of coyotes and lynx based on cursory field examinationof scats.Marmots and Squirrels- - ..Hoary marmots are conspicuous, common residents of alpine tundracommunities throughout the study area. In general they were observedat elevations between 1,500 and 3,000 ft. Highest marmotconcentrations were observed in the Upper Falls Creek drainage and inlocal areas north and northeast of Grant Lake.- - - -..---..--- -•-..-BeaverAlthough beavers are one of the most abundant furbearing mammals inAlaska, litte prime beaver habitat exists in the study area. Evidenceof beaver was scarce and, with few exceptions, was confined to GrantLake proper and its terminal tributaries. The only area within thestudy area meeting all criteria for prime beaver habitat is thenorthern portion of the Grant <strong>lake</strong> inlet stream delta. Four lodgeswere observed in this area although only one appeared to be active.3-17Red squirrels are conspicuous throughout the coniferous forests of thestudy area, being most abundant in areas of larger spruce timber.Although northern flying squirrels were not observed during fieldstudies they probably occur in forests within the study area.
Small numbers of beaver also reside in Grant <strong>lake</strong> proper, but thesehabitats are of low quality and appear incapable of sustaining beaverpopulations. Four lodges, including one apparently active lodge, and alodge apparently under construction were observed along the Grant <strong>lake</strong>shoreline. These shoreline lodges are exposed to the influence ofpredators, floating ice in spring, waves, avalanches, and <strong>lake</strong> levelfluctuations resulting from periodic heavy rains and spring breakup,and are not near appreciable food resources. These beavers areprobably offspring of the colony located on the delta of the inletstream. A single beaver was also observed in lower Trail <strong>lake</strong> near itsoutlet.-limited trapping of beavers does occur in the area. Interviews withlocal residents indicate that trapping intensity varies considerablybetween and within years, depending on market conditions. At least onebeaver trapper was active in the area during the winter of 1981-1982.Beaver trapping appears to be more of a recreational pursuit than acommercial one in the study area.PorcupinePorcupines are common throughout the coniferous areas of the KenaiPeninsula, particularly in mountainous regions near timberline.Populations are highly variable and fluctuate radically over relativelylong intervals. Occasional scattered porcupine sign was noted in thestudy area, generally at altitudes of 500 to 1,000 ft. The speciesdoes not appear to be abundant at this time in the study area.- ..- ----•- ..- •- • ..••..- - ..-........ ..Assuming all observed lodges are active and all represent colonies ofaverage size (libby 1954, Boyce 1974), then 32 to 40 beavers inhabitthe area. A minimum population estimate, assuming only two activecolonies, would be 8 to 10 beavers.3-78..• ..
---- ---•-..-- - ..- - --- - -..- ..-..-- - -Wolf. Coyote and Red FoxThree types of wild canines range in the Grant Lake-Falls Creek-TrailLakes region: wolf. coyote, and red fox. The wolf is a frequenttransient; the coyote is probably a resident or common transient; andthe red fox is a rare or occasional visitor or recent resident.Peterson and Woolington (1979) reported an early winter population of185 t'llolves on 5,300 square miles of the Kenai Peninsula. The wolves inthe Grant Lake area are probably the group known as the Mystery Creekpack (Peterson 1982), ranging in the mountain area from Mystery Creekas far east as Grant Lake or perhaps, on occasion, as far as NellieJuan Lake. Wolves have occasionally been reported and taken in theGrant Lake-Trail Lakes area in recent years. In January 1982, sixwolves were observed during an aerial survey along Grant Lake's northshore. In late February 1982 a mountaineering party, en route up LarkMountain via the west ridge, observed two wolves harassing a moosealong the shore of Grant Lake (Babcock 1982). Tracks were also notedin February and March around the northwest corner of Grant Lake andeast of Vagt Lake. A single wolf was observed in the upper valley ofthe inlet creek during an April 1982 aerial bear denning survey. Thewolf preys upon a large number of animals, including moose, Oall'ssheep, mountain goat, snowshoe hare, beaver, and other canids such ascoyote and fox. No wolf kills were noted in the Grant Lake-Falls Creekarea during field studies; however, moose remains were found in severalwolf scats.The coyote has increased rapidly in numbers since colonizing the KenaiPeninsula around 1930 and has been a prominent and widely distributedmember of the local fauna since then. Coyote sign was noted over muchof the area on all field trips. Like the wolf, the coyote iswide-ranging and will travel and hunt throughout all habitat types ofthe study area. It is probably a much more frequent transient orresident of the Grant Lake-Falls Creek area than the wolf. The delta3-79
of the Grant Lake inlet creek was a center of coyote activity duringthe winter of 1982. Coyotes were observed hunting for hares andptarmigan in the area. A frequently used coyote travel route was notedon the bench between Falls Creek and Grant Lake in the timberlineregion at the base of the mountain slope.The red fox is an indigenous member of the Kenai Peninsual fauna.Apparently, fox populations on the Kenai have remained low through muchof this century. The species has been neither taken nor observed byany of the trappers in the Grant Lake-Falls Creek region. A singleseries of fox tracks was noted in March 1982 in the Vagt Lake area.Black BearBlack bears are one of the most widely distributed and abundant largemammals on the Kenai Peninsula. Timbered and brushy areas of theregion afford good protective cover, which probably accounts for theirability to withstand the intense hunting pressure typifying this partof southeastern Alaska. Black bear within the study area are generallyassociated with valley floors, small alluvial plains, <strong>lake</strong>shores, andintervening streams and these are limited in the study area.Ground-level reconnaissance surveys during the fall, spring, and summerassessed the relative abundance and general distrlbutlon of black bearswithin the study area. Track, scat, and actual bear sightings wererecorded to estimate the intensity of habitat use relative to proposedProject facilities.Nine black bears, two track sets, and about 10 scats, presumably ofblack bear origin, were noted during the three field surveys. In June,1982, the majority of bears and sign was observed near Grant Lake; onebear was sighted in the timbered area downstream of the Grant Lakeoutlet. Two track sets were also noted along the edge of Lower TrailLake during the October 1981 reconnaissance. Scat was evenly3-80•- - - ..- ......-- ........ ......••..•...... .... ....- ....-...•
-....-..- - - --•---•-..- - ..distributed between 500 and 1.000 ft in the area between and around the<strong>lake</strong> systems. Surprisingly, no evidence of black bear activity in theupper Grant Lake valley was discovered.As with brown bears the activity patterns of black bears appear to beregulated by the temporal and spatial distribution of food resources.Food resources within the Grant Lake study area appear to be moderateat best. Important black bear habitat in the study area includes thelower alpine zone near the shrubline. which 1s important in July andAugust for the young. succulent forbs and sedges it produces. DuringAugust and September. salmon present in Grant Creek are sought by blackbears. Because salmon are unavailable in great numbers. bearsintermittently forage in the subalpine zone and on lowland berries atthis time. Elderberries. blueberries. rosehips, salmon berries and lowand highbush cranberries are probably utilized heavily. Recreationalfacilities and the Moose Pass population center are often visited byforaging black bears during spring .Likely denning habitat in the Grant Lake area includes spruce-coveredslopes and hillsides. Wet places and open terrain would likely beavoided as places to den. Primary denning habitat for black bearsprobably occurs in the Trail Lakes and Moose Creek valleys; theforested habitat along the Trail Lakes appears less suitable because ofhuman disturbance. The bench between Grant and Trail Lakes south toand including the Ptarmigan Creek drainage appears to be usable denninghabitat for those black bears residing locally year-round.---..-............-Information obtained through field reconnaissance can be used tospeculate on black bear numbers present in the study area. Based onactual sightings. tracks and scat. from 10 to 40 black bears appear torange within the study area. Considering the area's size and therelatively small home range of black bear compared to brown bear, itseems reasonable that 10 to 15 animals range within the study areayear-round, with approximately 20 more being transients .3-81
The lack of stable, concentrated food resources and continuousinteraction with the human inhabitants of Moose Pass constitute themost prominent limiting factors to black bears in the Grant Lake area.Increased human activity would likely trigger a decline in the numberof resident bears, but transient animals probably would be littleaffected over the long term. The adaptability of black bears to thehuman element implies that the current number of black bear represent astationary population. A less serious limiting factor appears to bethe number of bears killed in defense of life and property and thoseharvested incidental to the taking of other game species by sporthunters. Although the study area is not considered good bear huntingarea, moderate hunting pressure is exerted on Dall's sheep, mountaingoat, and moose, so black bears are subject to some exploitation.Brown BearsBrown bears are sparsely distributed throughout much of the regionsurrounding the study area. The study area is adjacent to areascontaining much higher brown bear densities such as the mountainousareas of Prince William Sound and other areas of the Kenai Peninsula.Grant Lake field studies emphasized the delineation of habitats andgeneral movement patterns of bears inferred from observed seasonaldistribution and abundance. Data obtained during fall and summerground-level surveys and three aerial surveys conducted in early springprovided information on the relative number and seasonal distributionof brown bears.Considering the study area's physiography, its proximity to humandevelopments, and the limited amount of usable habitat and forageresources within the Project vicinity, brown bear numbers were expectedto be low, representing but a fraction of the region's totalpopulation. The 1981-82 field studies confirmed this expectation.During the study period only 16 widely scattered sets of brown beartracks and three individuals were observed: a family group (female with3-82-......--.. ....- .. ..•..••.... .... ......•.... ..•
- - ..-....-..-..- ..-..-..-- - - - - - ..-..-..- ..-..- ..-one yearling) and a mature individual. Alaska Department of Fish andGame (ADF&G) authorities reported insufficient forage as probably theprimary factor for the low density of brown bears in this region (ADF&G1973). The highest reported brown bear harvest since 1961 for theyears 1976, 1980, and 1981 for all of Game Management Unit 7 (Seward)was three bears. For the past 21 years, the annual harvest averagedapproximately one bear per year (ADF&G 1982). Considering theintensive hunting pressure in southcentral Alaska, these extremely lowharvest figures reflect the low density of brown bears in this region .Forage resources primarily include the following: herbaceous plants(grass-forb meadow variety) found in scattered sites above the northside of Grant Lake, at intermediate elevations of the upper valley'snorth side, and in the upper Falls Creek drainage; marmot colonieslocated in most alpine and subalpine areas, particularly along thesouth side of Solars and Lark Mountains; and at least two salmonspecies known to spawn in Grant Creek (Figure 3-4). The scattered,low-quality forage resources suggest that the study area is used mainlyby transient brown bears.Denning habitat was delineated on the basis of sightings of individualbears and their sign at the time of den emergence, and on the basis ofcertain geomorphic and vegetation characteristics. Three units ofpotential denning habitat were delineated in this manner {Figure 3-4}.Unit 1 appears to have the most potential, based on observed bearactivity, slope conditions, substrate. and vegetation. Denning wouldlikely occur at elevations of about 1200 to 2500 ft in hilly terrainbordering the alder lone. Extensive areas of surface bedrock,precipitous slopes, and sparse vegetation cover along the westwardsection reduces habitat potential. Available denning habitat in Unit 2is limited to areas having less rugged relief, mainly ridgesparalleling the lower part of the two lateral tributaries entering thesoutheast section of Grant Lake. Rocky outcroppings and large bouldersprovide some caves or natural cavities for denning. but these sites are3-83
12PRIMARY DENNING HABITATttJlll1J MAJOR MARMOT COLONYGRASS-FORB MEADOWALPINE FEEDING HABITATSALMON STREAMALASKA POWER AUTHORITY26GRANT LAKE HYDROEI-ECTRIC-PROJECTL A.MAJOR BROWN BEAR FORAGERESOURCES AND DENNINGHABITAT IN STUDY AREA 1982EBASCO SERVICES INCORPORATED3-84
-..-..-..-..-..-..-..-..-..-..-..- ..-- - ..part of the Falls Creek valley. has some potential for denning. Bearactivity occurred in this area during the den emergence period. Thevegetation. snowpack. and soils of the unit appear adequate fordenning; however. available space is limited, and the unit probably isnot heavily used.The most important denning habitat is present ;n the 2.1 square mileUnit 1, which represents about 47 percent of the total habitatavailable for denning. Presumably no more than one or two families andpossibly two or three solitary animals would den within the study areain any given year .The slopes west of Solars and Lark Mountains and the bench partitioningGrant and Trail <strong>lake</strong>s constitute the principal travel routes to andfrom the Grant Lake valley. Of secondary importance to interdrainagetravel is the pass intersecting the headwater areas of Moose Creek andthe Snow River. The extent these areas are used remains unknown. Theperiod of greatest activity noted during field studies occurred in thelast half of May, coinciding with den emergence and breeding. The May21 aerial survey, when three brown bears and eight individual sets ofbrown bear tracks were noted, suggested that up to 10 different brownbears visited the study area around mid-May. Few, if any, brown bearsapparently reside year-round within the study area due to low qualityfood sources, limited denning habitat and residential development alonglimited. Unit 3, extending along the south-facing slope of the upperlrail <strong>lake</strong>s. Interchange between regional subpopulations is relativelyintensive, and the use of the area by transient bears ;s common andprimarily related to the seasonal availability of limited foodresources .-..-..-..-..Martens are indigenous to the Kenai Peninsula and once were prominentin the fur trade. The animal is present over much of the mountain andfoothill area of the Kenai Peninsula. A professional trapper and3-85
esident of Moose Pass related that he had not taken marten in theGrant Lake basin. but reported a sizeable marten population in the SnowRiver country southeast of the study area (Candit 1981). Judkins. alsoa trapper and resident of Moose Pass. reported that the marten wasrelatively common in the lower Falls Creek drainage (Judkins 1982).Tracks of a single marten were observed at two locations during theMarch 1982 survey: one on the Inlet Creek delta at the east end ofGrant Lake and another on the timbered ridge north of Falls Creek.Weasels are widely distributed throughout the Kenai Peninsula. TheGrant Lake area is no exception, and tracks of this mammal were notedthroughout all habitat types of the study area. There is considerablevariation in density. Sign was most abundant in grassy areas neartimberline and around <strong>lake</strong> margins, probably a reflection of theabundance of voles. their principal prey species.No mink were sighted during the surveys and very little sign wasnoted. Tracks and scats were seen along the shoreline of Upper TrailLakes near the mouth of Grant Creek and in Grant Creek. During March1982. a single set of mink tracks was noted along the west shore ofTrail River. Habitat suitable for mink appears limited to the lowerreaches of Falls and Grant creeks and to the shoreline of Trail <strong>lake</strong>s.Habitats along Trail <strong>lake</strong>s are probably important only following salmonruns when spawned-out salmon are washed into the shallows. Trail <strong>lake</strong>sare so glacially turbid that mink may be unable to effectively locateprey in them at other times.Wolverine are relatively abundant predators on the Kenai Peninsula.Wide-ranging by nature, they can be found in all habitat types, mostcommonly in mountain areas. In March 1982 wolverine tracks were notedin a number of locations: Grant Lake inlet creek delta and eastward;the bench below timberline between Falls Creek and Grant Lake; and thetimberline area on the west ridge of Lark Mountain. Candit (1981)reported trapping "seven or eight" over 20 years in the Grant Lakedrainage basin. At present, the Grant Lake-Falls Creek area is3-8&.. ....-....- ..-....•....- - - ••- ..... ..-..•-........ ..•
- - -•-,.-,.- •- •-•- •-•-,.- ,.- -•- •- •- •- •-evidently within the travel and hunting range of one or morewolverines. In particular, the Grant <strong>lake</strong> Inlet Creek delta was thesite of considerable wolverine foraging activity in March of 1982.Several prey species were in the area at the time.River otter are relatively abundant and widespread on the KenaiPeninsula, but no sign of their presence was found in the study area.Suitable habitat for otter is limited to the lower reaches of GrantCreek. lack of habitat probably precludes the establishment of aresident population. Otters are probably present as transientsthroughout the area, however.lynx are widespread over the Kenai Peninsula. Oependent as they are onthe snowshoe hare as a primary food source, lynx distribution andpopulation levels closely shadow that of the hare. Forest andshrubland country, where there is an abundance of hardwood browseplants available for hares, is prime lynx habitat. Currently, the harepopulation on the Kenai Peninsula and thus that of the lynx are high.The Grant <strong>lake</strong>-Falls Creek area has a relatively low hare population,however, and few areas of concentration, so lynx are correspondinglyfew. Tracks of a single lynx were noted in the timberline area east ofVagt <strong>lake</strong>.Moose inhabit the Grant <strong>lake</strong> study area, but are not particularlyabundant at this time. Several factors discussed below are probablyresponsible for limiting study area moose numbers.Summer range does not appear to be a limiting factor (Figure 3-5).Ponds and <strong>lake</strong>s between Grant <strong>lake</strong> and the Trail <strong>lake</strong>s produce abundantaquatic plants and much evidence of their use by moose was observed3-87
•during field studies. Lower slopes adjacent to Grant Lake supportvigorous stands of bluejoint, and suitable browse, while not abundant,occurs throughout the study area.The chief natural factor limiting moose numbers in the study areaappears to be the amount and quality of winter range (Figure 3-5).With few exceptions plant succession has advanced beyond the stagesfavoring palatable browse. As a consequence, few places within thestudy area meet all of the criteria collectively describing good winterrange. Remaining winter range is largely confined to the activefloodplains of lower Falls Creek and the Grant Lake inlet creek. Inthese locations the plant succession is periodically retarded by theaction of flood waters. Both areas support palatable riparian willows,but neither is being utilized to its potential. Examination of browselines indicates a much greater use in the recent past than at present.Most moose within the study area appear migratory. Sightings ofindividuals and sign were more common during the warmer seasons thanduring winter, despite the severe limitations on visibility imposed insummer by the leaves of deciduous trees and shrubs. Several clearlydefined traditional travel routes were found, providing a clue as tothe normal means of ingress and egress used by moose. One such travelroute follows across the bench between Grant and Trail <strong>lake</strong>s, nearGrant Creek (Figure 3-5). Some disruption of movement patterns ofmoose using this route may result from the development of <strong>project</strong>facilities in this area.Several factors may be responsible for lack of greater recent use ofthe study area in winter by moose. Snow depths could occasionallyexceed the height of willow stands, even though many plants exceed12 ft in height. Although moose can easily reach browse 10 ft aboveground level (Wolff 1976), they have difficulty traveling in snowdeeper than 3 ft (Coady 1974). Alternately, access to these isolatedstands of winter range could be restricted by snow depth, avalanches,3-88-- -•..- ..-..-..•..-..-..•- -•..-..-.... ..- ......-..•
:::e>DEFINED ROUTESNORMAL DIRECTION OF INGRESSBASED ON TRACKING EVIDENCE.EGRESS IS ALONG THE SAMECORRIDORSSUMMER RANGESUMMER AND SECONDARYWINTER RANGESSUMMER AND PRIMARYWINTER RANGE~ALASKA POWER AUTHORITYGRANT LAKE HYDROELECTRIC PROJECTM90SE RANGES INSTUDY AREA 19823-89
....II.......II...II..IIII....II........or glare ice on the <strong>lake</strong>s. The winter of 1981-82 was not particularlysevere. however. and it seems likely that other explanations must besought to explain why most moose left the study area during thewinter. Lack of use in recent years might reflect predator losses orhunter-induced mortality (Hinman 1979. 1980a, 1980b; Chatelain, 1950;Franzman et al. 1980), but lack of abundant food resources due toadvancing plant succession in all probability is the chief reason fewmoose overwinter in the study area.Based on the results of field and literature surveys, moose numberswithin the study area during summer probably fluctuate between 20 and30 individuals. Assuming these estimates are correct. stockingdensities range from 2.3 to 3.5 per square mile on summer range. Asnoted above. few moose overwinter in the study area. Stockingdensities in this range are relatively low compared to other areas onthe Kenai Peninsula .From a statewide perspective the moose resources of the study area arerelatively insignificant. Viewed from a local perspective, however,the resource takes on added importance. Moose are nowhere abundant inthe mountains of the eastern half of the Kenai Peninsula and,consequently. the study area1s population is biologically significantto the area as a whole. The population also is important to humans.Hunting pressure is relatively high due to its location adjacent to theroad system. Most hunters are local residents; however. in past yearsGrant Lake attracted as many as four fly-in hunting parties per year(Judkins 1981). Moose harvest figures are unavailable for the area,but based on the results of field surveys, the legal annual takeprobably does not exceed five. Considering the proxiollty of the areato human habitations, there is a decided potential for illegal hunting .Mou~tainGoatsMountain goats inhabit the entire mountain area of th~ Kenai Peninsula,but densities are greatest east of the railroad. the Kenai PeninsulaII3-90
goat population is subject to considerable short-term annualfluctuations and shifts in ranges occur due primarily to winter weatherconditions and recently to hunting pressures. Although the populationhas been relatively stable over the long-run, a general overall declinehas been noted over the past 10 years. A current total Kenai mountaingoat population estimate is not available, however.In 1979, 1980, and 1981, a total of 41 goats were captured and equippedwith radio collars and subsequently monitored to obtain life historyinformation by the ADF&G in the Grant Lake drainage and surroundingareas (Nichols 1982). The entire area under study by ADF&G had anestimated population of 246 goats in the summers of 1979 and 1981; awinter of heavy snow and severe avalanche conditions in 1980 inducedconsiderable mortality and reduced productivity. Of this group, aboutone-quarter (an average of 50) commonly use the Grant Lake basinthrough much of the year.Although the entire drainage is used by goats, the most importantsections are located on the south-facing slopes of the north half ofthe drainage---general1y small vegetated benches and ridges in the 1,000to 3,200 ft altitudinal range (Figure 3-6). The principal area of goatuse in the Grant Lake basin is the north side of the <strong>lake</strong>. Thesesouth-facing slopes are utilized in fall, winter, spring, and intoearly summer. Occupied areas reach from alpine benches downslope intostringers of mountain hemlock. This plant was present in 70 percent ofall fecal samples collected from alpine winter ranges at Grant Lake(Hansen and Archer 1981). The primary area of interchange betweenGrant Lake and other subpopulations is into the Moose Creek drainage tothe northeast and across the glacier to the east to the KingsRiver-Kings Bay area.The southern half of the Grant Lake drainage and Falls Creek drainageare used to a much lower degree than the north part of the Grant Lakedrainage. These slopes are evidently subject to intense avalancheactivity and this factor, by itself or in combination with otherfactors, may limit their utility to mountain goats.3-91.. .............................. ............II..•..II............•
12APRILMAYJUNEALASKA POWER AUTHORITYGRANT LAKE HYDROELECTRIC PROJECTr.. . AMOUNTAIN GOATOBSERVATIONS INSTUDY AREA 19823-92
-- - - -•Goat hunting on the Kenai Peninsula is presently rigidly controlled bya permit system that allocates a limited harvest to each unit ofrange. In 1982, 16 goat hunting permits were issued for the PtarmiganLake-Trail Creek-Moose Creek area, including the Grant Lake drainage(Area 839).-•-Oa 11' s Sheep• The Oall's sheep is a wilderness animal residing for the most part inrugged alpine and subalpine mountain habitat. Dall's sheep o~ theKenai Peninsula are relatively more abundant in the interior sections--•of the Kenai Mountain range than elsewhere. The Grant Lake areaconstitutes the outer boundary of sheep range in this area. Dall'ssheep reportedly range over the entire Grant Lake and Falls Creekdrainages in several small bands. During field studies, however, theywere only noted on the northern half of the Grant Lake drainage. Thisis evidently their most favored range (Figure 3-1).---•In May of 1980 and 1981, 14 and 41 sheep, respectively, were recorded-•- on the Grant Lake ranges (Nichols 1982). In early June 1982 field--surveys, 30 sheep were recorded on the slopes north of Grant Lake.Based on extant trend counts and the results of this survey, Oall'ssheep numbers appear to vary annually from about 10 to 50 animals.- Frequent interchange apparently occurs with the Moose Creek herd,--particularly during the summer. As with goats, mid-elevations of theslopes constitute favored range, especially vegetated benches, and theupper edges of timbered areas and exposed ridges where some forageplants are available. Sheep were observed at various seasons from the-Lark Mountain ridge line above Moose Pass to slopes in the upper basinof the drainage.--•-3-93-•
MAYJUNEALASKA POWER AUTHORITYGRANT LAKE HYDROELECTRIC PROJECTDALL'S SHEEPOBSERVATIONS INSTUDY AREA 1982EBASCO SERVICES INCORPORATED3-94
- -..-•--------------•Winter range generally comprises a small sector of the overall range,and thus represents the principal limiting factor. Good winter rangein the Grant Lake basin consists of snow-free sites near escape terrainat the mid-altitudinal level of the basin. In early spring, sheepsometimes must move to lower altitudes into subalpine tree cover, whereemergent vegetation appears soon after the snow recedes. Within thestudy area, sheep scats were found in open bluejoint meadows as low as1000 ft. in altitude. Movement to mineral licks is an important phaseof seasonal movements but no licks were found in the study area.While coyotes, wolverines, bears, and eagles may prey on sheep, thewolf appears to be the principal predator. Wolves, however, do notappear to exert much influence on sheep numbers in the study areaexcept when sheep may be forced by competition to feed distant fromescape terrain at the time wolves move through the area.3.3.1.4 Threatened or Endangered SpeciesA subspecies of Canada goose, the Aleutian Canada Goose, Brantacanadensis leucopareia, is noteworthy as it is one of three Alaskabirds listed as an endangered species. Its breeding range is limitedto the Aleutian Islands hundreds of miles southwest of the study area.The fall migration apparently proceeds nonstop directly across the Gulfof Alaska to northern California. It appears highly unlikely that anymembers of this race would occur in the Peninsula area.Three races of peregrine falcon, two of which are endangered, arepresent in Alaska. Falco peregrinus anatum and [. R. tundrius, theendangered races, breed in moderate numbers throughout interior andarctic Alaska, respectively (Roseneau 1982). Records presented byGabrielson and Lincoln (1959) indicate that these birds were oncefairly common mi<strong>grant</strong>s through the Kenai Peninsula. Few have been seenin recent years. Most sightings are reported from recognized migrationcorridors which parallel the outer coasts. It appears unlikely that------- - -3-95
these birds occur within the study area. The nonendangered race, [. 2.2.e~J, is primarily a coastal species and also has not been sighted inthe interior of the Kenai Peninsula.The Eskimo curlew (Numeni.!,!i p..Qrei!lisl is listed on the endangeredspecies list and has occasionally been observed on the KenaiPeninsula. Accounts of these birds are mainly historical, and manypeople believe it may be extinct. Principal breeding grounds appearlimited to the arctic coastal plains. Few have been slghted in recentyears.3.3.2 Potentlal ImpactsAlthough the proposed Project arrangement involves a lesser amount ofwildlife impacts than most other alternatives considered. the wildliferesources of the study area may be affected in a variety of ways. F-achof the general types of impacts are discussed under separatesubheadings in the following paragraphs.Project construction would have a short-term impact on many species,particularly big game mammals and large predatory birds and mammalsbecause of disturbance from human activities and constructionequipment. Individual animals near construction areas wouldtemporarily leave the areas or otherwise modify their behavior untilconstruction activities ceased. Construction during the breedingseason may negatively affect the breeding success of some species nearconstruction activities. If construction activities occur during latewinter or early spring, disturbance impacts may be relatively highbecause of the stressed physiological condition of many animals duringthis period; however. construction activities are not expected to bescheduled during this period. Because of the small percentage of thetotal study area potentially disturbed by construction activities,impacts are not expected to be significant.3 -96.. •-..•..- •.... ..•..•....III•.. •• flit•....- ..•..•........•II
---..- ------..- -..----..-- -..Access Roads, Transmission Line, and Other Project FacilitiesThe Grant Lake Project design involves about 1.2 miles of access roadand 1.2 miles of transmission line. In addition the Project includes apowerhouse, penstock, tailrace, recreation facilities, and fishmitigation facilities. Construction of these features would produceshort-term wildlife habitat losses, especially along access roads whereextra right-of-way width would be required. These areas would beallovled to revegetate or would be reseeded following construction.Long-term wildlife habitat losses would also occur in areas covered byaccess roads, the powerhouse, and other permanent Project facilities.Although wildlife habitat would not be totally lost along areasoccupied by the transmission line, habitat would be permanentlymodified in these areas because only a low-growing plant communitywould be allowed. A total of about 30 acres of short-term habitat lossand 18 acres of long-term habitat alteration are expected as a resultof construction of these facilities, as shown on Table 3-15.The short-term and long-term habitat losses described above wouldaffect many wildlife species by temporarily or permanently loweringarea carrying capacities. This impact would mainly affect small birdsand mammals and would have little affect on larger vertebrates becausehabitat losses would be distributed along narrow corridors for the mostpart, indicating that the extent of habitat loss within individual homeranges would be small relative to home range size. Overall, thisimpact ;s not expected to be significant because of the small area ofeach vegetation type potentially affected relative to the amount ofeach type available in the study area (Table 3-17).Long-term habitat modification caused by maintenance of a low-growingplant community along the transmission line would also have minimalimpacts because of the small area involved. The impacts that do occurwould likely be positive for species preferring early successionalhabitats such as moose, and negative for forest-inhabiting species,such as certain species of woodpeckers and owls.- •- • - - - ..3-97
•---•- •Effects on Grant Lake HabitatsProject operation would involve lowering the average Grant Lake levelby approximately 5 ft from 696 ft to 691 ft above msl and then allowingit to fluctuate between 691 and 660 ft above msl (in unusually highrunoff situations, the level may briefly exceed 691 ft). Maximum <strong>lake</strong>elevations would occur in August, September, and October and minimumelevations in March. April, and May (see Vol. 1. Figure IV-16).lhis mode of operation would have long-term positive and both shortandlong-term negative impacts on wildlife. Long-term positive impactswould accrue from the creation of additional terrestrial habitat due tothe initial 5 ft of vertical drawdown. About half of the area to beexposed has substrate conducive to colonization by plants which wouldproduce additional riparian scrub and potentially upland scrub orconifer forest habitat. Because of the steep nature of the shoreline,most of the new terrestrial habitat would be added at the inlet andoutlet of the <strong>lake</strong> and a few other locations where the shoreline issomewhat flatter. The total area of additional potential habitat isapproximately 35 acres.Short-term negative impacts would also result from exposing 5 verticalft of shoreline. Some erosion would occur before revegetation.Several years would be required for this strip to revegetate to theextent needed to provide sUbstantial cover for birds and mammals whichnow use the shoreline cover. During movement between water and cover,some species would become more vulnerable to predation.Long-term negative impacts would result from the 31 ft verticalfluctuation of water surface elevation each year. This fluctuationwould virtually eliminate the value of shoreline habitat along GrantLake for beaver because of their need for underwater entrances to theirbank dens or lodges. However, as previously indicated, the smallnumber of beavers that currently utilize the marginal shoreline habitatof Grant Lake are believed to be recruits from the Grant Lake inlet..•....•..•..•..II•..IIiii• ..•.,• ..•---3-98- •
- -•-..- -•- - ..---..- ---..- ..-•-- ..- -..-creek rather than a self-sustaining population. In addition, reservoirfluctuation would severely restrict the use of Grant Lake's shorelineas nesting habitat by waterfowl and loons. Although this use is lightat present it is doubtful that the pair of arctic loons that nested in1982 (at the southern edge of their breeding range) would successfullyrenest during Project operation. Similarly, the extent of the drawdownthat would occur in spring and early summer would increase thevulnerability to predation of animals inhabiting shoreline habitatsduring this period. The spring-early summer drawdown may have a slightpositive effect on breeding spotted sandpipers and migrating shorebirdsby increasing the amount of foraging habitat.Another long-term impact on Grant Lake habitats occurs in the area atGrant Lake's outlet that currently remains unfrozen during winter.This area provided a good quality feeding area for a flock of 30 ormore mallards during the 1981-1982 winter. Many additional ice-freeareas were present during the relatively mild 1982-83 winter. With theexception of pools in Grant Creek, this was the only area within thestudy area boundaries remaining ice-free and possessing abundant,available food during the 1981-82 winter. Although the area at themouth of the tailrace in Upper Trail Lake should remain ice-free duringProject operation and partially mitigate this loss, a reduction in thewinter mallard carrying capacity is likely during moderate or severewi nters .The lower floodplain of the Grant Lake inlet creek, which providesimportant habitat to moose, beaver, other mammals, and a variety ofbirds, should continue to provide important habitat under the currentProject design. Habitats in this area are currently affected by thescouring, depositing, and flooding of the inlet creek, and by beaverdams. The floodplain area will be substantially larger when the levelof the <strong>lake</strong> is lowered. It will be affected by the same forces, and,although some degradation of channels will probably occur in the newlyexposed area, new habitat similar to that currently existing on thefloodplain is expected to develop.3-99
Dewatering of Grant CreekThe dewatering of Grant Creek would have negative impacts on manywildlife species. Immediate effects would be felt by those speciesdepending on food sources provided by the creek. Habitat for dippersand mink (which are uncommon) would be reduced in the study area sinceGrant Creek appears to provide the best habitat for both species. Theexisting limited use of this stream by waterfowl would be eliminated.Small insectivorous birds (e.g., flycatchers and warblers) would alsobe impacted as a result of the reduction in aquatic insect productionalong the stream. Some aquatic habitat should be present, however, asa result of surface runoff and groundwater infiltration below GrantLake and occasional Grant Lake overspills.A less immediate impact would be a decrease in the quality and quantityof the narrow fringe of riparian habitat present along the lowerportions of the stream. This change would reduce wildlife diversityalong the stream and would slightly reduce study area carrying capacityfor many small birds and mammals, snowshoe hare, moose, and otherwildlife.Transmission Line Collisions and ElectrocutionApproximately 1.2 miles of three-conductor transmission lines would beconstructed along the powerhouse access road. Bird collisions withconductors are not expected to be a problem for most of this lengthbecause the area is generally forested and conductor height would bebelow tree height. However, waterfowl collisions may occur at thelocation where the line would cross the narrows between Upper and LowerTrail Lakes. The extent of this collision potential would depend onthe precise design of the line and its proximity to the bridge at thislocation.Studies of avian collision mortality with larger transmission lines atten sites in Oregon and Washington, many of which were selected to.. ..............•.. •• ..••M• ............3-100..•
- ---•- •-- -•represent "worst case" situations, have not found the levels ofcollision-induced mortality to be biologically significant (Beaulaurieret al. 1982). In addition, most collisions were believed to occur withthe small overhead groundwires, which would not be used on thistransmission line, rather than with the larger more visible conductors(Meyer and Lee 1981). For these reasons and because of the lowpopulations of waterfowl and other water birds that use the study area,collision impacts are expected to be insignificant.Eagle or other large raptor electrocutions would not be a problem withthis transmission line because the conductors would be spacedsufficiently far apart or insulated and the poles would be designed toprevent electrocution.3.3.2.2 Wildlife Disturbance During Operation-- - - -•---- ---- --•- •--- -Project operation will increase human activity along access roads, atthe Grant Lake intake and at the powerhouse. The level of activity dueto Project operation is expected to be insignificant except at thepowerhouse and along its access road. As a result, moose and otherlarge mammals would not use habitats adjacent to these two areas to thesame degree as at present. Because of the small area involved,however, this impact would be insignificant.The greatest source of wildlife disturbance resulting from Projectoperation would likely be due to recreational use of access roads andthe Project recreation area as well as increased recreational use ofGrant Lake and its watershed. It should be noted, however, that thisimpact is controllable to a large extent by restricting public access.B1g game mammals and large predatory birds and mammals are the speciesmost likely to be affected. Improved access into the Grant Lake areawould increase trapping and hunting pressure and harassment ofwildlife. Increased legal and illegal trapping pressure may have asignificant effect on beaver, several of the mustelids, and possiblythe canids. Increased hunting pressure may significantly impact moose3 -101
populations in the study area. especially since they already appear lowand may be limited by present hunting pressure. Although a higherharvest of mountain goats or Dall's sheep may occur as a result ofimproved access. the fact that concentration areas for these specieswould still be sufficiently remote and that hunting of these species iscontrolled by permit would minimize this impact. Similarly. increasedblack and brown bear hunting pressure may occur. but it is unlikely tobe significant because the study area is not considered as a good bearhunting area. Increased human harassment of wildlife may also causesome impacts. especially if snow machine use substantially increases.This could be most severe during winter and early spring when animalsare under physiological stress due to bad weather and poor foodconditions. However. because of the low human population in theProject area the level of this impact is not expected to be significant.3.3.3 Mitigation of ImpactsProject impacts on wildlife would generally fall into three categories:habitat losses. increased hunting. trapping. and human disturbancepressures on the wildlife resources; and transmission line collisionnlortality. Habitat loss impacts would be generally due to constructionof access roads, the powerhouse and associated facilities. and otherProject features. and the loss of some open-water waterfowl habitatduring winter. Much of this habitat loss would be temporary and wouldbe mitigated by preparing areas disturbed by construction but notusurped by Project features for natural revegetation and by seedingareas in which erosion may be a problem. Only about 18 acres would bepermanently occupied by Project features and much of this area wouldeventually become at least partially vegetated. Project habitat losseswould also be mitigated by the permanent drawdown of Grant Lake.Approximately 35 acres of riparian scrub and potentially upland scruband conifer forest would be created by this drawdown.3-102..-..---..- ..- ..•••..•" ill..III•IIIIII!..III- .. ....- - ....• ..
..............................................................Increased hunting, trapping, and human disturbance pressures onwildlife of the study area would result partially from operation of theProject. However, the major source of this impact would be theincrease in non-Project related activities resulting from improvedhuman access into the study area. This impact could be essentiallyeliminated by closing all Project access roads to public use bymotorized vehicles. These closures, however, would eliminate thepotential of the Project to enhance human recreational opportunities inthe study area .3.4 SUMMARY OF AGENCY CONTACTSDefinition of potential impact and development of plans for mitigatingsignificant unavoidable impacts to aquatic, botanical, and terrestrialbiological resources of the Project vicinity was made largely afterconsultation with representatives of a number of state, federal, andlocal agencies, namely:ooooooAlaska Department of Fish and Game,U.S. Department of the Agriculture, Forest Service,U.S. Department of the Interior, Fish and Widlife Service,National Marine Fisheries Service,Cook Inlet Aquaculture Association, andAlaska Department of Environmental Conservation.The agency consultation process commenced with the Power Authorityasking all agencies shown above except Cook Inlet AquacultureAssocaation to review the Power Authority's interim <strong>feasibility</strong> reportin February 1982. Agency comments were used to scope further <strong>analysis</strong>of Project impacts and development of mitigation plans for fish. No3-103
major mitigation actions for botanical and terrestiral biologicalresources beyond those identified in the interim <strong>feasibility</strong> reportwere recommended. Based on the initial aency comments and follow-upconversations with agency representatives, additional limited studiesof water temperature regimens and sedimentation potential in Grant Lakewere instituted. Agency representatives visited the site with thePower Authority in June 1982. In the summer and extending into autumn,an extensive series of meetings with agency personel was held primarilyto discuss fish mitigation. Some of the elements discussed affecteddevelopment of the Project recreation plan.The following is a summary of pertinent agency contacts made in supportof this report. Correspondence between the Alaska Power Authority andvarious agencies is included in the Technical Appendix, Part VIII.Alaska Department of Environmental Conservation1 ) Date:Agency Representative:location:Subject:2) Date:Agency Representative:location:Subject:3) Date:Agency Representative:location:Subject :.3-104December 22, 1981Robert Martin (Anchorage)(Memorandum)Agency request to review andcomment on Environmental Study PlanDecember 28. 1981Robert Martin (Anchorage)( letter)Transmittal of Environmental StudyPlanJanuary 6, 1982Robert Martin (Anchorage)( Memorandum)Request to study changes in flowregimes to Grant and Falls Creeks•'"..•III..IIIIII.......•....•"..I'iii.. ..•....-•..•.,II
----•-•- •-•-•-•-•- •---•---•-•4) Date:Agency Representative:Location:Subj ect:5) Date:Agency Representative:Location:Subj ect:Agency Representative:Location:Subject:Alaska Department of Fish and GameAgency Representative:Location:Subject:3) Date:Agency Representative:Location:Subject:Apri 1 29, 1982Hon. Ernest Mueller {Juneau}( Letter)Transmittal of Environmental StudyPlan for commentJune 3, 1982Dan Wilkerson (Anchorage)(Telephone conversation)Review of Environmental Study Plan,definition of potential problemsJune 9, 1982Robert Martin (Anchorage)(Memorandum)Agency comments on EnvironmentalStudy PlanNovember 17, 1981Carl M.(Letter)Yanagawa (Anchorage)Request for recommendations formitigation of fish, wildlife, andbotanical resources impacted by theProjectFebruary 1, 1982Tom Arminski {Anchorage}(Telephone conversation)Effects of road development on goatand sheep hunting-•- ..- ---3-105
4) Date:Agency Representative:Location:Subject:5) Date:Agency Representative:Location:Subject:6) .Qate:A9.ency Representative:Location:Subject:7) Date:Agency Representative:Location:Subject:8) Date:Agency Representative:Location:Subject:3-106Apri 1 29, 1982Hon. Ronald O. Skoog (Juneau)(Letter)Transmittal of Environmental StudyPlan for commentMay 14, 1982Tom Arminsky (Anchorage)(Telephone conversation)Receipt of Environmental StudyPlan, plans for mitigative measuresMay 20, 1982Hon. Ronald O. Skoog (Juneau)( Letter)Agency comments on InterimEnvironmental Assessment. InterimReport and Environmental Study Plan(DNR comments attached)June 30. 1982Carl M.( Letter)Yanagawa (Anchorage)Transmittal of cost of power dataassociated with Projectalternatives, notice of meeting 9July 1982 to discuss the ProjectJune 30. 1982Loren Flagg (Soldotna)(Telephone conversation)Discussion of plans for Trail LakesHatchery•..II....- ..- ....II..•IIItil•....•..•..•........•IIII
-•-9) Date: July 29, 1982•Agency Representative: Loren Flagg (Soldotna)-Location: (Telephone conversation)• Subject: Discussion of fish mitigation-alternatives for Grant Creek• 10) Date: July 30, 1982-Agency Representative: Tom Arminsky (Anchorage)•-Location: (Telephone conversation)Subject: Discussion of fish mitigation-• alternatives for Grant Creek11) Date: August 6, 1982•Agency Representative: Dave Daisy (Anchorage)- Location: ( Letter)•-Subject: Transmittal of Interim Engineeringand Environmental Reports•-12) Date: August 6, 1982•Agency Representative: Hon. Ronald o. Skoog (Juneau)- Location: ( Letter)Subject: Agency comments on Instream FlowEvaluation Letter Report-13) Date: August 24, 1982Agency Representative: Loren Flagg (Soldotna)-Location: ( Letter)Subject: Agency cost estimate for conducting• an evaluation <strong>project</strong> for GrantLake Salmon Studies-14 ) Date: August 1982 (day unknown)Agency Representative: Dave Daisy (Anchorage)- Location: (Telephone conversation)•-Subject:Discussion of fish mitigationalternatives for Grant Creek-•3-107- - -
15) Date:Agency Representative:Location:Subject:Agency Representative:Location:Subject:11) Date:Agency Representative:Location:Subj ect:18) Date:Agency Representative:Location:Subject:19) Date:Agency Representative:Location:Subject:3 -108September 1,1982Tom Arminski (Anchorage)( Letter)Invitation to attend fishmitigation planning meetingSeptember 15, 1982September 21, 1982Dave Daisy (Anchorage)( Letter)Estimating costs of fish mitigationfac i1 it iesSeptember 21, 1982Loren Flagg, Jeff HartmanAnchorageSummary of meeting heldSeptember 15, 1982, cost estimatesfor fish mitigation facilitiesSeptember 28, 1982Loren Flagg (Soldotna)( Letter)Clarification of position - costestimation for salmon monitoringprogramOctober 11, 1982Jeff Hartman (Anchorage)( Letter)Acknowledgement of contribution tocost estimates for fish mitigationfacilities" IIIIii.. .." iii•..•..••III..•"II1II.. ".,.... ..•...... ......••II
-..-..-..-- -•20) Date:21) Date:22) Date:23) Date:- ..----..-..- -•- - ..- -----•- ..Agency Representative:Location:Subject:Agency Representative:Location:Subject:Agency Representative:Location:Subject:Agency Representative:Location:Subject:October 21,1982Jeff HartmanAnchorageSummary of meeting held October 6,1982, cost estimates for fishmitigation facilitiesNovember 3, 1982Phil Brna (Anchorage)(Telephone conversation)Review of fish mitigation planNovember 15, 1982Phil Brna (Anchorage)(Telephone conversation)Confirmation of ADF&G position onfish mitigation planDecember 3, 1982Hon. Ronald O. Skoog (Juneau)( Letter)Transmittal of summary of minutesof meeting on fish mitigation heldNovember 10, 1982Alaska Department of Natural Resources, Division of ParksAgency Representative:Location:Subject:3-109December 3, 1982Ms. Judy Marquez (Anchorage)( Letter)Transmittal of summary of minutesof meeting on fish mitigation heldNovember 10, 1982
•IIICity of Seward1) Date:Agency Representative:location:Subject:Cook Inlet Aquaculture Association1) Date:Agency Representative:location:Subject:2) Date:Agency Representative:location:Subject:3) Date:Agency Representative:location:Subject:4) Date:Agency Representative:location:Subject:3-110December 3, 1982Mr. Ronald A. Garzini( letter)Transmittal of summary of minutesof meeting on fish mitigation heldNovember 10, 1982August 4, 1982Tom Walker (Soldotna)(Telephone conversation)Discussion, cost estimation of fishmitigation facilitiesAugust 5, 1982Tom Walker (Soldotna)(Telephone conversation)Discussion of fish mitigationfacilitiesAugust 6, 1982Tom Walker (Soldotna)(Telephone conversation)Discussion of fish mitigationfacilities, alternate <strong>project</strong>sJuly 14, 1982Sidney logan (Soldotna)( letter)Invitation to attend mitigationplanning meeting•..III..•III..•- .... •.. •....•III..III•II1II•....•.. •..••....•• ..
-..- - ..-..-•..•-•..•-•-•- - - -..-•---..5)Agency Representative:Location:Subject:6) Date:Agency Representative:Location:Subject:Kenai Peninsula BoroughAgency Representative:Location:Subj ect:National Marine Fisheries Service1) pate:Agency Representative:Location:Subject:2) Date:Agency Representative:Location:Subject:August 27. 1982Tom Walker (Soldotna)(Letter)Transmittal of summary of meetingminutes August 11. 1982. Grant LakeHydroelectric ProjectDecember 3. 1982Tom Walker (Soldotna)(Letter)Transmittal of summary of minutesof meeting on fish mitigation heldNovember la, 1982December 3. 1982Hon. Stan Thompson( Letter)Transmittal of summary of minutesof meeting on fish mitigation heldNovember la, 1982November 11, 1981Ronald Morris (Anchorage)( Letter)Request for recommendations formitigation of fish, wildlife andbotanical resources impacted by theProjectJanuary 25, 1982Ronald Morris (Anchorage)(Telephone conversation)Status of Environmental Study Plan- •....-3-111
3) Date:Agency Representative:Location:Subject:4) Date:Agency Representative:Location:Subj ect :.5) Date:Agency Representative:Location:Subject:6) Date:Agency Representative:Location:Subj ect:7) Date:Agency Representative:Location:Subject:8) Date:Agency Representative:Location:Subj ect:3-112April 29, 1982Robert McVey (Juneau)( Letter)Transmittal of Environmental StudyPlan for commentJune 2,1982Robert McVey (Juneau)( Letter)Agency comments on EnvironmentalStudy PlanJune 30, 1982Ronald Morris (Anchorage)( Letter)Transmittal of cost of power dataassociated with Projectalternatives, notice of meetingJuly 9, 1982 to discuss the ProjectJ u 1 y 1 5, 1982Robert McVey (Juneau)( Letter)Summary of Letter Report andmeeting on Instream FlowsAugust 10, 1982Brad Smith (Anchorage)(Telephone conversation)Comments on Fish MitigationPlanning Document No. 2August 11, 1982Robert McVey (Juneau)( letter)Agency comments on instream flowstudies, Letter Report and meeting• ....III•-•- •- - - •- •..•-..II.. ••.... "•..- -"..•
- - ---•-•-..-•- •-•- •-- - ----- ---•9} Date:Agency Representative:Location:Subject:10} Date:Agency Representative:Location:Subj ect:11} Date:Agency Representative:Location:Subject:National Park Service1} Date:Agency Representative:Location:Subj ect:U.S. Environmental Protection AgencyAgency Representative:Location:Subject:September 1, 19828rad Smith (Anchorage)( Letter)Invitation to attend fishmitigation planning meetingSeptember 15, 1982October 28, 19828rad Smith (Anchorage)(Telephone conversation)Agency position on fish mitigationfacil itiesDecember 3, 1982Robert McVey (Juneau)( Letter)Transmittal of summary of minutesof meeting on fish mitigation heldNovember 10, 1982December 3. 1982Mr. John Cook (Anchorage)( Letter)Transmittal of summary of minutesof meeting on fish mitigation heldNovember 10, 1982December 3, 1982Richard Summer (Anchorage)( Letter)Transmittal of summary of minutesof meeting on fish mitigation heldNovember 10, 1982- - -3-113
u.s. Fish and Wildlife ServiceAgency Representative:Location:Subject:2) 2ate:Agency Representative:Location:Subject:3) Date:Agency Representative:location:Subject:4) Date:Agency Representative:Location:Subject:5) Date:Agency Representative:Location:Subject:November 17, 1981Ms. Mary Lynn Nation (Anchorage)( Letter)Request for recommendations formitigation of fish, wildlife, andbotanical resources impacted by theProjectDecember la, 1981Ms. Mary Lynn Nation (Anchorage)( Letter)Review of Environmental Study PlanApril 9, 1982Robert Boken( letter)Agency comments regardingFeasibility StudiesApril 29, 1982Keith Scheiner (Anchorage)( letter)Transmittal of Environmental StudyPlan for commentJune 1, 1982Ms. Mary Lynn Nation (Anchorage)( Memorandum)Summary of meeting with Ms. NationMay 25, 1982 on Environmental StudyPlanIIII• ..- .. ....- ..- ..- • ....•..•.. ..•........- ..- -..3-114•III• ..
- 6)Date:June 8, 1982Agency Representative: M. Monsen (Anchorage)...Location:( Letter)Subject:Agency comments on EnvironmentalStudy Plan and InterimEnvironmental Assessment7) Date:June 30, 1982-Agency Representative: Ms. Mary Lynn NationLocation:( Letter)--Transmittal of cost of power dataassociated with Projectalternatives, notice of meeting--July 9, 1982 to discuss the Project8) Date:August 17, 1982-Agency Representative: Gerald ReedLocation:( Letter)Agency comments on instream flowsSeptember 1,1982Ms. Mary Lynn Nation( Letter)Invitation to attend fishmitigation planning meetingSeptember 15, 1982December 3, 1982Keith Scheiner (Anchorage)( Letter)Transmittal of summary of minutesof meeting on fish mitigation heldNovember 10, 19823-115- - •Subj ect:•-Subj ect:9) Date:•Agency Representative:Location:- Subject:-10) Date:Agency Representative:Location: -•- Subj ect:----•
U.S. Department of Agriculture, Forest ServiceAgency Representative:Location:Subject:2) Date:Agency Representative:Location:Subj ect:3) Date:Agency Representative:Location:Subject:4) Date:Agency Representative:Location:Subj ect:5) Date:Agency Representative:Location:Subject:November 17, 1981Geof Wilson (Seward)( Letter)Request for recommendations formitigation of fish, wildlife, andbotanical resources impacted by theProjectFebruary 2, 1982Geof Wilson (Seward)(Telephone conversation)Permission to access study areaMarch 31, 1982Clay Beal (Anchorage)( Letter)Special Use Permit applicationApri 1 1. 1982John Mattson (Anchorage)( Letter)Request to review EnvironmentalStudy PlanApr; 1 29, 1982Clay G. Beal (Anchorage)( Letter)Transmittal of Environmental StudyPlan for comment•l1li• ..- ..- ..- - - •...•-•••••••..-..-3-116•..
- 6)-Date:May 14, 1982Agency Representative: Ken Thompson (Anchorage)(Telephone conversation)Agency comments on EnvironmentalStudy PlanMay 14, 1982Seof Wilson (Seward)(Memorandum)..Agency comments on Environmental.. -Study Plan8) Date:June 28, 1982Agency Representative: Seof Wilson (Seward)( letter)Acknowledgement of permission toconduct field studies--June 29, 1982Agency Representative: Seof Wilson (Seward)( letter)Summary of notes from meeting onEnvironmental Study Plan of June 8,1982, request for review and commentJuly 13, 1982Seof Wilson (Seward)( letter)Summary of meeting on EnvironmentalStudy PlanJuly 14, 1982.. -Clay Bea1 (Anchorage)Location:( Letter)..Subject:Transmittal of archaeology report•..-3-117--Location:-Subject:-7) Date:Agency Representative:-• Location:Subject:- Location:•Subject:-•9) Date:- Location:Subject:- 10) Date:Agency Representative:-Location:-•Subject:11) Date:Agency Representative:
12) Date:Agency Representative:Location:Subj ect:13) Date:Agency Representative:Location:Subject:14) Date:Agency Representative:Location:Subject:August 9, 1982Ken Thompson (Anchorage)(Telephone conversation)Discussion of fisheries mitigationOctober 5, 1982John Mattson (Anchorage)( Letter)Request for comments on CulturalResources section of EnvironmentalReportDecember 3, 1982Clay Beal (Anchorage)( Letter)Transmittal of summary of minutesof meeting on fish mitigation heldon November 10, 1982.. ..•..III..•..- -..-III..-•.....,•III......III....III..3-118-II....III
Confidentiality NoticeUnder the provisions of the Archaeological Resources Protection Act and the National HistoricPreservation Act, site location information is confidential; disclosure of such information is exempt fromrequests under federal and state freedom of information laws. This report is not a public document.For these reasons, Section 4.0 REPORT ON HISTORICAL AND ARCHAEOLOGICAL RESOURCES has beenremoved.
-..-..- --- -..5.0 REPORT ON SOCIOECONOMIC IMPACTSThis section describes the socioeconomic impacts of the Grant LakeHydroelectric Project and the area in which the impacts will occur.The section is divided into eight parts: 1) Socioeconomiccharacteristics; 2) Socioeconomic trends; 3) Impacts on localgovernmental, educational, and social services; 4) Project employmentand payrolls; 5) Construction personnel; 6) Housing availability fortemporary and new employment; 7) Residences and businesses displaced bythe Project; and 8) Local government fiscal effects.-----.,5.1 SOCIOECONOMIC CHARACTERISTICS OF THE PROJECT VICINITY5.1.1 The Socioeconomic Impact Area----.,-..---....-..-..Construction of the Project will cause socioeconomic impacts primarilyin the southeastern portion of the Kenai Peninsula Borough. Thespecific area likely to be impacted includes the corridor along theSeward-Anchorage Highway (State Highway 9) from Seward north throughthe community of Moose Pass to the intersection with State Highway 1,and extending west along Highway 1 to the community of Cooper Landing.This area is shown in Figure 5-1.The Project site lies approximately 25 miles north of Seward, 2 milessouth of Moose Pass, and 24 miles east southeast of Cooper Landing,which are the only three Census deSignated places within the impactarea (U.S. Dept. of Commerce, Bureau. of the Census 1981). CensusdeSignated places are the smallest geographical divisions for which1980 Census data are published. The next closest Census designatedplaces to the Project site are Hope, approximately 45 miles to thenorth and west of Highway 1, and Sterling, approximately 70 miles tothe west on Highway 1. Anchorage is about 102 miles north of theProject site by way of State Highways 9 and 1 •5-1
..--....- ..- ..- •- • ..•l1li•..•..• ..•5 o 5ImilesALASKA POWER AUTHORITYSOCIOECONOMICIMPACT AREAFIGURE 5-1EBASCO SERVICES INCORPORATED....• ....-..-..•..
-- --- - - -----..-..The socioeconomic impact area includes parts of two 1980 Censussubareas, the Kenai-Cook Inlet and the Seward subareas, which comprisethe Kenai Peninsula Borough Census Area. Within each subareapopulation figures are estimated for one or more Census designatedplaces, communities for which population and selected Census data arereported. Only one Census designated place in the Seward subarea, theCity of Seward, is located in the impact area. Seward is one of twohome rule cities in the Kenai Peninsula Borough. The remainder of theKenai Peninsula Borough lies in the Kenai-Cook Inlet subarea, of whichonly two Census designated places, Cooper Landing and Moose Pass, liewithin the socioeconomic impact area. Table 5-1 shows available 1960,1970, and 1980 population figures for the Borough, subareas, and threeCensus designated places.---Virtually all construction materials should reach the Project site byway of Highways 1 and 9, from Anchorage to the north, Soldotna throughCooper Landing to the west, or Seward to the south. The constructionlabor force will be drawn primarily from the Seward, Moose Pass, andCooper Landing areas, with some additional workers possibly relocatingtemporarily to the Project impact area from either the Soldotna orAnchorage vicinities.5.1.2 Population Characteristics---.... --Because the socioeconomic impact area includes portions of two Censussubareas lying outside designated places, the 1980 population of theimpact area can be estimated by summing Census figures for the threedesignated places within the impact area and estimating the populationoutside these places. Most of the population within the Seward subareaoutside of designated places, which totaled 650 in 1980 (U.S. Dept. ofCommerce, Bureau of the Census 1981), lies within the Railbelt areaaround and to the north of the City of Seward, and therefore within the• impact area. A very small percentage of the non-designated place-•-- 5-3-•
TABLE 5-1•- • ..Kenai Peni nsu1 a BoroughKenai-Cook In'let Subarea bl blbl16,5(.16 25,28222,47352- ---•- ••HISTORICAL POPULATIONKENAI PENINSULA BOROUGH, CENSUS SUBAREAS,AND CENSUS DE~IGNATED PLACES WITHINTHE SOCIOECONOMIC IMPACT AREA!!Population% ChangeGeographical Area 1960 1970 1980 1960-1970% Change1970-80% Change1960-80Cooper Landi ng 88 31 116 -65Moose Pa ss 136 53 76 -61Se\i1ard Subarea bl bi2,~O92744332-44-II•..•iiiCi ty of Sewa rd 1,891 1,587 1,843 -16Non-Oesigndted Place Area£1 614 533 650 -21. Socioeconomic Impact AreaTotal Rows 3, 4, 6, and 7 2,789 2,204 2,6b5 -21162"22-3-4-4.. ••....- •..•- •State of Al aska 226,167 302,583 401,851 343378al F,'om U. S. Dept. Commerce, Bureau of the CPIISUS 1981.bl Data not availdule from Census.c/ Estimated by apply; ng I'ates of change for desi ynated places illsocioeconomic impact areas to 1980 figures.5-4..•..- •
-,.-,.-,.---,.- --- - - --- -,.-,.- - ,...,.-,.-,.population of the Kenai-Cook Inlet subarea lies within the impactarea. Total 1980 population of the impact area can be estimated bysumming the populations of each Census designated place in the impactarea and the non-designated place component of the Seward subarea. Theresults are shown in Table 5-1.The impact area estimated population of 2,685 (69 percent of which isaccounted for by the City of Seward) constitutes only about 0.7 percentof the 1980 population of the State of Alaska. The vast majority ofthe population in the impact area is white, as indicated by 1980 Censusof Population figures for the City of Seward (U.S. Dept of Commerce,Bureau of the Census 1981):WhiteBlackAmerican Indian, Eskimo, AleutAsian and Pacific IslanderOtherTotal Seward Population1,564723816181,843Estimated population change in the socioeconomic impact area between1960 and 1980 is shown in Table 5-1. While there has been considerablepopulation change within the communities of Moose Pass and CooperLanding during the past 20 years, the area's overall population duringthis period experienced little net change. However, from 1970 to 1980definite population growth is apparent. This growth is reflected inState of Alaska's 1981 population estimate for the City of Seward of1,943 (Alaska Department of Labor 1981), an increase of 5 percent overthe 1980 Ce nsus.The City of Seward supports a fairly large transient population, risingduring the summer months and falling off in the winter. Housingvacancies, therefore, are low in summer and moderately high levelduring winter. There are several motels and hotels in Seward and twomotels in the Moose Pass area that supplement available rental5-5
housing. Howp.ver, in the past the lack of housing for year aroundoccupancy by Project workers has caused some large contractors totransport temporary housing facilities to the area (Shaeffermyer1982). This practice is often the case with Alaska construction<strong>project</strong>s.5.1.3 Economic Characteri sticsThe A1 aska Departrnent of Labor, iii cooperati on with the U. S. Dept. ofLabor, compiles employment information according to the CensusDiVisions, geographica-I units, used prior to the 1980 Census. TheSeward Division comprises an area approximating the socioeconomicimpact area shown in Figure 5-1, but extends north along theSeward-Anchorage Highway to Turnagain Arm, Cook Inlet. The majority ofits popUlation and labor force reside in or near the City of Seward.Employment figures and statistics for the area, therefore, characterizeemploympnt in tne impact area.Table 5-2 shows quarterly employment for broad non-agriculturalindustrial classifications in the Seward Division for seven quarters in1979 and 1980. The table indicates that the sectors employing thelargest numbers of persons, for which employment data are available,are state and local government. services, retail trade, and the federd1government. Governmental offices located in Seward include the citygovernment, Forest Service, National Park Service, and a vocationaltraining center. Important services provided in Seward include twohospitals serving regional needs. Services and retail trade in Sewardalso support a locally important tourism industry.Large employment groups are not snown on Table 5-2 due to disclosurerules. In fact the non-reported employment during 1979-80 average 39percent of total employment, which demonstrates the significance of asmall number of large employers. Moreover, these large employersoperate on a largely seasonal basis, as evidenced by the significantincrease in employment in the not-reported category from 267 in thefirst quarter of 1979 to 854 in the third quarter of that year.5-6-•.. ••- -..-.. ..•....••III•.... •.. •..•..••-..-..- •
..- - TABLE 5-2-tWN-AGRI CUL TURAL EMPLOYMENT BY QUARTERSEWARD DIVISION 1979-1980~- - 1979 1980-Industrial-- Mi ni ng bl...Construction 70 7 13 3 ail•Manufacturi ngQuarter Quarter Seven QuarterCl assificati on 1st 2nd 3rd 4th 1 st 2nd 3rd AverageE..I- Trans, Commun.,& Ut il. 33 46 63 47 53 51 41 48,- Wholesale Trade-Retai 1 Trade 142 193 215 158 131 154 194 170-Fi nance, Insurance,-Real Est. 13 16 15 14 16 16 18 15Services 156 176 198 187 200 174 168 180Fed Gov't 59 74 86 55 47 59 84 66-State & LocalGov't 298 300 301 328 309 317 295 307- Miscellaneous 16 12 13 14~/,-tJot Reported 267 600 854 455 472 ' 575 642 527- -TOTAL 968 1491 1732 1244 1228 1365 1468 1,357- ~I Alaska Dept. of Labor 1979-1980.~I -- Not available due to disclosure rules.-£1 Figure expected to be high estimate due to lack of fourth quarterdata.•-~I Average based on incomplete data series.•-- 5-7-
Unreported employment subsequently dropped to 455 in the fourthquarter. Much of this unreported employment is with two businessestablishments operating in the City of Seward: Seward Fisheries' fishprocessing plant and Louisiana-Pacific's Kenai Lumber Company (Dunham1982) .The economy of the Seward Division and especially the City of Sewarddepends a great deal on three important transportation facilities:Seward's deep water port, the Alaska Railroad, and the Anchorage-SewardHighway. The deep water port supports d fishing industry and bulkcargo facility linked by the railroad and highway to Anchorage andpOints north. Se\oJard's port is generally ice free during winterperiods when the Port of Anchorage is forced to curtail operations.Table 5-3 presents average monthly labor force and employment figuresfor the Seward Division for the period 1975 through 1981 and for 1981.These figures illustrate the highly cyclical nature of employment inthe area. Average employment from 1975 to 1981 ranged from 1574 inAugust to 1130 in January. Unemployment rates fluctuated in a reversemanner, ranging from 7.4 percent in August to 16.1 percent in January.Historically the labor force level has fluctuated along withemployment. Labor force fluctuation is a function of two factors: atransient population in the Seward Division and particularly the Cityof Seward (Shaeffermyer 1982); and a lessened effort by the unemployedto find work during the winter months, thus removing themselves frombei ng considered members of the 1 abor forc e. Du ri ng 1981. however,labor force seasonal variation \'1as less than the 1975-1981 average.The difference between peak and low labor force levels in 1981 was 297,while the 1975-1981 average difference was 355. While several causesmay be responsible for the declining difference beboJeen peak and lowlabor force levels, the decline suggests the Seward labor force may bemoving toward a lower level of transience and greater seasonalstability and acceptance of seasonal fluctuation in local employmentopportuniti es.5-8..--..•- ......-•III•..•III•.. ••..•III•.... .... ..•-..-....• ..
........ -- TABLE 5-3HISTORICAL MONTHLY CIVILIAN LABOR FPRCE AND EMPLOYMENTSEWARD DIVISIO~-.. 1975-1981Average 1981.. -Labor Unemp. Labor Unemp.Month Force, Employment, Rate, Force, Employment, Rate,No. No. % No. No. %..--"" Jan 1347 1130 16.1 1515 1201 20.7Feb 1408 1195 15.1 1463 1196 18.3Mar 1425 1224 14.1 1470 1226 16.6- Apr 1557 1344 13.7 1465 1281 12.6May 1625 1425 12.3 1599 1384 13.4.. - Jun 1653 1483 10.3 1645 1463 11.1-..Jul 1702 1562 8.2 1760 1610 8.5Aug 1700 1574 7.4 1671 1531 8.4Sep 1563 1432 8.4 1601 1410 11.9OCt 1556 1373 11.8 1626 1374 15.5.. - Nov 1524 1296 15.0 1567 1298 17.2Dec 1477 1249 15.4 1514 1261 16.7-.... -Average 1545 1357 11.2 1575 1353 14.2-a/ U.S. Dept. of Labor, Bureau of Labor Statistics 1975-1981...-..-..-..5-9-..
Monthly wage rates for the Seward Division are shown in Table 5-4.These wage data show a pronounced upward trend over time and revealseveral sectors in which relatively high wages are paid. Theconstruction sector pays by far the highest wages in the SewardDivision, averaging $3,065 per month. At significantly lower levelsare state and local government wages at $2,044 per month,transportation, communication, and utilities monthly wages at $1,709,and federal government monthly wages at $1,688. The average wage was$1,405 per month. Wage rates are thought to have increasedsubstantially over these figures in 1981 (Dunham 1982)... ..-..- - - ..- - - --..5.1.4 Public PoliciesPolicies of the City of Seward favor economic growth in the vicinity(Shaeffermyer 1982). The city has prepared and is following a land useplan (CH2M Hill 1979) that encourdges industrial expansion, emphasizinggrowth in marine facilities and possible development associated withouter continental shelf exploration and development. The City alsostrongly endorses assessing the <strong>feasibility</strong> of constructing theProject. This support is expressed in several Seward City Councilresolutions (City of Seward 1980).5.2 SOCIOECONOMIC TRENDSRecent population forecasts applicable to the socioeconomic impact areasuggest population growth rates varying from less than 1.5 percent to5.0 percent per year (CH2M Hill 1979; Simpson Usher Jones, Inc. 1979;Kenai Peninsula Borough 1982, R.W. Beck and Associates 1982, BatellePacific Northwest Laboratories, 1982). Projected population growthratios used herein are those of the Battelle Northwest Electric PowerAlternatives Study (Battelle Pacific Northwest Laboratories)corresponding to a low economic scenario in the Railbelt as a whole. Apopulation annual average growth rate of 3.49 percent is assumed forthe period 1980-1985, 1.59 percent for the years 1985-1990, and0.75 percent for the years 1900-1995.•- •••• ..•••----..- - •5-10
-....TABLE 5-4-AVERAGE MONTHLY WAGES BY QUARTERSEWARD DIVISION1979-1980• a /-Wages in Dollars-1979 1980Industri a1 Quarter Quarter•C1 assification 1 st 2nd 3rd 4th 1 st 2nd 3rd Average-•b/Mi ni ng.. Manufacturi ng.. -Trans, Commun.,& Uti 1. 2175 1377 1300 1720 1721 1819 1854 1709.. -Wholesale TradeRetai 1 Trade 838 685 866 824 921 893 870 842-Fi nance, Insurance,..Real Est. 1092 963 1057 1037 985 1085 968 1027Services 917 870 881 933 870 940 1031 920-Fed Gov't 1589 1651 1453 1922 1797 1538 1868 1688State & Local..Gov1t 1724 1838 2025 1689 2256 2367 2410 2044Mi sc 1472 1504 2226-Constructi on 3547 2775 2893 3065~/- 1734~/- ALL CLASS-IFICATIONS 1277 1251 1458 1288 1403 1557 1599 1405- ~/ Alaska Dept. of Labor 1979-1980...~/ Not available due to disclosure rules.- £/ Average based on incomplete data series •..-..-..5-11-
The population <strong>project</strong>ion of Table 5-5 suggests a total populationgrowth between 1980 and 1995 for the impact area of 1.996. overtwo-thirds of which is <strong>project</strong>ed for the City of Seward.Employment <strong>project</strong>ions prepared for the Kenai Peninsula Borough (KenaiPeninsula Borough 1977) assumed an employment labor participation ratefor 1980 of approximately 0.39. growing to between 0.40 and 0.46 by1992. The intermediate participation rate for 1992 was approximately0.45. The employment labor participation rate is the proportion of thetotal population actually employed.Projected employment for the impact area based on intermediate level.full employment labor participation rates and the population<strong>project</strong>ions of Table 5-5 are given in Table 5-6. As Table 5-6indicates. <strong>project</strong>ed employment rises from an estimated 1980 level of1.062 to 1,598 in the year 1995, a net increase of 536. Because thisemployment <strong>project</strong>ion is based on intermediate growth assumptionsinvolving no growth surge in anyone industrial sector, thedistribution of employment should, with one exception, continue toapproximate that shown in Table 5-2. The exception is the area ofmari ne services, in which employment may ri se abruptly as a result ofconstruction of the Fourth of July Industrial Marine Park near Seward.Growth of the Marine Park may bring additional jobs to the Seward areaduring the early and mid-1980s. possibly resulting in employment andpopulation growth rates exceeding those in Tables 5-5 and 5-6. TneCity of Seward's municipal and utility services. including watersupply. sewage, telephone, schools, police, fire protection. andmedical facilities are able to support the higher growth rate (CH2MHi 11 15:179; Ci ty of Seward 1980).Per capita personal income in the Seward Census Division has risensubstantially during the last decade. Nominal, or current dollar, percapita personal income rose from a 1970 figure of $4,299 to $11.408 by1979 (U.S. Dept. of COlilJlerce, Bureau of Economic Ana1ysi s 1982), an5-12•.... ............•-..•- • ....lit..••..••....•..•..•-......•..
-..-..------•TABLE 5-0POPULATION PROJECTIONSSOCIOECONOMIC IMPACT AREA1980-1995~/AreaNumbers of People1980 1985 19901995City of Sewa rd1,843 2,188 2,3682,458- -•-- - - -..- - ..- -•--..-- --OtherTOTAL650 772 8352,685 3,188 3,4499673,681~ Projections assume average annual population growth rate of 3.49percent for period 1980-1985, 1.59 percent for period 1985-1990, and0.75 perc ent for peri od 1990-1995.~~oosePa ss76 90 97101Cooper Landi ng116 138 1491555-13
YearTABLE 5-6EMPLOYMENT PROJECTIONSSOCIOECONOMIC IMPACT AREA1980-199~/Employment1980 1,0621985 1,3011990 1,4971995 1,598a/ Based on Kenai Peninsula Borough 1982.- •..•- --..- --....- -...... •......•....- -........- ..5-14-..• ..
..-..-..-..--..-..-..-..-..-..-..-..-..-..-....-..average annual increase of 11 per'cent. While this rate of increase isunlikely to be sustained, the area can be expected to enjoy a continuedrise in per capita personal income during the next few years. Asindicated above, the socioeconomic impact area's population andemployment are <strong>project</strong>ed to grow at a moderate rate of economic growththat will support a commensurate rise in personal income •.. S.3 PROJECT IMPACT ON LOCAL GOVERNMENTAL, EDUCATIONAL, AND SOCIALSERVICESThe Project will generate virtually no new permanent employment in thesocioeconomic impact area. Employment resulting from the Project willinvolve construction and be temporary. Impacts on governmental,educational, or social services associated with Project installationwill be limited to the construction period •While some temporary relocation of construction personnel to theProject site or Moose Pass area might occur, most of these personnelshould commute from the Seward area. Some of the construction laborforce estimated to average about 30 (see Section 5.4) may come fromoutside the socioeconomic impact area, because many of the majordevelopment <strong>project</strong>s in Alaska are carried out by companies andpersonnel based outside the development area (Dunham 1982). If any newfacilities are needed in the vicinity of the Project site to supporttemporary construction workers, they will be provided by either theconstruction contractor or by the workers. Workers temporarilyrelocating to the Seward area can be accommodated by existingservices. Local governmental services and utilities in the Sewardvicinity are well equipped and accustomed to supporting temporaryconstruction activities and personnel •The school district in the socioeconomic impact area includes theentire Kenai Peninsula Borough. Elementary children living near MoosePass attend school at Moose Pass Elementary School through the eighthgrade, then commute to Seward for high school. Ifl 1981 enrollment at5-15
Moose Pass Elementary School was 34, while Seward elementary and highschool enrollment totalled 448. Total school district enrollment was6,037 (Kenai Peninsula Borough School District [No Date]). Anyincrease in school enrollment attributable to Project construction willtherefore have a relatively minor effect on the school system.Construction vehicle traffic, including heavy equipment and workervehicles, on State Highway 9 between Seward and Moose Pass willincrease highway wear, disrupt traffic, and inconvenience localresidents. A cooperative agreement between the Alaska Power Authorityand the Al aska Depa rtment of Transportati on and Publ i c Faci 1 iti esshould accommodate any maintenance proolems on state roads.5.4 PROJECT CONSTRUCTION EMPLOYMENT AND PAYROLLSThe construction period for the Project is estimated to beapproximately 24 months. Construction will begin with clearing andbuilding access roads, followed by tunneling activities for the powerconduit. In April and May of the first year of construction, work onthe transmission line, powerhouse, and tailrace will begin. Work onthese facilities will continue at an intensive level into September, atwhich time the <strong>lake</strong> tap, tunnel, transmission line, and access roadswill be completed. By December of the first year work will begin onthe installation of electrical and mechanical components. Startup willtake pl ace in May of the second yea r.The average 1 abor force on the job duri ng the 24 month constructi onperiod will number approximately 30 or approximately 2 percent of thearea's labor force, but only about half that number will work duringthe winter months (November through March). Skills required of theconstruction labor force include heavy equipment operation, drilling,welding, iron working, concrete finishing, and electrical andmechanical work. Employment will peak at perhaps 50 workers during thesummer of the second year of construction.5-16-..-..- ..--- • ..•- .....•..lit• ..........- ..-......- •..
- - -..-..-..-..-..-..- •-..-..-..-..-..-..-..-..-..-•A conservative estimate of the total construction payroll in 1980dollars using the average construction wage rates in the Seward CensusDivision is $1.84 million, or approximately $77,000 per month. Thisestimate assumes an average monthly wage of $3,Ob5 (see Table 5-4), anaverage work force of 30, except during the winter months, and aconstruction period of 24 months. This wou1a represent an increase inincome to the socioeconomic impact area of approximately 3 percent overthe 24 month construction period ($1.84 million/$ll,OOO est. per capitaincome in 1979 x 2685 est. 1980 population). Inflationary pressures,higher salaries for supervisory personnel, and competition for trainedconstruction labor with other major construction <strong>project</strong>s in Alaska maypush the total Project payro11 higher than this estimate, butchronically high unemployment rates in the socioeconomic impact areawould tend to reduce these pressures to some extent.5.5 CONSTRUCTION PERSONNELThe construction labor force is expected to come principally from thesocioeconomic impact area, mainly Seward, with some additionalconstruction workers from Anchorage and the western Kenai Peninsula.Although the average total construction employment in the Seward CensusDivision in 1979 and 1980 was only 30, the Seward area labor forcepossesses a relatively large proportion of workers with constructionskills (Dunham 1982). Construction personnel will probably commute tothe Project construction site, possibly by contractor bus from acentral pOint in Seward. Since the construction skills needed to buildthe Project will be available primarily in the metropolitan Seward areaor from outside the socioeconomic impact area, a relatively smallpercentage of the Project construction labor force is expected to comefrom nearby communities such as Moose Pass and Cooper Landing.The capability of the Seward area to provide most of the constructionlabor force is supported by the decline in construction employment inthe Seward area during the last few years and a rising unemploymentrate in the Seward area.Unemployment rose to 14.2 percent of the5-17
labor force in 1981 (see Table 5-5). However, the number of localworkers who will be employed in constructing the Project will alsodepend largely on the policies of the construction firm.5.6 HOUSING AVAILABILITY FOR TEMPORARY AND PERMANENT NEW EMPLOYMENTIn 1980 the number of housing units in the Seward Census subareatotaled 1,186 (U.S. Dept. of Commerce, Bureau of Census 1981), of which777 were located within the City of Seward. Housing in the vicinity ofSeward, along with two motels in and near Moose Pass, can be expectedto provide most of the housing accommodations for Project constructionworkers.Temporary construction workers will be able to draw upon approximately250 apartment units in Seward (Kenai Peninsula Borough 1982) as well asa limited number of motels and hotels located in Seward and near MoosePass. Alttiough some new housing is planned in Seward, recent trendssuggest that the number of housi ng uni ts there wi 11 ri seinsignificantly in the near future. Only two new single family housingunHs were authori zed each in year' 1980 and 1981. In 1979, 50 newhousing units (46 of which were multiple family) were authorized forconstruction (Kenai Peninsula Borough 1982). However, construction ofthe Fourth of July Creek Industrial Marine Park is expected tostimUlate some new housing demand (Gillespie 1982).Rental vacancies in the Seward vicinity are cyclical, ranging fromabout seven percent in the winter to near' zero in the summer (Gillespie1982). This cyclical demand reflects the seasonal variation in severalimportant employment sectors described above in Section 5.1, and thedemand for rental housing associated with recreational pursuits in thesocioeconomic impact area.•-•....-- -..-- -..- -•- •- -•..•..•- •- •-While tnere may be some competition for rental housing between newtemporary employment associated with Project construction and othertransient workers and recreationists, the combination of a relatively5-18-..• ..
- - - •- •-•-•-•- •- •-1 arge stock of rental hOlJsi ng units and small antici pated new temporaryProject construction work force shoul d mi nimi ze the severity of suchcompetition. Further reducing competition for rental housing will bethe common occurrence of recreational demand for housing units onweekends and the occurrence of worker demand for rental units duringweekdays.Virtually no new permanent employment is expected to result fromoperation of the Project. The Project will be automated to operatewithout a large full-time staff, and maintenance of the Project will bea part time activity. Maintenance of recreational facilities isexpected to be carr; ed out by the Forest Service on a cooperativebasis. The Project is therefore not expected to produce any permanenteffect on the region's housing.5.7 RESIDENCES AND BUSINESSES DISPLACED BY THE PROJECTThe Project will be constructed entirely on undeveloped federally-owned1 ands havi ng few improvements. Moreove r, si nce the Project will notresult in a raised water level in Grant Lake, no business or temporaryor permanent residence will be displaced.- 5.8 LOCAL GOVERNMENTAL FISCAL EFFECTS--small impact on schools and local governmental, educational, and socialservices. The school system and local services are adequate to addressany such impacts without expansion or adverse effect.--The Project will produce virtually no direct positive local fiscalimpacts because the Project's construction and operation will be exemptfrom local sales and property taxes (Lahnum 1982). Some positiveindirect impacts will develop as a result of increased local spendingof wages and the consequent positive impact on local sales taxes. The-•Kenai Peninsula Borough levies a two percent sales tax while the city- •Construction and operation of the Project will produce a relatively-5-19•
-•---------•of Seward collects an additional one percent tax on retail sales.Total local sales tax benefits will not, however, amount to more than afew thousand dollars.5.9 SUMMARY OF AGENCY CONTACTSThe following is a summary of pertinent Agency contacts made in supportof this report. Correspondence between the Alaska Power Authority andvarious agencies is included in the Technical Appendix, Part VIII.Alaska Department of Community and Regional Affairs1) Date:Agency Representative:Location:Subj ect:2) Date:Agency Representative:Location:Subject:Alaska Department of Labor1) Date:Agency Representative:Location:Subject:5-20January 19, 1982Gene Kane (Anchorage)(Telephone conversation)Availability of data on communitysocioeconomic characteristics forGrant Lake vicinityJune 22, 1982Gene KaneAnchorage, AlaskaAcquisition of data on forecasts ofsocioeconomic characteristics inProject vicinityJanuary 19, 1982Willard Dunham (Seward)(Telephone conversation)Characteristics of labor force andsource of labor data for Seward andvicinity•-•..•-•••- ••....•..•------..
-..-..- -..-- ..-..-..-..-..- - - - ---..Kenai Peninsula Borough1 ) Date:Agency Representative:Location:Su bject:City of Seward1 ) Date:Agency Representative:Location:Subject:2) Date:Agency Representative:Location:Su bject:June 18, 1982Carolyn Thompson and Jeff LaBahnSoldotna, AlaskaLand ownership and state andBorough withdrawal plans forProject vici nityJanuary 18, 1982Darryl Shaeffermyer, Assistant CityManager(Telephone conversation)Potential sources of Grant LakeProject construction 1 abor andprobable area affected by Projectconstructi onJune 17, 1982Darryl Shaeffermyer and Kerry MartinSewa rd, Al askaAcquisition of data on localsocioeconomic conditions andcha racteri sti cs-..-..-..-..5-21
..•-..- •..•..•..•....•....•- • ..•- •..- -•....- •-•..iii..•6.0 REPORT ON GEOLOGICAL AND SOIL RESOURCESThis chapter presents the results of exten~ive geological and soilssurveys conducted in the Project vicinity an~ site-specificinvestigations conducted for Project planning and design. In additionto describing regional and Project site geology and soils, this chapteridentifies potential geologic hazards, the potential Project impacts ongeologic conditions, and the need for mitigating such potential impacts .6.1 GEOLOGY AND SOILSThe geologic study area for the Grant Lake Hydroelectric Project isdefined as the area within about 10 miles of the Project site, and forthe specific sites on which Project facilities will be located •6.1.1 Regional GeologyThe morphology of the study area is typical of sub-arctic, glaciatedterrains. Broad U-shaped valleys dissect the mountain ranges and formlowlands with <strong>lake</strong>s, ponds, and streams (Figure 6-1). Elevations inthe study area range from 470 ft above mean sea level (MSL) at UpperTrail Lake to over 5000 ft in the adjacent mountains. Much of theregion was stripped clean by the movement of glaciers, leaving bedrockexposed over large areas •Within the mountainous areas, topography is rugged and slopes typicallysteep. Hanging valleys are common. Small glaciers occur at the headof most major valleys.Lowland areas are typically elongated with varying amounts of alluvialinfilling. Some of the east-west trending valleys, notably the GrantLake and Kenai Lake valleys, have nearly right-angle bends where theyintersect the major north-south trending lowlands. This morphologyreflects diversion of side glaciers at their intersection with themajor southward moving glaciers.6-1
..... y ••• "-",N30,.. ', 1N ••• 'y ••••• >" ,::.~..... , -,,- .... ,.,"""C::."i·ti! . .\«,;·1" ~>-....... - "".... -'~it}.... ~ .. - •... ,.....,...-~ -............ ~."'" -, .. \ ..." ~'".... "' .... , '--, ," ~i\'1"-i"+-; i Ii '!I Ij,; ,~ ,/ (\ ',)'.l2·'··.i~,.ALLUVIUMAVALANCHE DEBRISTALUS ROCK GLACIERGRANT CREEK FAULTLINEAR FEATURES VISIBLEON AERIAL PHOTOGRAPHSAND SATTELITE IMAGERY.'NOTES:TOPOGRAPHIC DATA FROM U.S.G.S. MAPS,SEWARD B6-B7.18\ \(3000'IoISCALE3000I6(X)01I3QOo" " ~.'\.,""- ',.~.,\".FIGURE 6-1EBASCO SERVICES INCORPORATED6-2
--..•- ......- ........-II.. ..........-..-- ..Str!ams are common within the lowland areas, as are <strong>lake</strong>s and ponds •In several areas elongated ridges of relatively low relief formfoothills to the major mountain peaks. One such ridge forms the areabetween Grant Lake and Upper Trail Lake. These bedrock ridges paralleltile trend of the adjacent valley. Small bogs, formed in bedrockdepreSSions resulting from glacial scour, i'lre common on the ridgetops. Many bogs are elongated in the direction of glacial flow .The bedrock in the study area is a compl ex assortment of metamorphosedsandstones, siltstones. and mudstone with some fine-grained volcanicunits (Tysdal and Case 1979). Extensive glacial deposits are absent.~linor glacial till deposits may exist at the base of some of the bogsand <strong>lake</strong>s, and within some of the coves along Upper and Lower Trail<strong>lake</strong>s.Unconsolidated surficial deposits are relatively rare in the study area(Figure 6-1). Alluvium is found at the head of Grant Lake, in the areabetween Lower Trail Lake and Kenai Lake, within a few of the covesaround the Trail Lakes, and within the small bogs found in the low,bedrock ridges flanking the Trail Lakes valley. These deposits aretypically mixtures of silt, sand, and gravel. Minor sand and graveldeposits are also found at the mouth of Grant Creek and Falls Creek.Poorly sorted mixtures of cobbles, gravel, sand, and silt occur at thebase of the major avalanche chutes and are the result of transport byIII snow avalanches during the winter and spring. These deposits are localand not extensive.......•..•..-Talus deposits are rdre in the study area, despite the steep ~lopes •The one exception is in the area between Falls Creek and Solars~10untain. In this area, large talus slopes of angular sandstoneboulders and cobbles extend from the small cirque at the top of themountain down the steep slopes into Falls Creek. The lobate morphologyof the deposits suggests that they constitute a rock glacier .6-3
• ..TIle complex deformational history of the bedrock in the study area hasresul ted ina 1 arge number of structural features. The primaryfoliation in the bedrock is parallel to bedding. r40st units strikeapproximately north 5 degrees east (N05E) and dip ~S to 55 degrees tothe east. Joints are common throughout the area. Joint orientationsvary widely, although there are minor maxima oriented north-south (NS)to NE-Sl~ dipping between 50 and 90 degrees to the south or southeast.Minor faults and fracture zones were discovered in several areas. Twofracture directions are dominant. One set trends NE and the otherN-NW. Both sets are evident on aerial photographs and satellite imagesdue to differential erosion (Figure 6-2). Grant Creek follows the mostohvious of these NE trending features, which has been named the GrantCreek Fault. Other NE trending fractures are evident as discontinuouslinear features.The Trail Lakes valley is a long, north-trending valley that extendsfrom the town of Seward northward to Upper Trail Lake. It has beencalled the IIKenai lineament ll since it is obvious on satellite imageryas a long, linear feature. The trend of the valley is nearly parallelto the N-~M fault, and the Kenai Lineament may represent one of thesefault zones that was extensively eroded during the glacial period. Itis unlikely that the Kenai Lineament represents a major, active fault.t~ore likely it is a glacial valley whose orientation and locationfollowed the N-NW trend of the minor fault set observed in other areas.Several areas within the study area have been mined for gold. Thereare three small-scale mines in the study area. The Case Mine is justnorth of the mai n bend in Grant Lake. It consi sts of several hundredfeet of adits following quartz veins. Although not currently active,the present owners are planning additional test adits along the traceof the shear zone. The Crown Point ~1ine also consists of adits, and islocated near the top of the peak between Grant Lake and Falls Creek.Although not currently active, the Crm'm Point "1"ine was once asuccessful gold mining operation. The third mining operation is a6-4I!I•IIiii...................II...II..iii..• .... ....ill•....II- .....,.•
-'~~~:----......_LLEGEND.--" ..... - ...... -.~ ...... ~ .... --_m:O IIIIIIIALLUVIUMu.. nlllllllllAVALANCHE DEBRISctb!~ F:-::::\/:/':JTALUS/ROCK GLACIERI/',PROMINENT LINEAR FEATUREDASHED WHERE EXTENSIONIS NOT CLEARMAPPED FAULT AND SHEARZONES-EXTENSION DASHED•/ WHERE BURIEDUpper-...........-.-.....--.-...- ..... ~~=-... = ... =--""...,.---=.\ ~/==_::~: r:: ~ - --:' ~I--_A_L_AS_KA_P_OW_ER_. _AU_TH_OR_IT_Y ----I..... ~_m_ ..... _ .. - -- --- - ._-- -_. -'--- ---+ _. ____ . ___ ~~ r-.-:..-=::.:.:..-' - --_ ~ GRANT LAKE HYDROELECTRIC PROJECT6-5~-------------------------4GEOLOGIC FEATURESOF STUDY AREAFIGURE 6- 2EBASCO SERVICES INCORPORATED
•- •- •- •- •- •- •-•- •- •placer mine at the outlet of Falls Creek. The operation currentlyconsists of several small dozers and sluices. Farther up Falls Creek,several mining claims exist, as well as the Old Falls Creek Mine. Theextent of workings in this area is unknown.The Case Mine, Crown Point Mine, Old Falls Creek Mine and claims on theupper part of Falls Creek probably all lie on a series N-NW trendingshear zones that have been the locus of mineralization. Theintersections of these shear zones and Falls Creek are the probablesource of the gold that is being recovered in the placer operation atthe base of Falls Creek.No other zones of mineralization have been identified in the studyarea. The field investigations and exploratory borings identified noarea or zone with mineralization of potential economic value.In addition to mineralized zones, other mineral resources include sandand gravel deposits and sites for rock quarries. The major sand and---..gravel operation is in a stream bed just north of Se\'Iard. No majorrock quarries were found, although numerous small quarries were used aslocal sources of road and rai1bed material s.6.1.2 Site Geology- --- •-•- 6.1.2.1 Powerhouse CoveThe powerhouse site is within a small, elongated valley roughly 1000 ftlong and 500 ft wide at the proposed powerhouse site (Figure 6-3). Thevalley 1 ies within a bedrock depression formed by glacial erosion, andis adjacent to and drains into Upper Trail Lake. Elevations within thevalley range from the water line of Upper Trail Lake (about 470 ftabove MSL) to 500 ft above MSL along its eastern margin.-••6-6
N362,100EXPLANA TIONN362,600" .//1//,1 i1/·"t-.-.- SEISMIC LINE SHOWING GEOPHONE LOCATION* SHOT POINT~ BOREHOLE LOCATION)'!N3I2,500UPPER TRAIL:,LAKEN362,400, '.ojSO·I I ,CONTOUR INTERVAL 5 FEEToI60'I120'ISCALE IN FEETN3I2,30030ALASKA POWER AUTHORITYGRANT LAKE HYDROELECTRIC PROJECTDEPTH TO BEDROCKl CD-m~ - ..mI ,....-CDau,\1POWERHOUSE COVEFIGURE 6-3EBASCO SERVICES INCORPORATED8-7
-- •The bedrock within the powerhouse valley is similar to that outcroppingthroughout the area. Two exploratory borings indicate the presence of- massively bedded greywacke with some interbedded slate and thinner•-greywacke beds.•.. ..Seismic refraction profiles within the valley indicate a layer ofsedimentary infilling averaging 5 to 25 ft in thickness, with locallyhigher thicknesses over bedrock lows (Figure 6-3). The two exploratory-..borings penetrated 28 ft {DH-1} and 18 ft (DH-2) of soils ranging fromsand and silt near the surface to poorly sorted mixtures of cobbles,- ..gravel, sand, and silt at depth. The lower materials may representglacial till or outwash, while the upper material is probably younger- ..stream or <strong>lake</strong> bed sediment. None of the material is consolidated.-No direct observations of geologic structure could be made due to the..overlying thickness of overburden. Data from the borings and outcrops-surrounding the valley suggest that the bedding within the bedrock..strikes to the north and dips at 45-55 degrees to the east, parallelingthe regional trend. Joints observed in the two exploratory borings-..dipped between 45 and 80 degrees.- ..Analysis of aerial photos, satellite imagery and topographic mapsindicate a long linear feature trending N-NW from the eastern side of- Vagt Lake along the eastern side of the powerhouse valley, and possiblyextending several thousand feet to the north. The linear feature-represents a steep cliff face that forms the eastern shore of Vagt Lakeand the eastern boundary of the powerhouse valley. Ground and aerial•-..investigations of this feature along its length revealed no positiveevidence of fault control, although it is likely that it is an oldfault. Its present topographic expression is the result of- ..differential erosion during glacial advances, rather than movement.- ..- ..- ..6-8
6.1.2.2 Power Tunnel and IntakeThe power tunnel and intake would be completely within the bedrock thatfonns the ridge between Grant and Upper Trail <strong>lake</strong>s. The rocks aretypical of the bedrock throughout the area, and are composed ofmetamorphosed sedimentary rocks of the Valdez Group. The predominantrock types are greywacke, slate, and mixtures of the two. Fieldinvestigations and exploratory borings indicate that the greywacke isan extremely hard and dense metamorphosed sandstone of varyingcompositi on.Bedding along the tunnel alignment parallels the regional trend. Mostunits strike to the north, and dip 45 to 55 degrees east. Joints arecommon throughout the area, although their orientations vary widely.Minor shear zones were encountered in the exploratory borings along thetunnel alignment. Most shear zones have been completely healed \vithcalcite or quartz infilling. In addition to the minor shear zonesencountered in the exploratory bori ngs, analysi s of topography andaerial photographs indicates several N-NW trending linear featurescrossing the tunnel alignment. It is likely that these linear featuresmark the trend of minor faults.The single exploratory boring in the intake area revealed two open andweathered shear zones that parallel the bedding orientation. These twozones are interpreted as bedding-plane failure surfaces, resulting frommovement of slabs of massive greywacke. The occurrence of these zoneswould be expected where the dipping beds face the shore of Grant Lake.6.2 GEOLOGIC HAZARDS6.2.1 SeismicitySeismic hazards include vibratory ground motion, ground rupture,seismically-induced slope failure, seiche, and liquefaction. Thepotential occurrence of each of these hazards is discussed below.6-9••..•.. .... ....••....•......II• lilt•......•....III.. .... ......IIII
...I•- •- •- •- •- •- •- •-•- •6.2.1.1 Vibrato Ground MotionProject.magnitude of 5.5.techniques.interval of 50 to 100 years.--•- --..-..-..- •Deterministic <strong>analysis</strong> of the sources of earthquakes, their distancefrom the Project site, and the potential accelerations at the siteindicate that the mega-thrust zone beneath southern Alaska and therandom crustal event are the primary sources of seismic hazard for theRandom crustal events are then considered IIf10ating" andpotentially could occur anywhere. For calculation purposes, the randomcrustal event is considered directly beneath the Project site.Table 6-1 is a compilation of all the known sources of earthquakes thatare close enough to the Project site to have significant impact. Themaximum credible earthquake (MCE) has been calculated for eachstructure. The MCE for the random crustal event was chosen asmagnitude 6.0, a conservative upgrade from the maximum recordedThe peak acceleration value for each potentialearthquake source was calculated using the most recent, acceptedAs indicated on Table 6-1, the maximum calculatedacceleration at the Project site is 0.40 gravity (g) from the randomctustal event and 0.37 g from the 1964-type Aleutian Arc megathrust.Return periods for these maximum events were estimated using historicaland instrumental earthquake data. Based on the estimated returnperiods and the time since the last major event, the likelihood of suchevents was estimated for the life of the Project. The likelihood ofanother 1964-type event on the megathrust is low for the life of theProject because the return period exceeds 160 years. The likelihood ofa large random crustal event is moderate to high, with a recurrenceHowever, the location of this event couldbe anywhere, so that the probability of such an event occurring at theProject site is actually quite low.6-10
TABLE 6.1CHARACTERISTICS OF SEISMIC SOURCESC.i)I....•••• I I I I 11 I • IIE.tim'l1!dSauteeTyp •• fDittalt!;e fromhult tentlll RuptureFaultPr.ject SiteltnglllR.ndom Cru.talEvent - 3km - -Aleuti •• T",nch·ArtMeg.thru.t IM.in M.gal'h",.1 30 to 35km 2,000 km SOOkmThru.t!Benioff Zone Megal'hMt 1Hm - -Cntf. Mountal ••Caribou F.ultOblique SirikHlip 127 km 200km 120km140kmKnik-8orderRang .. Fault Reverse 48km 1.700km 120 kmJohn.tone Bay Fault No""al (?) BHm 20 to 70 km IOkmHanning Ray Fault ReY.rse l08km Um Bkm"'non Say fault Reverse 118 km 500km SZkm._---_ ..Volcanic - 18ekm -O.n.1i FaullSlnk ... slip .nd1.000 to 400 toy.klllga & ShumiganMegal'hru.1255 to 300 kmSeismic G"",2,OOOkm SOObnCIIIctJI6tlon methods uStld It indicated by ~~ num~rrl MCf C.lcUMtion. "'",d priman1y on Sfemmon. (1977) u.ingmim.llldfUP/IJI./ength inrttad.f 'o'a/length wfI'ffappropriatt.11 MCf calcularion _d on KY .. (1980),3J B,,~d on the illttrument fBCOfdt!d se;smidty.! Bruin Bay hul, Reven. 125km 300km'-----------...- ....frlStoritilStismicityOisplaumentMinimumat Recent MCE' Dista~e toSedimenbtpir;enterSe:tsmic activityup to magnitude None 316.0 Um5.5Very high Trace not visible11 8.5mognitude 8.4 bu' .... ci.ted Okm21 8.1In 1964 offset in 1964Associated.ehmicity up None 31 7.5 60kmt.7.5Associatod Of/sotil 7.4lOismiclty up '0 Hoiocenem.gnitude 7.021 7.4sediments127 kmAssociatedseismicity up to None II 1.4 125tmmll!lnihld. 1.3Of/so,No .. late glacial 11 7.5 I 48kmmOTlinesNoneActiv.duringlfollowingthe 1964 .orthquak.Actiwduring/loll owingIII. 1964 earthquakeSe.rp in 111.4Holocene talus 2) 6.0Offsetduring the1964 e.rthquakeOllu!during !he1964 earthquake11 4,82) 5,411 &.121 6.9St~micActivity up None 11 5.75to magnitude 5,5High t.lowraetnt activity; 01118'Vtry high histori, Holocen. 11 8.6leismicityndiments7. to 8.+Gfoond Marion Pa"metrn from the following IOlJfreS:r. Pall"", aI., 1972I. Krinitrrky, 1978; 8(!1(, of obserwd dalJ1limi'3. BoI~ 1973.,. 50 pen:entilt value, Joyner & Boor., 19815. 50 p.rc ..,,1...Iu., C.mpbell, 198167km108 km118 km188 km280km..",. Cempbell ,,,field IIIl11m.li .. d .. Iue "'" used fOl' r!iSlJ1nct. ow, 50 km.TIM Joyner & Boor, equ,,;ons Mnt used for 8.0+ mtntJ w""'out modificllti'Dft,•• .-IE.timal1!dO.plll toFOCU13 km30 t. 35 km40km15km15km15km15km10km10 km15km15'040 kmI •'eak"Acceleration in0'" 5D Perce.tiIeValue(ttimatedReturn Period410.36 50 to 100510,4D yeon4, 0.36 160 to 300,510.31 yeon41 0,06510.01100 ye ...410.03 ' Not5) 0.01 determined2) 0,03 Not51 0,01 determin.d4) 0,11 No'5) 0.01 determined41 0,04 No'51 0,01 determined4) 0.01 Not510,01 determined410.02 Not510,01 determined41 0,01 Not51 0,01 determined4) 0.01 80 '0 2005) 0.01 yeanSource: Crsn' lon Hyd,oel ..,,;. Proie
-..-.. 6.2.1.2 Ground Rupture-•-•-..--..-..-..------..Ground rupture is associated with the movement of active fault zones •There a re no known acti ve faults crossi ng the Project features. Noseismic events have been associated with known structures around thesite, and no geologic data have been found to suggest the presence ofactive faulting. Ground rupture, therefore, is not considered a hazardfor the Project... 6.2.1. 3 Sei smi cally Induced Slope Fail ureOne of the most caunon features associated with moderate to largemagni tude earthquakes is slope fail ure. Tri ggered by ground moti on,naturally unstabl e slopes can fai 1. Slope failures can be broadlyclassified into landslides, rockfalls, avalanches, and slab or tumblingfailures of rock faces.There is little material in the study area that would be susceptible tolandsliding during seismic events. No evidence was found in the majorlandslides or their deposits, although some minor landslide debris wasnoted uphill from the intake area.Rockfalls from the steep cliffs could occur during seismic shaking.Some evidence of minor rockfalls has been found in the study area,although the triggering mechanism is unknown. The cliff on the easternside of the powerhouse valley is a potential source of rockfalls. Thedesign of the Project and slope treatments will address thispossibility.Seismically induced avalanches could occur in the mountains above theProject. The topography around the Project facilities themselvessuggests no hazard from avalanche. The effects of large landslides,rockfall s, or avalanches around the shore of Grant and Trai 1 <strong>lake</strong>s arediscussed below.- --- - - - -6-12
Slab or tumbling failure of rock faces during seismic events is commonin areas of unstable rock slopes. The western shore of Grant Lake isparticularly susceptible to such failures, as the slopes are steeplydipping slopes of bedrock. Data from the exploratory boring in theProject intake area suggest that bedding-plane slides have alreadyoccurred. The design of the Project and cut slopes will address theproblem of potentially unstable slopes in the intake and gate shaftarea.6.2.1.4 SeicheSeiches are waves in <strong>lake</strong>s that are fonmed by the sloshing of waterback and forth as the result of ground shaking during seismic events orthe catastrophic inflow of material by slope failures around the <strong>lake</strong>'srim. There are several areas surroundi ng Grant Lake that coul d besources of earth or avalanche material for mass movements into GrantLake, which could generate seiche waves. However, field work did notreveal any areas along the shoreline of Grant Lake where wave damageabove normal high water levels was noted. This observation suggeststhat significant wave run-up did not occur during the 1964 earthquake.Further, the volumes of material that could enter Grant Lake areprobably not sufficient to generate very large seiche waves.Investigations around Lower and Upper Trail Lakes indicate that thesurrounding topography coupled with the shallowness of the <strong>lake</strong>sthemsel ves present Significantly less hazard from seiche. There arealso no areas of material that could generate large waves by massmovement into the <strong>lake</strong>s. The present design of the Project indicatesthat it will not be susceptible to damage by seiches that might beexpected to occur in Grant or Trail Lakes.6.2.1.5 LiquefactionLiquefaction is the failure of loose, water-saturated sediments underseismic ground shaking. However, major Project features would beplaced on or in bedrock, so no liquefaction problem will exist.6-13..II..II.. ............•• ..•• Ii:..1l1liII•".,iii..• II
- - ..- -•The groundwater table along most of the tunnel al ignment is at or nearthe ground surface. Bedrock penneabilities are very low so thatseepage problems will only occur at the intersection of the tunnel withopen joi nts or fractures.6.2.2 Seepage-•-•- --- ---anticipated to be severe.lining) will be such thatProject operation.6.2.3 SubsidenceSeepage problems during construction are notTunnel design (small diameter with shotcreteseepage wi 11 be mi nor and unimportant duri ngThere a re no Project faci 1 iti es located ina reas suscepti bl e tosubsidence. Although large areas of southwestern Alaska eitheruplifted or subsided during the 1964 earthquake, such large scalechanges woul d have had no impact on the Project.6.2.4 t~iningAlthough there are several active and inactive mines around Grant andTrail <strong>lake</strong>s, none of these mining activities are near the Projectsite. No exploratory shafts or old mines exist near the Project.-• 6.2.5 Mass Movement~'lass movements or slope failures, including landslides, rockfalls,- - --•- ------avalanches, and slab failure, were discussed above as possible resultsof seismic activity. The rock cliffs overlooking the powerhouse valleycould be the source of small rockfalls, triggered either by seismicactivity or seasonal freeze-thaw. Examination of the many cliffs inthe area, however, suggests a high degree of stability. No potentiallandslide material exists around the powerhouse valley or the tunnelalignment.6-14
..- •Avalanche chutes are cOlllTlon along the steep slopes in the mountainsaround Grant Lake and Trail Lakes. Little evidence of avalanche wasfound on the ridge between Grant and Trail Lakes, indicating littledirect hazard to Project facilities in these areas.- -•--•The intake area on the western shore of Grant Lake faces the greatestnazard from unstable slopes, prirnari ly due to the steeply dippingslopes of bedrock. Evidence of bedding plane failures was discoveredin the exploratory boring in the intake area, and field mapping datasuggest episodes of land and rock sliding uphill from the shore. Thissituation is common along the entire western shore of Grant Lake due tothe steep topographY and the attitude of the bedding. Appropriatemeasures, such as rock bolting and installation of lateral drains, willbe taken to ensure safety of the gate shaft and intake area.6.2.6 ErosionThe lack of significant soil cover or alluvial deposits indicates thaterosion would be a minimal problem during construction and operation ofthe Proj ect.6.2.7 Hazards Induced by Reservoir Fluctuation6.2.7.1 Slope Fail ureThe operational water level fluctuation of Grant Lake could triggerslope failures, especially along the north shore of the <strong>lake</strong> wherelarge lobes of avalanche deposits exist. Failures are not expected tobe large or hazardous to safe Project operation.6.2.7.2 Reservoir-Induced SeismicityIn many areas of the world, filling of reservoirs or large fluctuationsin <strong>lake</strong> or reservoir levels trigger small to medium magnitudeearthquakes. It is critical to understand, however, that the water.. ....•..- ••.........•..•.....II••..IIIl1li6-15"I
- -•-•..•..•- - ----pressure changes merely act as triggers for these events, and do notactually cause stress build-up in the rocks. The bedrock materialsmust a 1 ready be stressed and prone to earthquake activi ty ifreservoir-induced seismicity is to occur. Grant Lake is an existingreservoir that has already experienced a variety of changing stressesto reach its present state. Little, if any, reservoir-inducedseismicity is expected during Project operation. Any shocks that mightoccur would likely be of small magnitude, especially compared to thegeneral earthquake potential for the area. Therefore, this type ofearthquake generation will present no hazard to the Project orsurroundi ng areas.6.3 POTENTIAL IMPACTSThe Grant Lake Hydroelectric Project would be a small scale power- generating facility. The impacts of the Project would be small, and•- - - - - - - - - - - -•-•- •- •mitigation measures can De designed to minimize impacts both duringconstruction and operation. Geologic impacts center primarily arounderosion, slope failure, and disposal and use of excavated materials.Primary impacts during construction would revolve around the movementand operation of personnel and equipment required to construct theProject, and handling of waste rock from the powerhouse site and thetunnel. Because the tunnel's diameter is small and the tunnel lessthan 3000 ft long, the volume of excavated rock, approximately 10,000cubic yards, would not be a major problem. Furthermore, much of therock excavated from the tunnel and the powerhouse foundation couldprovide an excellent source of material for construction of tailraces,the powerhouse, and associated structures. Residual material could beremoved from the site and used elsewhere as rockfil1 or disposed ofwith no adverse impacts.Excavations in tne powerhouse cove will require removal of some of thesedimentary valley fill. Standard techniques would be used to preventsilt movement into Trail Lake; these include drainage ditches,retaining structur~s and settling ponds. As a result, the impacts ofconstruction of the Project would be minimal.6-16
•-•-•None of the planned construction activities would likely cause slopefailure around the Project site. Project design would includestabilization of the natural slopes, especially in the intake area.Operation of the powerhouse would unlikely have any detrimental impactsin terms of erosion or slope failure.6.4 MITIGATION OF IMPACTSNo extraordinary mitigation measures would be anticipated duri ngconstruction or operation of the Project. Nonnal erosion controlmeasures would be sufficient to control the minimal erosion expecteddu ri ng constructi on. Rapi d recovery of the vegetati on afterconstruction is completed will finish the erosion control program.The Project would leave no slopes more unstable than at present, and inboth the intake and powerhouse areas slope stabilization measures wouldbe undertaken to ensure safe construction and operation of the Project.6-17-•-lilt••••....•..III•..'"•.. ....••-•- •
- -•7.0 REPORT ON RECREATIONAL RESOURCES- - - ..--This report addresses existing recreation resources and use in thegeneral and immediate vicinity of the proposed Project, plannedrecreational development associated with the Project. estimates ofcurrent and future recreational use of the Project vicinity,recreational land management considerations, and agency consultationand recommendations concerning the recreation aspects of the Project..._....•-•..•- •....7.1' REGIONAL RECREATIONAL RESOURCES AND USELands within the Project vicinity and the surrounding region arepredominantly undeveloped public lands with high scenic andrecreational values. The Kenai Peninsula attracts considerablerecreation and tourism from residents of the region. the Anchoragearea, other parts of the state, and outside of Alaska. Whilerecreational activities that take place in the Kenai Peninsula arehighly varied, freshwater and saltwater fishing appear to be the mostpopular activities, and largely drive many of the other types of use onthe Kenai Peninsula. These activities and the recreation resourcessupporting them are described according to agency jurisdiction in moredetail below. Recreation facilities and areas which are near the MoosePass section of the highway corridor are shown in Figure 7-1 •-- - - ..-•- •......!IIIThe Forest Service, United States Department of Agriculture (USDA),administers the Chugach National Forest, which encompasses essentiallythe northeastern quadrant of the Kenai Peninsula as well as other landsabutting Prince William Sound and the Gulf of Alaska. The peninsulaportion of the forest is divided between two ranger districts,headquartered at Anchorage (also the location of the ForestSupervisor's Office) and Seward. Major attractions of the AnchorageDistrict include the visitor facility at the Portage Glacier, which is2657A7-1- 7.1.1 Forest Service
12LEGENDIAI CAMPGROUND--_.... FOREST SERVICE TRAILS·········UNMAINTAINED TRAILS--EXISTING ROADS--PROPOSED ROADSALASKA POWER AUTHORITYGRANT LAKE HYDROELECTRIC PRO..ECTKENAILAKERECREATION RESOURCESEBASCO SERVICES INCORPORATED
- •-•-- - -the singlf! most frequently visited recreation facility in Alaska(Hennig 1982), and two winter sports areas. The Anchorage Districtalso maintains eight campgrounds, with a total of 142 units. TheSeward District includes a number of large <strong>lake</strong>s, and during certainperiods of the year receives heavy recreational use centered on theKenai and Russian Rivers and Kenai Lake. Peak use periods on thedistr'ict generally coincide with the timing of salmon runs.- - - - ------------•--•Developed recreation faci 1 i ties provi ded by the Seward Ranger Di strictinclude eight campgrounds with a total of 240 units, two boat ramps, apicnic ground, and several recreation cabins, organization sites, andrecreation residences. Five of the campgrounds (Russian River, CooperCreek, Quartz Creek, Crescent Creek and Tern Lake) are located on orvery near the Sterling Highway (Alaska Highway 1) in the western partof the district. The Russian River campground is the most popularfacility, ranking third in the state in visitation after PortageGlacier and Denali National Park (Hennig 1982); the Cooper Creek andQuartz Creek campgrounds often function as overflow areas for RussianRiver during peak fishing activity. Use of the Trail River, PtarmiganCreek, and Primrose campgrounds, which are located along the Seward-Anchorage Highway (Alaska Highway 9, locally known as the SewardHighway) south of Moose Pass, tends more toward transient use asopposed to destination use.Total recreational use on the Seward District during fiscal year 1981was estimated at 442,400 recreation visitor days (RVDs), representingapproximately 40 percent of the nearly 1.1 million total RVDs for theChugach National Forest (USDA, Forest Service 1982a). Developed use inthe Seward District amounted to about 106,000 RVDs during FY 1981, or24 percent of the total for the district. The eight campgroundsaccounted for roughly 70,OUO RVDs, with 33,200 RVDs for Russian Riveralone. Oi spersed recreati on typically accounts for the 1 a rgest sha reof all use, primarily due to the time spent sightseeing, driving forpleasure, or otherwise using roads within the National Forest.Nonroaded, dispersed recreation during 1981 included 56,700 RVDs oftrail use and nearly 41,000 days of recreation on <strong>lake</strong>s, rivers, and-..7-3
streams. Annual recreation data sufficient to identify trends do notexist, but use of the Chugach National Forest has increased at amoderate rate ill recent years (Devore 1982).The eastern side of the Seward District, primarily the area borderingthe Seward Highway from Upper Trail Lake southward, does not receivethe heavy use of the Kenai-Russian River area, but does contain severallocations that are popular for backpacking, hunting, and other uses.Most of the developed recreation in this area is focused on Kenai Lake,as there are three campgrounds, a boat launch, and a picnic area on ornear the <strong>lake</strong>. The two recreation cabins at Paradise Lakes areextremely popular, and must be reserved well in advance for summer use.Visitor use data for a number of specific recreation facilities in thisportion of the Seward District are presented in Table 7-1. t40st ofthese facilities are Inapped in Figure 7-1. The developed facilities inthe area generally receive light to moderate use, although utilizationrates at the campgrounds can be high on summer weekends. Trail RiverCampground is the largest of three campgrounds, with 43 units currentlyopen for use (half of the original campground has been closed), andalso receives the most use. Over the 104-day managed season, the 7,800RVDs at Trail River represent an average occupancy level (people at onetime, or PAOT) of 37 people, or about 17 percent of theoreticalcapacity. In comparison, average occupancy at the much larger RussianRi ver Campground is about 160 peopl e, whi cll represents 18 percent oftheoretical capacity (USDA, Forest Service 1982a).In genera 1, a uti 1 i zati on rate of between 20 and 40 percent oftheoretical capacity is considered appropriate, because campground uselevels cycle weekly and are unevenly distributed over time. In thiscase, however, the similar uti1ization rates for the two facilitiesreflect the very large capacity needed to handle Russian River activitypeaks during salmon runs, and the closure of half of the Trail River7-4..- .. ....- •- ..--..••.... '"•....•....ill.. ..•.. ..........III
- - ..-..........- ...-..-..- - --liltFacilityPtarmigan Creek campgroundPrimrose campgroundTrail River CampgroundTrail River Picnic LoopPrimrose Landing Boat LaunchSubtotal, developedTABLE 7-1RECREATION USE FOR SELECTED SITES IN THESEWARD RANGER DISTRICT, FISCAL YEAR 1981~Carter Lake TrailIditarod National Historic TrailJohnson Pass TrailLost Lake Trai 1Primrose Creek TrailPtarmigan Creek TrailGrayling Lake TrailVi ctor Creek Trai 1Vagt Lake Trai 1Subtota 1, trail useEstimated VisitorDays (RVDs)4,1003,0007,80030040015,6008001,8006,6002,8005003,90050020050017,600..- -..-..-..- ..- ..-..TOTAL DEVELOPED AND TRAIL USE!/ USDA, Forest Service 1982a.7-533,200
Campground. The estimated 1981 utilization rates for the PtarmiganCreek and Primrose facilities were 15 percent and 29 percent,respectively (USDA, Forest Service 1982a).Use of the nine trails listed in Table 7-1 was estimated at 17,600 RVDsin 1981, somewhat more than aggregate use at the developed facilitiesin the area. (The Forest Service data system is designed to seyregatetime actually spent on the trail from time spent at the destination,although use cannot be monitored closely enough to do this withprecision.) The Johnson Pass Trail is a popular backpacking trail,especially for extended trips, and in 1981 was the third mostfrequently used trail among 17 on the Seward District. The IditarodTrail is also somewhat unusual due to its historic significance andconsiderable interpretive use. The remaining seven trails listed inthe table are generally similar in that they are comparatively shorttrails of mostly moderate grade leading to <strong>lake</strong>s or other specificdesti nations.7.1.2 Other Public AgenciesRecreation areas managed by the National Park Service and Fish andWildlife Service of the federal government, and the Division of Parksof the Alaska Department of Natural Resources are also importantrecreation attractions withi n the overall region, although none arelocated very close to the Project vicinity. The most significant ofthese areas is the Kenai National Wildlife Refuge (formerly the KenaiNational Moose Range), which occupies nearly 2 million acres within theinterior of the Kenai Peninsula and abuts the western edge of theChugach National Forest. Much of the refuge is foothill or lowlandarea, providi ng easier access than the more rugged National Forestland. The rivers and streams of the refuge attract heavy fishing usefor both salmon and resident freshwater fish, particularly in the KenaiRiver and Skilak Lake areas. The area is also popular for canoeing,boating, hunting, backpacking, and passive uses such as wildlifephotography. The Fish and Wildlife Service operates 15 campgrounds7-6•-•..-•.. ••..•..••....I• II..II•III•..•-•.......• ..
--..with a total of 297 units, plus 15 hiking trails and 2 established-..-..-recreational use of the refuge, exclusive of sightseeing and otherincidental activities along the Sterling Highway, is estimated at about250,000 visitors (Johnson 1982) .The National Park Service operates Kenai Fjords National Park, whichextends west and southwest from Seward along the Gulf of Alaska. ThePark is mostly undeveloped and attracts only light use, largely"flightseeing" trips to the Harding Icefield, Aialik Bay, and otherattractions. Recent access improvements have provided for backcountryuse in the Exit Glacier area, a few miles northwest of Seward.---- -ca~oe trails (U.S. Fish and Wildlife Service 1982). AnnualThe Alaska State Park System includes 36 existing and proposed unitswithin its Kenai Subregion administrative area (Alaska Department ofNatural Resources, Division of Parks 1982). To some extent these- facilities may compete for recreationists with the Chugach NationalForest, but the State-m't'ned units provide different types of recreationopportunities because they are located in or near coastal areas. Most-------..-..-of these 36 units are small recreation areas or sites; the mostsignificant units are Kachemak Bay State Park, east of Homer, andCaptain Cook State Recreation Area, on the shore of Cook Inletnortheast of Kenai. While not located on the Kenai Peninsula, ChugachState Park is also a very significant recreational resource. This495,000-acre state park, located just east of Anchorage, provides manYof the same types of recreational opportunities as the Chugach NationalForest and is located much closer to the major regional source ofrecreati oni sts.7.1.3 Private EntitiesPrivately owned recreation facilities and services in the Projectvicinity are somewhat limited due to the predominance of public landownership. Lodges are located one each at Cro\'t'll Point and r~oose Pass,.. while three lodge and resort facilities, some with campsites, are-..-7-7..
located in the Cooper Landing area near the west end of Kenai Lake(Alaska Department of Commerce and Economic Development, Division ofTourism 1982). The other significant local private entities are twoflying services, operating out of Crown Point and r~oose Pass whichprovide fly-in access to remote areas in this portion of the KenaiPeninsula. More distant from the Project vicinity. three privatecampgrounds, several lodging facilities, a flying service, and otheroutlets serving recreation and tourism are located in Seward.7.2 EXISTING PROJECT VICINITY FACILITIES AND USEThe Project vicinity currently possesses no structural recreationfacilities other than a series of established but unmaintained trailsfrom both Upper and Lower Trail Lakes to Grant Lake, a primitive roadto mining claims near upper Falls Creek, and a maintained trail to VagtLake. The Vagt Lake Trail is part of the Forest Service trail system,but the trails to Grant Lake and road along Falls Creek are not. Theonly other enhancement of recreation carried out in the Projectvi ci nity has been the creat; 011 of a sport fi shery ; n Vagt Lake. In1973 the Alaska Department of Fish and Game (ADF&G) treated the <strong>lake</strong>witn rotenone to kill the resident, nongame species. In 1974 and againin 1980 the <strong>lake</strong> was stocked by the ADF&G witn rainbow trout. Projectvi ci nity fi shery resources are descri bed in greater detai 1 in Chapter 3.The Project vicinity receives limited recreational use for fishing,hunting, hiking, backpacking, and camping, mainly during the spring andsummer. There is also some canoeing on Grant Lake, mostly by hunters.Snowmobilers have been observed heading up the trail from Moose Passtoward Grant Lake (Quilliam 1982) although most of the slopes aroundthe <strong>lake</strong> are steep and subject to avalanche hazard. These basicactivities can be expected to continue to be pursued after the proposedProject is constructed.7-8.. ••.... ....-..III•..•II..", •• II• ..•III....• ..•....- • ..
-- - --•- •- • - - - - - - - - ------- - - -•The principal recreation attractions within the Project vicinity arehunting, fishing, and general opportunities for backcountryexperiences.is currently limited to float plane and foot travel. Lower GrantCreek, Vagt Lake, and possibly lower Falls Creek provide fishingopportunities in the Project vicinity. Activity in Grant Creek isTrail Lakes or by hiking several miles from the highway.equal to the 500 RVDs of trail use.outside of the immediate study area receive heavier use; still 3,000visits is a substantial figure.offer estimates of use. Assuming two parties hiked in to Grant Lake-7-9•-•-..-..Game animals residing in the area include mountain goat,black bear, brown bear, Dall sheep, and moose (see Chapter 3). Accessto remote hunting territory, such as above the east end of Grant Lake,limited to fishing for rainbow trout and Dolly Varden in the lower 0.5to 0.75 mile of the stream, as the creek is closed to salmon fishingand the upper reaches do not support fish. Grant Creek fishing is alsolimited by difficult access, because it can only be reached by boat viaVagt Lake hasbeen stocked with rainbow trout, as indicated above, and there is someevidence of fishing activity at the mouth of Falls Creek.Estimates of recreational use of the Project vicinity or specific siteswithin the area are limited to Forest Service data on use of the VagtLake Trail. As stated in Section 7.1, this trail received an estimated500 RVDs of use during FY 1981 (see Table 7-1). The 500 RVDs amount to6,000 hours of use. Allowing two hours for the round trip hike, thiswould correspond to 3,000 annual visits to Vagt Lake (unless the500-RVD estimate includes some time spent at the <strong>lake</strong>, a statisticaldivision which is difficult to identify). Time spent in fishing orother recreational activities at Vagt Lake would probably be at leastPtarmigan Lake and other locationsBackpackers have been observed camping at Grant Lake, primarily at thenorthern end of the lower part of the <strong>lake</strong>, but the observations havenot been frequent enough for Forest Service recreation personnel toevery month during a four month backpacking season, with an averageparty size of three people and length of stay of 36 hours, backcountryuse of the <strong>lake</strong> would amount to 24 visits and 72 RVDs per year.
Most of the hunters using the area around Grant Lake undoubtedly usefloat plane access, given the difficulty of hiking around the <strong>lake</strong> orcarrying a canoe to the <strong>lake</strong> from the highway. The proprietor of alocal flying service estimates that an average of about five parties ofthree to four hunters each fly to Grant Lake every year (Pfl eger1982). In comparison Paradise Lakes and Upper Russian Lake receiveapproximately 200 and 100 annual visitors, respectively, for hunting,fishing, and camping (both areas have Forest Service cabins). Assuming20 fly-in hunters spend an average of four days each near Grant Lake,annual hunting activity in the <strong>lake</strong> basin would amount to about 160RVDs. Some additional hunting may occur in the lower portions of thestudy area closer to the highway, but it appears neither significantnor quantifiable.Estimates or educated guesses as to the number of visits or time spentfishing Grant Creek and Falls Creek, and snowmobiling near Grant Lake,or other recreational activities in the area cannot be provided. Giventhe rough figures provided above, total recreational activity in theentire Project area may range from 800 to 1,300 RVDs per year, of whichVagt Lake would account for more than three quarters.No new recreation facilities or activities are currently planned forthe Project vicinity other than the recreation development proposed inthis report. The periodic stocking of Vagt Lake with trout by theADF&G and the maintenance of the Vagt Lake Trail by the Forest Serviceare the only active recreation programs in the area. The Draft ForestPlan for the Chugach National Forest (USDA, Forest Service 1982b)proposes that the remaining National Forest lands in the <strong>analysis</strong> areasencompassing Grant Lake be managed principally for dispersedrecreation. The Draft Plan also proposes possible cooperativedevelopment, with the State of Alaska, of hiking and cross-countryskiing trails along the right-of-way of the Alaska Railroad, if therailroad is transferred to State ownership. Such development couldconceivably occur near Grant Lake, but more likely it would be muchcloser to Anchorage.7-10-..•.... ..-........•..••.."..•..••..•••...... .... ....•
- -•-•- •- •- •- •- - -----------•-1MThe Project vicinity is not directly affected by any speciallegislative or administrative land use designations, other than theroute of the Iditarod Trail as a National Historic Trail. The IditarodTrail, which generally follows the route of the Alaska Railroad, isdiscussed in Chapter 4. Much of the Project lies within a roadlessarea studied under the second Roadless Area Review and Evaluation (RAREII) process; this 216,OOO-acre roadless area (area number A005, A-EKenai Mountains) was designated for further planning under RARE II,with eventual disposition to be determined through the Chugach ForestPlan (USDA, Forest Service 1982b, 1982c). The Grant Lake portion ofthis area was not proposed for wilderness designation in five out ofsix alternatives presented in the Draft Forest Plan, with the<strong>hydroelectric</strong> potential of Grant Lake specifically cited as the reasonfor not proposing the area around the <strong>lake</strong> for wilderness designation.Extensive wilderness areas and lands with other special usedesignations are located elsewhere on the Kenai Peninsula relativelyclose to the Project. The Kenai National Wildlife Refuge containsabout 1.3 million acres of wilderness land, some of \vhich abuts theChugach National Forest on its western border. The largely undevelopedKenai Fjords National Park extends along the southwestern edge of theforest. Additionally, it appears likely that a wilderness designationwill be given to the Nellie Juan area, which includes the ParadiseLakes country about 12 miles southeast of Grant Lake (USDA, ForestService 1982b, 1982c).None of the streams of the Kenai Peninsula have been designated as partof the National Wild and Scenic River System or are under study forinclusion in the system (U.S. National Park Service 1982). No nationaltrail other than the Iditarod Trails are located near the Project.- •- •- •7.3 SPECIAL USE DESIGNATIONS7-11
7.4 SHORELINE BUFFER ZONEThe shoreline of Grant Lake will be included in the Project and willremain open to public access. The lands will continue to receiveForest Service overview for their scenic, recreational, cultural, andother environmental values. Lands along the western edge of theProject vicinity, including approximately one-half mile of Grant Lakeshoreline near the <strong>lake</strong> outlet, are scheduled to be transferred fromthe federal government to the State of Alaska and then to the KenaiPeninsula Borough. This transfer is described in more detail inChapter 9. While ownership and jurisdiction of these lands willultimately be municipal, or possibly private, public access rights tothis shoreline area and the proposed recreation area will be ensuredthrough easements retained by the Forest Service and provisions of theFERC License issued for the Project.7.5 RECREATION DEVELOPMENT PLANA small, day use recreation area near the outlet of Grant Lake isproposed as a component of the Project. A description of thedevelopment concept and proposed facilities are provided below, alongwith informat"ion on expected recreational use and development cost andschedul e.7.5.1 Recreation Plan ConceptSeveral recreation development concepts "involving varying levels of useand development intensity were considered for the Project. The levelsof development considered ranged from relatively intense development atGrant Lake, based on a campground and boat ramp, to primitiverecreati on, with only tra il access to the 1 ake. Tne recommendeddevelopment concept consists of road access to the <strong>lake</strong> with a smallpicnic area and launch access for easily portdble boats.7-12..- ..-....- ........•..••.. •"..•..••....•.. •......-....• ..
-- •- •Intense recreational development at Grant Lake does not appear to beappropriate due to existing developed facilities in the generalramp for trailered boats.Tern Lake) within approximately 10 or 12 miles of Grant Lake. Low--• use.--------- •- •viCinity and the apparent difficulty and expense of constructing a boatThe Forest Service currently operates four<strong>lake</strong>-oriented campgrounds (Trail River, Ptarmigan Creek, Primrose, andutilization rates at two of these campgrounds and the closure of halfof Trail River Campground indicate that a car campground at Grant Lakewould duplicate existing facilities and probably receive insufficientAt the lower end of the range of possible recreation development,primitive recreation based on a trail to a camping and day-use area atthe south end of Grant Lake woul d be consi stent with currentrecreational use of the area and would serve an identified demand forrelatively quick, easy trail access to backcountry areas. However, theexisting trail system provides a number of trail access opportunitiesin the area. Moreover, agency contacts and an assessment of existingrecreational opportunities in the Project vicinity indicate that thereis a greater demand for recreational access by road to places such asGrant Lake. Moreover, Project facility operation and maintenance willrequire permanent road access to the gate shaft intake area on GrantLake. Closure of this road to public use would be inadvisable and_ contrary to Forest Service policy. These considerations support a---the <strong>lake</strong>. The proposed facilities to be developed under this plan aredescribed in more detail in the following section.- - - - ---•- •middle level of development involving road access to a day-use area on7.5.2 Proposed Recreation FacilitiesRecreation development proposed for the Project will be concentrated atthe south end of Grant Lake, approximately 500 ft east of the outlet.This is a relatively level area, lending itself to use by thehandicapped, with scattered growths of evergreens and adjoining one of7-13
•- ---- ..only a few parts of the Grant <strong>lake</strong> shoreline possessing a gentle slopeat and below the <strong>lake</strong>'s present water line. The general layout ofthese facilities is indicated on Figure 7-2. Some signing would alsobe required at other locations. All facilities will be designedconsistent with Forest Service standards.The major facil ities proposed for the recreation area are a parki nglot, small picnic area, vault toilet, and launch ramp for boats. Agraded and gravelled parki ng area of approximately 6,000 square ft,sufficient for 12 vehicles, would be located adjacent to the accessroad. A short, two-lane road extension approximately 100 ft in lengthwould connect the parking lot with the <strong>lake</strong>shore and boat launchingarea. The launch ramp would extend from the <strong>lake</strong>'s normal maximumoperating level (elevation 691 ft) to an elevation which will allowusage when the <strong>lake</strong> is not completely full.A total of three picnic sites will be developed, one west of the lauchand the other two just east of the parking area. The site nearest theparking lot will be a double site for larger parties. All sites wouldbe located just inside the edge of the existing trees in order tominimize clearing yet provide shade, and the two sites east of theparking area would be separated by 100 ft. Each site would consist ofa picnic table (four total), and steel channel fireplace with flipgrate. Short lengths of trail connecting the sites with the parkingarea would be constructed. The sealed vault toilet would be situatedat the south end of the parking lot, as far inland as possible butstill within the required 300 ft of all picnic sites.Signing for the Project would primarily consist of directional andinformational signs. Signs directing travellers to the recreation areawould be posted on both sides of the access road intersection with theSeward Highway and at various points along the main access road.Several signs at the recreation area would direct users to the various- - - -•••- •..•..•..••l1li••--7-14-..- •
- - - ..- z•-•- •-.. GRANT LAKE- •- --PICNIC..SITES---tt-_C1- LAUNCH AREA~- --~.- - ..-..-..-..GRANT..I.l...FIGURE7-16-EBASCOLAKE HYDROELECTRIC PROJECTRECREATION DEVELOPMENT7-2SERVICES INCORPORATED
- --..- ..facilities and post the area against overnight camping. The mainProject sign, providing basic Project data and an area map, would belocated near the powerhouse. An interpretive sign describing theProject1s fish mitigation program would be installed at the Trail LakeHatche r:Y.•.. 7.5.3 Facility Capacity and Use•..•..•- •- •-..-..-..- --..-..-..-The instantaneous capacity (people at one time or PAOT) of the proposedrecreation area would be 48 people, based upon the parking capacity of12 vehicles and an assumed occupancy rate of four persons per vehicle •The picnic area \'1ould have a rated capacity of 16 PAOT, given fourpersons per table, although parties of five or six persons cancomfortably use a standard-size picnic table. The proposed picniccapacity is less than the total site capacity because somerecreationists would use the area only for boating and some overnightparking would be provided for campers travelling to up-<strong>lake</strong> areas byboat. The theoretical season capacity of the picnic area over a104-day managed season (the same as for Seward District campgrounds)would be 1,664 recreation visitor days (RVDs). Assuming an averagelength of stay of three hours, this would correspond to 6,654 maximumvisits annually.The actual use that the proposed recreation facility will receive isdifficult to estimate due to insufficient data on existing use and alack of comparable facilities. Given the size of the facility andvisitation of minor Forest Service recreation attractions elsewhere onthe Seward District, however, it is expected that typical annual use ofthe picnic area will initially be approximately 200 RVDs. This assumeduse level corresponds to a visitation pattern of five parties per dayon weekends and hol idays (33 days of the 104-day season) and an averageof 1.5 parties per day on weekdays, with three people per party and anaverage visit of three hours. A use level of 200 RVDs (800 visits) peryear would represent a utilization rate of about 12 percent of• theoretical season capacity. Given the assumed party size, 800 annual..-7-16..
visits would require nearly 270 vehicle-trips to the site. This levelof traffic flow represents roughly one out of every 500 cars travellingthe Seward Highway during the area's recreation season, based on 1981traffic counts at Moose Pass (Alaska Department of Transportation 1982).Recreational use of the three existing boat ramps on the Seward andAnchorage Di stricts (Primrose Landi ng, Qua rtz Creek, and Tenderfoot)ra nged from 100 to 400 RVDs duri ng FY 1981 (USDA, Fo rest Servi ce,Chugach National Forest 1982a). Because all three of these ramps arelocated adjacent to major highways and serve trailered boats as well assmaller craft, use of the launch area at Grant Lake can reasonably beexpected to be lower than any of the existing ramps if the <strong>lake</strong> is notplanted with a sport fish like rainbow trout. If it is, (see AppendixB, specifically Fish Mitigation Planning Document No.3, for details)then usage will likely be higher. Because the level of sport fisherymitigation remains to be established, no mitigation is assumed andinitial use of the launch at Grant Lake will be arbitrarily estimatedat 50 RVDs per year. Some of this activity will likely consist ofcampers and hunters launching boats for access to other parts of the<strong>lake</strong> basin. Assuming 30 recreationists per year spent an average of 36hours each elsewhere in the <strong>lake</strong> basin, this would result in anadditional 90 RVDs per year.Aggregate use associated with the proposed recreational development atthe south end of Grant Lake, i ncl udi ng overni ght use of other pa rts ofthe <strong>lake</strong> basin and time spent at Project-related interpretive signsduring visits to the powerhouse and Trail Lake Hatchery, will probablyrange from 250 to 400 RVDs per year. Recreational use of the areacould be expected to increase somewhat with continued population growthin Anchorage and the Kenai Peninsula and with increased tourism.Greater public knowledge of recreational opportunities at Grant Lakealso might lead to increased use over time, particularly becausecurrent use of Grant Lake appears to be primarily by local residents.7-17••-................- ..- .. ..••....••III•III•..III..III- ...... ..•11M
- -..- ....-..- •- •- •--..- ..-..-..-..- •- ..- ..hunting seasons will be monitored by ADF&G and Forest Service wildlifebiologists to determine if road access to Grant Lake has an adverseimpact upon the local wildlife. If it is determined that this accesshas resulted in unacceptable hunting pressure, hunting may berestricted through the mandatory use of permits or Project roads may beclosed to public access during subsequent hunting seasons.The proposed development could easily be expanded if activity levelsUse of the recreation area and surrounding lands during the initialwarrant. Adequate space exists at the south end of Grant Lake forparticularly those east of the parking area.the access road. If there appears to be sufficient demand for7.5.4 Development Schedule and CostsNatural Resources 1981). The estimated total cost of the proposedfacilties, is $45,000.be the responsibility of the administering agency.operation of these facilities are included in the Project costestimates.- ..7-18development of additional picnic sites adjacent to the proposed sites,If necessary, additionalparking could be provided south of the proposed facilities adjacent toovernight camping facilities, the logical approach would be to developseveral hardened campsites along the <strong>lake</strong>shore for boat access.Responsibilities for financing and implementing potential futureexpansion of the recreational facilities will be addressed in thecooperative agreement concerning the Project between the PowerAuthority and the Forest Service.Preliminary, planning-level cost estimates for the proposed recreationfacilities are presented in Table 7-2. They are primarily based onrecreation facility cost figures from recent Forest Service experience(Hennig 1982), supported by escalated 1981 standard facility costfigures prepared by the Alaska Division of Parks (Alaska Department ofThese capital costs will be borne by the PowerAuthority as part of the overall cost of the Project. Operation andmaintenance requirements of the proposed recreational facilities willbe low, although establishment of the actual maintenance program willEstimated costs of
TABLE 7-2GRANT LAKE HYDROELECTRIC PR~lECT RECREATION PLANCONCEPTUAL COST ESTHifATE•..•..Item Unit Quantity Uni t Cost Total CostClearing LS $ $ 5,000Park area - gravel surfacing SF 6,000 2.00 12,000Launch access road -gravel surfacing LF 100 20.00 2,000Boat launch area -gra ve 1 surf ac i ng SF 600 2.00 1,200Picnic tables EA 4 400.00 1,600Fi rep1 ace EA 4 1,500.00 6,000Picnic area trai 1 s LF 250 10.00 2,500Contained vault toilet EA 1 3.000.00 3.000Project sign (at powerhouse) EA 1,000.00 1,000Fishery interpretive sign(at hatchery) EA 1 1,000.00 1,000Miscellaneous signing forrecreation area LS ::J,OOO.OO 3,000r~i sce 11 aneous LS 6,700Total 45,000- •-II- .,- •iiiI:I..II..III7-19.. •..•..•
- ---..7.6 SUM!t1ARY OF AGENCY CONTACTS..•..•..•..••....•-..•----..- ....•..-Definitive, formal recommendations or policies concerning recreationdevelopment at the Project have not been offered by any of the resourceagencies involved. However, there have been clear indications ofvarious agency concerns and interests, particularly from Forest Servicepersonnel of the Seward Ranger District and the Alaska Deparf:,ment ofFi sh and Game. Sri efly, the Seward Di strict recogni zes a need for moreoff-highway recreation opportunities in the area, and recommendskeeping the Project access road open to the public and providingparking and boat launching facilities at Grant Lake (Wilson 1982). Itis uniform Forest Service policy to leave roads on National Forestlands open to multiple use if possible. As mitigation for the lostsport fishing opportunity that would result with dewatering of GrantCreek, the ADF&G advocates planting Grant Lake with rainbow trout orsimilar species. For access to this fishery, they advocate a boat1 aunchi ng ramp on Grant Lake.Other Forest Service employees and personnel from the Alaska Divisionof Parks, the Alaska Department of Fish and Game, and the City ofSeward have also offered views on Project recreation, although theseviews were offered informally and do not necessarily represent officialagency positions. Other Forest Service contacts (Albrecht 1982; DeVore1982; Hennig 1982; Qui11iam 1982; Tallerico 1982) also noted theshortage of accessible recreation spots away from the Seward Highway,and the advisability of leaving roads open and providing a vault toiletand possibly a launch and other facilities. There was some indicationthat the Forest Service would consider maintaining recreationfacilities, other than roads, built for the Project. Information wasalso provided on Forest Service guidelines concerning the types offacilities provided for the various levels of development on therecreation opportunity spectrum, as was the observation that about 10camp units would be required if overnight camping were to be encouraged7-20
at Grant Lake. There was some feeling that the Forest Service wouldfavor a day-use facility, that camping at such a facility should bediscouraged, and that some reviewers would express concern that roadaccess to Grant Lake would change the character of recreation in thearea.Opinions of other agency personnel are generally divided over theadvisability of providing road access to the <strong>lake</strong>. A representative ofthe Alaska Division of Parks thought that primitive recreation would beappropriate for Grant Lake and suggested minimal development consistingof trail access to the <strong>lake</strong> and a pit toilet (Wiles 1982). ADF&G staffinitially expressed concern that road access would lead to increasedpressure on wildlife, particularly moose, although they later indicatedthat temporary road closures or area restrictions could minimizewildlife impacts if problems arose (Schwartz 1982; Spraker 1982). ACity of Seward official reflected the prevailing Forest Service opinionthat Project access roads should be left open because of thesignificant demand for getting off the highway (Schaefermyer 1982).The recreation development plan proposed above is intended to meetagency recreation planning objectives and be responsive to views ofagency staff.The following summarizes pertinent Agency contacts made in support ofthis report. Correspondence between the Alaska Power Authority andvarious agencies is included in the Technical Appendix, Part VIII.Alaska Department of Fish and Game1) Date:Agency Representative:Location:Subject:7-21January 5, 1982Ted McHenry, Seward(Telephone conversation)Availability of information onrecreation in Grant Lake vicinityII•IIIIII!III••..III!..•III" II•....III!..II
----2) Date:Agency Representative:..•..Location:Subject:..•-3)..Date:Agency Representative:..Location:•Subject:..4)-Date:Agency Representative:..Location:Subject:- 5) Date:Agency Representative:Location:-Subject:June 2, 1982Dave Daisy and Bill Gaylor(Anchorage)(Telephone conversation)Construction work force managementfor Upper Trail Lake fish hatchery;source of work force; policies onhousing work force.June 7, 1982Ted Spraker (Soldotna)(Telephone conversation)Agency policies toward recreationalaccess to Grant Lake areaJune 18, 1982Chuck Schwartz (Soldotna)Soldotna, AlaskaAgency policies toward recreationalaccess to Grant Lake area and gamemanagement alternatives to protect1 oc a 1 moose herdJuly 13, 1982Ted Spraker (Soldotna)(Telephone conversation)Plans for managing recreationalaccess to Grant Lake areaA1 aska Depa rtment of Natura 1 Resources, Divi si on of Parks-1 ) Da te:Agency Representative:-..Location:.. Subject:June 22, 1982Anchorage- 7-22.......Jack Wiles (Anchorage)Recreation planning concepts forthe Project; need for vehicularaccess to Project vicinity
2) Date:Agency Representative:Location:Subject:u.S. Department of Agriculture,Forest Servi ce1 ) Date:Agency Representative:Location:Su bj ect:2) Date:Agency Representative:Location:Subject:3) Date:Agency Representative:Location:Subject:4) Date:Agency Representative:Locati on:Subject:7-23August 18, 1982Jack Wiles(Telephone conversation)Iditarod Trail, state parkvisitation, recreation facilitycostsJa nuary 19, 1982Ron Quil1iam (Seward)(Telephone conversation)Availability of recreation andother uses of Grant Lake areaJune 17, 1982Ro n Qu i 11 i am (Sewa rd )Seward, AlaskaAcquisition of data on recreationand other land uses in ProjectvicinityJune 21, 1982Jim TallericoAnchorage, AlaskaAcquisition of data on recreationaluses of Project vicinityAugust 18, 1982Steve Hennig (Anchorage)(Telephone conversation)Recreation use on Seward District,probable recreational uses invicinity of Grant Lake•ill.. ..IIIIII- ....-III••• ..IIIIIIII.."I II..•III•
-- ..5) Date;....••..6) Date:•..•..••--1 ) Da te:-..-..-..•..•..•..- •Agency Representative:Locati on:Subject;Agency Representative:Location:Subject:U.S. Fish and Wildlife ServiceAgency Representative;Location:Su bj ect:7-24August 20, 1982Ron Qui1liam, Bob Walker, ChadDevore (Sewa rd)(Telephone conversation)Recreation use on Seward District,recreational development ofalternatives; agency policies onrecreational accessSeptember 3, 1982Steve Hennig (Anchorage)(Telephone conversation)Recreation facility costs,appropriate level and type ofdevelopment at Grant LakeAugust 16, 1982Rick Johnson (Soldotna)(Telephone conversation)Recreation use on Kenai NationalWi 1 d1 He Refuge
----•- •- ••- •-..The principal aesthetic attraction of the Grant Lake HydroelectricProject vicinity and adjacent lands is the visual resource.Accordingly, the following sections identify the visual characteristicsof the Project vicinity, anticipated potential Project impacts onvisual resources, and protective measures necessary to avoid or reducesuch impacts. Much of the information presented in this chapter isbased directly on materials provided by the Forest Service and onconsultation with Forest Service personnel.8.1 VISUAL CHARACTER OF LANDS AND WATERS AFFECTED BY THE PROJECTA visual resource assessment of the Project vicinity was conducted toidentify the visual character of the area's landscapes. The visual<strong>analysis</strong> process included identifying the visually dominant physicalcomponents of the landscapes (i.e., land forms, rock formations,vegetation patterns, water forms) as well as conducting a subjectiveevaluation of viewer sensitivity to the visual resources. Thismethodology permits classification of landscapes according to theirscenic resource values, facilitating sound resource management •- •- ..8.0 REPORT ON AESTHETIC RESOURCES- 8.1.1 PhYsical Visual Characteristics•- --..- ..- ..-- -The Project is situated in an environmental setting of distinctive andvaried landscapes. typical of Alaska's southcentral region. Roundedfoothi 11 s with moderate slopes contrast with steep mountain peakscharacterized by sharply defined ridges, angular steep-sided crests,and conspicuous boulder outcrops. The Project vicinity is visuallydominated by snow-capped mountain peaks. Three prominent peaks risingto 4,810 ft, 5,180 ft and 5,269 ft elevations' surround the Projectsite. Snow-icefields cover approximately 25 percent of thesouthcentral region (USDA, Forest Service 1979), dominating higher2576A8-1
elevations year-round. The presence of glacial activity contributessignificantly to the contrast and variety of the visual experience ofsouthcentral Alaska.Steep slopes, elevation, and climatic conditions influence the varietyof vegetation characterizing the Project vicinity. Slopes above 4,000ft elevations typically display barren rock and talus surfaces.Timberline varies between 1,000-1,500 ft elevations. Alpine vegetationand subalpine herbaceous meadO\'1s dominate slopes above treeline whilemixed conifer and deciduous species comprise most of the denselyforested areas be1m'l. The area's vegetation is described in detail inChapter 3.Landscapes viewed throughout the Project vicinity are frequentlyconfined to foreground and middleground distance zones. Extreme peakelevations, steep mountain slopes, and dense forest vegetation at lowerelevations spatially enclose and restrict the viewshed, the arealextent of terrain visible from a given point of the viewer.t4an-made elements that have been introduced into the visualenvironment, shown on Figure 1-2, include the Anchorage-Seward Highway,the Alaska Railroad, the Moose Pass community and its associatedbuildings, a 24 kV transmission line paralleling the Anchorage-SewardHighway, and a number of Forest Service campgrounds and trails.8.1.2 Scenic Resource ValuesThe scenic resource values of an area reflect the viewer's sensitivityto the landscape's aesthetic qualities. This sensitivity level isbased on the number and frequency of vi ewers, the durati 011 of theviewing period, and the location of viewing points. The viewer'sperception of aesthetic quality is based primarily upon the diversityof the landscape elements and their visibility.8-2..It•lit.....•-•....•......II•-II..•..•..•..II..••..
- -•- ..- •-..-..- ..-•The Anchorage-Seward Highway, a north-south route, parallels the westshore of Upper and Lower Trail Lakes, from the westward extension ofUpper Trail Lake to the south end of Lower Trail Lake. At thislocation the highway crosses over the Lower Trail Lakes' outlet, theTrail River, and continues south to Seward. Approximately one-quarterof a mile south of the Trail River crossing the highway crosses FallsCreek .Views from viewpoints along the highway are frequently enclosed.Madson Mountain rising to 5,269 ft elevation along the west shore ofthe Upper and Lower Trail Lakes system, as well as the <strong>lake</strong>s' denselyforested shorel ine effectively restrict the potential viewshed toimmediate foreground distance zones. Consequently, views from theAnchorage-Sewa rd Hi ghway in the Project vici nity typically consi st ofthe higher elevations of mountain peaks, dense forest vegetation, thehighway and portions of the Alaska Railroad tracks, and occasionalMoose Pass community structures along the highway.- - --------..From a few locations along the highway, views of the Trail Lakessystem, its east shoreline, and a backdrop of snow-capped mountains canbe seen. Views are less restricted during the fall and winter as themajority of the shoreline vegetation is deciduolJs. Photographs fromlocations where there is an opportunity to view these landscapes areshown as Figures 8-1 and 8-2.Neither Grant Lake nor Vagt Lake at their respective 696 ft and 554 ftelevations are visible to viewers traveling the Anchorage-SewardHighway. The highway, for most of its route along the west shore ofthe Trail Lakes system, is generally at about 500 ft elevation. Ridgesreach elevations ranging from 639 ft along the west shore of Vagt Laketo 892 ft along the west shore of Grant Lake (see Figures 8-1 and 8-2).-•-..-..8-3
GRANT LAKE (Behind Hill)OJI~POWERHOUSE COVEView of Powerhouse Cove Location at East Shoreline ofUpper Trail Lake. View Taken From Viewooint on theAnchorage - Sewa rd IIi glll·/ay. .ALASKA POWER AUTHORITYGRANT LAKE HYDROELECTRIC PROJECTPOWERHOUSECOVEfiGURE 8 -\EBASCO SERVICESINCORPORATED
,0I'1GRANT .LAKE (Behind HilOLOWER TRAIL LAKEView of East Shoreline of Lower Trail Lake withSolars Mountain as a Backdrop . View Taken FromVi ewpoi,nt .on the Anchorage-Se.wa-rd Hi ghway,ALASKA POWER . AUTHORITYGRANT LAKE HYDROELECTRIC PROJECTLOWER TRAIL LAKEFIGURE 8-2EBASCO SERVICES INCORPORATED
-..---..-- - - -,.-..-- - ..---~The Anchorage-Seward Highway is one of the two major traffic routes onthe Kenai Peninsula and the principal traffic route in the vicinity ofthe Project. It branches from the Old Sterling Highway, the onlyAnchorage-Kenai road access, and continues south as the only roadproviding access to the City of Seward and intermediate points •Traffic data (Alaska Department of Transportation 1982) summarizingmonthly average daily traffic (MADT) totals and annual average dailytraffic (AADT) totals recorded at the Moose Pass Maintenance Station(Route Mile 29.24) indicate peak MADT totals occurred during July andAugust for both 1980 and 1981. The MADT totals for traffic during latefall through early spring (October - April) averaged less than one-halfof the peak MADT totals for July and August. The significant increasein traffic levels during summer corresponds with peak recreation (seeChapter 7).A number of Forest Service trail heads and campground sites areaccessible from the highway. However, most of the establishedrecreational facilities are concentrated south of the Project vicinityand nearer Kenai Lake. The nearest campground site, Trail Ri verCampground, is approximately one mile south of the Grant Creek- TrailLakes junction. Recreation visitor use information provided by theForest Service, characterizing activity at recreation facilities in theProject vicinity is <strong>detailed</strong> in Section 7.0.- ...•- •-..The Alaska Railroad parallels the northeast shore of Upper Trail Lakebefore crossing to the west shore of the <strong>lake</strong> at Moose Pass. From thislocation the railroad continues south paralleling the west shore of theremainder of the Upper and Lower Trail Lakes system. The railroadcrosses Falls Creek at the same location as the highway crossing.Currently, this segment of the Alaska Railroad transports only freightand does not provide passenger service. The railroad corridor istherefore not a si gnificant sceni c resource factor at present •--....•...."jI8-6
8.1.3 Forest Service Visual Management SystemVisual management system objectives applicable to Forest Service landsaffected by the Project include the following (USDA, Forest Service1978):1) Retention: This visual quality objective provides for managementactivities which are not visually evident. Retentionclassifications dictate that activities may only repeat fonn, line,color, and texture which are frequently found in the characteri stic1 andscape.2) Partial Retention: r4anagement activities should remain visuallysubordinate to the characteristic landscape. Activities may repeatform, line, color, or texture common to the characteristiclandscape. Activities may also introduce form, line, color, ortexture which are found infrequently or not at all in thecharacteristic landscape, but they should remain subordinate to thevisual strength of the characteristic landscape.3) r40dification: Visual quality objective management activities mayvisually dominate the original characteristic landscape. However,activities of vegetative and land form alteration must borrow fromnaturally established form, line, color, or texture so its visualcharacteristics are those of natural occurrences within thesurround; ng area or character type.The visual resource management objectives assigned by the ForestService to landscapes in the Project vicinity are shown in Figure 8-3.Landscapes whose variety and sensitivity level classifications resultin the same visual resource management objective are combined toprovide concise representation of the VMS data. As the figure shows,the Forest Service has assigned partial retention visual resourcemanagement objectives to most of the landscapes in the Project vicinity(USDA, Forest Service 1978). These landscapes are designated as suchdue to two factors:8-7I ••••....III....Ii- .... •II.M•..•"....•....,•.. .... ..- .,• ..
-•- •- ..-- •---..--..-..-;--•---•-..-..i2,1.5LEGEND~ RETENTIOND PARTIAL RETENTIONm MODIFICATIONotGRANT LAKE HYDROELECTRIC PROJECTVISUAL QUALITYMANAGEMENT OBJECTIVESFIGURE 8-3EBASCO SERVICES INCORPORATED8-
---..---•-..- - -..-..-- ------ - ..----- -..• •1) their viewability at middleground distance zones from primaryaccess routes (e.g., the Anchorage-Seward Highway, or the VagtLake Trail), or2) numbers of recreational visitors viewing these landscapes arelikely to be few; their locations are generally removed fromprimary access routes (e.g., the Grant Lake shoreline).The Forest Service has rated highly the viewing significance of theentire shoreline of the Upper and Lower Trail Lakes system, along allprimary access routes and recreation trail s. Sensitivity levelclassifications are higher at these locations due to the higher viewingactivities by recreationists traveling the Anchorage-Seward highway,boaters, fishermen, and hikers. These areas have been assigned theretention visual resource management objective •8.2 POTENTIAL IMPACTS8.2.1 Construction ActivitiesProject construction activities will overlap with peak recreationalactivity during summer months. Recreational opportunities, asdiscussed previously in this chapter and in Chapter 7, attract visitorand local resident recreationists from mid-June through September.Peak recreation activity typically occurs from mid-June throughmid-August, months usually having mild weather. Peak constructionactivity is anticipated to occur between April and November of thefirst year of construction. Construction activity will taper off afterthis period, but construction of the powerhouse and tailrace structureswill continue until completion around May of the second year ofconstructi on.Duri ng the constructi on peri od structures and constructi on equi pmentwill be introduced into the natural landscape. Construction activitywill simultaneously be underway at several locations: the gateshaft,intake, penstock, and the powerhouse and tailrace.8-9
The natural character of the Project vicinity will be disturbedtempora ri l'y duri ng the constructi on peri ode Adverse aestheti c impactsassociated with construction activity will result from increases invehicular traffic. equipment noise. and emissions of smoke and dust.Aesthetic impacts will affect recreationists viewing the area.particularly those interested in viewing wildlife. some of which maytemporarily avoid the area. A more permanent disturbance of thenatural landscape will result from the removal of forest vegetation toaccommodate the construction of permanent access roads required tomaintain the Project. Local residents of the Moose Pass community willbe most affected by the temporary increase in vehicular traffic andnoi seeDisposal of tunnel debris may introduce a visual impact. Approximately7.000 cubic yards of tunnel debris will be displaced during tunnelconstructi on. Thi s acti vity will occur duri ng the wi nter months. Ttli svolume of material. when piled 20 ft high, would cover approximatelyone-half acre of surface tert'ain. The nature of the material willdetermine its suitability for potential use as riprap for the tailracechannel or other construction purposes. Tunnel debris not suitable forthis or other uses during Project development will require disposal.The economic <strong>feasibility</strong> of transporting the material as well as thepotential visual impacts associated with its disposal will be factorsdetermining the selection of a suitable disposal site.8.2.2 Project StructuresPrincipal structural facilities of the Project are the access roads,intake structure, gate shaft, recreation facilities, powerhouse andtailrace, power tunnel and penstock, fish mitigation facilities, andtransmission line. The visual impacts of these structural features arediscussed in the following paragraphs.8-10•..•..•-II..-..-..• ..•• ..:I••••....III•..•....II..II
1t--•8.2.2.1 Access RoadsA permanent access road will be constructed to the powerhouse and gateshaft locations. With a width of approximately 20 ft but allowing a100 ft-wide corridor for necessary cuts and fills, it will branch from- --..- - - -..-..--the Anchorage-Seward Highway approximately three miles south of r~oosePass. The construction of a bridge across the Trail Lakes narrows willprovide access to the east shoreline. The access road will be routedeast and then north a round a ri dge which ri ses to approximately 671 ftelevation, and continue to the powerhouse site. To reach the gateshaft-intake area, the access road will follow the north bank of GrantCn:!ek. to within about 200 yards of Grant Lake where it will be routednortheasterly toward the gate shaft. An access road will also beconstructed across Grant Creek to the south shore of Grant Lake toallow access to Project recreational facilities •The elevation of the ridge and topographic configuration of theshoreline at the narrows will effectively restrict visibility of thepowerhouse and gate shaft access roads and bridge from the principalview points along the Anchorage-Seward Highway.- - - - - - - - - ---..-..8-11Roads that provide recreational access to pOints of interest throughoutthe Project vicinity will increase the recreational viewing potentialof landscapes previously viewed from only midd1eground and backgrounddistance zones. These new access roads will be classified by theFOn:!st Service as seconda ry access routes, routes 1eadi n9 to seconda r.Yareas of interest and recreation sites where between one-fourth andthree-fourths of the forest visitors have a major concern for scenicqualities (USDA, Forest Service 1974). Landscapes viewed adjacent toand at midd1eground distance zones from these routes will receivedifferent VMS cl assificati on categori es from those currently assignedby the Forest Service. Under the Visual Management System, theselandscapes will require higher visual significance ratings due to thehigher incidences of viewing made possible by the access roads.
•- •8.2.2.2 Intake Structure, Gate Shaft, and Recreation FacilitiesThe Grant Lake intake and gate shaft structures and recreationfacilities will not be visually evident to travelers along theAnchorage-Seward Highway or from locations within the Projectvicinity. These Project structures will be visually evident only tovisitors in the immediate vicinity of each structure.--..•-• - •8.2.2.3 Powerhouse and Tail race StructuresThe powerhouse \\Ii 11 be located approximately 400 ft from the east shoreof Upper Trail Lake. Its location will be sufficiently distant fromthe shoreline to minimize its visibility to travelers along theAnchorage-Seward Highway. An exterior design will be selected so thattrle powerhouse wi 11 hannoni ze with the surroundi ng natural 1 andscape.Tne tai 1 race wi 11 be constructed of ri prap. Al though the constructi onof the tailrace will introduce a linear feature into the naturallandscape, the features of a tailrace designed of rock will harmonizewith the visual image of the surrounding landscapes.8.2.2.4 Transmission LineA 69 kV transmission line will be required to transmit electricitygenerated by the powerplant to consumers at Seward, Alaska. Thetransmission line will parallel the powerhouse access road to theAnchorage-Seward Highway where it will tie into an existingtransmission line.Visual impacts associated with the transmission line junction willresult from clearing the construction access road and adjacenttransmission line structures. The clearing will require an opening inan area where dense vegetation currently exists. Portions of thisopening will be visible from the highway. The bridge access andtransmission line poles will be visible to boaters navigating thenarrows joining Upper and Lower Trail Lakes.•JIll••• II•..•..•..•....•, ••..8-12
-..-....-..-..--- - ..- - - ---- ---..-..-..-- ..8.2.3 Project Operati onVisual impacts associated with the operation of the Project will relateprimari ly to reduced flow releases downstream of the Grant Creek outletat the Trail Lakes narrows, and increased flows into Upper Trail Lakefrom the powerhouse tail race. Grant Creek flow wil J .be reduced from anaverage annual flow of 196 cfs to an average annual spill of 10 cfs.In comparison to its existing natural flows, Grant Creek willessentially be dewatered.The topographic configuration of the landscapes bordering Grant Creekand its outlet at the narrows between Upper and Lower Trail Lakeseffectively screens views of Grant Creek from viewers traveling theAnchorage-Seward Highway. Visual impacts associated with thedewatering of Grant Creek will be evident to travelers along the newaccess bridge, boaters in the Trail Lakes narrows, and to anglers whofished Grant Creek before the Project.Operati on of the Project wi 11 reduce Grant Lake I s current averageannual <strong>lake</strong> elevation of 696 ft and result in fluctuating <strong>lake</strong> levels.The annual maximum regulated <strong>lake</strong> level of 691 ft will occur duringlate fall and early winter, August through October. The annual minimumregulated <strong>lake</strong> elevation of 660 ft will occur during the early spring,March through May. Maximum shoreline exposures will occur during Marchthrough May. Terrestri a1 surveys conducted in the Project vici nityindicate that an ice-coveri n9 persists over most area 1 akes and pondsas late as the end of April (AEIDC 1982). Recreationists are unlikelyto be attracted to the Grant Lake recreati on facil ity until it is freeof ice, when the elevation of the <strong>lake</strong> will be approaching a level of696 feet. Fluctuating <strong>lake</strong> levels will not have a great visual impacton rec reati on users of the Proj ect vi ci nity.8-13
8.3 MITIGATION OF IMPACTSSeveral mitigative measures will be implemented by the Alaska PowerAuthor; ty to reduce adverse vi sual impacts associ ated wi th Projectconstruction and operation. Vegetation clearing required for theconstruction of access roads and transmission line corridors,powerhouse, and tai 1 race structures wi 11 be mi nimi zed. Thetransmission line will tie into an existing transmission line along theAnchorage-Seward Hi ghway, avoi di ng the vi sual impact of theconstruction of a second transmission line along this same route.Access roads will be routed, to the extent feasible, to prevent thei ntroducti on of conspi cuous su r'face patterns into the natura 1environment, thereby minimizing their visual impacts. The permanentaccess road to the powerhouse facility and the transmission line willbe routed behind a ridge away from the shoreline of Upper Trail Lake tominimize their visibility from travelers along the Anchorage-SewardHi ghway. The permanent access road to the gate shaft-i ntake a rea andthe recreation area will be routed through natural depressions,avoi di ng IJnnecessary swi tchbacks. Tne topography and density of forestvegetati on wi 11 mi nimi ze vi si bi 1 i ty of the permanent access road fromthe Anchorage··Seward Hi ghway.The power tunnel and penstock leading from the Grant Lake intake to thepowerhouse at Upper Trail Lake will be an underground tunnel and willnot be a visible Project feature.The powerhouse will be constructed approximately 400 ft east of theUpper Trail Lake shoreline. It is set back from the shoreline and thepresence of scattered snoreline vegetation \"i11 partially screen vie~Jsof the powerhouse from view points along the highway. Additionally,tnt:! pO\\lerhouse exterior will be designed to be compatible with naturalsurroundings. The rock used to construct the tailrace will be visuallycompati bl e with the natural surroundi ngs.8-14•..•..••..- -•..•- • ..••..• ..•••.....••--..•
---•8.4 SUMMARY OF AGENCY CONTACTS- - - - - - - - ..The following is a summary of pertinent Agency contacts made in supportof this report. Correspondence between the Alaska Power Authority andvarious agencies is included in the Technical Appendix, Part VIII.Alaska Department of Transportation1) Date:Agency Representative:Location:Subject:U.S. Department of Agriculture,Forest Service1) Date:Agency Representative:Location:Subject:July 8, 1982Bill HumphreyAnchorageTraffic count data for the MoosePass Maintenance StationJuly 7, 1982Steve Hennig, Landscape ArchitectAnchorageVisual Management System (VMS)classifications for the Projectvicinity, receipt of mapsdelineating VMS classifications- - - - - - --------•-•- -8-15
.....-..-.......- ........----..-..-..-...- - - - ..9.0 LAND USEThis section describes current land ownership, use, and managementcharacteristics in the Project vicinity, and proposed new land usesthat would result from Project construction •The study area for 1 and use is defined as the 1 and and water areadi rectly or i ndi rectly affected by construction and operation of theproposed Project, and is shm'ln wah surrounding lands in Figure 9-l.The study area extends from Trail River and Trail Lakes eastward to theheadwaters of Grant Lake. This area includes the entire drainages ofGrant Lake and Grant Creek, Falls Creek, Vagt Lake, and a small amountof direct drainage to Upper and Lower Trail Lakes. The area totalsapproximately 60 square miles. As Table 9-1 indicates, nearlythree-fourths of the area lies within the Grant Lake and Grant Creekdrai nages.DrainageGrant Creek and LakeFall s CreekVagt Lake and CreekUpper and Lower Trail Lakes!!TOTALTABLE 9-1STUDY AREA BY DRAINAGEApproximate Area(Square Miles)44122260!! At gaging station just above Falls Creek.- 1609B..-..9-1......
- LAND SELECTION BOUNDARY- PLACER MINING CLAIMS- PRIVATE LANDalZz:Z:Z)FLOODPLAIN AREAS161 CAMPGROUNDS----- FOREST SERVICE TRAILS·········UNMAINTAINED TRAILS--EXISTING ROADS------PROPOSED ROADSALASKA POWER AUTHORITYGRANT LAKE HYDROELECTRIC PRO.ECTKENAIl.AKELAND USEEBASCO SERVICES INCORPORATED9-2
.....................................................As indicated in Chapter 3, lower lying lands in the Project vicinityare generally mixed forest, changing progressively at higher elevationsto coniferous forest, shrub, and alpine vegetation. Glaciers occur atthe highest elevations. Fragile areas within the area include thosewith shallow soils and areas of alpine vegetation. Of theapproximately 60 square miles of the study area, about 3 square milesare in surface water, 2.5 square miles of which is Grant Lake .9.1 LAND OWNERSHIP AND STATUSThe entire study area, with the exception of one private five-acreparcel, currently is federally owned land within the Chugach National....~orest. The privately owned land is situated on the south side of themouth of Grant Creek. Under terms of the Alaska Statehood Act andAlaska State legislation, ownership of a portion of the study area is... to be conveyed to the State of Alaska and subsequently to the Kenai.. Peninsula Borough. Under the terms of the legislation, the land is to... be used for expansion of existing communities, establishment of newcommunities, or recreation. The land to which the Borough is seekingtitle, amounting to slightly less than 11,000 acres, is shown in Figure9-1. This land is scheduled to be conveyed to the Borough followingnegotiation and establishment of Forest Service easements forcampgrounds, trails, and other facilities within the selection boundary •Additional land status factors relevant to the Project involve landwithdrawals and private claims on National Forest lands. The FederalPower Commission, predecessor agency to the Federal Energy RegulatoryCommission, filed a power site withdrawal on behalf of the ChugachElectric Association for the Grant Lake-Falls Creek area with theBureau of Land Management and Forest Service in 1960. According to theFederal Power Act (16 USC 818), this withdrawal does not preclude allother uses of the area, but does reserve the right to development ofthe hYdroelectric site and limits other uses that would phYsicallyinterfere with this right •9-3
Numerous mining clair.ls filed under the Mining Law of 1872 (30 USC 21 etseq.) also exist within the study area. Rights associated with validmining claims allow the claimant sole authority to discover and removeminerals, and permit occupancy and the removal of timber to the extentnecessary to support mining activities. Nine placer mining claimsextend eastward from Trail River along lower Falls Creek, as shown inFigure 9-1 (USDA, Forest Service 1982a). The earliest placer mineclaim was filed in 1969, nine years after the power site withdrawal wasexecuted. Other mining claims, most of which are lode claims, arelocated on the northern, western, and southern slopes of SolarsMountain; at the northern end of Grant <strong>lake</strong>, near the bend in the <strong>lake</strong>;and at various places south of Falls Creek.9.2 LAND USE AND MANAGEMENT9.2.1 Study AreaThe study area (defined above) is predominantly undeveloped.Development has been limited to exploration and mining on the claimsdescribed above. Much of this mining activity has been situated in theupper Falls Creek drainage and to the north of the lower basin of GrantLake, above the Project's high water level. The other significant useof lands in the area is for recreation, principally hiking, hunting,and fishing. These activities are described in Chapter 7. A miner'scabin is located at the north end of the lower basin of Grant Lake. Acabin formerly under special use permit to a local trapper is alsolocated at the east end of Grant Lake; use of this cabin apparently isno longer authori zed (Qu i 11 i am 1982). Forest Servi ce managementactivities within the study area are not intensive, and consistprimarily of maintenance, such as on the Vagt Lake Trail, and wildlifemanagement.9-4•- • ..•-•..•lit•..•..•.... •..•...... •••iii•........•"..
-- ----------9.2.2 Adjacent LandsLands abutting the study area on three sides are also primarilyundeveloped National Forest lands. To the north of the Project, theChugach National Forest extends for more than 25 miles and coversvirtually all of this part of the Kenai Peninsula. Similarly, thetiationa1 Forest extends eastward from the Project all the way to PrinceWilliam Sound. The southern border of the forest in this region isapproximately 20 miles south of Falls Creek. While undeveloped, thisarea includes the popular recreation attractions of Paradise Lakes andPtanni gan Lake.- -,.- - - --- - - - - - ..---To the west of the study area lie portions of Upper and Lower TrailLakes and the major transportation corridor between Anchorage andSeward, which contains the Seward-Anchorage Highway and the AlaskaRailroad. State Highway 9 becomes Highway 1 approximately 11 milesnorthwest of the Project. The unincorporated town of Moose Pass islocated to the west of the study area on the west side of Upper TrailLake. Private land on which Moose Pass is situated currently amountsto roughly 450 to 500 acres, although this figure may change after theland selection process is implemented. An unmaintained trail that isnot part of the Forest Service system leads from Moose Pass to thenorthern end of the lower basin of Grant Lake.Other developed land uses within the highway corridor include an AlaskaDepartment of Fi sh and Game hatchery at the western end of Upper TrailLake; a lodge, landing strip, and solid waste transfer station nearCrown Point, which is just below the confluence of Falls Creek andTrail River; Forest Service campgrounds on Kenai Lake (Trail River) andPtarmigan Creek; and a Forest Service guard station and a few scatteredresidences at Lawing on Kenai Lake. This pattern of highly-disperseddevelopment along the highway generally continues from this areasouthward to Seward.9-5
Undeveloped national forest lands again predominate to the west of thestudy area beyond the highway corridor. This sector of the ChugachNational Forest contains several recreational facilities and is apopUlar recreati on desti nati on, par't lcu1 arly along Kenai Lake and theKenai and Russian Rivers.9.2.3 Special Land Use ConsiderationsSmall wetlands occur in numerous locations within the study area.These wetlands primarily consist of areas of riparian vegetation alonglocal streams and <strong>lake</strong>s and wet-meadow bogs in low-lying areas betweenTrail Lakes and Solars Mountain. The distribution and composition ofthese wetlands, and the effects of the Project on wetlands, aredescri bed; n Chapter 3 of thi s report.Floodplains are present within the study area, but are not extensive.FOlood hazard studies have identified lOO-year floodplains along GrantCreek, Falls Creek, Trail Lakes, and Trail River (Federal EmergencyHanagement Agency 1981). Tne maximum width of these floodplains alongGrant and Falls Creeks is about 650 ft, while the floodplain along thesouthern shore of Lower Trail Lake and the adjoining reach of TrailRiver extends inland for up to 750 ft. The remaining floodplain limitsalong Trail Lakes generally correspond to the normal <strong>lake</strong> shoreline,with the exception of a few low-lying promontories. The powerhousewill be located outside the 100-year floodplain of Upper Trail Lake.The main access road will cross a floodplain area at the confluence ofGrant Creek and the channel bebJeen Upper and Lower Trai 1 Lakes, andwill be built to withstand flooding.There are no prime farmlands within the study area (Moore 1982). Thestudy area is not within the interim coastal zone boundariesestablished for the Alaska Coastal Management Program (Wolf 1982).9-6•lit.. •-• •..•..-..•ill.. •....• III.... ••....•..•..•..•..•..
- ..-..- ..-..-..-..-..-- ----..9.~ PROPOSED LAND USESThe proposed Project will produce three principal types of land usechanges: addition of Project facilities and construction and operationactivities on currently undeveloped lands and water, changes in surfacewater regulation, and changes in recreational use of the area. Some ofthese induced changes will be temporary or seasonal, but the Projectwill have a minor permanent impact on land use patterns in the studyarea.9.3.1 New Land UsesProposed Project facilities, shown in Figure 1-3, include a <strong>lake</strong> tap,gate shaft, power tunnel, penstock, powerhouse, transmission line,access roads, and recreational facilities. The power tunnel will be anunderground facility, and will not occupy or disturb any surface area.With the exception of access roads, Project facilities will occupy arelatively small amount of the total study area. Access roads, whichwill support both Project construction and operation and alsorecreational access, will occupy land that is currently mostlyforested. The transmission line will be located within the corridor ofthe access road to the powerhouse and will not require additionalc1 eari ng.-The land areas that will be required for permanent Project facilitiesare presented in Table 9-2. Of the 10.9 acres required for all Projectfacilities, road access to the powerhouse, gate shaft/intake, andrecreation area accounts for 9.4 acres or 86 percent. In addition tothe area that will be permanently occupied, construction and stagingareas will require temporary disturbance and occupancy on 4 to 5acres. These areas will be located near the powerhouse, the gate- shaft, and the access road crossi ng of the narrows betwee n Upper and- Lower Trail Lakes.-..-..9-7-..
•- •-TABLE 9-2AREAS REQUIRED FOR PROJECT FACILITIES- -..Facil ityArea (acres)Gate shaftPenstockPowerhouseAccess roads and transmission lineRec reati 0 n a reaAll Facilitieso. 10.39.41.110.9- - -•- •• ..Project construction and operation will produce fluctuations in thewater level of Grant Lake of up to 40 ft during an average year,compared to approximately 8 ft per year under natural conditions.Project design involves lowering the <strong>lake</strong>'s maximum average level fromelevation 696 to 691 ft, producing fluctuations between elevations 660and 691 feet. Project construction and operation would alsoeffectively dewater Grant Creek.9.3.2 New Recreational UsesConstruction of the Project will introduce roaded recreation toformerly roadless areas between the south end of Grant Lake and theSeward Highway. In addition to some new recreation uses that do notcurrently exist within the study area, increased access is also likelyto result in higher use levels for dispersed recreational activities,which currently take place at and near Grant Lake. These changes inrecreational use are described more fully in Chapter 7.•..••..•..-• " ..9-8-••
- -..- - -..-..-..-..- - - - --------..- -9.3.3 Compatibility with Existing and Planned UsesThe Project is compatible with existing and expected land uses andplanning guidelines for the area. The Chugach National Forest landwithin the study area is currently managed for multiple uses forest,although lack of road access effectively limits the type of managementactivities that can be undertaken. Adoption and implementation of anew Chugach Forest Plan is not expected to change the character ofForest Service management, given the content of the Draft Forest Plan(USDA, Forest Service 1982b). Following completion of the landselection and conveyance process, the remaining National Forest landsimmediately around Grant Lake and some lands in the Falls Creekdrainage would be within Analysis Area 4 (Timbered Sideslopes, EastSide, Kenai Peninsula); management prescriptions within the DraftForest Plan for this area emphasize increased dispersed recreationopportunities and improved fish and wildlife habitat. Prescriptionsfor Analysis Area 1 (Alpine, Kenai Peninsula), which include SolarsMountain, also emphasize dispersed recreation, fish and wildlifehabitat, and maintenance of landscape character.Much of the study area, including lands around the outlet of Grant <strong>lake</strong>and westward to Trail <strong>lake</strong>s, will be under the jurisdiction of theKenai Peninsula Borough and probably the community of Moose Pass in therelatively near future. The Moose Pass Advisory Planning Commission iscurrently developing a land use plan for the entire community land<strong>grant</strong>, but no plans or guidelines have been adopted.9.4 SUMMARY OF AGENCY CONTACTSThe following is a summary of pertinent Agency contacts made in supportof this report. Correspondence between the Alaska Power Authority andvarious agencies is included in the Technical Appendix, Part VIII.9-9
•-IIIAlaska Office of the Governor t1) Date:Agency ~resentative:_Locati on:Subject:Kenai Peninsula Borough1 ) Da te:Agency Representative:Location:Subj ect:2) Date:Agency Representative:Location:Subject:3) Date:Agency Representative:Location:Subj ect:u.S. Department of Agriculture,Forest Servi ce1 ) Da te:Agency Representative:Location:Subj ect:State Clearinghouse9-10October 14 t 15182Wendy Wolf (Juneau)(Telephone conversation)Coastal zone boundary and planningapplicability to the ProjectJanuary l8 t 1982Carolyn Thompson and FrankMcIlhargey (Soldotna)(Telephone conversation)Land use and development policiesand objectives in Project vicinityand socioeconomic characteristicsJune l8 t 1982Frank McIl hargeySoldotna, AlaskaEconomic outlook and data forBorough and Project vicinityAugust 17, 1982Dawn Lahnum(Telephone conversation)Local taxes applicable to theProjectJanuary 14, 1982Bob Dunblazier and Ann Albrecht tAnchorage(Telephone conversation)Forest Service Land use planningactivity and management objectivesin Grant Lake vicinity-•-•- •- •- .. ..••..II••••.. ..-•-•••II
-- - -2}Date:Agency Representative:Location:Su bj ect:3} Date:Agency Representative:- Location:Su ect:- -u.s. Soil Conservation Service-1 } Date:Agency Representative:- Location:Su bj ect:- -- - ----,--June 21, 1982Beulah BowersAnchorage, AlaskaLocations and conditions of miningclaims in Chugach National ForestAugust 25, 1982Beulah Bowers (Anchorage)(Telephone conversation)Power site withdrawal regulations,particularly in regard to miningcl aimsOctober 14, 1982Joe Moore (Anchorage)(Telephone conversation)Location of prime farmlands invicinity of Grant Lake9-11
--- -10.0 REFERENCESCHAPTER 1 - GENERAL DESCRIPTION OF THE LOCALE------ --- - - - - - - - - -University of Alaska, Fairbanks.CHAPTER 2 - REPORT ON WATER USE AND QUALITY- Hartman, C.W., and P.R. Johnson. 1978. Environmental atlas of Alaska.A1 ask a Depa rtment of Fi sh and Game. 1981. Grant Lake survey.Unpublished. (011 file at Alaska Dept. of Fish and Game, Soldotna,AK) • 1 vol.Alaska Department of Natural Resources. 1981. State of Alaskawater user1s handbook. Water Management Section, Division of Landand Water Management, Alaska DNR. Anchorage, AK.American Public Health Association, American Water Works Association,and Water Pollution Control Federation. 1981. Standard methodsfor examination of water and wastewater. 15th edition, 1980.American Public Health Association, Washington, D.C.Arctic Environmental Information and Data Center (AEIDC). 1982.Summary of environmental knowledge of the proposed Grant Lake<strong>hydroelectric</strong> <strong>project</strong> area. Final Report. Submitted to EbascoServices, Inc., Redmond, WA.Chow, Ven Te. 1959. Open-channel hydraulics. McGraw-Hill Book Co.,NY.Hayden, Gary. 1982. Personal communication. Alaska Department ofEnvironmental Conservation, Water Quality Management Division,Anchorage, AK.Quilliam, Ron. 1982. Personal communication. U.S. Dept. ofAgriculture, Forest Service, Seward District, Seward, AK.U.S. Environmental Protection Agency. 1976. Quality criteria for- water. Washi ngton, D.C.- U.S, Department of the Interior, Fish and Wildlife Service. 1961.Ptarmigan and Grant Lakes and Falls Creek, Kenai Peninsula, Alaska,a progress report on the fish and wildlife resources. Juneau, AK.- - .,-.,--.,U.S. Department of the Interior, Geological Survey. 1981.water qual i ty records, southcentral Al aska, 1949-1974.computer-stored data.2651ASurfaceUnpublished-..10-1
CHAPTER 3 - REPORT ON AQUATIC, BOTANICAL, AND WILDLIFE RESOURCESAlaska Department of Fish and Game. 1952/1980. Escapement countsurveys, Grant Creek. Unpublished. (On file at Alaska Dept. ofFish and Game, Soldotna, AK).1961. Creel census for Grant Creek. Unpublished. (Onfile at Alaska Dept. of Fish and Game, Seward, AK).1973. Alaska1s wildlife and habitat. Juneau, AK. 1 vol.1982. 1961-81 brown/grizzly bear harvest reports. Unpublished.Juneau, AK. 1 vol.Arctic Environmental Information and Data Center (AEIDC). 1982.Summary of environmental knowledge of the proposed Grant Lake<strong>hydroelectric</strong> <strong>project</strong> area. Final Report submitted to EbascoServices, Inc. Redmond, WA.Andrew, F.J., L.R. Kersey, and P.C. Johnson. 1955. An investigation ofthe problem of guiding downstream-mi<strong>grant</strong> salmon at dams.International Pacific Salmon Fisheries Commission. Bull. VIII.65 pp.Armstrong, R.H. 1969. The sea-run Dolly Varden in Alaska. AlaskaDept. of Fish and Game, Anchorage, AK. Wildlife Notebook Series.2 pp.Babcock, B. 1982. Personal communication, March 3, 1982. Instructor,Anchorage Community College, Anchorage, AK.Beaulaur;er, D.L., B.W. James, P.A. Jackson, J.R. Meyers, and J.M. Lee,Jr. 1982. Mitigating the incidence of bird collisions withtransmission lines. Paper presented at the Third Symposium onEnvironmental Concerns in Rights-of-Way Management, San Diego, CA,Feb. 15-18, 1982. 21 pp.Bellrose, F.C. 1980. Ducks, geese, and swans of North America. Thirded., Stackpole Books, Harrisburg, PA. 540 pp.Bjornn, T.C. 1978. Survival, production, and yield of trout andchinook salmon in the Lemhi River, Idaho. Bulletin No. 27, Collegeof Forestry, Wildlife and Range Sciences, University of Idaho,Moscow, Idaho. 57 pages.Blazka, P., T. Backiel, and F.B. Taub. 1980. Trophic relationships andefficiencies. Pages 393-410 in Le Cren, E.D. and R.H.Lowe-McConnell, eds. The functloning of freshwater ecosystems. IBPHandbook No. 22. Cambridge Univ. Press, Cambridge.10-2• .,•-•-----•.... •..••- •..•....III•ilia..• .,•-•••
- - - -------------..---- - - ---- -•----Bloom, A.M. 1976. Evaluation of minnow traps for estimatingpopulations of juvenile coho salmon and Dolly Varden. ProgressiveFish Culturist, Vol. 38, No.2, p. 99-101.Boyce, M.S. 1974. Beaver populations ecology in interior AlaskaM.S. Thesis. University of Alaska, College, AK. 80 pp.Brylinsky, M. 1980. Estimating the productivity of <strong>lake</strong>s andreservoirs. Pages 4-11-454 in Le Cren, E. D. and R. H.Lowe-McConnell, eds. The functioning of freshwater ecosystems.IBP Handbook No. 22. Cambridge Univ. Press, Cambridge.Burger, C. Personal communication; various dates, 1981 and 1982.u.S. Fish and Wildlife Service, Anchorage, AK.Burner, J. W. 1951. Characteristics of spawning nests of ColumbiaRiver salmon. U.S. Fish and Wildlife Service. Fisheries BulletinNo. 61, p. 97-110.Burns, J.W. 1971. The carrying capacity for juvenile salmonids insome northern California streams. California Fish and Game57:44-57.Candit, K. Personal communication, October 13, 1981. Trapper,resident, Moose Pass, Ak.Chapman, D.W. 1965. Net production of juvenile coho salmon in threeOregon streams. Transactions of the American Fisheries Society94(1):40-52.Chatelain, E.F. 1950. Bear-moose relationships on the KenaiPeninsula. Transactions of the North American Wildlife Conference,Vol. 15, p. 224-234.Coady, J.W. 1974. Influence of snow on behavior of moose.Natura1iste Canadien. Vol. 101, p. 417-436.Cook Inlet Regional Planning Team. 1981. Cook Inlet regional salmonenhancement plan 1981-2000. Soldotna, AK. 72 pages plusappendices.Craddock, D.R. 1958. Spawning escapement of Okanogan River bluebacksalmon (Oncorhynchus nerka), 1957. U.S. Fish and Wildlife ServiceSpecial Scientific Reports in Fisheries, No. 275.Craig, P.C., and P.J. McCart. 1974. Classification of stream types inBeaufort Sea drainages between Prudhoe Bay, Alaska and theMackenzie Delta. Pages 1-47 ~ P. J. McCart, ed. Classificationof streams in Beaufort Sea drainages and distribution of fish inarctic and sub-arctic drainages. Canadian Arctic Gas StudyLtd./Alaskan Arctic Gas Study Co. Biological Report Series.Vol. 17, No.1 •10-3
Craig, P.C., and J. Wells. 1975. Fisheries investigations in theChandalar River region, northwest Alaska. Pages 1-14 in P.C.Craig, ed. Fisheries investigations in the coastal region of theBeaufort Sea. Canadian Arctic Gas Study Ltd/Alaskan Arctic GasStudy Co. Biological Report Series. Vol. 34, No.1.Crone, R.A. 1981. Potential for production of coho salmon(Oncorhynchus kisutch) in <strong>lake</strong>s with outlet barrier falls,Southeastern Alaska. Ph.D. Thesis, Univ. of Michigan. 388 pp.Cummins, K.W. 1975. Macroinvertebrates. Pages 170-198 in Whitton,B. T., ed. River Ecology. Univ of Calif. Press, Berkeley and LosAngeles.Dudiak, N. 1980. Environmental Assessment, Trail Lakes Hatchery, KenaiPeninsula, Alaska. Submitted to U.S. Forest Service, ChugachNational Forest by Alaska Dept. of Fish and Game, FisheriesRehabilitation, Enhancement, and Development Division, Anchorage,AK.Duthie, N.C. 1979. Limnology of subarctic Canadian <strong>lake</strong>s and someeffects of impoundment. Arctic and Alpine Research. Vol. 11,No.2, p. 145-158.Eggers, D.M. 1978. Limnetic feeding behavior of juvenile sockeyesalmon in Lake Washington and predator avoidance. Limnology andOceanography. Vol. 23, No.6, p. 1114-1125.Eggers, D.M., N.W. Bartoo, N.A. Rickard, R.E. Nelson, R.C. Wissmar,R.,L. Burgner, and A.H. Devol. 1978. The Lake Washingtonecosystem: the perspective from the fish community production andforage base. Journal Fisheries Research Board of Canada. Vol. 35,p. 1157-1571.Elliott. S.T., and R.D. Reed. 1973. Ecology of rearing fish. Pages12-92 in Alaska Dept. of Fish and Game. Federal Aid in FishRestoration. Vol. 14. Sport Fish Div., Alaska Dept. of Fish andGame. Project F-9-S. Annual Report.Ellison, L.N. 1974. Population characteristics of Alaska sprucegrouse. Journal of Wildlife Management. Vol. 39, No.3,p. 383-395.Federal Register. 1980.Vol. 45, No. 242.List of threatened and endangered species,Flagg, L. Personal communication, January 5, 1982. FisheriesRehabilitation Enhancement and Development Div., Alaska Dept. ofFish and Game, Soldotna, AK.Franzman, A.W., C.C. Schwartz, and R.O. Peterson. 1980. Moose calfmortality in summer on the Kenai Peninsula. Journal of WildlifeManagement. Vol. 44, No.3, p. 764-768.10-4••-•-...... ....- •.... ......••..••...... ••.... ........- •iiIi
- - - -----•Gabrielson, I.N. and F.C. Lincoln. 1959. Birds of Alaska. TheWildlife Management Institute, Harrisburg, PA. 922 pp.Gangmark, H.A. and L.A. Fulton. 1952. Status of Columbia Riverblueback salmon runs, 1951.Scientific Report Fisheries. No. 74.Canada on aquatic ecosystems.Canada. Vol. 31, p. 913-927.Fraser River system:Vol. 31, No.5, p. 871-892.Heard, W. Personal communication, December 12, 1982. Auke Baylaboratory, National Marine Fisheries Service, Auke Bay, AK.Bison, caribou, moose, and muskoxen.Fish and Game, Juneau, AK.Vol. 10. Project W-17-11. 198 pp.Part II. Deer, elk, and moose.--and Game, Juneau, AK.10. Project W--17--l2. 120 pp.--•-..- - - - -------..U.S. Fish and Wildlife Service SpecialGeen, G.H. 1974. Effects of <strong>hydroelectric</strong> development in WesternJournal Fisheries Research Board ofGoodlad, J.C., T.W. Gjenes, and E.l. Brannon. 1974. Factors affectingsockeye salmon (Oncorhynchus Nerka) growth in four <strong>lake</strong>s of theJournal Fisheries Research Board of Canada.Hall, E.R., and K.R. Nelson. 1959. The mammals of North America.The Ronald Press, New York, NY. 2 vols •Hamilton, J.A., l. O. Rothfus, M.W. Erho, and J.D.Remington. 1966.Use of a <strong>hydroelectric</strong> reservoir for the rearing of coho salmon(Oncorhynchus kisutch). Washington State Department of Fisheries •66 pp ••Hansen, R.M., and S.R. Archer. 1981. Range survey of mountain goatwintering areas. Unpublished. Final report for the U.S. ForestService, Chugach National Forest. 24 pp.Hildebrand, S.G., ed. 1980. Analysis of environmental issues relatedto small-scale <strong>hydroelectric</strong> development III: Water levelfluctuation. Environmental Science Division, Pub. No. 1591. OakRidge National laboratory, Oak Ridge. 78 pp.Hinman, R.A., ed. 1979. Annual report of survey-inventory activities.Part I. Moose, elk, deer. Div. of Game, Alaska Dept. of Fish andGame, Juneau, AK. Federal Aid in Wildlife Restoration. Vol. 10.Project W-17-11. 198 pp.1980a. Annual report of survey-inventory activities. Part II.Div. of Game, Alaska Dept. ofFederal Aid in Wildlife Restoration.1980b. Annual report of survey-inventory activities.Div. of Game, Alaska Dept. of FishFederal Aid in Wildlife Restoration, Vol •10-5
Hu1ten, E. 1968. Flora of Alaska and neighboring territories.Stanford University Press, Stanford, CA. 1008 pp.Hunter, J.W. 1973. A discussion of game fish in the State ofWashington as related to water requirements. Rep. by Fish Manage.Div. Washington State Department of Game to Washington StateDepartment of Ecology, Olympia. 66 pp.Hynes, H.B.N. 1970. The ecology of running waters. LiverpoolUniversity Press. 555 pp.Johannesson, Bjorn. 1982. Observations of a 4°C groundwater source asa release site for Atlantic salmon. Progressive Fish Culturist.Vol. 44, No.3, p. 136-137.Judkins, C. Personal commications 1981, 1982. Owner, Crown PointLodge, Moose Pass, AK.Kessel, B. and D.D. Gibson. 1978. Status and distribution ofAlaska birds. Cooper Ornithological Society, Los Angeles, CA.Studies in Avian Biology 1. 100 p.Koenigs, J. Personal communications, 1981 and 1982. FisheriesRehabilitation Enhancement and Development Div., Alaska Dept. ofFish and Game, Soldotna, AK.Korn, L. and E.M. Smith. 1971. Rearing juvenile salmon in ColumbiaRiver Basin storage reservoirs. Pages 287-298 in Hall, G.E. ed.Reservoir fisheries and limnology. Special Publlcation No.8.American Fisheries Society, Washington, D.C.Kortwright, F.H. 1967. The ducks, geese, and swans of North America.Stackpole, Co., Harrisburg, PA. and Wildlife Management Institute,Washington, D.C. 476 pp.Krema, R.F. and W.E. Farr. 1974. Floating fish traps for capturingof homing salmon. Prog. Fish. Cult. Vol. 36(2):106-107.Lewandoski, K.M., and K.W. Rice. 1980. Owl surveys on the KenaiPeninsula and Afognak Island, Chugach National Forest. Spring1980. Chugach National Forest, U.S. Forest Service. 15 pp.Libby, W.L. 1954. A basis for beaver management in Alaska. M.S.Thesis. University of Alaska, College, AK. 80 pp.Manville, R.H., and S.P. Young. 1965. Distribution of Alaskanmammals. U.S. Bureau of Sport Fisheries and Wildlife. Circular211. U.S. Govlt. Printing Office, Washington, D.C. 74 pp.Merrell, T. 1970. Alaska's fishery resource: the chum salmon. Bureauof Commercial Fisheries, U.S. Fish and Wildlife Service, FisheryLeaflet 632. 7 pp.10-6•..•• .,..•...,..- •.,•• ....•lilt..III•..IIIf•- •.,-........ ..
- ..- - ..-..-..- -..--..--.. -- - ..-..-..-..Meyer, J.R., and J.M. Lee, Jr. 1981. Effects of transmission lineson flight behavior of waterfowl and other birds. In Proc. of theSecond Symposium on Environmental Concerns. in Rights-of-wayManagement, Ann Arbor, Michigan. Oct. 16-18, 1979. EPRI, PaloAlto, CA.McCoy, G.A. 1974. Preconstruction assessment of biological quality ofthe Chena and Little Chena Rivers in the vicinity of the Chena Lakeflood control <strong>project</strong> near Fairbanks, Alaska. U.S. GeologicalSurvey. Water Resources Investigations 29-74. 84 pp.McHenry, T. Personal communication, October 12, 1981. Sport FishDiv., Alaska Dept. of Fish and Game, Seward, AK.Morgan, N.L. (Coordinator). 1980. Secondary Production. Pages247-340 in Le Cren, E.D. and R.H. Lowe-McConnell, eds. Thefunctioning of freshwater ecosystems. IBP Handbook No. 22.Cambridge Univ. Press, Cambridge.Morrow, J.E. 1980. The freshwater fishes of Alaska. Alaska NorthwestPublishing, Anchorage, AK. 272 pp •Murray, D.F. 1980. Threatened and endangered plants of Alaska. U.S.Forest Service and U.S. Bureau of Land Management. 59 pp.Nauman, J.W., and D.R. Kernodle. 1974. Aquatic organisms fromselected sites along the proposed Trans-Alaska Pipeline corridor,September 1970 to September 1972. U.S. Geological Survey,Anchorage, AK. 23 pp.Neilson, J.D. and G.H. Geen. 1981. Enumeration of spawning salmonfrom spawning residence time and aerial counts. Transactions ofthe American Fisheries Society. Vol. 110, p. 554-556.Nichols, L. Personal communication, March 5, 1982. Alaska Dept. ofFish and Game, Cooper Landing, AK.Nichols, L. 1980. Mountain goat management technique studies.of Game, Alaska Dept. of fish and Game, Juneau, AK. federalWildife Restoration. Projects W-17-9, W-17-10, and W-17-l1.Report. 51 pp.Div.Aid inFinalNilsson, N.A., and T. G. Northcote. 1981. Rainbow trout (Salmongairdneri) and cutthroat trout (So clarki) interactions in coastalBritish Columbia <strong>lake</strong>s. Canadian Journal Fisheries AquaticSciences Volume 38, No. 10, p. 1228-1246.Peterson, R.O. 1982. Wolf-moose investigations on the Kenai NationalWildlife Refuge. Final report. Report for U.S. Fish and WildlifeService. 1 vol.10-7
Peterson, R.O. and J.D. Woolington. 1979. The extirpation andreappearance of wolves on the Kenai Peninsula, Alaska. Paperpresented at the Portland Wolf Symposium, Portland, OR, August,1970. 21 pp.Poe, P.H. 1980. Effects of the 1976 volcanic ash fallon primaryproduction in Iliama Lake, Alaska, 1976-78. Masters Thesis.University of Washington. 210 pp.Rankin, D.P. and H.J. Ashton. 1980. Crustacean Zooplankton Abundanceand species composition in 13 sockeye salmon (Oncorphynchus nerka)nursery <strong>lake</strong>s in British Columbia. Canadian Technical ReportFisheries Aquatic Sciences. No. 924, 91 pp.Reiser, D.W. and T.C. Bjornn. 1979. Influence of forest and rangelandmanagement on anadromous fish habitat in western United States andCanada. Habitat requirements of anadromous sa1monids. USDA ForestService, General Technical Report PNW-96. Portland, Oregon. 54 pp.Ricker, W.E. 1974. Hereditary and environmental factors affectingcertain salmonid populations. Pages 27-160 In: R.C. Simon andP.A. Larkin (eds.) The Stock Concept in Pacific Salmon. U.S.Bureau of Commercial Fisheries. Seattle, Washington. 231 pp.Rodgers, D.E. 1968. A comparison of the food of sockeye salmon fryand threespine sticklebacks in the Wood Rines Lakes. In FurtherStudies of Alaska Sockeye Salmon, Univ. Wash. Pub1icatlOns inFisheries - New Series. Vol. III, p. 1-44.Roseneau, D. 1982. Personal communication, March 26, 1982. LGLLimited, Fairbanks, AK.Ruth, R.H. and A.S. Harris. 1979. Management of western hemlockSitka spruce forest for timber production. Pacific N.W. Forest andRange Experiment Station. U.S. Forest Service, Portland, OR.General Technical Report PNW-88-197 pp.Ruttner, F.Press.1974. Fundamentals of limnology. 3rd ed. Univ. of Toronto307 pp.Saunders, G.W. (Coordinator). 1980 Organic matter and decomposers.Pages 341-392 ~ Le Cren, E.D. and R.H. Low~-McConnell, eds. Thefunctioning of freshwater ecosystems. IBP Handbook No. 22.Cambridge Univ. Press, Cambridge.SchleSinger, D.A. and H.A. Regier. 1982. Climatic and morphoedaphicindices of fish yields from natural <strong>lake</strong>s. Transactions AmericanFisheries Society. Vol. 111, p. 124-150.Schoeneman, D.E. and C.O. Junge, Jr. 1954. Investigations ofmortalities to downstream mi<strong>grant</strong> salmon of two dams on the ElwhaRiver. Washington Dept. Fisheries Research Bulletin No.3. 51 pp.10-8•III•....- ....- ..-• •-..••........•..-..- ..•
- --- ---•-..-..-..- - ..- -..-..-..---..-..-..-..Sowls, A.L, S.A. Hatch, and C.J. Lensink. 1918. Catalogue ofAlaska Seabird colonies. U.S. Fish and Wildlife Service.Anchorage. AK.Stockner. J.G. 1911. Lake fertilization as a means of enhancingsockeye salmon populations: The state of the art in the PacificNorthwest. Fisheries Marine Services Technical Report No. 140.14 pp.Stockner. J.G. and K.R.S. Shortreed. 1918. Limnological survey of 35sockeye salmon (Oncorhynchus nerka) nursery <strong>lake</strong>s in BritishColumbia and the Yukon Territory. Fisheries Marine ServicesTechnical Report. Vol. 821. 41 pp .Sumner. F.H. and O.R. Smith. 1940. Hydraulic mining and debris damsin relation to fish life in the American and Yuba rivers ofCalifornia. California Fish and Game 26:2-22.Tarres, J.K. 1980.American birds.The Aububon Society encyclopedia of NorthAlfred A. Knopf, New York, NY. 1109 p.Tennant. D.L. 1916. Instream flow regimens for fish. wildlife,recreation and related environmental resources. Pages 359 to 313 .1-~ Instream Flow Needs, American Fisheries Society.Turbak, S.C .• D.R. Reichle, and C.R. Shriner. 1980. Analysis ofenvironmental issues related to small-scale <strong>hydroelectric</strong>development IV: Fish mortalities resulting from turbine passage.Environmental Science Division. Pub. No. 1591, Oak Ridge NationalLaboratories, Oak Ridge .U.S. Army. Corps of Engineers. 1918. Kenai River review. Anchorage.AK. 334 pp.U.S. Department of Agriculture. Forest Service. No Date. Birds of theChugach National Forest. Seward Ranger District. Unpublished .4 pp.U.S. Department of the Interior. Fish and Wildlife Service. 1961.Ptarmigan and Grant Lakes and Falls Creek, Kenai Peninsula .Juneau. AK. 25 pp.U.S. Geological Survey. 1981. Surface water quality records,southcentral Alaska, 1949-1914. Unpublished computer printout.Vernon. E.H. 1958. Power development on <strong>lake</strong>s in british Columbia.Pages 11-14 in Larkin, P.A. ed. The investigation of fish-powerproblems. Symposium at Univ. of British Columbia, April 29-30,1951. Inst. of Fisheries, Univ. of British Columbia.10 .. 9
Viereck, l.A., and E.l. little. 1972. Alaska trees and shrubs. U.S.Forest Service, Washington, D.C. Agriculture Handbook 410.Viereck, l.A., C.T. Dyrness, and A.R. Batten. 1982. Revision ofpreliminary classification system for vegetation of Alaska.Unpublished. 72 pp.Vinyar, G.l. 1981. Feeding success of hatchery-reared kokanee salmonwhen presented with zooplankton prey. Progressive Fish Cu1turist,Vo 1. 44, No.1. p. 37 -39.Welch, F.B. 1980. Ecological effects of waste water. CambridgeUniversity Press, Cambridge. 337 pp.Whitman, R.P., T.P. Quinn, and E.l. Brannon. 1982. Influence ofsuspended volcanic ash on homing behavior of adult chinook salmon.Trans. Amer. Fish. Soc. 111 :63-69.Whitton, B.A., ed. 1975. River ecology. Univ. of Calif. Press,Berkeley and los Angeles. 725 pp.Wolff, J.O. 1976. Utilization of hardwood browse by moose on theTanana River floodplain of interior Alaska. U.S. Forest Service,Portland, OR. Research Note PNW-267. 7pp.Zippin, C. 1958. The removal method of population estimation. Journ.of Wildlilfe Management. Vol. 22, No.1, p. 82-90.CHAPlER 4 - REPORT ON HISTORICAL AND ARCHAEOLOGICAL RESOURCESAlaska Department of Natural Resources, Division of Parks. 1981.Alaska Heritage Resources Survey Index, updated July 22,1981.file at Office of History and Archeology, Division of Parks,Anchorage.Barry, M.J. 1973. A history of mining on the Kenai Peninsula.Alaska Northwest Publishing, Anchorage.Dilliplane, T. Personal communication, April 20, 1982. Division ofParks, Alaska Department of Natural Resources, Anchorage.Estes, Ed. Personal communication, 1982. Moose Pass, AK.Holbrook, W. 1925. land classification report on the Kenai PeninsulaDivision of the Chugach National Forest, Alaska. On file at SewardDistrict Office, Chugach National Forest, Seward, AK.Iditarod National Historic Trail Project Office, BlM. 1981. TheIditarod National Historic Trail. Seward to Nome Route. Vol. 1: AComprehensive Management Plan. Bureau of land Management,Anchorage District Office, Anchorage, AK.10-10On.. ....•.,•..•-• ...,•..•.. •••...... •.. ••.... •...,•.,.. ....•
-- - ..-..-..-..-..-- - -- - ..---..- - ..-•- ..-..Johnson, B.L. 1912. Gold deposits of the Seward-Sunrise region,Kenai Peninsula. In: Mineral resources of Alaska: Report onprogress of investigations in 1911, by A. H. Brooks et al., pp.131-173. USGS Bull. 520. Government Printing Office, WashingtonD. C •Johnson, B.L. 1919. Mining in central and northern Kenai Peninsula.In: Mineral Resources of Alaska: Report on progress ofInvestigations in 1917, by G. C. Martin et al., pp. 175-176. USGSBull. 692. Government Printing Office, Washington, D. C.Martin, G.C., B.L. Johnson and U.S. Grant. 1915. Geology andmineral resources of Kenai Peninsula, Alaska. USGS Bull. 587.Government Printing Office, Washington, D. C.Mattson, J. Personal communication, 1982. Archeologist, supervisor'soffice, Chugach National Forest, Anchorage, AK.Plafker, G. 1955. Geologic investigations of proposed powersites at Cooper, Grant, Ptarmigan and Crescent Lakes, Alaska. USGSBull. 1031-A. U.S. Government Printing Office, Washington, D. C.Quilliam, R. Personal communication, 1982. U.S. Dept. Agriculture,Forest Service, Seward District, Seward, AK.Smith, T. Personal communication, June 22, 1982. Division of Parks,Alaska Department of Natural Resources, Anchorage, AK.Stewart, B.D. 1937. Report of the Commissioner of Mines to theGovernor for the biennium ended December 31, 1936. Territory ofAlaska.Stewart, B.D. 1939. Report of the Commissioner of Mines to theGovernor for the biennium ended December 31, 1938. Territory ofAlaska •Stewart, B.D. 1941. Report of the Commissioner of Mines to theGovernor for the biennium ended December 31, 1940. Territory ofAlaska.Yarborough, M.R. 1981. Archeological survey of proposeddrilling sites, Grant Lake, Alaska. Cultural Resource Consultants,Anchorage, AK.CHAPTER 5 - REPORT ONSOCIOECONOMIC IMPACTSAlaska Department of Labor. 1979-80. Statistical quarterly.Alaska Department of Labor. 1981. Alaska population review •Battelle Pacific Northwest Laboratories. Railbelt electric poweralternatives study: evaluation of railbelt electric energy plans •1982.10-11
Bowers, B. Personal communication, June 21, 1982. Chugach NationalForest, Anchorage.CH2M Hill. 1979. Land use plan - City of Seward. Kenai PeninsulaBorough and City of Seward, AK.CH2M Hill. 1980. Feasibility assessment - hydropower development atGrant Lake. City of Seward, AK.City of Seward. 1980. Fourth of July Creek industrial park, City ofSeward, AK, <strong>project</strong> description.City of Seward. 1980. Resolution No. 80-39, a resolution requestingthe State of Alaska to approve a <strong>grant</strong> to the Alaska PowerAuthority (SLS CSHB 1002 amS, page 11) to fund the FERC license ofGrant Lake/Seward.Dames and Moore. 1979. Northern Gulf of Alaska petroleum developmentscenarios, Technical Report No. 29. Bureau of Land Management,Outer Continental Shelf Office.Dunham, W. Personal communication, January 19, 1982. AlaskaDepartment of Labor, Seward, AK.Gillespie, J. Personal communication, June 17, 1982.Estate Company, Seward, AK.Seward RealInstitute of Social and Economic Research. 1979. Northern Gulf ofAlaska petroleum development scenarios: economic and demographyimpacts, Technical Report No. 34. Bureau of Land Management,Alaska Outer Continental Shelf Office.Kane, G. Personal communication, January 19, 1982. AlaskaDepartment of Community and Regional Affairs, Anchorage, AK.Kenai Peninsula Borough School District. No date. Enrollment<strong>project</strong>ions and school construction needs - 1982-1983 through1986-1987. Soldotna, AK.Kenai Peninsula Borough. 1977. Profile of five Kenai Peninsula towns.Soldotna, AK.Kenai Peninsula Borough. 1982. Situation and Prospects -- KenaiPeninsula Borough. Soldotna, AK.Lahnum, D. Personal communication, August 17, 1982. Kenai PeninsulaBorough, Soldotna, AK.Martin, K. Personal communication, June 17, 1982. City of Seward,AK.10-12..•• ..•-II..•.... .... ....•..••••....till•••......•-...... ..
- - - -..-..-..- --..-..- - - ------ -..-..-..-..-..McIlhargey, F. Personal communication, January 18, 1982 and June 18,1982. Kenai Peninsula Borough.Peter Eakland and Associates. 1980. Northern Gulf of Alaska petroleumdevelopment scenarios transportation systems <strong>analysis</strong>, TechnicalReport No. 31. Bureau of land Management, Alaska Outer ContinentalShelf Office.R. W. Beck and Associates. Kenai Peninsula power supply andtransmission study supplement. 1982.Shaeffermyer, D. Personal communication, January 18, 1982 and June 17,1982. Asst. City Manager, City of Seward, AK.Simpson Usher Jones, Inc. 1979. Growth management strategy.Anchorage, AK.U.S. Department of Commerce, Bureau of the Census. 1981. 1980 censusof population and housing.U.S. Department of Commerce, Bureau of Economic Analysis. 1982.Survey of current business •U.S. Department of labor, Bureau of labor Statistics. 1975-1981.Historical report on labor force and employment (unpublished).CHAPTER 6 - REPORT ONGEOLOGICAL AND SOIL RESOURCESBolt, B.A. 1973. Duration of strong ground motion: Fifth WorldConf. Earthquake Engineering, Rome.Campbell, Kenneth W. 1981. Near-source attenuation of peak horizontalacceleration. Bulletin of the Seismological Society of America,Vol 71, p. 2039-2070.Foster, H.F. and Karlstrom, T.N. 1967. Ground breakage andassociated effects in the Cook Inlet Area, Alaska, resulting fromthe March 27, 1964 earthquake. U.S. Geological Survey ProfessionalPaper 543-F.Joyner, W.B. and D.M. Boore. 1981. Peak horizontal acceleration andvelocity from strong-motion records including records from the 1979Imperial Valley, California, Earthquake. Bulletin of theSeismological Society of America, Vol. 71, p. 2011-2038 •Krinitzsky, E.l., and F.K. Chang. 1977. Specifying peak motionsfor design earthquakes: U.S. Army Corps of Engineers,Miscellaneous Paper MP 5-73-1, Report 7, Waterways ExperimentStation, Vicksburg, MI., 34 p.10-13
Plafker, G. 1955. Geologic investigations of proposed power sites atCooper, Grant, Ptarmigan, and Crescent Lakes, AK. U.S. GeologicalSurvey Bulletin 1031-A.1969. Tectonics of the March 27, 1964 Alaska earthquake.U.S. Geological Survey Professional Paper 543-1._--:-:--=---:-'R & M Consultants. 1982. Grant Lake Hydroelectric Project, Interimgeological report.Slemmons, D.B. 1977. Faults and earthquake magnitude: U.S. ArmyCorps of Engineers, Waterways Experiment Station, Vicksburg,Mississippi, Miscellaneous Paper S-73-1, Report 6, 129 p.Tysdal, R.G. and J.E. Case. 1969. Geologic map of the Sewardand B1ying South Quadrangles, AK. U.S. Geological Survey Map1-1150.Wyss, M. 1980. Estimating maximum expecta~le magnitude of earthquakefrom fault dimensions: Geology, v. 7, p. 336-340.CHAPTER 7 - REPORT ON RECREATIONAL RESOURCES...Alaska Department of Commerce and Economic Development, Division ofTourism. 1982. Alaska travel directory. Juneau, AK.Alaska Department of Natural Resources, Division of Parks. 1981.Estimated facility costs. Unpublished.Alaska Department of Natural Resources, Division of Parks. 1982.Alaska state park system: southcentra1 region plan. Anchorage, AK.Alaska Department of Transportation. 1982. Traffic counts on AlaskaHighway at Moose Pass, 1981. Unpublished.Albrecht, A. Personal communication, January 14, 1982. Forest StaffOfficer, U.S. Department of Agriculture, Forest Service, ChugachNational Forest, Anchorage, AK.DeVore, C. Personal communication, August 20, 1982. RecreationSpecialist, U.S. Department of Agriculture, Forest Service, ChugachNational Forest, Seward, AK.Hennig, S. Personal communications, August and September, 1982.Landscape Architect, U.S. Department of Agriculture, ForestService, Chugach National Forest, Anchorage, AK.Johnson, R. Personal communication, August 16, 1982. RecreationSpecialist, U.S. Department of Interior, Fish and Wildlife Service,Kenai National Wildlife Refuge, Soldotna, AK.10-14....• ..•..- ..- .. ...... ....•..•..•......••- •.... ....-
- ------------- - ----- ----- - -- - ..- - ..Pfleger, L. Personal communication, August 20, 1982. Flying serviceoperator, Moose Pass, AK.Quilliam, R. Personal communications, 1982. Resource Assistant, U.S.Department of Agriculture, Forest Service, Chugach National Forest,Seward, AK.Schaefermeyer, D. Personal communication, June 17, 1982. AssistantCity Manager, Seward, AK.Schwartz, C. Personal communication, June 18, 1982. Research WildlifeBiologist, Alaska Department of Fish and Game, Soldotna, AK.Spraker, T •• Personal communications, June and July, 1982. GameManagement Officer, Alaska Department of Fish and Game, Soldotna,AK.Tallerico, J. Personal communication, June 21, 1982. RecreationSpecialist, U.S. Department of Agriculture, Forest Service, ChugachNational Forest, Anchorage, AK.U.S. Department of Agriculture, Forest Service, Chugach National Forest.1982a. Recreation information management (RIM) data, fiscal years1979-1981. Unpublished.1982b. Draft forest plan and Nellie Juan-CollegeFiord wilderness study report. Anchorage, AK.__ ~=-___ ~~~ ____ . 1982c. Draft environmental impact statement,Chugach National forest plan and Nellie Juan-College Fiordwilderness study report. Anchorage, AK.U.S. Department of the Interior, Fish and Wildlife Service. 1982.Kenai national wildlife refuge. Pamphlet. Anchorage, AK.U.S. Department of the Interior, National Park Service. 1982.National wild and scenic rivers system map. Washington, D.C.Wiles, J. Personal communication, June 22, 1982. Recreation Planner,Alaska Department of Natural Resources, Division of Parks,Anchorage, AK.Wilson, G. Personal communications, 1982. Forest Service. U.S.Department of Agriculture, Forest Service, Chugach National Forest,Seward, AK.CHAPTER 8 - REPORT ON AESTHETIC RESOURCESArctic Environmental Information and Data Center (AEIOC). 1982.Summary of environmental knowledge of the proposed Grant LakeHydroelectric Project area. Final Report submitted to EbascoServices, Inc., Bellevue, WA.10-15
Alaska Department of Transportaiton. 1982. Traffic count data, MoosePass maintenance station, Alaska, years 1980 and 1981. Unpublished.Federal Energy Regulatory Commission. 1981. Federal Register, Vol.46, No. 21.: Regulations governing application for license formajor unconstructed <strong>project</strong>s and major modified <strong>project</strong>s;application for license for transmission lines only; andapplication for amendment to license, Washington, D.C., U.S.Government Printing Office, p. 10174.Hennig, S. Personal communication, September 2, 1982. LandscapeArchitect, U.S. Department of Agriculture, Forest Service.Anchorage, AK.Litton, R.B., Jr. 1968. Forest landscape description and inventories- a basis for land planning and design. Berkeley, CA, Pacific SWForest and Range Exp. Stat., 64 pp. (USDA Forest Service Res.Paper PSW-49).U.S. Department of Agriculture, Forest Service. 1974. Nationalforest landscape management: the visual system Vol. 2, Chapter 1,Washington, D.C., U.S. Govt. Printing Office, 47 pp. (AgriculturalHandbook No. 462).U.S. Department of Agriculture, Forest Service, Chugach National Forest.1978. Visual resource, management data, Grant Lake area.Unpublished maps.U.S. Department of Agriculture, Forest Service, Alaska Region. 1979.Visual character types. Division of Recreation, Soils, andWatersheds, Juneau. Series No. R10-63.U.S. Department of Agriculture, Forest Service, Chugach National Forest.1982. Recreation information management (RIM) data, fiscal years1979-1981. Unpublished.CHAPTER 9 - LAND USEFederal Emergency Management Agency, Federal Insurance Administration.1981. Flood insurance rate map, Kenai Peninsula Borough, AK.Panels 2175 and 2525. Bethesda, MD.Moore, J. Personal communication, October 14, 1982. Soil Scientist,U.S. Department of Agriculture, Soil Conservation Service,Anchorage, AK.Quilliam, R. Personal communication, August 20, 1982. ResourceAssistant, U.S. Department of Agriculture, Forest Service, ChugachNational Forest, Seward, AK.10-16.. ......•..•..- ..- ..- •.. ••..•• ..II..- ..-II- ..-..•..-
-..- - - ---..U.S. Department of Agriculture, Forest Service, Chugach National Forest.1982a. Mining claim records. Unpublished.1982b. Draft forest plan and Nellie Juan-CollegeFiord wilderness study report. Anchorage, AK.Wolf, W. Personal communication, October 14, 1982. Office of theGovernor, Division of Policy Development and Planning, StateClearinghouse, Juneau, AK.----..-- ..-..- ..----..-III-..10-17