CRATER LAKE PHASE - Alaska Energy Data Inventory
CRATER LAKE PHASE - Alaska Energy Data Inventory
CRATER LAKE PHASE - Alaska Energy Data Inventory
- No tags were found...

Create successful ePaper yourself
Turn your PDF publications into a flip-book with our unique Google optimized e-Paper software.
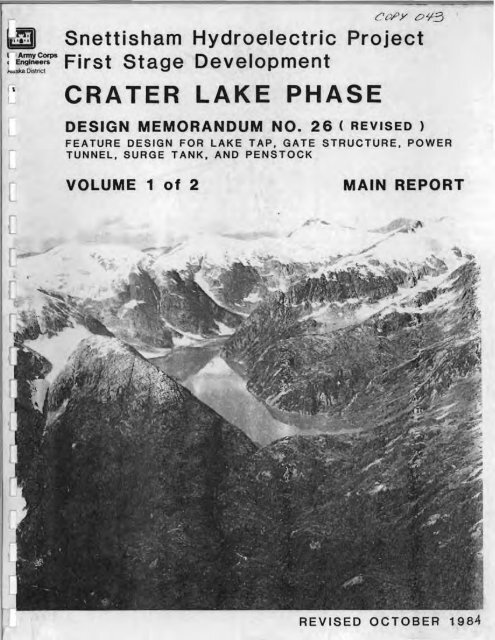
c{~y o$i3 iSnettisham Hydroelectric ProjectArmy Corps F· t S t D I t( :g~:~~s Irs age eve opmen<strong>CRATER</strong> <strong>LAKE</strong> <strong>PHASE</strong>DESIGN MEMORANDUM NO. 26 ( REVISED)FEATURE DESIGN FOR <strong>LAKE</strong> TAP, GATE STRUCTURE, POWERTUNNEL, SURGE TANK, AND PENSTOCKVOLUME 1 of 2MAIN REPORTREVISED OCTOBER
DEPARTMENT OF THE ARMYu.s. AallY BMorMEER DISTRICT, ALASKAPOUCH 818ANCHOIlAG B, ALASKA 99608-0898REPLY TOHTENTiON OFNPAEN-PM-CSUBJECT: Snettisham Hydroelectric Project, <strong>Alaska</strong>Second Stage Development, Crater Lake PhaseRevised Design Memorandum No. 26, Feature Designfor the Lake Tap, Gate Structure, Power Tunnel,Surge Tank, and Penstock? c JeT"-' ~Commander, North Pacific DivisionATTN: NPDEN-TE1. Forwarded for your review and approval are 15 copies of the subjectreport, prepared in accordance with ER 1110-2-1150.2. Volume 1 contains the main report and feature design level drawingsthat provide a detailed description of the major components of the recommendedCrater Lake phase development for the Snettisham Hydroelectricproject. Also included in Volume 1, as exhibits, are the reports for anumber of investigations that were conducted to provide us with the informationnecessary to develop a sound design.3. Volume 2, Technical Appendices, contains the results of our geophysicalinvestigations through 1983, hydraulic design calculations, and thetheory used for design of the encased penstoc~ alternatives.4. This revised document incorporates NPD and aCE review comments on theoriginal November 1983 design memorandum, the approved design in Appendix Dof the 1983 DM26 (which served as the authorization to prepare Crater LakePhase 1 P&S in May 1984), and the Crater Lake Phase 1 plans and specifications.5. Request your approval at the earliest possible date so that we canmaximize our efforts in the development of plans and specifications tosupport the scheduled award of the Crater Lake Main Contract in lateFY85 or early FY86.FOR THE COMMANDER:1 Incl (15)asChief, Engineering Division
-SNETTISHAM PROJECTALASKASECOND STAGE DEVELOPMENT<strong>CRATER</strong> <strong>LAKE</strong> <strong>PHASE</strong>REVISED DESIGN MEMORANDUM NO. 26VOLUME 1 of 2MAIN REPORT
ABBREVIATIONSThe following is a list of definitions for abbreviations used in thisreport.acre-ftaveBtuCdcftft2ft3ft/minft/sft3/sft/s2ga 1gal /mi nga 1 /yrGWhhhpI, 10inin /sin/yrKVAkWkWhlb1 b /ft21 b/ft3lb/hrlb/in2a1 b/"i n 2 gMmimi /hrmi2minmoMSLMWMWhpctr/minsVWWYyd 3yrofSource:acre-footaverageBritish thermal unitdegrees Celsiusdirect currentfootsquare footcubic footfoot per minutefoot per secondcubic foot per secondfoot per second squaredga 11 ongallons per minutegallons per yeargigawatt hourhourhorsepowermodified Mercalli intensityinchinch per secondinch per yearkilovoltamperekilowattkilowatt hourpoundpound per square footpound per cubic footpounds per hourpounds per square inch absolutepounds per square inch gageRichter magnitudemilemil es per hoursquare mil eminutemonthmean sea levelmegawattmegawatt hourpercentrevolutions per minutesecondvoltwattwater yearcubic yardyeardegree Fahrenheitu.S. Government Printing Office Style Manual, January 1973i
SNETTISHAM HYDROELECTRIC PROJECT, ALASKAAerial view of the project area showing the approximate alinement of the e,dsting Long Lake phasefacilities and the racommended Crater Lake phase facilities in relation to the powerhousePHOTO TAKEN IN 1968
SNETTISHAM PROJECT, ALASKASchedule of Design MemorandaNo.Subject1. HYDROLOGY2. HYDROPOWER CAPACITY3. SELECTION OF PLAN OF DEVELOPMENTRevised4. PRELIMINARY MASTER PLAN5. ACCESS AND CONSTRUCTION FACILITIESRevisedSUPPLEMENT NO. 16. (DELETED)7. GENERAL DESIGN MEMORANDUMSUPPLEMENT NO.1, Concrete Aggregate Investigation8. PRELIMINARY DESIGN REPORT ON POWERHOUSERevised9. TRANSMISSION FACILITIESSUPPLEMENT NO.1, Direct Current TransmissionSUPPLEMENT NO.2, Direct Current TransmissionSUPPLEMENT NO.3, Juneau Substation AutotransformersSUPPLEMENT NO.4, Taku Inlet Submarine CableSUPPLEMENT NO.5, Permanent CommunicationsSUPPLEMENT NO.6, Juneau SUbstationSUPPLEMENT NO.7, Suspension InsulatorSUPPLEMENT NO.8, Transmission Line StructuresSUPPLEMENT NO.8, Transmission Line ConstructionSUPPLEMENT NO. 10, Relocation of PowerlineFacilities for Juneau SUbstation10. POWER TUNNEL, SURGE TANK & PENSTOCKSUPPLEMENT NO. 111. REAL ESTATE12. (DELETED)13. DAM, SPILLWAY, & INTAKE STRUCTURESUPPLEMENT NO. 114. PERMANENT OPERATING EQUIPMENT15. BUILDING, GROUNDS & UTILITIES16. PLAN OF DIVERSION17. (DELETED)18. POWERHOUSE PENSTOCK BIFURCATION19. POWERHOUSE ARCHITECTURAL DESIGN20. POWERHOUSE STRUCTURAL DESIGN21. POWERHOUSE MECHANICAL DESIGN22. POWERHOUSE ELECTRICAL EQUIPMENT23. <strong>CRATER</strong> <strong>LAKE</strong> PLAN OF DEVELOPMENT24. POWERHOUSE DESIGN REPORT25. (DELETED)26. <strong>CRATER</strong> <strong>LAKE</strong>-<strong>LAKE</strong> TAP, GATE STRUCTURE,POWER TUNNEL, SURGE TANK, AND PENSTOCK,SUPPLEMENT NO.1, Materials Investigation(Revised Design Memorandum 26)Date15 October 196431 October 196422 January 19657 May 196522 Apri 1 196526 November 196529 April 19666 March 196713 November 196514 September 196729 August 196629 June 196723 December 196619 January 196810 February 196920 August 19703 September 197022 September 197024 February 197130 December 197012 February 197017 June 197111 August 19719 September 196627 May 196827 March 196730 January 196724 September 197129 March 197211 May 196722 July 196619 September 196713 December 196729 December 196710 January 196821 September 197328 December 197328 December 197325 November 198325 November 198329 October 1984iii
SNETTISHAM PROJECT, ALASKA<strong>CRATER</strong> <strong>LAKE</strong> <strong>PHASE</strong>PERTINENT DATALOCATION:Near the mouth of Speel River, 28 mi southeast of Juneau, <strong>Alaska</strong>.AUTHORIZED:Flood Control Act of 1962, providing for design and construction by theCorps of Engineers and for operation and maintenance by the Department ofthe Interior.PLAN:Construct an underground power conduit from the existing undergroundpowerhouse to Crater Lake. Install an additional turbine and generator inthe powerhouse.PROJECT FEATURES:NOTE:Datum.All elevations cited in this report are in feet and refer to ProjectMSL is 2.9 ft below Project Datum.Elevations of Tide Planes at Speel River with respect to Mean Lower LowWater and Project Datum are as follows:Highest Tide (Estimate)Mean Higher High WaterMean High WaterHalf Tide Level (MSL)Mean Low WaterMean Lower Low WaterLowest Tide (Estimate)MLLW22.515.914.88.21.60.0-5.7PROJECT DATUM11.44.83.7-2.9-9.5-11. 1-16.8Tidal Datum Planes are based on 7 mo (1/65 to 8/65) of automatic gageoperation by USGS.Drainage area, mi2Annual runoff, minimum, acre-ftAnnual runoff, average, acre-ftAnnual runoff, maximum, acre-ftHydrology11.4113,000145,500186,750iv
ReservoirMaximum observed surface elevation, ft1 ,019Elevation of natural lake outfall, (full-power pool), ft1,017Elevation of minimum operating pool, ft820Initial active storage capacity, acre-ft81,500Area of reservoir at full pool, acres330Area of reservoir at minimum pool, acres145Lake TapTypeOpen system/wet tunnelSize, ft12 (d i a.) by 10Lake bottom elevation at tap, ft799Primary Rock TrapLocation1 ake tapBottom area, ft21 , 152Volume of tap material contained, yd386Invert elevation, ft753.5 to 761.5Secondary Rock TrapLocationTypeSize, ftInvert elevation, ftLocationType400 ft downstream of lake tapExpanded horseshoe section with excavated invert20 wide by 11 high by 60 long776Gate Structure200 ft downstream of sec. rock trapWet-well in rockService room floor elevation, ft1,040Invert elevation, ftMaximum operating head, ft789233v
Maximum momentary head, ft(during lake tap blast)Service gate, quantityTypeSize, ftBulkhead, quantitySize, ft295Slide6.B by B.5B.7 by 9.3Power TunnelTypeModified horseshoeTotal length, ft6,020Unlined length, ft4,975Diameter (modified horseshoe), ft 11Shotcrete lined length, ft920Concrete lined length, ft125Diameter (circular), ftFinal Rock Trap9LocationTypeSize, ftStorage capacity, yd 3Invert elevation, ftLocationType5,400 ft downstream of gate structureExpanded horseshoe section with excavated invert15 wide by 15 high by 100 long96126 to 109Surge Tank5,160 ft downstream of gate structurevented vertical shaftDiameter, ft 10Top elevation, ft1,OBOBottom elevation, ft 145.3Power tunnel invert elevation, ft 150.0vi
Drift tunnel length, ft 60TypePenstockUnderground, unencased steelLength, ft 903Steel penstock inner diameter, ft 6Number of additional unitsType of TurbinePowerhouseVertical FrancisTurbine rated capacity, hp 47,000(based on rated net head, full gate, and generator rated capacity)Generator nameplate rated capacity, KVAAnnual firm output, kWhAverage annual non-firm output, kWhTailwater elevation, ft(1) Maximum net head, ftDischarge at maximum net head, ft3/sPool elevation at maximum net head, ft(2) Design net head (rated net head), ftDischarge at design net head, ft3/sPool elevation at average net head, ft(3) Minimum (critical) net head, ftDischarge at minimum net head, ft3/sPool elevation at minimum "net head, ft(4) Maximum discharge (hydraulic capacity), ft3/s /34,500105,100,00016,100,00011.0-12.5990.54301,019945.5300967788.0470820518(1) Based on generation of 31.05 MW at maximum pool and plantefficiency = 86 pct.(2) Based on generation of 20.70 MW at average pool and plantefficiency = 86 pct.vii
'(3) Based on generation of 27.3 MW (guaranteed output) at minimum pool andplant efficiency = 86 pct.(4) Maximum discharge is based on the Long Lake turbine model with aprototype throat diameter of 51.5 inches, 100 pct wicket gate opening, andgenerator blocked output of 34.5 KVA. This occurs at a net turbine head of912 ft.viii
SNETTISHAM HYDROELECTRIC PROJECT, ALASKA<strong>CRATER</strong> <strong>LAKE</strong> <strong>PHASE</strong>REVISED DESIGN MEMORANDUM NO. 26<strong>LAKE</strong> TAP, GATE STRUCTURE, POWER TUNNEL, SURGE TANK, PENSTOCKPARAGRAPH1.011.021. 031.041.051.062.012.022.032.043.013.023.034.014.024.034.044.054.065.015.025.03TABLE OF CONTENTSLIST OF ABBREVIATIONSSYNOPSISSCHEDULE OF DESIGN MEMORANDAPERTINENT DATAProject AuthorizationProject LocationStage DevelopmentPurpose and ScopePrior InvestigationsLocal CooperationEnvironmental SettingHydrologyRegional GeologyTectonic SettingSECTION 1 - GENERALSECTION 2 - REGIONAL DESCRIPTIONSECTION 3 - RECOMMENDED PLANGeneralRecommended PlanChanges from Approved PlanSECTION 4 - ALTERNATIVESGeneralAlternative IAlternative IIAlternative IIIComparison to the Recommended PlanPrimary Trashrack/Lake DrawdownGeneralWater Supply StudiesGlacial Mass Balance StudySECTION 5 - HYDROLOGYPAGE1-11 -11-11-21-21-32-12-12-22-23-13-13-24-14-14-34-34-54-65-15-15-1ix
PARAGRAPH6.016.026.036.046.05 _6.067.017.027.037.047.057.067.078.018.028.038.048.059.019.029.039.049.059.069.079.0810.0110.0210.0310.0410.0510.06TABLE OF CONTENTS(Continued)SECTION 6 - GEOLOGYGeneralCompleted Explorations and InvestigationsProject Site GeologyTectonics and Seismic Risk StudiesEngineering GeologyFuture InvestigationsGeneralLake Tap LocationOrificePrimary Rock TrapTapping OperationPrimary TrashrackTwo-Step Lake TapGeneralShaftOperational FacilitiesMechanical DesignElectrical DesignSECTION 7 - <strong>LAKE</strong> TAPSECTION 8 - GATE STRUCTURESECTION 9 - POWER TUNNELGeneralPower TunnelPower Tunnel Emergency Plugs and BulkheadsRock TrapsSecondary TrashrackPlug and BulkheadTunnel Filling and Draining ProceduresRock Cover Criteria for Unlined TunnelSECTION 10 - SURGE TANKGeneralDescription of Recommended Surge TankSelection of Surge Tank DiameterMaximum and Minimum SurgesSystem Without a Surge TankSurge Tank LocationPAGE6-16-16-16-36-56-67 -17-17 -17-17-27-37-48-18-18-38-38-69-19-19-29-39-39-39-39-410-110-110-110-110-210-2x
PARAGRAPH11.0111.0211.0311.0411.051.1. 0611.0712.0112.0212.0312.0412.0513.0113.0213.0313.0413.0513.0613.0714.0114.0215.0115.0215.0315.0415.0515.0615.0716.0116.02GeneralSupports and AnchorageLongitudinal LoadingDesign CriteriaSteel SelectionFabrication and PlacementTestingTABLE OF CONTENTS(Continued)SECTION 11 - PENSTOCKSECTION 12 - POWERHOUSEGeneralChanges from Approved Powerhouse PlanProject Feature Operational ControlsMachine ShopTailrace and Tailwater ElevationsSECTION 13 - INSTRUMENTATIONGeneralLake TapTunnelLake Surface ElevationPressure Measuring Devices in Lower Tunneland PowerhouseMaintenanceSignal TransmissionsSECTION 14 - MATERIAL SOURCES AND DISPOSAL SITESSourcesDisposal SitesSECTION 15 - PERMANENT FACILITIESGeneralBarge AccessAirfieldCrater Cove Access RoadWastewater Treatment and DisposalMachine ShopIncineratorGeneralRecommended PlanSECTION 16 - CONSTRUCTION FACILITIESPAGE11-111-111-111-111-111-211-212-112-112-212-312-313-113-113-113-313-313-413-414-114-215-115-115-115-115-115-215-216-116-1xi
, TABLE OF CONTENTS(Continued)PARAGRAPHPAGESECTION 17 - OPERATION AND MAINTENANCE17.01 General 17-117.02 Operation, Maintenance, and Replacement Costs 17 -1SECTION 18 - ENVIRONMENTAL CONSIDERATIONS18.01 General 18-118.02 Impacts of Project Construction 18-118.03 Impacts of Project Operation 18-118.04 Mitigative Measures 18-118.05 Compliance with Environmental Requirements 18-2SECTION 19 - CONSTRUCTION SCHEDULE19.01 General 19-119.02 Contracts 19-1SECTION 20 - PROJECT COST COMPARISON20.01 General 20-120.02 Recommended Plan Estimate of Cost 20-120.03 Basis for Estimate 20-120.04 Comparison of Recommended Plan Estimate andCurrent Approved Costs 20-1SECTION 21- POWER STUDIES AND ECONOMICS21.01 General 21-121.02 Power Market Area 21-121.03 Future Power Requirements 21-121.04 Thermal Alternative and Power Values 21-721.05 Power Studies 21-921.06 Project Costs and Benefits 21-12SECTION 22 - REAL ESTATE'--22.01 General 22-1SECTION 23 - COORDINATION WITH OTHERS23.01 <strong>Alaska</strong> Power Administration 23-123.02 US Fish' and Wildlife Service 23-123.03 US Forest Service 23-123.04 National Marine Fisheries Service 23-123.05 Federal <strong>Energy</strong> Regulatory Commission 23-123.06 <strong>Alaska</strong> Department of Fish and Game 23-1xii
24.0124.0224.03SECTION 24 - SUMMAR~DiscussionConclusionRecommendation-AND RECOMMENDATIONSECTION 25 - DETAILED COST ESTIMATES24-124-124-1TABLELIST oF" TABLES2-A Great Earthquakes in Southern <strong>Alaska</strong>5-A Average Monthly Flows for Crater Creek6-A Summary of Explorations10-A Surge Tank Location Transient Characteristics11-A Penstock Steel Comparative Characteristics19-A Construction Contracts Schedule20-A Costs of Recommended Plan and Latest Approved Costs21-A Juneau Area <strong>Energy</strong> and Peak Demand21-B Juneau Area Power Requirements21-C At-Market Value of Dependable Hydroelectric Power21-D Real Fuel Escalation Rates and Value of <strong>Energy</strong>21-E Juneau Area <strong>Energy</strong> Use21-F Annual Project Costs21-G Annual Costs of Recommended Plan21-H Annual Demands and Benefits21-1 Project Economics25-A Recommended Plan Summary Cost Estimate25-B Recommended Plan Detailed Cost Estimate25-C Alternative Plan I Summary Cost Estimate25-0 Alternative Plan I Detailed Cost Estimate25-E Alternative Plan II Summary Cost EstimatePAGE2-35-26-210-211-219-120-121-321-421-821-921-1121-1321-1321-1421-1425-225-425-1325-1425-22xiii
n25-F25-GAlternative Plan II Detailed Cost EstimateAlternative Plan III Summary Cost Estimate25-2325-3125-HAlternative Plan III Detailed Cost Estimate25-32LIST OF FIGURES1 •Upper Hemisphere Stereographic Plot ofDiscontinuities6-42.Juneau Loads and Resources21-6LIST OF PLATES1.Location and Vicinity Map, Project General Plan2.Power Tunnel Plan and Profile3.Penstock Profile4.Power Tunnel Sections5.Penstock Tunnel Sections and Details,6.Tunnel Access Adit Plan and Profile7.Tunnel Plug and Secondary Trashrack8.Tunnel Plug Bulkhead Details9.Tunnel A1inement in LakerTap Area10.Lake Tap Clearing Recommended Plan, Slusher Method11 •Lake Tap and Primary Rock Trap Plan and Profile. 12.Lake Tap and Primary Rock Trap Sections and Details13.Primary Trashrack14.Power Tunnel Emergency Plug and Bulkhead (Typical)15.Gate Structure16.Service Gate Details17.Gate Position Indicators and Hydraulic Cylinder18.Bulkhead and Slide Gate Hoist19.Gate Structure Access Adit and Portal20.Secondary Rock Trapxiv
21. Final Rock Trap and Secondary Trashrack22. Surge Tank23. Alternative I Plan and Profile24. Alternative I Gate Structure Plans and Sections25. Penstock Profile for Alternatives I and II26. Alternative II Plan and Profile27. Alternative II Gate Structure Plans and Sections28. Alternative III Power-Tunnel Plan and Profile29.30.,31.32.33.34.35 •.Alternative III Penstock ProfileAlternative III Gate StructureAlternative III Service Gate DetailsAlternative III Bulkhead and Service Gate HoistAlternative III Gate Structure Access Adit and PortalAlternative III Final Rock Trap and Secondary TrashrackAlternative III Final Rock Trap Access Adit Plug Plan andSections36.37.38.39.40'.41.42.43.44.45.46.47.Alternative III Air Chamber Surge TankLake Tap Clearing Alternate Plan, Clamshell MethodAlternative Primary TrashrackAlternative Primary Trashrack BulkheadAlternative Primary Trashrack Bulkhead HoistGeology Plan and Profile - Power TunnelGeology Sections No. 1 - Lake Tap and Gate StructureGeology Sections No.2 - MiscellaneousGeology Profile - PenstockMaterials Sources and Disposal SitesStorage - Elevation and Area - Elevation CurvesMonthly Inflow Distribution and Elevation Duration Curvesxv
48.49.50.51.Reservoir Regu1ation~ Years 1914-1941Reservoir Regu1ation~ Years 1942-1968Tunnel and Penstock Optimization/Comparative CostsSensitivity Analysis of Penstock and Power TunnelOptimizationxvi
LIST OF EXHIBITS1. Snettisham Hydropower Project t Long Lake Power Conduit and PowerhouseInspection Report; <strong>Alaska</strong> Districtt Corps of Engineers; 12 July 1983.2. Seismic Risk Assessment t Crater Lake Phase t Snettisham, <strong>Alaska</strong>; DOWLEngineers, Anchorage, <strong>Alaska</strong>; July 1982.3. Side-Scan Sonar and Subbottom Profiling Survey, Crater Lake, <strong>Alaska</strong>;Ocean SurveYt Inc., Old Saybrook, Connecticut; September 1983.4. Crater Lake - Lake Tap Investigation, Po1arconsu1t, Inc. t Anchorage,<strong>Alaska</strong>; November 1982. With Indorsements.5. Lake Tap Clearing Feasibility Study, Crater Lake Phase t Second StageDevelopment, Snettisham, <strong>Alaska</strong>; Tryck, Nyman and Hayes, Anchorage, <strong>Alaska</strong>;June 1984.6. Snettisham Crater Lake - WES Review of Final Lake Tap Blast; 20 July1984.7. Juneau Area Power Market Analysis, U.S. Department of <strong>Energy</strong>, <strong>Alaska</strong>Power Administration; September 1980.'8. Addendum to Juneau Area Power Market, U.S. Department of <strong>Energy</strong>,<strong>Alaska</strong> Power Administration; October 1980.9. Juneau Area Power Market Analysis Update of Load Forecast, U.S.Department of <strong>Energy</strong>, <strong>Alaska</strong> Power Administration; August 1981.10. Juneau Area Power Market Analysis Update of Load Forecast, U.S.Department of <strong>Energy</strong>, <strong>Alaska</strong> Power Administration; July 1982.11. Partial Update of July 1982 Juneau Load Forecast, U.S. Department of ,<strong>Energy</strong>, <strong>Alaska</strong> Power Administration; November 1982.12. Juneau Area Power Market Analysis Update of Load Forecast; U.S.Department of <strong>Energy</strong>, <strong>Alaska</strong> Power Administration; September 1983.13. Juneau Area Power Market Analysis Update of Load Forecast; U.S.Department of EnergYt <strong>Alaska</strong> Power Administration; May 1984.14. <strong>Energy</strong> Resource Analysis, Federal <strong>Energy</strong> Regulatory Commission;April 1982.Volume 2 of. 2 - APPENDICESA. GEOTECHNICAL DATAB. HYDRAULIC DESIGNC. PENSTOCK DESIGNxvi i
REFERENCES1. Mattimoc, J. J., Tinney, R. E., Wolcott, W. W., IIRock Trap Experiencein Unlined Tunnels,1I Journal of the Power Division, ASCE, October 1964,pp. 29-45.2. Boillat, J. L., & Graf, W. H., "Settling Velocities of SphericalParticles in Turbulent Media," Journal of Hydraulic Research, Vol. 20,1982, No.5, pp. 395-413.3. Boillat, J. L., & Graf, W. H., "Settling Velocities of SphericalParticles in Calm Waters," Journal of the Hydraulics Division, ASCE,Vol. 107, No. HY10, October 1981, pp. 1123-1131.4. Rouse, H., "Engineering Hydraulics," John Wiley & Sons, 1949,pp. 780-782, 206.5. Reinus, Erling, IIHead Loss in Unlined Rock Tunnels,1I Water Power,July-August 1970, pp. 457-464.6. Rahm, Lennart, "Friction Losses in Swedish Rock Tunnels,1I Water Power,December 1958, pp. 457-464.7. Wright, D. E., Cox, D. E., and Cheffins, O. W., IIPhotogrammetricMeasurement of Rock Surfaces in a Power Tunnel," Water Power, June-July1969, pp. 230-234, 274-279.8. Munsey, Thomas, IIUnique Features of the Snettisham Hydro Project,1I TheNorthern Engineer, Fall & Winter 1976, Vol. 8, No.3 & 4, pp. 4-13.9. Creager, W. P., and Justin, J. D., Hydroelectric Handbook, SecondEdition, 1950, John Wiley & Sons, Inc., pp. 100-102, 547, 546.10. Rathe, L., IIAn Innovation in Surge-Chamber Design,1I Water Power andDam Construction, June/July 1975.11. Bergh - Christensen, J., "Surge Chamber Design for Jukla," Water Powerand Dam Construction, October 1982.12. Chaudhry, M. H., IIApplied Hydraulic Transients,1I 1979, littonEducational 'Publishing, Inc.13. Svee, R., "Surge Chamber with an Enclosed, Compressed Air-Cushion,1IInternational Conference on Pressure Surges, 6-8 September 1972, CopyrightBHRA Fluid Engineering 1972.14. Rich, G. R., "Hydraulic Transients," Second Revised and EnlargedEdition, Dover Publications, Inc., 1963.15. Wallis, S., IIMountain Top Tunnels Tap Glacier for Hydropower, II Tunnelsand Tunneling, March 1983.16. U.S. Dept. of Interior, IIDesign of Small Dams," 1974, p. 465.xvi i i
17. Rajaratnam, N., IIErosion by Plane Turbulent Jets,1I Journal ofHydraulic Research, IAHR. Vol. 19, No.1, 1991, pp. 334-358.18. Simons, D. and Senturk, F., IISediment Transport Technology, II WaterResources Publications, Fort Collins, Colo., p. 705.19. Maynord, S., IIPractical Riprap Design,1I Misc. paper H - 78-7, U.S.Army Engineer Waterways Experiment Station, Vicksburg, Miss., 1978.,20. IIHydraulic Design of Flood Control Channels,1I Engineering Manual1110-2-1601, U.S. Army Corps of Engineers, Washington, D.C., 1970.21. Brater, E., and King, H., IIHandbook of Hydraulics,1I 6th EditionMcGraw-Hill Book Co. 1976, p. 4-19.22. Jaeger, C., IIFluid Transients "in Hydroelectric Engineering Practice,1IBlackie, 1977, pp. 293-333.23. Binder, R. C., IIFluid Mechanics,1I 2d Edition, Prentice-Hall, Inc., NewYork, 1949, pp. 204-205......xix
SECTION 1 - GENERAL1.01 PROJECT AUTHORIZATION. The Crater-Long Lake Division of theSnettisham Project was authorized by Section 204(a); Flood Control Act of1962, Public Law 87-874, in accordance with the plan set forth in HouseDocument No. 40, 87th Congress, First Session, dated 3 January 1961, asmodified by the Reappraisal Report of November 1961. This act alsoauthorizes the Secretary of the Army, acting through the Chief of Engineers,to construct, and the Secretary of the Interior to operate and maintain theproject. The Bureau of Reclamation was the original operating agency byintent until Department of the Interior Order No. 2900 established the<strong>Alaska</strong> Power Administration. The <strong>Alaska</strong> Power Administration will operatethe project and market the power generated. This Design Memorandum isprepared and submitted in accordance with EM 1110-2-1150.1.02 PROJECT LOCATION. The project is located in the Tongass NationalForest near the mouth of Speel River at the Speel Arm of Port Snettisham, aglacial fiord in Southeastern <strong>Alaska</strong>, (Plate 1). The project is 28 misoutheast of Juneau at 58 degrees 08' north latitude and 133 degrees 45'west longitude.1.03 STAGE DEVELOPMENT. The Reappraisal Report of November 1961 proposeda three-stage development involving the installation of a 20,000 kWgenerating unit during each stage, for a total of 60,000 kW. The firststage of development would consist of construction of Long Lake waterways;the powerhouse structure, including skeleton bays for all units, and thetailrace facilities; the installation of one turbine, generator andappurtenant facilities; all switchyard and substation structures andimprovements, as well as necessary station service equipment to provide forone generating unit's capacity; and, the transmission line and all generalproperty. The second Long Lake generating unit and appurtenant facilitieswould be installed as the second stage of development. In addition, theelectrical equipment would be expanded to correspond with the increasedcapacity. The third stage would include construction of Crater Lakewaterways and the third generating unit, and would also complete theinstallation of all switchyard and sUbstation equipment.Design Memorandum No.3, "Selection of Plan of Development", dated Jaunary1965, as revised May 1965 and approved July 1965, recommended the projectbe constructed in two stages. The first stage would be as proposed in theReappraisal Report except that the second generating unit would be installedas part of first stage development and a high dam at Long Lake would alsobe constructed. The second stage of development for this plan would becomewhat was formally authorized as the third stage in the Project Document.The size of the first two generating units was increased from 20,000 kW to23,350 kW each as recommended in Design Memorandum 10, "Power Tunnel, SurgeTank and Penstock", dated September 1966 and approved March 1967.First stage construction was completed in 1973. During construction theneed for the added capacity supplied by the Long Lake dam was reevaluatedin comparison with the additional firm energy that could be provided byCrater Lake. In light of the relatively high cost to construct the dam1 -1
and the need for additional firm energy (because power requirements hadincreased more rapidly than originally forecast), the decision was made toadvance the Crater Lake phase to first stage development and delay the LongLake dam to second stage development.Based on subsequent yearly power requirement forecasts by the <strong>Alaska</strong> PowerAdministration, the need to construct Crater Lake was postponed until 1981when it became apparent that the additional energy that Crater Lake couldprovide would be required within an estimated 5 years. The delay from 1973to the present has shifted Crater Lake construction to second stagedevelopment and the Long Lake dam to third stage. Future studies will beperformed to assess the economics of diverting Glacier Creek into the LongLake power conduit as part of third stage development.1.04 PURPOSE AND SCOPE. This Design Memorandum presents the featuredesign of the recommended plan of development for the Crater Lake phase,including the pertinent features of the lake tap, gate structure, powertunnel, surge tank, and penstock.This design memorandum outlines the recommended plan of development for theCrater Lake phase, the considerations which resulted in the plan, anddetailed cost estimates for each portion of the plan. The alternativeplans considered and alternatives to portions of the recommended plan arealso outlined. Significant changes in power requirements, results ofadditional investigations, experiences in the development of the Long Lakephase, and other factors that developed since the issuance of DesignMemorandum 23, Crater Lake Plan of Development, were utilized in thestudies and investigations necessary for the establishment of criteria forand development of detailed designs of the various components of the plan.1.05 PRIOR INVESTIGATIONS. The power potential of Crater and Long Lakeswere initially investigated by private mining interests in 1913, withsubsequent studies made by private corporations between 1920 and 1928.Although applications were filed with the U.S. Forest Service and FederalPower Commission, the applicants failed to make beneficial use of the waterand these applications lapsed. Reports by Federal agencies included thoseby the Federal Power Commission, Forest Service, Corps of Engineers andGeological Survey. The Bureau of Reclamation began more detailed studiesin 1958 and completed a feasibility report in 1959. That report, entitled"Crater-Long Lakes Division, Snettisham Project, <strong>Alaska</strong>," was published in1961 as House Document No. 40, 87th Congress, First Session. A reanalysisand reappraisal of the report was completed by the Bureau of Reclamation in1961. The initial House Document No. 40, as modified by the reappraisalreport, provided the basis for the project authorization.Beginning in 1967, detailed site investigations, mapping, and datacollections were accelerated, primarily concentrating on those itemsnecessary for the development of the Long Lake phase. Limitedinvestigations for the Crater Lake phase were also conducted prior to1972. Additional mapping, foundation investigations, and other studies forCrater Lake were started in 1972 and culminated in Design Memoradum 23, thegeneral plan of development for the Crater Lake phase. In 1981 detailedinvestigations were initiated to enable the completion of the featuredesign report.1-2~.
On 21 and 22 June 1983, an inspection tour was conducted of the Long Lakepower conduit and the existing powerhouse facilities. This inspectionafforded the opportunity to observe the effects of 10 yr of continuousoperation of the Corps-designed facility. The results of the inspectionare recorded in the inspection report, included in this design memorandumas Exhibit 1.1.06 LOCAL COOPERATION. The authorizing act does not require localcooperation for this single purpose project. The two local utilities,<strong>Alaska</strong> Electric Light and Power (AEL&P) and Glacier Highway ElectricAssociation (GHEA), have indicated that they will continue to buy powerfrom the Snettisham source, and have applied for State loans to expandtheir distribution systems.The State of <strong>Alaska</strong> has expressed considerable interest in the project and,because this project is viewed as a Federal responsibility, has urged theU.S. Congress to provide a program that would permit the Corps of Engineersto design and construct the remainder of the project in a timely manner.1-3
SECTION 2 - REGIONAL DESCRIPTION2.01 ENVIRONMENTAL SETTING. The Snettisham project is located in theTongass National Forest approximately 28 mi southeast of Juneau, <strong>Alaska</strong>.The project is at the head of a narrow arm (Speel Arm) of a fiord (PortSnettisham), which is connected to a larger, inland passage (StephensPassage) that separates the <strong>Alaska</strong> mainland and the Alexander Archipelago.As with much of coastal Southeastern <strong>Alaska</strong>, the project area offers apleasing contrast of steep landscapes, mature forests, icefields, mountainlakes, and ocean waters. The natural landscape is interrupted by theproject airfield, jetty, roads, and transmission lines, parts of which arevisible from sea level near the project.Crater Lake is 1,019 ft above Project Datum (1022 MSL) in a narrow,steep-walled valley 3,000 to 4,000 ft below the surrounding peaks. Thelake is approximately 1 mi long, 0.4 mi wide, a maximum of 400 ft deep, andcovers 330 surface acres. The lake drains approximately 11.4 mi 2, ofwhich about 30 pct is covered by snow and icefields. The average annualrunoff is approximately 145,500 acre-ft of water. Crater Lake drains intoCrater Creek, which flows precipitously for 1 mi to sea level at CraterCove.The resources of the area have been developed intermittently since 1794 bytrappers, miners, fishermen, and loggers. The abandoned mining village ofSnettisham is sited on Stephens Passage near Port Snettisham. Theabandoned <strong>Alaska</strong> Pulp and Paper Company mill, the first pulp mill in<strong>Alaska</strong>, is about 3 mi south of the Snettisham project. Currently, the PortSnettisham area is sparsely settled; there are approximately 14 permanentresidents in the immediate project area, all of whom are associated withmaintaining the hydroelectric or fish hatchery operations.Access to the project via the airstrip and the small boat basin is open torecreational users. The U.S. Forest Service controls recreational uses ofthe Tongass National Forest, including the project area. The ForestService maintains a trail system to the vicinity of Indian Lake and upperSpeel River. There is also an unmaintained trail to Crater Lake.Recreational opportunities include fishing in Indian Lake and Speel River,hiking, camping, and tours of the project facilities.2.02 HYDROLOGY. The project area is in the maritime climatic zone and isin the path of many cyclonic storms that cross the North Pacific. Themaritime influence, the Pacific storms, and the orographic lift by thesteep coastal mountains produce a local climate characterized by moderatetemperatures (at sea level), cloudiness, and heavy precipitation. Averagemonthly temperatures range from 25°F in January to 55°F in July. Averageannual precipitation is about 140 in/yr at sea level and is estimated to beabout 230 in/yr in the Crater Lake drainage basin. The large amounts ofprecipitation produce an abundant water supply. During warm dry periodsglacial melt adds significantly to the water supply while cold wet cyclesrecharge the ice pack and maintain a high volume of runoff at lowerelevations.2-1
2.03 REGIONAL GEOLOGY. Th~ southeastern coast of <strong>Alaska</strong> is generally acoastline of submergence partially resulting from geologically recent risesin sea level. As such, it has well developed d~owned river valleys, or"fiords," wherever rivers meet the sea. The depth of the fiords is due todeep glacial scouring of the lower reaches of the river valleys. Extensivestream aggradation and alluvial valley clogging has occurred near themouths of many larger river systems. The high tidal ranges in the areatend to turn the outwash areas to extensive tidal mud flats. As a result,many streams have braided and meandering patterns throughout their lowervalley reaches. In sharp contrast to these gentle, coastal streamgradients, many streams emerge and cascade down from steep mountain frontswhich parallel the irregular coastline. Most major streams have activeglaciers at their headwaters and their courses are usually marked bytypical glacial erosional features such as HUH-shaped valleys, cirquelakes, hanging tributary valleys, truncated spurs, and morainal deposits.The country rock of this portion of southeastern <strong>Alaska</strong> is derived from theCoast Range batholith, which is an extensive complex of igneous andmetamorphic rock that trends generally parallel to the Pacific coastline.The entire igneous-metamorphic complex has been modified by agents oferosion. Most prominent has been ice from all four major continental icesheets of the Pleistocene Epoch and from associated alpine glaciation.Water erosion has played a subsidiary role. The most prominent erosionalfeatures have been developed parallel to joints, faults, and lithologicDoundaries along which streams (and later, glaciers) became firmlyestablished. Most valleys and minor tributary draws in the area aretherefore topographic expressions of primary and secondary rock structuresin the region. Major faulting and much of the jointing reflected by thistopographic expression is a result of crustal movements which have takenplace since the intrusion of the Coast Range batholith.With the exception of localized weak zones, few pockets of area-wide deepresidual weathering exist in the Coast Range mountains. The lack ofwidespread, deeply weathered zones in bedrock in an area that receives asmuch as 230 inches of annual rainfall is rare and is probably due to theremoval of nearly all weathered materials by glacial scour. This scouringhas been recent enough so that significant residual weathering productshave not yet covered the bedrock surfaces.2.04 TECTONIC SETTING. Southern <strong>Alaska</strong> is one of the most active seismicregions of the world. The regional tectonic setting defines the degree ofseismic activity. Table 2-A lists the historical great earthquakes thathave occurred in <strong>Alaska</strong> within a radius of 300 mi of the Snettisham projectsite. The primary cause of seismic activity in southern <strong>Alaska</strong> is thestress imposed on the region by the relative motion of the Pacific and theNorth American lithospheric plates at their common boundary. The Pacificplate is moving northward relative to the North American plate at a rate ofabout 2.4 in/yr causing the underthrusting of the Pacific plate. Thisunderthrusting results primarily in compressional deformation which causesfolds, high-angle reverse faults, and thrust faults to develop in theoverlying crust.2-2
DATE1899 Sep 041899 Sep 101900 Oct 091949 Aug 221958 Jul 10TABLE 2-A.GREAT EARTHQUAKES IN SOUTHERN ALASKA(Within 300 mi of Project)EPICENTERDEPTHCOORDINATES MAGNITUDE (KM) LOCATION60N 142W 8.5a Near Cape Yakataga60 140 8.4a Yakutat Bay60 142 8.1a Near Cape Yakataga,53 133 8. 1 25 Queen CharlotteIslands58.6 137. 1 7.9 Lituya Baya Revised magnitudes are from Thatcher and Plafker (1977).2-3
SECTION 3 - RECOMMENDED PLAN3.01 GENERAL. The recommended plan for development of this phase of theproject retains the conceptual principles, as approved in OM No. 23, of alake tap, gate structure, power tunnel, surge tank and penstock leading toa new turbine in the existing powerhouse (see Plate 1). The specificdesign and alinement of these features has been changed. The followingsubsections describe the recommended plan and tell how it differs from theapproved Plan of Development in Design Memorandum No. 23.3.02 RECOMMENDED PLAN.A. Lake Tap, Primary Rock Trap and Primary Trashrack. An opensystem/wet tunnel lake tap is recommended. With this type of tap, thefinal rock plug will be blasted, causing its fragments to drop into and bepermanently stored in the primary rock trap. Following the lake tap, aself-alining, non-secured trashrack is lowered into position from floatingequipment on the lake.B. Power Tunnel Emerrency Plugs and Bulkheads. There will be twopower tunnel emergency bu kheads located upstream of the gate structure.One is located in the power tunnel near the primary rock trap and the otherapproximately 75 ft upstream of the gate structure. Their purpose is toprovide a means of dewatering the power tunnel upstream of the gatestructure in the event of a rock fall or tunnel displacement in that reachof tunnel, a slide in the lake tap area or an unsucessful lake tap.C. Secondary Rock Trap. The secondary rock trap, which consists of anexpanded tunnel section, is located upstream from the gate structure toprevent rubble from entering the gate slots. This rock trap is designed tointercept any material not retained in the primary rock trap.D. Gate Structure. A partially concrete lined, wet-well shaft housesa service gate and a bulkhead. The service gate is a hydraulicallyoperatedslide type that will close under an unbalanced head to serve as anemergency gate. The bulkhead operates only under balanced head and will beclosed when there is need to unwater the gate structure for maintenance.E. Power Tunnel. The recommended design for the power tunnel ;s agenerally unlined, ll-ft diameter modified horseshoe tunnel, extending fromthe primary rock trap to the final rock trap.F. Surge Tank. The surge tank is an unlined, vented, 10-ft diametershaft located upstream of the final rock trap.G. Final Rock Trap and secondar~ Trashrack. The final rock trap andsecondary trashrack are located at t e entrance to the steel penstock tointercept all material which would be harmful to the turbine.H. Penstock. The 6-ft diameter steel penstock is free standing and issupported on concrete saddles inside the penstock tunnel.3-1
I. Access. Access to the power conduit and its appurtenances isthrough two access adits. The primary access adit extends from the roadnear the powerhouse to the final rock trap and is divided into two segments.The lower segment is 645 ft long and intersects the penstock tunnel approximately303 ft from thepowerhnuse. The second segment is through a combinedpenstock/access adit tunnel which allows access along the side of theunencased penstock to the final rock trap. The second access is the gatestructure access adit which extends from a helicopter pad and staging areathrough the gate structure service room to the lake shore above the tap.J. Construction Camp. The location of the construction camp is shownon Plate 1. It will be the contractor's responsibility to provide therequired structures and utilities, which are discussed in Section 16.3.03 CHANGES FROM APPROVED PLAN.A. Lake Tap, Rock Trap and Primary Trashrack. .The closed system/drytunnel lake tap ln DM 23 has been changed to an open system/wet tunnel laketap. The power tunnel in DM 23 exits from the side of the primary rocktrap, while, in the recommended plan, the primary rock trap and powertunnel have the same horizontal alinement. The intake trashrack in OM 23was a secured structure to be placed after the lake tap and initial lakedrawdown had been completed. The primary trashrack in the recommended planwill be a non-secured structure lowered into place from the lake surface.The lake will not be drawn down to facilitate the placement of thetrashrack.B. Power Tunnel Emergenc~ Plugs and Bulkheads. Two power tunnelemergency bUlkheads are ;nclu ed in the recommended plan to provide a meansof dewatering the power tunnel upstream of the gate structure if damageshould occur in the power tunnel between the lake tap and the gatestructure. The current approved plan makes no provision for dewateringthat reach of tunnel.C. Gate Structure. The gate structure proposed in DM 23 housed twohydraulically-operated slide gates in a dry gate chamber locatedimmediately above the power tunnel. The gates were to be serviced by anoverhead hoist. The upstream gate was designed to accept the over-pressurefrom the lake tap blast. Power was to be provided by an overheadelectrical feeder system from the powerhouse switchyard. The recommendedgate structure is a deep wet-well with the operating equipment located inthe service room and access adits located above the maximum lakeelevation. The service gate is a hydraulically-operated slide gate locateddownstream of the bulkhead. The bulkhead utilizes a tractor-typemechanism. The operating machinery is powered by feeder cables runningalong the power conduit from the powerhouse. Communications to the gatestructure will be through feeder cables that run alongside the power cables.•D. Power Tunnel. The power tunnel in the approved plan was designedwith a high vertical alinement. It sloped 0.5 pct from the primary rocktrap through the final rock trap. The recommended power tunnel has anupward slope of 3.88 pct from the primary rock trap to the gate structureand a downward slope of 12.437 pct from the gate structure through thefinal rock trap and continuing into the penstock tunnel.3-2
E. Surge Tank. The surge tank approved in DM 23 was an 8-ft diameter,400-ft high, unlined, vented shaft. The recommended surge tank is a 10-ftdiameter, 935-ft high unlined, vented shaft.F. Penstock. The penstock approved in DM 23 would be constructed at a100 pct slope (45 degree angle). It would be encased in concrete, the sameas the Long Lake penstock. The recommended penstock has a 12.437 pctslope, which is the same as the power tunnel slope. The penstock is anunstiffened steel pipe supported by steel ring girders and concrete saddlesinside the penstock tunnel. During Long Lake phase construction,approximately 200 ft of the Crater Lake penstock shaft was excavated at a100 pct slope. The recommended penstock tunnel will intersect the existingstub shaft at the powerhouse wall. The stub shaft will be abandoned.G. Access. In OM 23, the existing Long Lake access road would beextended to serve two Crater Lake phase access adits. One adit providedaccess from the new road to the surge tank, the other provided access fromthe new road to the gate structure. In the recommended plan there is nonew access road construction. The access road was deleted in therecommended plan for the following reasons: an access road would be usedvery infrequently during the operation of the project; experience with theLong Lake access road has shown that a large amount of maintenance isrequired to keep an access road passible; and, it provides a significantreduction in adverse environmental impacts. The primary access adit isserved by the existing road near the powerhouse. The gate structure accessadit will be accessed by helicopter and provides access to the gatestructure and the lake shore.H. Construction Came. In OM 23, it was planned that the constructioncamp facllltles used durlng the Long Lake phase would continue to be usedin the Crater Lake phase. The delay in initiating construction of theCrater Lake phase necessitated removal of the camp facilities; therefore, anew camp must be constructed.I!3-3
SECTION 4 - ALTERNATIVES4.01 GENERAL. Presented in this section are three plans which arealternatives to the recommended plan. Since the plan presented in OM 23was approved, some design criteria have changed and conditions that arepertinent to a sound design for the Crater Lake phase have been moreaccurately determined. To better compare the recommended plan with theapproved plan, two modified versions of the approved plan were developedincorporating the criteria and conditions as known at this time. Anotheralternative is to maintain the same penstock slope as proposed in therecommended plan except that the penstock would be fully encased inconcrete similar to the Long Lake penstock. Also presented is a primarytrashrack/1ake drawdown option which is an alternative that can beincorporated into the recommended plan or the three alternative plans.4.02 ALTERNATIVE I. This plan is the same as the approved plan presentedin OM 23 except for the changes described below. The details of this planare shown on Plates 23 through 25.A. Power Conduit. The power conduit includes the power tunnel, surgetank, and penstock. Several combinations of the power tunnel, vented surgetank, and penstock were studied to determine the most economical. Theslope of the power tunnel between the gate structure and surge tank is keptconstant at 0.5 pct and the vertical a1inement is kept high to reduce theheight of the vented surge tank, which is designed to vent above themaximum lake and surge level (See Appendix B3 for a detailed discussion ofthe vented surge tank). The studies determined that the most economicalplan utilizing this design includes a 12-ft diameter modified horseshoe,unlined power tunnel, 10-ft diameter, unlined, vented surge tank 395 fthigh, and a 6-ft diameter steel penstock encased in concrete. The verticala1inement of the penstock is revised from the approved plan to eliminatethe possibility of negative pressures in the penstock (see Plate 25).B. Gate Structure. The gate structure size, configuration and accesshave been revised from that presented in OM 23. The structure consists ofa concrete-lined 18.5-ft by 28-ft by 290-ft high shaft with a 42-ft by 70-ftby 45-ft high concrete-lined room above it. Two hydraulically operatedslide gates are provided to close the power tunnel, which is constricted toa 6-ft wide by 8-ft high opening at the gate structure. The gates andrelated hydraulic hoists are located at the bottom of the dry shaft,immediately over the power tunnel. An elevator provides transportationbetween the gates and the room at the top of the structure, where a 15-tonoverhead hoist is located. The power tunnel air vent extends from a pointjust downstream of the service gate, up the inside of the dry-well gateshaft, and terminates approximately 12-ft above the service room floor.c. Electrical Design. Power requirements for Alternative I includelighting ln the gate structure and adits, radio link for remote control andmonitoring, and service gate hoisting.(1) Power Sources -4-1
(a) A propane-fired generator is provided for charging of two 12 Vbatteries. Generator output is approximately 100 W at 12 Vdc. One batteryis utilized for starting of a gasoline powered generator and the second isa power supply for the data link and remote control radio system. Thebattery systems are isolated so that a failure of one system will notdowngrade the other. Maximum fuel consumption would be 300 gal of propaneyearly for continuous operation. By utilizing demand cycle operation withautomatic ignition, it is estimated that consumption will be reduced to100 gal/yr.(b) A 12.5 kW, air-cooled, 277/480V, 3-phase, gasolineengine-driven generator supplies power for lighting and hoisting. The unithas demand start, so that a light switch located at the access adit portalis turned on signalling to the generator that there is demand. Thegenerator then starts up, supplying power to the lights. The highervoltage is being utilized to minimize voltage drop problems. Bothgenerator sets are exhausted directly outside the access adit.(2) lighting - Incandescent lighting is used in the gate structureand the gate structure access adit. Due to the limited usage of thelighting system and the delay for strike of a discharge lighting system,the incandescent lighting is considered the most practical approach forthis project. The lighting load for these two areas is estimated to be7.5 kW. lighting will not be provided for the final rock trap access adit.(3) Gate Hoisting Control - A hoist control panel and a gateposition indicator are provided in the gate structure service room. Thecontrol panel provides basic RAISE-lOWER-STOP functions.(4) Remote Control and Monitoring - A low power (less than 10 W)FM radio link is provided between the gate structure and the powerhouse.This link provides for emergency closure of the service gate from thepowerhouse and is capable of transmitting data back to the powerhouse suchas "service gate open or closed" and low battery voltage (indicatingpossible failure of the propane-fired generator). An omni-directionalantenna (for minimal wind loading) is tower or pole mounted near the gatestructure access adit with sufficient height to preclude burial by snow.(5) Service Gate Emergency Closure - As stated above, a radio linkprovides for emergency closure of the service gate. This is initiated froma key operated three-position switch located at the powerhouse. The switchinitiates two signals to close the gate to insure that the closing circuitis not inadvertently activated by a single stray transmission. A similarthree-position key operated switch is provided in the gate hoisting controlpanel in the service room. Capability for emergency closure of the servicegate from Juneau is provided by the existing communication system patchedinto the powerhouse transmitter.D. Access. The main access to the power tunnel is through a 550-ftlong, l3-ft diameter vertical sidewall access adit leading to the finalrock trap and surge tank. A road is extended from the existing long Lakeroad system to the final rock trap access adit. Access to the gatestructure and lake shore is through a l3-ft diameter vertical sidewallr•4-2
access adit extending 950 ft from a helicopter pad at elevation 1,035 ft tothe gate structure and then continuing 400 ft to the lake shore. The powersupply generators and batteries for the gate structure are located in thegate structure access adit near the portal at the helicopter pad.Helicopters are used to provide transportation to the upper portion of theproject.4.03 ALTERNATIVE II. This plan is the same as Alternative I, except forthe changes discussed below. The details of this plan are shown onPlates 25 through 27.A. Power Conduit. The power conduit is the same as discussed insection 4.02 A for Alternative I.B. Gate Structure. This gate structure is of the same concept asselected in the approved OM 23 plan, however, additional study has provideda design with more economical dimensions. The proposed design consists ofa rectangUlar 26-ft by 16-ft by 47-ft high concrete-lined dry chamberlocated immediately above the power tunnel. The chamber contains the gateencasements, power and hydraulic units, access hatch to the power tunnel,and a 15-ton overhead hoist. Two hydraulically-operated slide gates areprovided to close the power tunnel, which is constricted to a 6-ft wide by8-ft high opening at the gate structure. The power supply generators andbatteries are located in the access adit near the portal. The power tunnelis vented by a 30-inch diameter steel pipe that extends along the crown ofthe gate structure access until it reaches the point where it rises in theshortest vertical distance in a drilled hole daylighting above the maximumlake pool level.C. Electrical Design. The electrical design, gate controls, andcommunications are the same as discussed in Alternative I, Section 4.02 C.D. Access. The main access to the power tunnel is as described forAlternative I in Section 4.02 D. Helicopters are used to providetransportation to the upper portion of the project. Access to the gatestructure is through a 1,500-ft long, 13-ft diameter vertical sidewallaccess adit extending from the helicopter pad at elevation 800 ft. Asecond helicopter pad is located near the lake shore.4.04 ALTERNATIVE III. This plan is the same as the recommended plan,except for the changes discussed below. The details of this plan are shownon Plates 28 through 36.A. Power Tunnel. Other than a slope of 12.25 percent, the powertunnel is the same as discussed in Section 3.02 for the recommended plan.B. Gate Structure. The gate structure and gate structure access adithouse a service gate and bulkhead and all the equipment required to allowtheir full opertion for power tunnel filling and draining procedure and foremergency situations. The gate shaft is a 10-ft by 12-ft by 251-ft highchamber that houses the gate, bulkhead, stainless steel gate guides,dogging recesses, access ladder, safety and inspection landings, and thepower tunnel air vent. The gate structure shaft is shown on Plate 30.4-3
(1) Service Gate - A tractor gate 6 ft wide by 8 ft high will beutilized as the service gate and will be operated under balanced andunbalanced heads. Normally, the gate will be suspended immediately abovethe tunnel in the wet portion of the shaft where it will be available foremergency closure. Details of the service gate are shown on Plate 31.(2) Bulkhead - The gate structure bulkhead 6 ft wide by 8 ft high,located 6 ft upstream of the service gate, seals off the power tunnel atthe upstream side of the gate structure, thereby allowing the gatestructure to be drained for maintenance. The bulkhead can only be operatedunder balanced head conditions. When not in use, it will be dogged andstored at the top of the shaft.(3) Electrical Design - Power requirements, gate controls andcommunication are the same as discussed for Alternative I, Section 4.02 c.(4) Mechanical Design - A single l5-ton hoist is used for raisingand lowering the service gate and the bulkhead. It consists of a l-hpelectric drive motor, worm gear reduction unit, drum gear, cable drum,cable sheaves, and cables as shown on Plate 32. The cable drum rotates at0.085 r/min and raises or lowers the service gate or bulkhead at a rate of0.8 ft/min. There are two cable sheaves. One is an overhead motorizedsheave; the other is a floor-mounted swivel sheave located near the servicegate slot. The overhead sheave is motorized so its position can beadjusted to be directly above either the service gate slot or the bulkheadslot. The hoist utilizes three 1-1/4-inch diameter, 300-ft long cables.The service gate, bulkhead and hoist drum each are equipped with a cable.To operate either the service gate or the bulkhead, their correspondingcables are run through the sheaves and attached to the drum cable. Aposition indicator shows the position of the gate or bulkhead for theirfull range of travel. The service gate cable is connected to the hoistcable, which holds the gate in the open position. When operation of thebulkhead is desired, the service gate must first be closed. The remaining50 ft of gate cable is then disconnected from the hoist cable, unthreadedfrom the sheaves, and stored on wall brackets in the service room andaccess adit. The 300-ft long bulkhead cable, which is stored on wallbrackets in the adit and service room, is then removed from the wallbrakcets. One end of the bulkhead cable is connected to the hoist cableand the other it threaded through the sheaves and connected to thebulkhead. The hoist cable is then wound onto the drum, thereby taking upthe slack in the bulkhead cable. The bulkhead can then be lowered. Totaltime to close the service gate, change the cables, and lower the bulkheadinto the closed position is approximately 11-1/2 h.c. Penstock. The penstock profile is shown on Plate 29. The 6-ftdiameter steel penstock begins at a point 125 ft downstream of the airchamber drift tunnel centerline and continues at a downward slope of 14.7pct to the powerhouse. The penstock is approximately 980 ft long and isencased with concrete and grout similar to the encased penstock approved inOM 23. Methods used for the design of the penstock are discussed inAppendix C.4-4
D. Access. Access to the gate structure is the same as discussed inSection 4.02 D for Alternative I. Primary access to the gate shaft andsecondary access to the power tunnel is by ladder from the gate structureservice room. The ladder is enclosed in a cage and provided with landingsspaced at 30-ft intervals. Suspended beneath the lower observationplatform is an extension of the access ladder that can be lowered into thepower tunnel to permit access for inspection and maintenance purposes.Access to the power tunnel will be through a 12-ft wide by 13-ft highvertical sidewall adit that intersects the power tunnel in the final rocktrap, opposite from and approximately 23 ft upstream of the drift tunnelfor the surge tank. The adit begins near the powerhouse, and isapproximately 1,500 ft long. The adit crown will be stabilized withrockbolts as determined necessary by Corps of Engineers field personnel. A30-ft long concrete portal section similar to the existing powerhouseportals will be constructed at the entrance of the access adit to ensurestability of the surface rock and provide protection from falling rock.The adit location is shown on Plate 28.E. Air Chamber Surge Tank. An air chamber surge tank is a chamberoffset from the power tunnel, that contains compressed air above a depth ofwater. It performs the functions of a conventional surge tank but differsby not being open to the atmosphere. The feasibility of constructing anair chamber surge tank was studied with the following results:(1) Size - An air chamber 24 ft wide 129.7 ft long and 22.6 fthigh with a total chamber volume of 65,500 ft~ was designed for thenominal tunnel diameter of 11.0 ft. The water volume in the air chamber is14,500 ft3 at minimum power pool.(2) Hydraulic Transients - Maximum and minimum water hammerelevations at the unit are 1,329 ft and 549 ft, respectively. The maximumand minimum hydraulic gradient elevations at the air chamber are 1,128.4 ftand 734.4 ft, respectively. The unlined air chamber is excavated fromsolid rock and is connected to the power tunnel by an 82-ft long, ll-ftdiameter modified horseshoe drift tunnel, which slopes upward at 12 pctfrom the final rock trap to the surge tank. The corners of the drifttunnel are rounded to reduce head losses. Air is provided to the tank bycompressors located in the powerhouse. The orifice, which is generally astandard design feature of surge tanks, is omitted from this design toimprove water hammer reflection from the surge tank. The air chamber surgetank was found to be less costly to construct than the vented surge tank,but the vented surge tank is the recommended type because it does not relyon extra equipment for its operation. Therefore, the vented tank issimpler, and in the long run, more economical to operate. HydraulicAppendix 84 covers the air chamber design in more detail.4.05 COMPARISON TO THE RECOMMENDED PLAN. The conceptual differencesbetween the recommended and approved plans are discussed in Section 3.03.These differences, as modified by the preceeding discussion of thealternative plans, are also the primary distinctions between therecommended and alternative plans.4-5
4.06 PRIMARY TRASHRACK/<strong>LAKE</strong> DRAWDOWN. This feature/procedure is an optionthat can be incorporated in either the recommended plan or the alternativeplans. This plan calls for installing a temporary trashrack after the laketap in the same manner as the recommended plan. Duri ng the fo 11 owi ngwinter the lake will be drawn down and maintained at minimum pool byproducing power with the Crater Lake generator. During the nextconstruction season a permanent combination trashrack and bulkhead will beinstalled. An elaborate winch and pulley system is required for operationof the bulkhead. This design does not incorporate a trashrack cleaningdevice because one was not found that will be compatible with the trashrackand bulkhead as designed. (See Plates 38 through 40.) The time needed todraw the lake down, install the permanent trashrack, and refill thereserv.oir to maximum pool adds approximately 21 mo to the date when firmpower-on-line can be achieved, when compared to the schedule for therecommended plan..'"4-6
SECTION 5 - HYDROLOGY5.01 GENERAL. The Snettisham area lies within the maritime climatic zoneof <strong>Alaska</strong> and is greatly affected by the cyclonic storms that cross the Gulfof <strong>Alaska</strong>. The terrain in the area is mountainous, and orographic liftingand resultant pseudo-adiabatic cooling of moist air masses from the Gulf of<strong>Alaska</strong> exert a basic influence upon local temperatures and precipitation,creating considerable variation in both temperature and precipitationwithin short distances. Precipitation data for the 11.4 mi 2 Crater Lakebasin is nonexistent. However, if glacial effects are not considered, anestimate of average precipitation based on eXisting average annual runoffdata would be approximately 230 inches annually. The Crater Lake basin hasvery little soil or vegetative cover over the bedrock. The majority of therunoff in the basin is surface flow with some subsurface and base flow.Annual flood peaks predominantly occur in the fall months and are mainlydue to intense rainfall. There are 12 yr (WY 1914-20, 1928-32) ofstreamflow records for Crater Creek at the Crater Lake outlet. Averagedischarge for the 12 yr of record is 193 ft3/s. See OM #1 HYDROLOGY formore detailed basin hydrology.5.02 WATER SUPPLY STUDIES.A. Initial. The initial water supply studies for the Crater Lakebasin were presented in OM #1 HYDROLOGY. Linear regression ~nalyses weremade to determine the monthly statistical relationships between CraterCreek and Long River flows. Concurrent monthly flows at Crater Creek andLong River were correlated and resultant derived equations used to fill themissing record for Crater Creek for October through December of WY 1921through 1924, WY 1927, and WY 1933 through 1968.B. Recent. Recent studies attempted to improve the estimates ofCrater Creek flows. The "Monthly Streamflow Simulation" (HEC 4) computerprogram was used to correlate flows at Long River, Dorothy Creek, andCrater Creek. Results did not improve upon those obtained in the initialstudy; however, HEC 4 was used to fill in the two years (WY 1925 & 26)where flows were not recorded at either station. Monthly flows for 1925-26were generated by the program based on the statistical flow characteristicsof Crater, Long, and Dorothy Creeks. Refer to Table 5-A for Crater Creekmonthly flows for WY 1914 through 1968. All recorded and correlatedmonthly flows were used in the sequential routing for the power studies.5.03 GLACIAL MASS BALANCE STUDY. There are 11.4 mi2 of drainage areaabove the Crater Lake outlet. Thirty percent, or 3.4 mi 2, of this areais covered by glaciers. Water supply estimates for Crater Lake have beenmade solely from streamflow records. These estimates may be high or low,depending on the state of glacial mass balance during the period ofstreamflow record. If the glaciers were wasting during this period, it ispossible that a considerable amount of measured flow was coming out ofglacial ice storage; or, if the glaciers were building during the period,measured flow could have been considerably low. The worst case would beone in which the glaciers were wasting during the period streamflow wasrecorded and then begin building during project operation. The problem ofprojecting future water supply from glacierized basins, without taking5-1
account of glacier wasting, is not without precedent. For the 190 MWGrande Dixence project in Switzerland it has been necessary to augment thewater supply because glacial wasting was not taken into consideration inestimating design supplies. Glacier studies recently conducted for theSusitna Hydroelectric Project in <strong>Alaska</strong> have indicated that some of theglaciers covering 4 pct of that basin have been wasting in recent years.Correspondingly, as much as 13 pct of the total flow at one gaging stationhas been coming out of glacial ice storage. The U.S. Geological Survey iscurrently studying historical and recent aerial photographs of the Craterand Long Lake basins to see if there is any indication that the glaciers inthe basin have been building or wasting. If the study shows that theglaciers have been or are currently active the streamflow data from LongRiver and Crater Creek will need to be reanalyzed.TABLE 5-A.AVERAGE MONTHLY FLOWS FOR <strong>CRATER</strong> CREEK(ft~7s )WY OCT NOV DEC JAN FEB MAR APR MAY JUN JUL AUG SEP AVE1914 260 108 38 21 45 37 53 144 272 517 409 266 1811915 313 104 24 36 17 45 74 235 414 497 469 389 2181916 185 45 33 18 18 19 44 90 370 370 464 470 1771'917 270 51 33 35 45 23 24 142 305 441 539 361 1891918 251 250 35 33 17 13 21 129 347 482 591 411 2151919 202 133 65 68 15 12 47 118 217 417 511 420 1851920 209 67 45 100 35 16 20 53 177 406 532 262 1601921 140 92 25 24 31 24 34 138 305 399 360 297 1561922 290 75 95 34 10 10 35 145 287 437 471 352 1871923 202 158 41 21 28 38 47 160 297 452 483 502 2021924 230 198 77 28 17 30 39 229 400 584 566 581 2481925 388 58 34 72 30 41 47 100 360 399 290 327 1791926 301 52 48 59 22 49 36 262 501 545 392 353 2181927 197 124 95 35 27 25 38 161 350 377 357 352 1781928 135 48 25 89 31 40 42 193 381 528 377 343 1861929 194 113 82 76 19 49 29 92 382 419 404 347 1841930 463 222 60 5 9 15 34 104 308 420 484 359 2071931 225 256 146 68 102 22 45 211 402 417 474 361 2271932 334 73 28 20 20 15 33 105 284 362 366 429 1721933 316 42 27 14 13 15 66 211 230 379 367 252 1611934 219 170 43 7 12 18 31 100 371 420 565 342 1911935 296 92 67 15 10 20 30 90 251 606 418 276 1811936 274 66 97 16 13 21 42 194 462 454 371 467 2061937 762 294 127 26 16 23 35 112 436 379 411 465 2571938 615 96 62 55 43 46 32 225 309 423 333 535 2311939 327 84 68 37 26 20 33 124 337 520 608 353 2111940 373 151 89 28 38 15 43 205 323 485 560 433 2291941 311 79 43 15 25 24 51 166 372 491 293 202 1731942 276 166 75 40 33 36 37 158 425 538 536 393 2261943 361 61 42 45 21 33 56 166 337 585 466 524 2251944 637 170 125 41 33 37 38 163 488 448 396 291 239""',.'"(continued)5-2
TABLE 5-A. (continued)WY OCT NOV DEC JAN FEB MAR APR MAY JUN JUL AUG SEP AVE1945 489 151 99 19 15 25 36 209 361 502 357 424 2241946 644 55 28 13 15 20 30 255 414 403 457 316 2211947 258 141 36 23 19 53 48 212 409 403 330 525 2051948 291 100 77 44 20 19 25 243 466 461 372 530 2211949 208 134 48 35 16 21 37 207 310 410 421 379 1851950 224 361 76 10 10 15 25 122 323 436 339 413 1961951 110 38 22 17 15 19 33 160 411 489 291 311 1601952 114 46 35 12 13 18 42 161 302 511 426 480 1801953 515 167 45 20 22 17 29 227 428 446 456 376 2291954 402 51 51 25 89 21 20 108 314 384 271 389 1771955 184 178 120 33 18 21 24 93 267 506 518 359 1931956 126 77 22 9 10 15 25 185 226 497 621 278 1741957 142 163 115 48 15 13 29 177 342 392 354 444 1861958 241 169 44 84 23 18 42 216 490 474 442 216 2051959 320 93 52 25 23 21 32 156 404 606 396 240 1971960 231 101 71 34 18 25 41 177 361 511 434 422 2021961 355 125 99 52 41 33 52 194 473 691 684 301 2581962 428 74 23 79 26 31 29 101 340 431 367 480 2011963 243 152 101 59 70 36 35 138 306 454 330 543 2061964 321 45 76 50 35 92 43 104 457 600 375 198 2001'965 292 100 72 102 39 154 34 78 279 412 387 242 1831966 409 55 42 17 15 86 38 135 340 446 474 485 2121967 301 83 22 17 18 63 20 137 566 411 495 585 2271968 153 135 45 20 44 259 34 159 259 431 290 564 199AVE 301 118 60 37 26 35 37 158 355 464 432 386 2015-3
SECTION 6 - GEOLOGY6.01 GENERAL. This section describes the surface and subsurfacegeological features of the study area that will impact the design andconstruction of the project.6.02 COMPLETED EXPLORATIONS AND INVESTIGATIONS. Plate 41 shows thelocation of all completed core borings in the general vicinty of thepower conduit and its features. Subsurface explorations, consisting ofeighteen NX core holes totaling 7,140.2 lineal ft, were intended toinvestigate specific features. All known specific features which weremapped for the earlier design stages have been investigated. Log recordsof the drill holes and corresponding pressure test results are shown inAppendix A. A summary of the subsurface explorations is presented inTable 6-A.6.03 PROJECT SITE GEOLOGY.A. General. The regional geology and a major portion of the projects'ite geology have been presented in Design Memoranda 3, 7, 13, and 23.The following information is presented in addition to that which has beenpresented in previous reports.B. Overburden. There is very little overburden on the steep~ountain slopes in the area, since most has been removed from the slopesby relatively recent glacial action. The higher reaches of streamvalleys have boulder and cobble deposits developed by ice and frostwedging in the bedrock as well as by active erosion from streams andglaciers. In certain areas, snowslides contribute substantial rubble tovalley deposits. In the lower stream reaches, where gradients areflatter, deposits of sand, gravel and cobbles occur.C. Bedrock Lithology. The rock in the immediate Snettisham areaconsists predominately of quartz diorite, quartz diorite gneiss, andbiotite-hornblende schist, all in an interwoven and random pattern. Thequartz diorite commonly has a gneissic structure with alternating,subparallel, light and dark colored layers containing varying proportionsof quartz, feldspar, hornblende, and biotite mica minerals. The lightlayers consist primarily of equidimensional quartz and feldspar withminor dark minerals. The darker colored layers contain platy biotitemica and tabular to prismatic hornblende as well as the quartz andfeldspar minerals. Thin section studies show that the quartz dioritecontains approximately 18 pct dark minerals (13 pct biotite mica, 5 pcthornblende); 79 pct light-colored minerals (60 pct plagioclase feldspar,15 pct quartz, 4 pct orthoclase feldspar); and 3 pct miscellaneousaccessory minerals. Granitic and basaltic dikes have intruded alongexisting joint planes in these rocks.D. Joint Systems. There are two unrelated groups of joints in thearea.(1) "Low Angle" Joints - The "low angle" joints are stressrelief or "unloading" joints caused by the removal of an overlying rockload by glacial scour and the later removal of the ice load itself. This6-1
TABLE 6-A. SUMMARY OF EXPLORATIONS0'1INLOCATION START FINI"SH SIZE ANGLE ORILLEOHOLE NO. N E OATE OATE CORE FROM VERT. OEPTH REMARKSDH-98 93614 86377 09-30-72 10-08-72 NX 0° 219.2' Rock TrapOH-99 95473 91607 09-27-72 10-09-72 NX 0° 350' Power TunnelOH-100 93611 86371 10-11-72 10-19-72 NX 35° 310' Lake Tap andRock TrapOH-l01 94116 88088 10-13-72 10-19-72 NX 0° 232' Power TunnelOH-l02 93616 86380 10-21-72 10-27-72 NX 45° 334' Crossed HilltopFaultDH-l03 94271 88228 10-30-73 10-07-73 NX 0° 366.8' Power TunnelOH-104 95454 91480 09-17-73 10-05-73 NX 0° 454.4' Power TunnelOH-l05 94135 88085 09-21-73 10-07-73 NX 37.5° 325.9' Power Tunne 1OH-l06 95159 91259 10-15-73 10-26-73 NX 35° 415.8' Power TunnelOH-107 94886 90405 11-12-73 11-22-73 NX 37° 340.2 Power TunnelOH-108 93451 86209 10-04-74 10-10-74 NX 0° 259.3' Lake TapOH-l09 93685 86244 10-12-74 10-19-74 NX 0° 277.7' Lake TapOH-110 93549 86220 10-2G-74 10-25-74 NX 0° 271 • l' Lake TapOH-ll1 93729.8 86720.3 07-29-82 08-21-82 NQ 0° 747.3' Gate ChamberOH-1l2 93767.6 86703.6 09-10-82 10-02-82 NQ 30° 602.1' Gate ChamberOH-1l3 93731. 0 86699.5 10-06-82 10-14-82 NQ 30° 392.2' Gate ChamberOH-1l4 93731.0 86934.0 10-06-82 10-17-82 NQ 30° 592.1' Power TunnelOH-1l5 95300.4 91992.3 09-09-82 09-28-82 NQ 45° 650. l' Penstock andSurge r nber~ ~,.," '!! •., ,1J! ""
type of jointing is common in areas of glaciated granitic rocks. Thesejoints are roughly perpendicular to the tensile stress which is usuallyparallel to the exposed rock surface. In this type of jointing, the rockpulls apart along the lines of least restraint and least tensile strength.Low angle joints commonly die out with depth. S~ch joints were encounteredin the Long Lake access adit, the powerhouse access, service, and tailracetunnels, and in the weir area at Long Lake.(2) "High Angle" Joints - The other major group of joints, the"high angle" joints, are developed by tectonic stresses. ~ese jointsexhibit smooth slickensided surfaces, indicating enough movement to shearthe interlocking crystalline mineral grains. In general, these joint zonesare more nearly planar and more continuous than the low angle unloadingjoints. In the underground excavation during the Long Lake phase, threemajor sets of high angle joints, two of which are prominent, wereobserved. In the powerhouse, one set strikes N25°-35°E and dips 65°SE, andcorrelates to a set in the Long Lake power tunnel striking N30o-35°E anddipping 75°SE. Another prominent set in the powerhouse strikes N45°-55°Ewith dips of 55°-80 o SE. This set is the same as the one in the Long Lakepower tunnel striking N45°-50oE dipping 75°SE. Another major, but lessprominent, set in the powerhouse strikes N65°-80oW with dips of 70o-85°SW.A generally similar set is also visible in the Long Lake power tunnel.Other joints exist but are less pronounced and less persistent. Manyjoints have chlorite staining and many others have a coating of pyrite.Several highly jointed and fractured basalt dikes are present in the area.These dikes have three major joint sets which usually do not coincide withthe joints in the country rock. The joints in the dikes are related to theorientation of the dikes and to chilling and shrinkage.(3) Sterographic Plot - See Figure 6-1 for an upper hemispheresterographic plot of the attitudes of the discontinuities in the vicinityof Crater lake.6.04 TECTONICS AND SEISMIC RISK STUDIES.A. General. In order to better understand the impact of the faultzones crossing the tunnel and penstock alinements, the <strong>Alaska</strong> Districtcontracted DOWL Engineers, Anchorage, <strong>Alaska</strong>, to perform a seismic riskassessment study for the Crater Lake phase. Their report, dated July 1982,is included as Exhibit 2. In their report, DOWL Engineers estimated thepotential slip along local faults. Faults which cross the proposed tunnelalinement and the estimated potential slip for each of these faults areshown in Figure 7 and Table 2, respectively, of the DOWL report.B. Peak Ground Motions. Re-examination of applicable graphs andequations developed in WES report S-73-1, specifying peak motion for designearthquakes, indicates M=2+0.54 10 for strike slip faulting in southeast<strong>Alaska</strong>. Accepting a magnitude 8.6 event on the Fairweather-Queen CharlotteFault, gives a local 1=9.3, a maximum site rock acceleration (g)=0.38, amaximum rock velocity of 13.8 in/s and a duration of 10 s plus. All valuesare far field not time dependant. The duration vs. intensity curve wasused instead of the distance/duration curve since it is reasonable toexpect some acceleration duration greater than 0.05g, at 105 km, for amagnitude 8.5 event. The District's consultant (DOWL Engineers) has6-3
t,,10-•~..> ~L.EGENQs• ROC. PACI A.OWI TA~• OLD ACCI •• ROAD CINTlftL'Na ..• ~}• TMJICH TU .... IL ~ ~I ... TOC. '"• PAULTCINTI"L,FIGURE 1. UPPER HEMISPHERE SrEAEOGRAPHIC PLOT OF DISCONnNUITIES'.. ~ .... COliTOUIl. • ~ .. OUT ... CONTOUR.
E. Lake Tap.(1) Overburden - The most important area of the project,geologically speaking, is the mass of rock through which the lake bottomwill be pierced. The site was originally selected from limited field workand studies of aerial photographs during the Long Lake phase as that areaappearing to have the most favorable geology. A seismic refraction surveyof the tap area was performed in October 1972 by Shannon and Wilson, Inc.,for Taku Constructors. Because of the steep slope of the lake bottom, therecords illustrate a bottom derived from diffractions and side reflectionsrather than true bottom reflections. These factors created water depths inerror by as much as 50 ft in the steeper part of the slope, and thereflection pattern would erroneously suggest that up to 40 ft of overburdenexists out to the 200-ft water depth. In 1973, a two man submarine wasused to investigate the bottom of the lake. Video tapes were made of threetraverses of the tap area starting approximately 250 ft deep and moving upcontour to the lake surface. An estimate of overburden depth was made bypenetrating the overburden with the submarine until the submarine strucksolid material. Assuming the attitude of the submarine was level, the veryfine grained sediment covering the solid material was estimated to be 3 to4 ft deep in those few places investigated. Below approximately 145 ft ofdepth, a horizon of trees was found in all traverses. A geophysical surveyof the proposed tap area was performed by Ocean Surveys, Inc. (OSI) duringthe summer of 1983 to verify the previous findings. The survey consistedof side-scan sonar and bedrock profiling and was intended to define thethickness of overburden, the location of large objects, and the presenceand extent of logs in the tap area. The results of the geophysical surveyas reported by OSI are included as Exhibit 3. The surveys revealed thatthere is a probable slide area at the approved tap location. As a result,the tap location for the recommended plan (see Plate 9) has been movedslightly to the north of the original location •. Unfortunately, the surveywas unable to distinguish the extent of log debris on the bottom.(2) Bedrock - Three NX core holes were drilled in the tap area inOctober, 1974. The information received from those holes confirmed earliersurface mapping and air photo interpretations. Open joints are common nearthe top of the rock and may also exist in the tap area. The logs of thecore drillings are shown in Appendix A.6.06 FUTURE INVESTIGATIONS.A. Power Conduit. To explore for the occurrence of high pressureflows of water or unfavorable ground conditions, an exploratory guide holewill be drilled in advance of the tunnel heading when approaching theprominent fault zones. Drilling of the guide hole will be phased withnormal tunneling operations. Evaluation of the integrity of the tunnelsurface with respect to the deformation characteristics of the rock isrecommended by DOWL Engineers and Polarconsult (Exhibit 4) to assess theoverall capacity of the tunnel to deform without damage duringearthquakes. This investigation is not needed because the June 1983inspection of the Long Lake power tunnel indicated that the integrity ofthe rock surface is excellent with no indication of stress concentrations.•,.6-6
B. Lake Tap.(1) Seismic Refraction Survey - In their report titled IILake TapInvestigationsll (see Exhibit 4) Polarconsult, lnc. recommends that aseismic refraction survey be performed in the tap area. In addition, DOWLEngineers and Ocean Survey Inc. also recommend a seismic refraction surveyprior to construction. Bedrock surface contours (see Exhibit 3) do showdistinct linear features which do not correlate with any known structuralfeatures. While these features are most likely deep glacial gouges, therefraction survey will "show any significant rock changes that may representstructural weakness. However, based on the erroneous conclusions of the1972 Shannon and Wilson report, we do not recommend the conductance ofanother seismic refraction survey.(2) Geological Explorations - During the summer of 1984 the <strong>Alaska</strong>District conducted an extensive exploration program in the tap area tobetter define the quality of rock at the selected site, and the extent andtype of overburden that needs to be cleared from the site prior to thetap. The program consisted of three core holes in the vicinity of the tapand 4 to 6 shallow probes within the limits of the area to be cleared. Theresults of that exploration program were not available for inclusion inthis design memorandum, but will be forwarded for review under separatecover.(3) Coring Probes - Before the tap and primary rock trap areexcavated, the contractor will be required to conduct coring probes of thelake bottom which will be used to verify the soundness of the selected taplocation. These probes will also be used to determine whether grouting isneeded to prevent leakage in the tap area.6-7
SECTION 7 - <strong>LAKE</strong> TAP7.01 GENERAL. This section summarizes the design and procedure forconnecting the power tunnel to the reservoir. Additional designinformation is presented in Appendix Bl. The recommended lake tap isreferred to in the Polarconsult report (see Exhibit 4) as the opensystem/wet tunnel type. Prior to the final blast, the tunnel upstream ofthe gate structure is filled with water that is brought in through the gatestructure shaft. The tap configuration is similar to the one used for theRingedalsvatn lake tap of the OKSLA Hydropower project in Norway. The laketap consists of an entrance orifice, a large rock trap, and a transition tothe ll-ft diameter modified horseshoe tunnel. The open system/wet tunneltap is preferred because it reduces the impact of the blast forces on theservice gate and requires a less complicated rock trap configuration.Details of the recommended tap are shown on Plates 9 through 12.7.02 <strong>LAKE</strong> TAP LOCATION. The proposed location of the lake tap is shown onPlates I, 2 and 9. when power tunnel excavation progresses beyond thelocation of the gate structure, sounding drillings will be repeatedlyperformed ahead of the tunnel face for a distance of at least twice thelength of the next blast round, until the lake tap location is reached.This procedure will aid in determining the best tap location and thepresence of rock fractures that could transmit water to the tunnel. Thesounding probe will be equipped with a packer for sealing off the hole ifwater is encountered.7.03 ORIFICE. The final blast will result in an orifice that is 12 ft indiameter and 10 ft long. Hydraulically, the orifice will act as a shorttube with the vena contracta occurring approximately 5 ft from theentrance. Maximum velocity at the vena contracta is 5.7 ft/s. The orificeopens to Crater Lake at elevation 799.7.04 PRIMARY ROCK TRAP.A. General. The primary rock trap is an integral part of the laketap. The function of the primary rock trap is to contain the material fromthe lake-piercing blast and allow flow from the reservoir into the powertunnel with a minimum of resistance and turbulence in keeping with goodeconomics.B. Rock Trap Design. The final blast will produce approximately86 yd 3 of rubble. The rock trap is sized to contain the final blastmaterial plus an additional 55 yd 3 of material which might occur over thelife of the project without restricting the flow into the power tunnel.The rock trap is 64 ft long and 18 ft wide. Because the invert slopesupward at a 12.4 pct slope in the downstream direction, the height of thetrap varies from 27 ft near the orifice to 17 ft at the downstream end ofthe trap. A transition section 38 ft long connects the rock trap to thell-ft diameter power tunnel. Plates 11 and 12 show the recommended design.7 -1
7.05 TAPPING OPERATION.A. General. For the tapping operation, the contractor will berequired to hire a specialist in construction of lake taps, whosecredentials must be reviewed and approved by the Corps of Engineers. Thisindividual will be in complete charge of all technical aspects of the tapconstruction including drilling pattern, exploratory holes, grouting, shotpattern, powder charges, etc. The Corps will retain the constructionmanagement services of a consultant experienced in the design and functionof deep water lake taps. The contractor and Corps specialists must be inagreement on procedures prior to beginning work in the tap area, and willconfer on a daily basis once work starts. The Corps will act as arbitershould there be a conflict between the recommendations of the experts.This procedure was recommended by Polar Consult and is the same procedurethat was followed during the Long Lake tap.B. Tap Site Preparation. Prior to the final blast, all overburdenwill be removed from the v1cinity of the tap to at least the minimum limitsshown on Plate 9. The firm of Tryck, Nyman and Hayes was retained toevaluate several methods of doing the clearing and forward arecommendation. Eight methods to clear the tap site of overburden wereevaluated, six of which were ruled out (see Exhibit 5). Portions of theschemes that have been ruled out have possible uses in conjunction witheither of the two methods studied in detail.The two methods presented in detail are! (1) excavation by clamshelloff of a barge, and (2) excavation by the slusher method. The latterappears to be the least costly of the two alternatives. Under the slushermethod, a cable system similar to a high-line would be installed across thelake. A heavy blade/plow/rake would be pulled down-slope, moving theoverburden away from the tap site and depositing it in deeper water belowthe tap elevation (see Plate 10). Details of the two methods that appearto be the most feasible are presented in Exhibit 5. Included in theanalysis are equipment li~ts, manpower requirements, equipment layouts,location plans and cost estimate.The exact clearing limits will be determined during the development ofplans and specifications. The contractor will be required to verify hisclearing progress and final survey by use of either subbottom profiling,side scan sonar, Remote Sediment Profile camera, or divers. The contractorwill be allowed his choice of any, or a combination of all, methodsavailable. Exploration drilling, to be completed during the summer of1984, will be very useful in providing information on the nature of theoverburden as well as confirmation of the side scan sonar data concerningdepth of overburden.C. Tae Chartes. After the rock trap has been excavated and only therock plug 1S lef in place between the rock trap and the lake, aprecalculated number of holes will be drilled and powder charges set. Allcharges will be detonated from the helipad/staging area outside the gatestructure adit.7-2
D. Prefilling. Prior to the tap blast, the gate structure bulkheadwill be removed to prevent damage and the service gate will be closed.Water will be pumped from Crater Lake to prefill the gate shaft and thepower tunnel upstream of the service ga'te. The gate shaft will be filledto an elevation of 24 ft below the elevation of the pool that exists at thetime the tap is made (if the lake is at the observed maximum pool of 1,019ft, the shaft will be filled to elevation 995 ft). The head differentialof 24 ft was selected because it is sufficient, along with gravitationalforces, to carry rock plug material into the primary rock trap. Inaddition, a WHAMO run showed that the 24 ft head differential would resultin a gate shaft surge up to an elevation of 1040 immediately after the laketap blast. This surge elevation would preclude any flooding in the gateshaft access adits. The Polarconsult report (Exhibit 4) states that a headdifferential of 26.2 ft was used for the successful Ringedulsvatn lake tapin Norway.E. Air Cushion. During prefilling, a compressor located at thestaging area outside the gate structure access adit will be used to pumpair to the lake tap air space in the primary rock trap. The air space actsas a cushion, reducing the effect of the shock wave which is transmittedthrough the water to the service gate. The water surface elevation in theair space will be maintained at an elevation of 783 ft with the resultantpressure at 90.8 lb/in 2 g. A standard 30 hp compressor with a continuouspressure rating of 100 lb/in2g can pressurize the air space in about 2 hrff prefilling can proceed as rapidly.F. Blast Reaction. The lake tap blast and consequent surge of waterinto the rock trap will result in a force of approximately 882,000 lb (apressure of 295 ft of water) on the gate and a maximum surge of water upthe gate shaft to elevation 1,040 ft. The Waterways Experiment Station hasconfirmed these conclusions, as shown in Exhibit 6. Keeping the gatestructure service room (floor elevation 1,040 ft) dry is desirable but notessential since the equipment located there will not be damaged by anyshort term wetting. All personnel will be out of the gate structure andaccess adit prior to the blast.G. Time Period. The time between the start of prefilling and theblast will be strictly controlled. In their report, Polarconsult says "Theperiod of time from start of filling the tunnel until triggering the finalblast is critical. The work for this period should be planned to thesmallest detail aiming at 16 hrs from start of filling until firing (thiseven if the delay caps should be specially made to resist 300 ft of waterpressure for 72 hrs)."H. Instrumentation. A discussion of the instrumentation for the laketap operation is presented in paragraph 13.02.7.06 PRIMARY TRASHRACK.A. Design. For design purposes, the bar spacing used for the LongLake primary trashrack was assumed for the Crater Lake primary trashrack.This spacing is 1/2-inch bars spaced 2-1/2 inches on center. Based on aflow net analysis, the maximum effective gross area for the trashrack is7-3
approximately 200 ft2. Based on that area and a maximum discharge of518 ft3/s, the maximum velocity is 2.58 ft/s. The trashrack will beconstructed in two pieces joined by a hinge on its downslope side. Thebars of the top piece will fit parallel to and directly over the bars ofthe bottom piece. There will be a series of guard plates 1 ft by 4 ft by 1inch thick with a slotted hole that will be bolted around the perimeter ofthe trashrack. Each plate will have guides welded to the trashrack. Theirpurpose is to adjust to the lake bottom contour to keep debris fromentering into the intake. The recommended design is shown on Plate 13.The trashrack hydraulic design is discussed in greater detail in HydraulicAppendix Bl.B. Placement. After the lake has been tapped, the trashrack will belowered into position from the lake surface. The underside of thetrashrack will have a tapered guide that will fit into the orifice andserve to aline the trashrack over the orifice and prevent the trashrackfrom slJding down the rock slope. The trashrack will be held in positionby its own weight and 4 concrete cylinder counterweights. The guard plateswill be bolted in the raised position during placement of the trashrack.After the trashrack is in place, a hardhat diver will loosen the bolts andslide the plates down until they contact the lake bottom. He will thenretighten the bolts. The guard plates will be able to adjust to a maximumof 3 ft below the bottom of the trashrack. The plate guides will be coatedwith a heavy grease to assist the diver in lowering the plates.C. Cleanin " Two cables will be permanently attached to the upperrack and secure a on the lake shore. When cleaning is to be performed, thecables will be attached to barge-mounted hoists that are powered by 2 hpelectric motors. Raising the cables and the upper rack will cause thedebris to be deposited on the downslope side of the trashrack. The bargeis stored on rails mounted on the rock surface below the gate structureaccess adit. Utilizing the hoists mounted on the barge, the barge pullsitself up the rails to a point above maximum water surface elevation, whereit is dogged off. This protects it from ice that forms on the lake duringthe winter months. During initial construction of the project, rails willbe mounted on the lakeshore from the access adit portal to the reservoirsurface at the elevation existing at the time. As the reservoir is drawndown during operation, the barge storage rails will be extended as neededto facilitate barge access.7.07 TWO-STEP <strong>LAKE</strong> TAP. A two-step lake tap was proposed for use in OM 23should the rock conditions at the proposed tap location be judgedinadequate to insure a successful tap. A two-step tap is the simultaneoustapping of the lake bottom at two distinct locations. The provision for atwo-step lake tap is no longer considered a necessary precautionary measure,because, as stated in Sections 6.06 and 7.02 of this report, investigationswill be undertaken during construction to insure that an adequate taplocation is found. In addition, Polarconsult, Inc., does not address theneed for a two-step lake tap in their lake tap investigation report(Exhibit 4).7-4
SECTION 8 - GATE STRUCTURE8.01 GENERAL. The gate structure and gate structure access adit house aservice gate and bulkhead and all the equipment required to allow theirfull operation for power tunnel filling and draining procedures and foremergency situations. Emergency operation of the service gate will becomenecessary should there be coincidental failure of the wicket gates andspherical valve, failure of the tunnel-filling valve, or in the event ofpower conduit rupture. The gate structure is completely underground andlocated approximately 650 ft downstream of the proposed lake tap site. Thehorizontal location of the gate shaft is based on the most favorablegeologic conditions found nearest to the lake tap. The crown elevation ofthe tunnel at the gate shaft assures a 14-ft seal of water under the worstload demand conditions.8.02 SHAFT.A. General. The shaft is a lO-ft by 12-ft by 251-ft high chamber thathouses the gate, bulkhead, stainless steel gate guides, access ladder,safety and inspection landings, and the power tunnel air vents. The gatestructure shaft is shown on Plate 15.B. Service Gate and Bulkhead.(1) General - An economic study to find the optimum gate andbulkhead size compared the cost of head loss through various tunnelopenings at the gate structure with the cost of constructing the tunnelopening and its corresponding gate and bulkhead. Over the range of tunnelopenings considered, the smallest was the most economical. However, topermit passage of a small tractor during construction, a larger tunnelopening of 6 ft wide by 8 ft high was selected. To seal this size opening,the service gate is 6.83 ft wide by 8.46 ft high. The bulkhead is 8.7 ftwide by 9.3 ft high. A detailed description of this economic study isincluded in Section 1.02 G of Appendix Bl.(2) Service Gate - A hydraulically-operated slide gate will beutilized as the service gate because this type of gate will permit the useof an open system/wet tunnel lake tap, has been used successfully forsimilar high head conditions, and is capable of being operated underbalanced and unbalanced heads. Details of the service gate are shown onPlate 16.(3) Bulkhead - The gate structure bulkhead, located 6 ft upstreamof the service gate, seals off the power tunnel at the upstream side of thegate structure, thereby allowing the gate structure to be drained formaintenance and access into the power tunnel. The bulkhead can only beoperated under balanced head conditions. When not in use, it will bedogged and stored at the top of the shaft. The bulkhead includes a flipvalve which is operated by a small cable from the service room. The gateshaft is filled through this valve, as described in Section 9.07.8-1
C. Access. Primary access to the gate shaft and secondary access tothe power tunnel is by ladder from the gate structure service room. Theladder is enclosed in a cage and provided with landings spaced at 30 ftintervals. Suspended beneath the lower observation platform is an extensionof the access ladder that can be lowered into the power tunnel to permitaccess for inspection and maintenance purposes.D. Tunnel-Filling Pipe and Valve.(1) Tunnel-Filling Pipe - The tunnel-filling pipe conveys waterfrom between the bulkhead and service gate to the downstream end of theconcrete transition. The discharge is directed against a 5-ft by 5-ftsteel plate to protect the concrete from the high velocity water jetstream. A 12-inch diameter gipe was selected as the practical size becauseit allows a constant 9.1 ft3/s discharge rate at all pool elevations,which results in a reasonable tunnel filling time (25 h) and unlined tunnelflow velocity (5.2 ft/s).(2) Tunnel-Filling Valve - The valve is a 12 inch diameter globevalve rated at 130 lb/in2g. The valve can be throttled during fillingoperations to provide the required flow. Filling should proceed at a slowrate until the penstock is filled to the point where a pool is establishedin the final rock trap. At that time the filling rate can be increased byopening the valve wider~(3) Emergency Tunnel-Filling through Service Gate - In the eventthat the tunnel-filling pipe and valve fail and cannot be repaired in timefor a scheduled tunnel-filling, the slide gate can be used to fill thetunnel, similar to the method employed at Long Lake. The slide gate wouldbe cracked open from 0.2 inches to 0.6 inches, depending on lake elevation,in order to provide the required flow for a 25 hour tunnel filling. Gatestops will be provided every 0.2 inches for the first 2 inches of openingin order to prevent an inadvertent rapid opening of the gates which couldresult in quantities of rock being swept downstream and damaging thesecondary trashrack, penstock and turbine.E. Transitions. The lengths of the required transitions from thell-ft power-tunnel to the 6-ft by 8-ft tunnel opening at the gate structureare 25 ft on the upstream side and 30 ft on the downstream side. Theselengths were selected after an economic optimization study compared thecost of construction of various transition lengths to the value of theheadloss of each. A detailed description of the economic study is includedin Section 1.02 G of Appendix Bl.F. Air Vent.(1) Purpose - The air vent will be required to perform the dualfunctions of providing adequate airflow into and out of the power tunnelduring tunnel filling. It is anticipated that the vent will supply air tothe tunnel during the early stages of filling and will allow excess air tobe exhausted from the power tunnel during the latter part of the fillingprocess.8-2
(2) Design - For design purposes, it was assumed that safeguardswould fail and the gate operator would inadvertently allow the service gateto move to a 50 percent open position before he could stop it. At 50 pctgate opening and lake elevation at 1,019, the flow through the tunnel is1,860 ft3/s, which is also the maximum air flow out of the vents. Airvelocities are limited to 296 ft/s which is higher than the 150 ft/smaximum recommended by HOC 050-1 but only slightly higher than recorded airvelocities of 280 ft/s that were experienced at Pine Flat Dam (HOC 050-1).Reference 23 indicates that an air velocity of 296 ft/s is a relatively lowvelocity in terms of compressibility and no problems resulting fromcompressibility are forseen. Two 24-inch pipes are used resulting in across sectional area of 6.28 ft2. The maximum air demand (into thetunnel) that can occur during tunnel filling is 700 ft3/s and will beeasily handled by the recommended vents. A rectangular transition withdimensions 2.0-ft by 6.0-ft will open downstream of the service gate. Thevent pipes will extend above the transition, up the gate shaft, and thenalong the gate shaft access adit to the portal overlooking the lake.8.03 OPERATIONAL FACILITIES.A. Service Room. The service room is a 24-ft by 30-ft by 25-ft highroom located at the top of the gate shaft. The service room floor is atelevation 1040, which is above the maximum lake surface elevation. Thisroom houses a control panel, cable sheaves, hydraulic hoists, and a gateService area. It also provides access to the gate shaft.B. Access Adits. Primary access to the gate structure is through all-ft wide by ll-ft high by 850-ft long vertical sidewall tunneloriginating at a helicopter pad and staging area. This pad is constructedfrom excavated material at approximately elevation 1,035. The adit isunlined except at the portal area. The portal has a concrete canopy andwingwalls to protect it from falling rocks and avalanches. The entrancehas a steel gate with lock to keep out intruders. The portals will beequipped with air vents to provide fresh air circulation in the adits (seePlate 19). The bulkhead hoisting equipment is located in an aditenlargement, 75 ft from the service room. From the service room, the aditcontinues approximately 400 ft to Crater Lake. This section of aditprovides access to the lake surface monitoring equipment and primarytrashrack cleaning equipment.8.04 MECHANICAL DESIGN.A. Hydraulic Hoist.(1) Hydraulic System - The hydraulic system consists of an oilreservoir, two electric positive displacement pumps, and related piping,gages, and control valves located as shown on Plate 17. Two 25-hp electricmotors will be installed to drive the hydraulic pumps. The motors willdrive the pumps at rated speed to provide 1,100 psi to start the slide gatemovement, and 40 gpm flow to move the gate at approximately 0.8 ft/min.The gate will take approximately 10 min to move from the fully closedposition to the fully up and locked position, and the same time to reclose.The electric motors will be the primary power source with no backup.8-3
(2) Operation - The gate will be controlled by an electricallyoperated remote controlled valve. The remote control will be located inthe powerhouse and sUbstation and will have four positions: up, hold,down, and off. The hydraulic pump motor will operate when the control i~placed in the up, hold, or down position. The manual valve will be locatednext to the gate slot with the hydraulic pump and motor. The manualcontrol valve will be installed in series with the solenoid valve foremergency or power off manual operation of the slide gate. Hydraulic fluidwill bypass when the piston has traveled to its full up or full downposition, to relieve the pump when the piston has reached the end of itstravel. A limit switch activates at either travel extreme to stop pistonmotion. During gate opening the limit switch stops gate movement every 0.2inches for the first 2.0 inches. This safety feature is provided to allowthe tunnel to be filled by cracking the gate rather than using thetunnel-filling pipe and valve. During gate closure, however, the 0.2 inchlimit switch has no effect on gate movement. When the cylinder is to beserviced~ the "8 ft" limit switch can be over-ridden to drive the pistonfractionally higher to latch the piston in place in the cylinder head.(3) Design Criteria Hydraulic Hoist - The results of preliminarycomputations of the starting force to raise the leaf are based on thelatest criteria, "Hydraulic Design Criteria" -- Vertical Lift Gates -Hydraulic and Gravity Forces, Sheets 320-2 to 320-2/3, Rev. 10-61, U.S.Army Engineer Waterways Experiment Station, OCE. .(NOTE: The force totlose the gate is somewhat less than that to open it.)Seal FrictionWater Packing FrictionLower Oil Packing FrictionPiston and Ring FrictionSubtotal, Friction ResistanceWeight of Moving PartsHydraulic Downpull ForcesCoefficient0.70*0.20.2Varies wicyl PressureForce(pounds)490,0001622,6802,560**495,40266,00022,000,.-Weight of Oil in CylinderSubtotalLess Bouyancy4,060587,462-6,300Total required Start Force581, 162 1 bf* Coefficient of sliding friction Brass on Brass from "Marks Handbook",Fifth Edition, pp. 218.** Value at highest pressure.8-4
(4) Gate Position Indicator - A gage calibrated in tenths of afoot from 0 to 8 ft will be bolted to the hydraulic cylinder head at thetop or fixed end of the gage and bolted to the stem at the bottom ormovable end of the gage. When the piston is at the top of its travelwith the gate fully opened, the gage pointer shall indicate "8 ft" (asmeasured from the floor of the gate shaft to the bottom of the gateleaf). When the piston is at the bottom of its travel with the gatefully closed, the pointer shall indicate "0 ft".(5) References - The Cougar Dam Design has been used as areference and a guide in this design. The gate size and type aresimilar, as is the head of water.B. Cable Hoist. A 10-ton cable hoist will be used for raising andlowering the bulkhead, and will also be used to remove the hydraulichoist, slide gate, and other equipment. Stem links will be removed orinstalled one link at a time, thus the maximum weight to be lifted isthat of the slide gate hydraulic cylinder, 15,300 lbs. The hoist size =(15,300 lbs) (1.3fs) = 20,000 lbs load. Thus, a 10-ton base mountedhoist will be installed with an overhead motorized bridge and sheaves asshown on Plate 18. The hoist consists of a l-hp electric drive motor,worm gear reduction unit, drum gear, cable drum, cable sheaves, andcables. The cable drum rotates at 0.085 r/min and raises or lowers thebulkhead at a rate of 0.8 ft/min. The hoist is always operated underpower and never allowed to fall freely.There are two cable sheaves. One is a motorized sheave on amotorized bridge, the other is a roof mounted swivel sheave located nearthe service gate slot. The overhead sheave is motorized so its positioncan be adjusted to be directly above the bulkhead for operation or theslide gate during maintenance. The hoist is located in the access adit75 ft from the service room and contains a 3/4-inch diameter, 400-ft longcable. The slide gate, bulkhead and hoist drum share the same cable. Aposition indicator shows the position of ·the gate or bulkhead for theirfull range of travel.(1) Hoisting Procedure - The bulkhead is dogged off and storedin the open position. During those times, the hoist cable is slacklyconnected to the bulkhead and hung on the wall of the adit. Whenoperation is required, the hoist cable must first be removed from thewall of the adit and tightened onto the hoist drum, thereby accepting thefull weight of the bulkhead. The bulkhead can then be undogged andlowered. The bulkhead is operational only in a balanced head conditionin the tunnel; therefore, the gate shaft must be filled beyond the heightof the tunnel before the bulkhead can be totally lowered into the closedposition. Time to lower the bulkhead into the closed position isapproximately 3.7 hrs.(2) Gate Position Indicator - The bulkhead position indicatorfor the cable hoist consists of a lIB-inch galvanized steel cableattached to the hoisting cable socket on one end, and to a spring-loaded"positive tension, nonracheted take-up reel mounted on the motorizedbridge next to the motorized sheave as shown on Plates 17 and 18. Notshown on the plates are the limit switches that will be activated for the8-5
ulkhead fully-closed and fully open positions. These will be mountedadjacent to the take up reel. A cable length counter calibrated intenths of a foot will be installed and be readable from the cable hoistcontrol panel. A counter reading of "0.0" will correspond to bulkheadfuJly closed. Positive readings indicate height of bottom of bulkheadabove tunnel floor. The counter will be capable of a readout of up to300 ft.C. Heating and Ventilation. No heating or ventilation is required.8.05 ELECTRICAL DESIGN. Power requirements for the gate structureinclude lighting in the gate structure and adits, slide gate operation,bulkhead 'gate hoist, and remote control and monitoring system.A. Power Supply. Two 15 KV 3-phase power cables are suspended alongthe roof of the penstock tunnel and then installed in concrete encasedconduits in the floor of the power tunnel from the tunnel plug to thegate structure and upper adits. Watertight access handholes areinstalled at 400-ft intervals along the conduit for installation andrepair of the cables. These cables supply power to the project bytapping off of the powerhouse's 13.8 KV bus. The 13.8 kV power isrequired because the powerhouse's auxilliary system voltage of 480 voltsis too low to trasmit power from the powerhouse 7,000 ft to the gatestructure service room. One cable supplies normal power while the secondtable serves as a backup cable. The cables are in seperate conduitsbecause failure of one cable would damage the second cable if they werein the same conduit. At the gate structure, each cable is transformedthrough a seperate 75 KVA pad mounted 13.8 KV - 277/480 volt 3-phasetransformer to provide low voltage power to the facility. The 277/480volt power is used to prevent .large secondary conductor sizes due toexcessive voltage drop. A remote controlled automatic transfer switch atthe gate structure allows choice of primary feeders from the powerhouse.B. Lighting. Incandescent lighting is used in the gate structureand the gate structure access adit. Due to the limited usage of thelighting system and the delay for strike of a discharge lighting systemthe incandescent lighting is considered the most practical approach forthis project. The lighting load for these two areas is estimated to be7.5 kW.C. Slide Gate Control. A control panel and a gate positionindicator are provlded ln the gate stucture service room. The controlpanel provides basic RAISE-STOP-LOWER functions. Slide gate raising isincremental. Pressing the RAISE button raises the gate a short distanceand automatically shuts off. Lowering of the gate is continuous, withautomatic stop at the full closed position. Over travel limit switchesprevent over-raising or lowering of the gate. Power requirements for theslide gate are approximately 40 kW.D. Bulkhead Hoist Control. A hoist control panel is provided in theservice room for the bulkhead hoist. The panel provides basicRAISE-STOP-LOWER functions. Approximate power requirements are 2 kW.8-6
E. Remote Control and Monitorin~. A concrete encased conduitinstalled under the power tunnel wit watertight access points every400 ft houses control and monitoring cables between the powerhouse andgate structure. Backup cables are provided in a separate conduit in caseof primary cable failure. Cables allow remote control from thepowerhouse of the slide gate and power sDpply transfer switch, andmonitoring of the slide gate position and lake water level. Powerrequirements are approximately 20 watts.F. Intra-site Communications. The only intra-site communicationswithin the gate structure and adit is between the service room and thehoist room. This is a battery powered intercom with a Ilhardhat" headsetjack in the hoist room. The headset is used to overcome the hoistingmachinery noise. An alternative would be sound powered headsets.Communication between the powerhouse and gate strucuture is accomplishedby interfacing the headset system at the gate structure with thecommunications system at the powerhouse via a hard wire circuit betweenthe two locations. The hard wire circuit is installed in the floor ofthe power tunnel in the same trench as the control circuits. Calls areoriginated from either location and bidirectional conversations arepossible.8-7
SECTION 9 - POWER TUNNEL9.01 GENERAL. The plan and profile of the ll-ft diameter modifiedhorseshoe tunnel is shown on Plate 2. The power tunnel is approximately6,020 ft long from the primary rock trap to the penstock. The invertelevation is 761.5 ft at the primary trap and 109 ft at the final rocktrap. The tunnel "invert slopes upward at 3.88 pct from the primary rocktrap to the gate structure and downward at 12.437 pct from the gatestructure to the final rock trap. The tunnel will be excavated in rock andessentially unlined. Components of the power tunnel include the powertunnel emergency bulkheads, the secondary and final rock traps, and thesecondary trashrack. The power tunnel is designed according to EM110-2-2901, "Tunnels and Shafts in Rock".9.02 POWER TUNNEL.A. Excavat i on.(1) Drill and Blast - The cost estimate is based on conventionaldrill and blast methods of excavation. A mining equipment company wascontacted to confirm that the selected tunnel grade could be negotiatedwith rubber tired mucking equipment within the tunnel dimensions proposed.Equipment is available to perform the work within safe speeds for tunnelingoperations. A conveyor system could also be used.(2) Tunnel Boring Machine (TBM) - The contractor will be allowedthe option to use a TBM for a round tunnel. A mining company that uses TBMequipment was contacted to confirm that the tunnel could be mined in thehard rock encountered at Snettisham and could be operated on the selectedgrade. The mining company indicated that this tunnel could be mined by aTBM but a minimum 500 ft radius is required for continuous miningoperation. To maintain the recommended tunnel alinement, the contractormay have to over excavate at the intersection of the access adit and thepenstock tunnel to allow the TBM to be turned to the power tunnelalinement. The contractor would be allowed to adjust the tunnel curveradius from 100 ft to 500 ft at the curve near the final rock trap.B. Linin~. Only a small percentage of the 6,020 ft of tunnel requiressupport by pa tern rockbolting. In addition, concrete lining may berequired for approximately 125 ft, and shotcrete lining for 920 ft. Thetransitions in the tunnel for the gate structure will also require a totalof approximately 80 ft of lining. Ten steel set supports will be requiredonsite should they be needed. The steel sets will be cold worked A-36steel and 11 ft in diameter. Bending moments of the steel sets will beeliminated by complete lagging and back packing. Lagging will be eitherwood or steel depending on rock conditions. The actual need for rockbolts,steel sets, concrete lining, and shotcrete will be determined byexperienced Corps of Engineers field personnel as work progresses. Seeparagraph 6.05B and Plate 4 for rock support and lining details. Liningmaterial requirements are discussed in Supplement No.1 to this report,"Materials Investigations," dated November 1983.9-1
9.03 POWER TUNNEL EMERGENCY PLUGS AND BULKHEADS.A. General. Two power tunnel emergency bul kheads wi 11 'be constructedin the power tunnel upstream of the gate structure. One will be locatednear the lake tap and primary rock trap and the other approximately 75 ftupstream of the gate structure (see Plates 2 and 14). The exact locationof the bulkheads will be determined by Corps of Engineers field personnelduring construction to insure placement is in sound rock. The purpose ofthe bulkheads is to provide a means of dewatering the power tunnel upstreamof the gate strucure in the event that a rock fall or tunnel displacemntcaused by seismic activity should occur in the upper reaches of thetunnel. They would also be used if the lake tap operation was unsucessfulor if a rock slide blocked the entrance to the power tunnel intake. Thehinged bulkheads will be designed in accordance with EM 1110-1-2101,"Working Stress for Structural Design" to resist the full hydrostaticdesign pressures. The bulkheads will be recessed and imbedded inreinforced concrete so as not to restrict flow. The bulkheads will bedogged in the open position to assure against closure during projectoperation. Hardhat divers will be required to close the bulkheads. Themaximum depths that the divers will have to descend to are 230 ft in thegate structure and 262 ft in the primary rock trap area. Because of theshort duration that a diving team can work at these depths and the heavyequipment that they will use, the distances they can travel into the tunneli,s 1 imited, therefore two bulkheads are required.B. Operation. If damage or blockage occurs upstream of the gatestructure the following procedures will be followed:(1) Upper Tunnel Bulkhead - If damage to the power tunnel occursbetween the two bulkheads, the wicket gate, spherical valve and thehydraulically-operated service gate in the gate structure will be closed.A diving team will attach cables to the primary trashrack and it will behoisted to the surface. A diving team will enter through the power tunnelintake and close and dog shut the upstream emergency bulkhead. The tunnelwill then be drained and repaired. The tunnel upstream of the gatestructure will then be filled through the gate structure allowing equalpressure on both sides of the bulkhead. A diving team will then open anddog the bulkhead in the open position. The trashrack will be replaced, theremainder of the power tunnel, surge shaft and penstock refilled.(2) Lower Tunnel Bulkhead - If damage to the conduit occursupstream of the upper bulkhead, the wicket gate, spherical valve and thehydraulically operated gate in the gate structure will be closed. A divingteam will enter through the gate structure and close and dog shut the loweremergency bulkhead. The power conduit will be drained. The section oftunnel upstream of the bulkhead will be abandoned. A new power tunnel willbe mined starting between the down~tream emergency bu'lkhead and the gatestructure and will reenter the lake at another location with a new rocktrap and lake tap using the same procedure as used in the recommendedplan. Without the emergency bulkheads a new tunnel and lake tap would haveto be started downstream of the gate structure. A new gate structure wouldhave to be constructed and the old gate structure would be abandonded.9-2
9.04 ROCK TRAPS.A. Secondary Rock Trap. The secondary rock trap is locatedapproximately 130 ft upstream of the gate structure and is designed toprevent rubble from entering the gate slots. The rock trap will interceptany material not retained in the primary rock trap. Details of thesecondary rock trap are shown on Plate 20.B. Final Rock Trae. The final rock trap lies on a 12.437 pct slopebut in other respects 1S similar in shape to the final rock trap built forthe Long Lake tunnel. Maximum velocity through the rock trap is 2.6 ft/sas compared to a maximum velocity of 3.9 ft/s at Long Lake. The lowervelocity at Crater Lake results in a conservative design even when thesloping invert is considered. Approximately 96 yd 3 of storage volume isavailable just upstream from the secondary trashrack. The quantity ofmaterials found in the Long Lake rock trap after 10 yrs of operationindicate that migration of large quantities of materials will not be amajor concern (see Exhibit 1). Plate 21 shows details of the final rocktrap.9.05 SECONDARY TRASHRACK. The function of the secondary trashrack is toprevent most particles that are suspended in the water by vortices andturbulence from entering the penstock. A full trashrack is used to providepositive protection for the steel penstock and turbine during the initialstages of operation of the Crater Lake. This trashrack extends across theentire upstream end of the concrete conical section located in thedownstream end of the final rock trap. Utilized in the design are 1/4-inchbars spaced 1-7/8 inches on center. The rack is designed to allow removalof the top portion after the system has been operated at or near maximumflow and the tunnel is dewatered for inspection. This should occurapproximately one year after power-on-line is achieved. The rack will becleaned when the power conduit is drained.9.06 PLUG AND BULKHEAD. The tunnel access plug and bulkhead, shown onPlates 7 and 8, seals the penstock tunnel after the power conduitconstruction is complete and prior to power tunnel filling and systemoperation. The 75-ft long plug is located at the downstream end of thefinal rock trap. To permit future access to the final rock trap, powertunnel, and surge tank, a hinged bulkhead is provided in the plug. Thebulkhead is designed in accordance with EM 1110-1-2101, "Working Stressesfor Structural Design," to resist the full design pressures that occur atthe plug location. The tunnel upstream of the plug is widened and aconcrete wall approximately 25 feet long separates the bulkhead forebayfrom the rock trap to restrict flow near the bulkhead so debris and rockwill not be deposited in front of the bulkhead.9.07 TUNNEL FILLING AND DRAINING PROCEDURES.A. General. This section describes the operation of the service gateand bulkhead for routine filling and draining of the power tunnel.9-3
B. Filling. Conditions at the start of a normal tunnel fillingoperation w,ll be: bulkhead closed - water upstream, dry downstream;service gate closed - dry upstream and downstream; tunnel-filling valveclosed; flip valve in bulkhead closed; spherical valve closed. The firststep is to open the flip valve and fill the gate shaft, permitting thebulkhead to be retracted. Once the bulkhead has cleared the power tunnelas it is being retracted, the tunnel-filling valve can be opened and thetunnel filled with water. Filling should take approximately 25 hr. Oncethe tunnel and surge tank are full, the tunnel-filling valve will be closedand the service gate will be retracted. The spherical valve is thenopened, followed by opening of the wicket gates.C. Draining. To drain the tunnel for inspection or maintainence, theturbine wicket gates will be closed first, followed by closure of thespherical valve. The service gate will then be closed. The sphericalvalve and wicket gates are then reopened to drain the tunnel. To allowinspection of the service gate, the bulkhead will then be lowered intoposition and the tunnel-filling valve opened to drain the gate shaft.9.08 ROCK COVER CRITERIA FOR UNLINED TUNNEL. The criteria for determiningwhere the power tunnel w,11 be 1,ned, when not required because of poorrock conditions, are (as approved in OM 23):a. Minimum rock cover, in feet, vertically above any point in theunlined tunnel shall be equal to eight-tenths of the maximum dynamicpressurehead, in feet, to which the tunnel shall be subjected at the tunnelstation;b. The minimum horizontal distance, in feet, to the rock surface atany point in the unlined tunnel shall be equal to 150 percent of themaximum dynamic pressurehead, in feet, to which the tunnel shall besubjected at that tunnel station;c. A point to the side of the unlined tunnel having a horizontaldistance from the tunnel equal to the maximum static pressure head shallhave a vertical rock cover equal to at least six-tenths of the maximumstatic pressure head, in feet, to which the tunnel will be subjected atthat station..'The criteria in paragraph (b.) above is recommended to be modified from150 pct to 110 pct of the maximum dynamic pressurehead for the minimumhorizontal cover. Because of the excellent rock condition, leakage shouldnot be a problem. The recommended plan provides 110 pct of the maximuminternal head for the minimum horizontal rock cover. By using the relaxedminimum distance requirement, approximately 400 ft of steel penstock hasbeen eliminated from the recommended plan.9-4
SECTION 10 - SURGE TANK10.01 GENERAL. The Snettisham project serves an isolated load in Juneau,and at times, during non-peak load periods, the Crater Lake unit may behandling the entire Juneau-Douglas electrical demand. Operation underthese conditions requires rapid load pickup, rapid load rejection, andinherent stability under load changes, all of which a surge tank provides.Maximum and minimum water hammer elevation at the turbine without a surgetank are 1,700 ft and 480 ft, respectively, for 3.5 s wicket gate closingand 5 s opening times. With a surge tank in the system, the maximum andminimum water hammer elevations are 1,263 ft and 597 ft, respectively. Inaddition, a surge tank provides a source of water to enhance rapid loadpickup capabilities.10.02 DESCRIPTION OF RECOMMENDED SURGE TANK. The surge tank is a 10-ftdiameter, vented, vertical, unlined surge shaft through rock with a bottomelevation of 145.3 (the drift tunnel invert is at elevation 150.3 ft) and atop (day light) elevation of 1,080 ft (see Plate 22). The surge tank isconnected to the power tunnel by an unlined, 60-ft long, ll-ft diameterstraight leg horseshoe drift tunnel. The drift tunnel intersects the powertunnel perpendicularly at station 65+59 at an invert elevation of 150 ft.Neither the drift tunnel nor the surge tank contain restricted orifices.The top l5-ft of the surge shaft will incorporate a l6-ft diametercylindrical concrete cap with a 4 ft diameter steel air vent.10.03 SELECTION OF SURGE TANK DIAMETER. Surge tank diameter was selectedto insure stabl Ilty of the system durlng the most destabilizing hydraulictransient situation, which for this system is a small load increase in thearea of decreasing turbine efficiency at a low power pool elevation andminimum hydraulic losses. The Thoma formula was used to calculate a surgetank diameter that would produce borderline stability, and the result wasverified by the WHAMO computer program (water hammer and mass ocsillationprogram). Since the required surge tank diameter will increase with anincrease in power tunnel diameter, and since contractors will over excavatethe tunnel by using the conventional drilling and blasting technique, atunnel diameter of 12.4 ft was used in calculations instead of the nominal11.0 ft tunnel diameter. The Thoma formula predicted a surge tank diameterof 6.0 ft for borderline stability, while the WHAMO program predicted a 7.5ft diameter. Based on these results, a 10-ft diameter tank was selectedyielding a 1.67 to 1.33 safety factor based on tank diameter.10.04 MAXIMUM AND MINIMUM SURGES. The maximum surge was determined usingthe WHAMO and MSURGE computer programs simulating a full load rejectionfrom blocked turbine output of 47,000 hp to 0 hp in 3.5 s (closure ratefrom full gate is 5 s). Maximum reservoir elevation of 1,022 ft, aneffective tunnel diameter of 12.4 ft, and minimum hydraulic losses wereassumed. The maximum WSEL in the surge tank was calculated to be 1,074 ftby WHAMO and 1,076 ft by MSURGE. The minimum WSEL was determined at 765 ftby using the WHAMO program simulating a wicket gate movement from closed tofull open in 5 s with a minimum power pool elevation of 820 ft, maximumhydraulic losses, an effective tunnel diameter of 12.4 ft and tailwaterelevation of 11.4 ft. These conditions correspond to a load demand at theturbine ranging from 0 hp to 35,000 hp.10-1
10.05 SYSTEM WITHOUT A SURGE TANK. Due to significant expense ofconstructing a surge tank, a hydraulic analysis was performed to determinethe feasibility of building the project without a surge tank (seeFigures 18 and 19 in Hydraulic Appendix B2). The analysis showed that thepolar moment of inertia (WR2) of the turbine/generator would need to beat least 2,106,000 lb-ft2 to provide adequate governing stability of thesystem without a surge tank, whereas, the maximum WR2 which a generatormanufacturer can provide is only 1,550,000 lb-ft2 for the Crater Lakesystem. This concept was then dropped from further consideration.10.06 SURGE TANK LOCATION. Based on roak cover criteria alone, the surgetank could be connected to the final rock trap at station 67+50 but wouldneed to be inclined about 10 degrees to daylight at the design elevation of. 1,080 ft. Since an inclined shaft would be more difficult and more costlyto construct than a vertical shaft, a sensitivity study was conducted usingWHAMO to determine the variations in surge tank water surface elevations,water hammer, and stability with the surge tank at various locations in thetunnel. The results are as follows:TABLE 10-A.SURGE TANK LOCATION TRANSIENT CHARACTERISTICSSta 65+59Surge Tank LocationSta 67+50 Sta 68+30- If'Diameter of tank atIncipient Stability 7.5 7.3 8.0Max. WSEL in Tank 1,074 1,075 1,075Max. Piez. Elev atTurbine 1,263 1,256 1,253Min. WSEL in Tank 765 764 764Min. Piez. Elev atTurbine 597 598 599Min. Gate Shaft WSEL 810.7 810.8 810.8The upstream location (station 65+59) results in a slightly lower maximumWSEL in the surge tank (1 ft) with an accompanying increase of 7 ft in waterhammer at the unit, which is not significant. Based on surface topoinformation available at this time, construction of a surge tank at station67+50 or 68+30 would require an inclined shaft to gain the necessary heightto contain the maximum surges expected. Inclined shafts are more costly toconstruct than vertical shafts. Therefore, station 65+59 was chosen as thelocation to avoid the increased costs associated with building an inclinedsurge tank. The location of the surge tank will be finalized duringpreparation of plans and specifications when more accurate topo informationis available for the area.(Note: The major design effort was for the surge tank located at station67+50 and Plates B3 through B17 in the Hydraulic Appendix reflect thislocation. )10-2
SECTION 11 - PENSTOCK11.01 GENERAL. The penstock profile is shown o~ Plate 3. The 6-ftdiameter steel penstock begins at the tunnel plug and continues at adownward grade of 12.437 pct to near the powerhouse. The penstock ;s 903ft long and is supported on saddles.11.02 SUPPORTS AND ANCHORAGE. The penstock is an unstiffened steel pipesupported by steel ring girders and concrete saddles. Ring girders arewelded around the penstock at each support to prevent distortion of thepenstock and to maintain its ability to act as a beam. The maximumdeflection of the penstock between supports is limited to 1/360 of thespan. The ring girders are attached to the concrete supports on eachside o"f the penstock by direct ·bearing. The concrete for supports has anflc = 6,000 psi. The supports and saddles are designed to resist seismiczone 4 earthquake forces due to the close proximity of the project toseismic zone 4.11.03 LONGITUDINAL LOADING. There is a sleeve-type expansion jointdownstream of the tunnel plug to accommodate movements due to thermal andseismic forces. The penstock will be fabricated in 40-ft long sectionsand field welded, starting from the powerhouse end and proceedingupgrade. Each section w'ill be allowed to cool to the surrounding tunneltemperature before the next section is welded. With this sequence,internal stresses associated with temperature differential will be keptto a minimum. Because the penstock is located deep in the mountain wheretemperatures are almost constant, the temperature differential used fordesign is 20°F. All longitudinal forces, including seismic, are resistedat the concrete thrust block upstream of the powerhouse. Attachmentsbetween ring girders and concrete supports have a slotted hole in thelongitudi~al direction. Contact surfaces between ring girders andsupports are lubricated to reduce frictional resistance using two layersof sheet packing with graphite grease between them. There is 71 ft ofpenstock from the thrust block to the spherical valve in the powerhousevalve room. This portion of the penstock is supported by two saddlesupports. The last 10 ft of the penstock will be a transition from 72inches to 54 inches, which is the diameter of the valve. There is asleeve-type expansion joint just downstream of the spherical valve, also.11.04 DESIGN CRITERIA. With the penstock expansion joint, the onlyloadings that effect penstock design are the maximum internal dynamicpressure, beam action between supports, and seismic forces. Designstresses for the penstock, under maximum dynamic pressures, are limitedto 25 percent of the ultimate strength or 80 percent of the yieldstrength of the steel, whichever is the lesser.11.05 STEEL SELECTION. Four types of steel have been studied for thepenstock. They are shown in Table ll-A.11-1
TABLE ll-A.PENSTOCK STEEL COMPARATIVE CHARACTERISTICST.lEe Steel Design Stresses Price ter Pound Total Weight Total CostKSI ; n Pace lbsl. ASTM AS16, lS 2.70 1 , 137,000 $3,070,000Grade 602. ASTM.AS37, 17. S 3.07 967,000 2,969,000Class 13. ASTM AS37, 20 3.13 8S6,000 2,679,000Class 24. ASTM AS17 28.7S 3.S7 630,000 2,249,000ASTM AS17 steel is the most economical steel for the Crater Lake penstock.11.06 FABRICATION AND PLACEMENT. Fabrication of the penstock will be toASME BOller and Pressure Vessel Code of 1977, Section VIIISpecifications. Plates will be curved by rolling or pressing to a 3-ftradius. The penstock will be shop fabricated into 40-ft lengths.Welding pocedures, qualifications, electrodes, weather protection, etc.,will be in accordance with the ASME Boiler and Pressure Vessel Code.Each 6-ft diameter, 40-ft long section will be positioned in place andwelded to the adjacent section. Field welds will be made in plates ofequal thickness. Longitudinal joints in adjacent sections will bestaggered by approximately 30 degrees of cylindrical arc to eliminate acontinuous seam. A coal-tar enamel coating may be hot applied by acentrifugal process to the interior surface. The steel will be cleanedby shot or grit blasting, and primed before application of the hotenamel. This process, which is covered by AWWA Standard C203, results ina very smooth glossy surface. The alternate interior coating may be avinyl system, similar to the existing Long Lake pe·nstock coating. Theexterior surface will have a coal tar epoxy coating.11.07 TESTING. Penstock steel will be supplied with Charpy V-Notchimpact values, as specified. Charpy tests will be made in accordancewith ASTM A-370 testing standards. Plates will be examined forlaminations. Consideration will be given to nil ductility tests.Nondestructive testing will be utilized during steel production,fabrication and testing of the penstock. All welds will be 100 pctradiographically inspected. EM 1110-2-3001 requires hydrostatic testingof the completed penstock to 1.S times the maximum hydrostatic pressure.Because of the extreme difference in maximum dynamic pressures whichgovern the design of the two ends of the penstock, such a test loadingwould approach the yield point at the upper end of the penstock, if ASTMA516 steel was selected. If the steel selected ;s ASTM AS17, werecommend conducting the test if the closed spherical valve is notendangered...11-2
SECTION 12 - POWERHOUSE12.01 GENERAL. A 34,500 KVA nameplate rated generator, turbine,spherical valve, and appurtenances will be installed in the skeleton bayof the existing underground powerhouse. The spherical valve permitsisolation of the turbine for maintenance and emergency shutdown in theevent of governor failure. For a detailed discussion of the approvedpowerhouse completion and equipment installation associated with theCrater Lake power unit, see DM 24, Underground Powerhouse - Crater Lake,dated December, 1973. The plans and specifications for the powerhousecompletion and supplemental supply contracts have been completed for the<strong>Alaska</strong> District by the Hydroelectric Design Branch of the North PacificDivision.12.02 CHANGES FROM APPROVED POWERHOUSE PLAN.A. Turbine. A new turbine selection study, dated April 1984, wasperformed for the <strong>Alaska</strong> District by the Hydroelectric Design Branch ofNPD and forwarded to higher authority for review. The significantchanges in the design are summarized below:Minimum Net HeadGuaranteed Output @ Min. HeadRated Net HeadGauranteed Output at Rated Net HeadMaximum Net HeadSynchronous SpeedDM 24777 ft37,000 hp947 ft47,000 hp1,012 ft514 r/minDM 26788 ft35,000 hp945.5 ft47,000 hp990.5 ft600 r/minThese changes are a result of the increase in tailwater elevation,improvements in turbine design that have been developed since DM 24 waspublished, and more accurate hydraulic information. Estimated turbineperformance curves are presented in the turbine selection study. Theturbine runner will be made of cast stainless steel, ASTM A743, GradeCF-8C. The wearing rings will be made of aluminum bronze, ASTM B148,Grade C. Wicket gate seals will be made of corrosion resisting metal,dissimilar from adjacent materials to prevent galling. Other details ofthe turbine installation and selection remain as stated in OM 24.B. Governor. The turbine governor will be as described in DM 24,Part II, Section 4.03 except that a three term (Proportional-IntegralDerivative) electro-mechanical governor will be employed. Possiblestability problems noted in water hammer studies indicated that the addedspeed of response and stability of the electro-mechanical governor waswarranted.C. Generator. The main power equipment will be as described in DM24, Part II, Section 5 except as noted here. The generator nameplatewill be changed to 34,500 KVA, 75°C stator temperature rise with nooverload rating, in accordance with ANSI c50.12-1982. The speed will be600 r/min to match the revised turbine speed. The minimum specifiedWR2 of the rotating parts of the generator will be 1,050,000 lb-ft2,which is sufficient to limit the turbine overs peed on load rejection to50 pct with a 5s gate closing time.12-1
D. Transformer. The power transformer will be rated at 34,500 KVAwith a 65°C temperature rise, as current standards no longer allow a55°C/65°C rating.E. Remote SUBervisory Control.relay design for nit No. 3 wlll beUnderground Powerhouse-Crater Lake,as follows:Powerhouse control, metering andidentical to that described in OM 24,Section 6, dated December 1973 except(1) "The remote control s~heme described in OM 24, Part I,6.02b. for Units 1-2, will be replaced with a new microprocessor andCRT-based modern SCADA system. The current system is technologicallyoutdated, and expansion parts necessary to incorporate Unit No. 3 perOM 24, Part II, 6.01b are not available.(2) The annunciation system described in OM 24, Part I, 6.05will be expanded to provide additional critical alarms on a new locallighted window annunicator as well as to the existing operations recorderand SCADA system. Additional lighted windows and annunciator controlswitches are necessary to improve the ability of the local plant staff totrouble shoot equipment failures and operate the plant upon operationsrecorder failure.(3) A load frequency controller with associated time base willbe added to replace the aging existing Unit No.1 and 2 controllerlocated at the Juneau substation control room. Operational andmaintenance problems with the existing controller dictate relacement withnew equipment.12.03 PROJECT FEATURE OPERATIONAL CONTROLS. In addition to the standardcontrols required to operate the powerhouse equipment, controls andpanels will be installed in the powerhouse for monitoring and controllingsome of the remote project features.A. Hydraulic Instrumentation. The powerhouse and substation willinclude an instrumentation panel that can translate incoming informationfrom differential and standard pressure transducers located at variouspoints of the power tunnel, penstock, and powerhouse. (See Section 13for a detailed discussion of instrumentation.) The instrument panel hasthe following readout capabilities:(1) Reservoir surface elevation;(2) Pressure differential between reservoir surface andpiezometer ring No.1;(3) Pressure head just upstream of the turbine;(4) Pressure differential between reservoir elevation and apoint just upstream of the turbine;(5) Pressure differential between piezometer rings 1 and 2; and12-2
(6) Other miscellaneous readouts.B. Gate Structure Controls. The following equipment will beinstalled in the powerhouse and substation to provide remote operationcababilities of the gate structure (see Section 8 for a detaileddiscussion of the gate structure):(1) Two control panels equipped with up, hold, down and offpositions, one each for the hydraulically-operated slide gate and thebulkhead hoisting cable;bulkhead;(2) Two position indicators, one each for the slide gate and(3) Remote control automatic transfer switch for the primaryfeeders from the powerhouse to the gate structure; and(4) Telephone communication to the gate structure from thepowerhouse only.12.04 "MACHINE SHOP. The existing underground powerhouse facilities willbe expanded by providing an underground machine shop adjacent to theexisting powerhouse erection bay. See Plate 6 for orientation. The newmachine shop (described in detail in Section 15) is equipped withheating, ventilating, lighting, and floor drain facilities that are tiedinto the existing corresponding facilities servicing the powerhouse.12.05 TAILRACE AND TAILWATER ELEVATIONS. The tailrace is currentlyequipped with "Amil Automatic Gates" (a form of Tainter Gate) thatmaintain tailwater elevations between 11.0 ft and 12.5 ft for operationof an <strong>Alaska</strong> Department of Fish and Game (ADFG) hatchery. The <strong>Alaska</strong>Power Administration (APA) has indicated that ADFG will be assessed anannual charge in the future for repayment of lost potential energy due tothe high tailwater elevations. ADFG has decided that the hatchery willbe able to function with lower tailwater than previously maintained.Ultimate tailwater elevations at this time are uncertain, but regardlessof what may happen in the future, the concrete structure that anchors theAmil Gates will remain. This structure will act as a broadcrested weirwith a sill elevation of 1.7 ft. Maximum tailwater will remain at"12.5 ft while the minimum tailwater will vary with discharge. Figure 4in Hydraulic Appendix B shows the expected minimum tailwater elevationsfor various discharges. The maximum discharge through the tailrace willbe approximately 1,640 ft3/s with the two Long Lake units operatingconcurrently with the new Crater Lake unit.12-3
SECTION 13 - HYDRAULIC INSTRUMENTATION13.01 GENERAL. This section describes the, hydraulic instrumentationrequired for the lake tap and power conduit. Design of the instrumentationrequired will be detailed and refined during preparation of plans andspecifications with the help of the Waterways Experiment Station. Inaddition, the temporary lake tap instrumentation will be designed with theassistance of a consultant with expertise in lake taps. Plates 11 and 12show the location of the lake tap instrumentation, and Figure 27 inAppendix B2 shows a schematic of the permanent conduit instrumentation.13.02 <strong>LAKE</strong> TAP. Instrumentation for the lake tap blast will perform thefollowing functions:A. Water Surface Elevation. Water surface elevation in the primaryrock trap is important because it determines the size of the air cushionwhich reduces the blast forces against the service gate. This measurementwill help to assure a successful lake tap blast.B. Blast Force Measurement. Pressure cells will be located:(1) Directly under the lake tap at approximately Station 7+70.This pressure cell will probably be destroyed when blast rubble strikes it,but the maximum blast pressure information will have been recorded by thattime. Exhibit 4 indicates that the maximum blast pressure occurred 0.25 safter the final blast at the Ringedalsvatn lake tap.(2) Midway between the lake tap and the gate structure atapproximately station 10+90.(3) At the service gate at approximately station 14+05.C. Surge in Gate Shaft. The initial flow of water into the lake tapand tunnel will result in a surge at the gate shaft to approximatelyelevation 1040. Instrumentation will be installed in the gate shaft torecord the elevation of the surge and the time at which it occurs.D. Monitoring and Recording. The water surface elevation in theprimary rock trap, blast pressures and gate shaft surge height will all bemonitored and recorded by a temporary instrument panel outside the gatestructure access adit portal. Plates 11 and 12 show the location of thelake tap instrumentation:13.03 TUNNEL.A. H~draulic Losses in Upper Tunnel. Calculations of hydraulic lossesthrough t e prlmary trashrack, orlflce, and the primary rock trap areimportant for aiding in determination of major blockages that might occurat the primary trashrack and also for use in any future designs of asimilar nature. Instrumentation in this reach of tunnel consists of twoindependent bubbler gages, the first of which will monitor lake surfaceelevations and the second which monitors pressures in the power tunnel atapproximately station 13+00.13-1
(1) Bubbler Gage #1 - This gage monitors lake elevations between820 and 1019. It is located in the lake access adit close to the gateshaft and is connected to the lake by a drilled hole approximately 625 ftlong that intersects the lake bottom near the tap at approximatelyelevation 800.(2) Bubbler Gage #2 - This gage is located in the lake access aditclose to bubbler gage #1. It monitors pressure in the power tunnel justupstream of the gate structure transition. The gage is connected to thepower tunnel by a vertic~l drilled hole. The point at which the drilledhole intersects the tunnel is fitted with a type of orifice that assuresdynamic heads in the tunnel have only minimal effect on the gage readings.The location of the piezometer orifice is not ideal (reference 4 indicatesthat there should be a straight length of 25 tunnel diameters upstream and10 tunnel diameters downstream from a piezometer to assure full developmentof the boundary layer) but because of low velocity heads in the tunnel anyresultant errors from the imperfect location are considered to be small.The air for both bubbler gages is supplied by a small compressor located inthe lake access adit. The compressor receives its power from the mainpower supply line. This arrangement will require less maintenance thanusing bottled nitrogen to supply air to the bubbler gages.(3) Hydraulic Losses - A pressure differential transducer isconnected to bubbler gages 1 and 2. The pressure differential transducerregisters the pressure difference between the two gages. The differencereflects hydraulic losses occurring in the power conduit as flow movesthrough the primary trashrack, orifice, primary and secondary rock traps,emergency tunnel plugs, and initial portions of the tunnel. Using standardformulation, losses through the tunnel can be calculated with reasonableaccuracy. Losses through the secondary rock trap are small and can beestimated with minimal error. When these losses are subtracted from thetotal losses as measured by the pressure differential transducer, theremaining losses represent those caused by the trashrack, orifice, andprimary rock trap. Signals from the transducer are sent to monitoringpanels in the powerhouse and substation.(4) Gate Shaft - A staff gage is located in the gate shaft tomeasure the complete range of water elevations occurring during operation.This gage will be for general utility and will also be useful as a roughcheck on the readings being produced by the two bubbler gages.(5) Calibration and Monitoring of System - During normal periodsof operation, head differential between the lake surface and gage #2 (atstation 13+00) will be established for various discharges. If excessiveclogging of the trashrack occurs, the head loss through the trashrackincreases. This increase in head loss will be observed at the powerhouseor substation by project personnel and appropriate action will be taken.Monitoring of the upper tunnel hydraulic losses will take place on acontinuous basis..'•13-2
B. Hydraulic Losses in Lower Tunnel. Consideration was given toinstalling 1nstruments 1n the lower power tunnel (gate structure to surgetank) to determine hydraulic losses in that reach of tunnel. ~is conceptwas not pursued when we found that costs for a good system were high whencompared to the problematic results that would be obtained.13.04 <strong>LAKE</strong> SURFACE ELEVATION. Monitoring of the lake surface elevation isimportant to assure that the lake elevation does not fall below the minimumpool elevation of 820 and also to help in determining if any excessive headloss is occurring at the primary trashrack and rock trap. The lake surface~levation is monitored by bubbler gage 1, which is connected to an absolutepressure transducer (in addition to the differential transducer mentionedabove). This transducer will send signals to the powerhouse andsubstation. Absolute pressure transducers are available that can transmitreadings to within 0.25 pct of the total range of the transducer (in thiscase, the range is approximately 0-200 ft). With this arrangement lakeelevations are known to an accuracy of approximately 0.75 ft.13.05 PRESSURE MEASURING DEVICES IN LOWER TUNNEL AND POWERHOUSEA. Surge Tank Water Surface Elevation. A pressure measuring device islocated in the surge tank to monitor water surface elevation. This deviceconsists of l-inch diameter pipe that runs from near the bottom of thesurge tank to the downstream (dry) side of the access tunnel plug. At thatpoint the pipe is connected to a pressure transducer. The signal from thetransducer is sent to the instrument panels in the powerhouse andsubstation. Monitoring surge tank water surface elevations will allow usto check the stability of the system and the accuracy of computer programWHAMO, which was used to size the tank.B. Tunnel Pressure at the Tunnel Access PlUg. The downstream end ofthe final rock trap dra1n p1pe 1S f1tted w1th a lind flange with athreaded fitting. This threaded fitting can be utilized for either apressure gage or an absolute pressure transducer if the need arises at somefuture time to monitor the pressures in the tunnel at the access plug.C. Powerhouse. A threaded fitting is being made available in thepenstock just upstream from the spherical valve to allow connection of anabsolute pressure transducer or pressure gage. This pressure data ,can beused to assist in calculating net heads at the turbine and approximatetotal head losses through the full length of the power conduit.D. Penstock and Spiral Case. Two sets of Gibson test piezometer tapsare located in the penstock upstream of the spherical valve and one set ofnet head piezometer taps are located on the upstream end of the spiral casefor determining flows in conjunction with Gibson Efficiency testing. Thenet head piezometer taps can be used at any time during the life of theproject. One set of Winter-Kennedy piezometer taps will be installed onthe spiral case some distance downstream of the net head piezometer taps.While the Gibson Efficiency tests are proceeding, pressures will be read ongages connected to the Winter-Kennedy taps so that their readings can becalibrated for determining turbine flow at any future time by theWinter-Kennedy method.13-3
•13.06 MAINTENANCE. The various instruments and appurtenant gear havelimited life spans. Therefore, various parts of the above mentioneddevices will have to be replaced, and drill holes will have to be blownclear, from time-to-time. The bubbler gages in the lake adit will beaccessible for a portion of the year and the various maintenance routinescan be undertaken at those times. The required maintenance for the bubblergages is:A. Replacement of differential and absolute transducers.B. Repair or replacement of the compressor supplying air to the bubblegages.C. Blowing out of the drill holes or tubes extending to the lake andthe power tunnel and surge tank.All instrumentation located downstream of the tunnel access plug or in thepowerhouse can be replaced at convenience.13.07 SIGNAL TRANSMISSIONS. Signals from the various transducers will besent to the powerhouse and substation by a carrier wave system imposed onthe power supply line that extends between the powerhouse and gatestructure.13-4
14.01 SOURCES.SECTION 14 - MATERIAL SOURCES & DISPOSAL SITESA. General. The Crater Lake phase of the Snettisham HydroelectricProject Wl I I require approximately 13,500 yd3 of concrete aggregate, 2,700yd 3 of granular material and 500 yd 3 of unclassified borrow material.The unclassified and granular materials are required primarily for embankmentsand surfacing of the Crater Cove access road~ The concrete aggregateis required during the latter stages of construction for the tunnel lining,gate structure and ancillary features. Locations identified as Crater Coveand Bear Pit were sampled as material sources for the Crater Lake phase ofthe Snettisham Project (see Plate 45 for locations). The granular material,unclassified material, and concrete aggregate will be obtained from theCrater Cove pit. Blend sand for the concrete will be obtained from Bear Pit.In-depth analysis of the local material sources is provided in SupplementNo.1 to Design Memorandum No. 26, Materials Investigations dated November1983, Supplement No.1 to Design Memorandum No.7 dated August 1967, and"Snettisham Dam Mass Concrete Investigation" dated March 1971.B. Bear Pit (known as Glacier Creek, Borrow Area No.2, Sand Source B,Sand Source D for the Long Lake phase). A substantial deposit of sand existsat this site. The source was used as a blend sand source during constructionof the Long Lake phase. It is estimated that 30,000 yd3 of material areavailable at this location. Access between the pit and the constructionsites will be by the existing road. This source was sampled at 3 locationsusing hand-dug pits. Laboratory and microscopic (petrographic) examinationsof the material show it to be acceptable for concrete aggregate and to besubstantially the same as the materials used for previous construction.C. Crater Cove (also known as Borrow Area No.1). The Crater Coveborrow source lS a moderately extensive deposit of sand and gravel fromCrater Creek outwash. This was used as the primary source of concreteaggregate during the construction of the Long Lake phase. It is estimatedthat 110,000 yd 3 of material are available at this location. Access willbe via the existing Crater Cove access road. Upgrading is required to theaccess road before full-scale hauling can begin. This source was sampled at5 locations using backhoe-dug test pits. Laboratory and microscopic(petrographic) examinations, which are in agreement with the tests made onsamples from the same source prior to Long Lake construction, show thematerial to be acceptable for use as concrete aggregate.D. Other. There is a supplier of Type I cement located in Anchorage,<strong>Alaska</strong>; however, there is no local source of pozzolan. Portland cement,blended hydraulic cement, and pozzolans, if used by the contractor, willlikely be obtained in the continental United States as shipping distancesare about equal to that of Anchorage and the established shipping routes toJuneau are from the west coast of the continental United States. Since thematerials proposed to be used as concrete aggregates for this phase of theSnettisham Project are from the same sources as used for Long Lake, and areshown by test to be substantially the same material, no further studies ofmix design, processing studies, temperature studies or freeze-thaw tests areplanned. The same basic mix design will be used for the Crater Lake phaseas was used for the Long Lake phase.14-1
14.02 DISPOSAL SITES. Two disposal sites will be utilized. See Plate 45for locations.'"..14-2
SECTION 15 - PERMANENT FACILITIES15.01 GENERAL. The existing permanent facilities include an airfield, aboat basin and dock, and living quarters and operational buildingsutilized by <strong>Alaska</strong> Power Administration (APA) personnel. In addition tohydrore1ated facilities, there is a fish hatchery and three single-familyunits operated and maintained by the <strong>Alaska</strong> Department of Fish and Game(ADFG). Plate 1 shows the location and configuration of the permanentfacilities.15.02 BARGE ACCESS.A. General. A barge basin and entrance channel were constructed in1967 for the Long Lake development of the Snettisham project. The lOO-ftwide channel and the 300-ft by 500-ft barge basin were originally dredgedto minus 15 ft and minus 25 ft, respectiveiy. All side slopes were setat 1V:6H, except the north end of the basin was 1V:10H. The 76-ft byl56-ft dock was constructed on timber piles to a deck elevation of plus14 ft. The dock area side slope, which is lV:2H, is protected by a 3-ftthick layer of quarry stone riprap that has slumped somewhat.B. Usability. The most recent survey of the channel and basinconditions was performed in March 1982 and shows that a stretch ofchannel approximately 3,000 to 4,000 ft south of the dock has silted into about elevation minus 12 ft. Minimum periodic dredging has beenperformed by APA personnel to maintain passage through this segment nfthe channel. With these minor efforts, the channel remains usable duringnormal and high tides; therefore, there are no plans to perform majordredging at this time.15.03 AIRFIELD. The eXisting airfield at Snettisham is a gravelsurfaced runway 100 ft wide and 2,500 ft long with a 1,000-ft overrun.This airfield will provide primary commuter access to the project. Thereare no planned airfield improvements as part of this design.15.04 <strong>CRATER</strong> COVE ACCESS ROAD. Borrow material will be obtained fromand waste material will be stockpiled in the existing Crater Cove borrowarea that was developed during the Long Lake phase of the SnettishamProject. Access to the borrow and waste area will be provided byupgrading the existing access road to the area. The access road will beupgraded along its present alinement utilizing material excavated fromthe power conduit and granular and unclassified borrow from Crater CovePit. Culverts will be placed under the road to maintain discharge offresh water from Crater Creek to spawning areas identified by the U.S.Fish and Wildlife Service. The access road will be retained as permanentaccess to the Crater Cove borrow area.15.05 WASTEWATER TREATMENT AND DISPOSAL.A. Existing Facilities. Presently, the wastewater generated by APAand ADFG personnel recelves primary treatment from a 16,000 gal septictank. Effluent is disposed of in a leaching field that is located in theSnettisham tidal plain and is subjected to high water conditions. Thisis a constant source of maintenance and odor problems.15-1
B. Recommended Facilities. The existing 16,000 gal septic tank willcontinue to be used to treat the wastewater. A new soil absorptionsystem consisting of four seepage pits will be constructed to replace theexisting leaching field. Th~ pits will be located at the north end ofthe existing permanent facilities compound between an APA garage and ADFGhousing where they will be unaffected by groundwater conditions. A liftstation is required to pump the septic tank effluent to the recommendeddisposal site. Because the treatment and disposal system also providestreatment of the wastewater generated by Crater Lake phase constructionpersonnel, the lift station and seepage pits are designed to handle apeak population of 110 construction and inspection personnel and 20permanent personnel. The existing 16,OOO-gal septic tank will provideadequate treatment at the design level of loading.lS.06 MACHINE SHOP. The machine shop is currently located in theerection bay of the Snettisham powerhouse. As that area will be neededas a construction staging area for the powerhouse completion work, and anassembly area during the turbine and generator installation, relocationof the machine shop is required. The recommended plan is to excavate achamber of suitable size adjacent to the west end of the powerhouse andconnect it to the erection bay with a 20-ft long service tunnel. Therewill be an 11-ft wide, 80-ft long vertical sidewall horseshoe tunnel thatwill connect the machine shop with the access adit. A watertightbulkhead will be located at the intersection of the two tunnels to sealoff waterflow into the machine shop and powerhouse in the event that thepenstock should rupture. The machine shop chamber would have a concretefloor and wire mesh covered ceiling and would be provided with heating,lighting, ventilation, and drainage suitable for a machine shop. Therewill be doors at both entrances to the machine shop to confine heatwithin the shop area.lS.07 INCINERATOR. An incinerator will be installed near Bear Pitduring the Crater Lake Phase development. The new incinerator is housedin an insulated but unheated, pre-engineered metal building supported ona concrete spread footing foundation system. The building, which has aminimum floor space of lS0 ft2 for storage of materials prior toburning, is designed to withstand a snow load of 2S0 1b/ft2, a windload of 100 mi/hr, and a seismic zone 3 rated earthquake. Theincinerator is to be smokeless and odorless and certified for Federalfacilities. The capacity of the incinerator is 200 1b/hr. A SOO-ga1 oilstorage tank is located adjacent to the metal building and contains thefuel source for firing the incinerator. The incinerator, which is beingconstructed for contractor use during construction of the Crater Lakephase, will be turned over to the <strong>Alaska</strong> Power Administration forpermanent use.lS-2
SECTION 16 - CONSTRUCTION FACILITIES16.01· GENERAL. As stated in OM No. 23, "First Stage Development ~lan,Crater Lake," the resident engineer's office, dormitory, and concretetesting lab provided for the Long Lake phase construction were planned forcontinued use as Government camp facilities during Crater Lake phaseconstruction. The contractor camp facilities were to be retained to housethe construction personnel for the Crater Lake phase as well. Uponcompletion of the Crater Lake phase construction, the Government campfacilities were to be turned over to the'<strong>Alaska</strong> Power Administration (APA)as their permanent operating facilities. Due to delay in construction ofthe Crater Lake phase, the Government camp facilities were relinquished toAPA and the contractor camp facilities were removed following the Long Lakephase of construction. All facilities are now fully utilized by the APA.This section will describe the recommended plan for providing constructionfacilities for Crater Lake phase construction.16.02 RECOMMENDED PLAN.A. General. The contractor and Government camp facilities are locatedin the general area indicated on Plate 1. The two camps are estimated tohave a combined peak population of 110 persons. The contractor camphousing facilities will be removed upon completion of Crater Lake phaseconstruction, but the Government facilities and utilities provided toservice the camp area will be kept intact for future use.B. Resident Engineer Facilities. The contractor will provide theGovernment with separate office and living quarters. The office quartersare contained in a single unit with a floor area of approximately1,000 ft2. The living quarters will comfortably house up to 10Government employees. The office and living quarters will be provided withthe necessary utilities to make them self-sufficient. In addition, thecontractor will provide the office with a communication link to the <strong>Alaska</strong>District office.C. Util ities.(1) Wastewater Collection, Treatment, and Disposal - A wastewatercollection system will be provided by the contractor installing the campfacilities. The collection system consists of 6-inch diameter services and8-inch diameter mains which transport the wastewater to a centrally locatedlift station. The lift station then transmits the wastewater to theupgraded permanent facilities for treatment and disposal. See Section15.05 for a discussion of the recommended design for upgrading of thepermanent wastewater treatment and disposal system.(2) Water Supply - Water is supplied to the construction camp areaby connecting a 6-inch diameter main to the existing water distributionsystem near the APA living quarters. The camp area distribution networkwill be dependent upon the camp layout chosen by the contractor. Theexisting water supply system consists of a 30 gal/min well and a 45,000-galstorage tank located on a hillside above the APA facilities.16-1
(3) Electricity - Electricity is provided to the camp area byeither connecting to the existing distribution network, if capacity isavailable, or by installing a new feeder line from the switchyard. If anew feeder line is installed, a transformer will also be required at thecamp site.16-2
SECTION 17 - OPERATION AND MAINTENANCE17.01 GENERAL. Responsibility.for this project will be transferred fromthe Corps of Engineers to the <strong>Alaska</strong> Power Administration (APA), Departmentof <strong>Energy</strong>, for operation and maintenance when construction is complete.The APA will utilize its existing Snettisham facilities and maintenancepersonnel servicing the Long Lake units to provide maintenance for theCrater Lake unit. No additional operation or maintenance staffrequirements are foreseen by APA as a result of the addition of the CraterLake unit to the hydropower facilities.'17.02 OPERATION, MAINTENANCE AND REPLACEMENT COSTS. As a result of thisproject, the annual operation and maintenance costs for the Snettishamhydroelectric facility may increase by an estimated $235,000, and theannual replacement costs could increase by approximately $15,000. Thetotal annual operation, maintenance and replacement costs for theSnettisham facility are estimated to be $1,000,000 upon completion of theCrater Lake phase of development.17 -1
SECTION 18 - ENVIRONMENTAL CONSIDERATIONS18.01 GENERAL. The environmental considerations section nf OM 23 providedan overall review of the Crater Lake environment. More recently, thereport titled, "Snettisham Project, <strong>Alaska</strong>, Environmental Impact Statement,Supplement 1", dated April, 1981, provided a more detail description of theexisting ecosystems and environmental resources in the project area. Anenvironmental assessment (September 1983) addressed revisions in projectplans.18.02 IMPACTS OF PROJECT CONSTRUCTION. The recommended plan has thelowest potential for environmental impact of any of the feasiblealternative plans evaluated. The impacts that cannot be avoided are thoseassociated with the lessened water flows to the lower reaches of CraterCreek, possible changes to the salinity regime of Crater Cove, the effectsof increased human activity on local animal populations duringconstruction, minor impacts associated with the exposure of soil toerosion, and changes in the visual quality of the project site which is inthe Tongass National Forest. The potential for damage to intertidal plantsis low, particularly with the adopted plan which does not allow intertidalplacement of project features or tunnel tailings, with the exception of amaximum of 50,000 yd3 of fill covering a maximum of 1 acre of intertidalwetlands for repair of the Crater Cove access road. The constructionactivity will not displace wildlife from any identified critical habitat,but could reduce the numbers of marine mammals (principally seals), ducks,and other waterfowl in and near Crater Cove during construction. Humancontact with black bears in the vicinity of the Snettisham powerhouse islikely to increase during construction with a concomitant increase indanger to both bears and humans. Disposal of excavated tunnel material atthe upper adit will cover a small area of alpine tundra and may slightlyincrease sedimentation ~nd erosion onto the slope below.18.03 IMPACTS OF PROJECT OPERATION. The loss of most of the streamflow tothe lower reaches of Crater Creek will increase the probability of freezingor dessication mortality to intragravel salmon fry and to juvenile DollyVarden overwintering in the stream outlet. The potential area of salmonspawning habitat is comparatively small (estimated at about 500 ft2; U.S.Fish and Wildlife Service, 1982). With the large and rapid changes insalinities and temperature that occur with each tidal cycle in Crater Cove,the existing intertidal plant communities are tolerant to salinity changeslikely to occur in the cove as a result of diverting Crater Creek forproject operation. Fluctuations of the water surface elevation in CraterLake will not adversely impact any significant biological resource.18.04 MITIGATIVE MEASURES. Measures taken to reduce the impacts of thisproject on the environment include:(1) Use of existing facilities to the maximum extent feasible;(2) Selection of alternatives that allow access to the powerconduit through a main access adit utilizing existing roads instead ofthrough multiple adits requiring new road construction;18-1
(3) Beneficial use of tunnel tailings for construction of thestaging area and helicopter pad at the upper adit and for improvements tothe Crater Cove haul road;(4) Placement of culverts under the Crater Cove haul road, whereshown on Plate 1, to deliver the remaining Crater Creek streamflows toanadromous fish spawning habitat;(5) Minimize Crater Creek streamflow seepage through the road bedof the Crater Cove haul road, thereby maintaining the maximum potentialflow over the spawning redds; and,(6) Use of on-land domestic wastewater disposal facilities.(7) Slope protection on the seaward slope of the access road toprevent erosion into the tidelands.In addition, measures to mitigate losses of visual quality, and torevegetate and stabilize soil exposed by construction or deposition ofexcavated material are being developed jointly by the <strong>Alaska</strong> District andthe U.S. Forest Service in accordance with a Supplemental Memorandum ofU~derstanding between the two agencies. The jointly developed plans willbe titled "Detailed Action Plans" and will contain detailed informationregarding the materials and methods to be used.18.05 COMPLIANCE WITH ENVIRONMENTAL REQUIREMENTS. The <strong>Alaska</strong> District hascompleted an environmental assessment (september 1983) as required by theNational Environmental Policy Act and the evaluations required by Section404(b) of the 1977 Clean Water Act. In addition, a Certificate ofReasonable Assurance will be obtained from the State of <strong>Alaska</strong> as requiredby the Clean Water Act. The project is consistant with applicable CoastalZone Management guidelines. The contractor must obtain a State Title 16Anadromous Fish permit if required. Detailed Action Plans will bedeveloped with the U.S. Forest Service prior to construction completion, asthe need arises. Substantial deviations of the project from therecommended plan presented in this Design Memorandum, particularly if theyinvolve disturbance of or placement of fill in tidelands or subtidalwaters, may require additional environmental evaluation and documentation.Deviations also could require modification of the Detailed Action Plans.Contractors will be notified that fill is not to be placed below meanhigher high water except for repair of the borrow access road.18-2
SECTION 19 - CONSTRUCTION SCHEDULE19.01 GENERAL. The project construction schedule extends overapproximately a 42 month period. Power-on-line for the Crater Lake phaseof this project can be achieved as early as February 1988. The criticalelements of the 9 separate contracts needed for completion of this phase ofdevelopment are completion of the powerhouse and lower penstock (to permitturbine installation), turbine and generator fabrication and installation,and completion of the gate structure to allow the lake tap to be performedin the August-September time frame. The lake tap period is critical ~sthat is the time of year when Crater Lake is normally guaranteed to beice-free.19.02 CONTRACTS. The 6 major supply contracts and 3 major constructioncontracts planned for this phase are listed below. The award dates givenare significant if the February 1988 power-on-line date is desired to bemet.TABLE 19-A.CONSTRUCTION CONTRACTS SCHEDULEA. Crater Lake Phase 1* Award: September, 1984B. Turbine Award: February, 1985C. Lake Tap Site Clearing Award: May, 1985D. 13.8 kV Switchgear Award: June, 1985E. Generator Award: July, 1985F. Governor Award: October, 1985G. Remote Supervisory Control Award: October, 1985H. Transformer Award: October, 1985I. Crater Lake Main Contract** Award: November, 1985* Includes initial tunneling efforts for the primary access adit and aportion of the penstock tunnel and power tunnel, and camp facilityinstallation.** Includes powerhouse completion and installation of powerhouse equipment,gate structure, trashracks, penstock, portals, and remaining excavation.19-1
SECTION 20 - PROJECT COST COMPARISONS20.01 GENERAL. This section presents a comparison of the cost estimate ofthe recommended plan to the current approved costs.20.02 -RECOMMENDED PLAN ESTIMATE OF COST. Recommended plan costs aresummarized by feature in Table 25-A. The detailed estimates shown in Table25-B list construction quantities and unit costs applied to theconstruction items for each feature of the project.20.03 BASIS FOR ESTIMATE. The majority of the unit costs used weredeveloped from bid prices of previous projects in <strong>Alaska</strong>. Adjustments weremade to the bid prices after comparison of site accessibility, prevailingwage rates, equipment ownership and operation expense, and transportationcosts. For those items for which there was no bid price informationavailable, unit prices were developed using more detailed estimates ofproduction rates, wage rates, and equipment operation costs. Costs for theturbine, generator and other powerplant equipment were furnished by theHydroelectric Design Branch of the North Pacific Division.20.04 COMPARISON OF RECOMMENDED PLAN ESTIMATE AND CURRENT APPROVED COSTS.A. General. The latest approved Project Cost Estimate PB-3 is dated7 April 1983 wlth an effective date of 1 October 1983. These costs arebased on the recommended plan in OM 23, dated December 1973. The costestimate for the recommended plan and the latest approved PB-3 costestimate are shown in Table 20.A.TABLE 20-A. COSTS OF RECOMMENDED PLAN ANDLATEST APPROVED COSTS ($1,000)Cost Recommended Latest Approved CostAcct Plan EstimateNo. Feature Sep 84 Base Oct 83 Base04. Dam 36,975 35,977.4 Power Intake Works (36,975) (35,977)07. Power Plant 7,078 9,771• 1 Powerhouse (1,475) (703 ).2 Turbines and Generators (4,411) (6,362).3 Switchyard Accessoryand Misc. Equip. ( 1 , 166) (987).8 Transmission Plant (26) (1,719)08. Roads and Bridges 0 3,49319. Buildings, Grounds,Ut i1 it i es 420 32920. Permanent Operating Equip. 0 40830. Engineering and Design 6,232 5,52731. Supervision andAdministration 4,020 3,33250. Construction Facilities 3,770 0TOTAL COST, <strong>CRATER</strong> <strong>LAKE</strong>DEVELOPMENT 58,495 58,83720-1
B. Differences.(1) Power Intake Works - The recommended Power Intake Works is$998,000 more than the latest approved cost estimate. The entire PowerIntake Works, which includes the lake tap, power tunnel, penstock, gatestructure, surge tank and access adits, has been redesigned since DesignMemorandum 23 was published. The increased cost is the result of someproject features that have been included in the recommended plan but werenot present in the OM 23 plan. These include: a secondary rock trap,access adit from the gate structure to the lake, power tunnel emergencyplugs and bulkheads upstream of the gate structure, and removal ofoverburden from the lake bottom. In addition, the recommended plan has amuch higher gate structure and surge tank than those presented in OM 23.The project cost increases realized by these additional project features issubstantially more than the dollar difference between the recommended planand approved plan costs for Power Intake Works. The small differencebetween the two shown in Table 20-A is due to the fact that the rates ofinflation used to escalate the latest approved cost were in excess of theactual rates of inflation.'"(2) Power Plant - Although the recommended plan adds the cost ofconstructing an underground machine shop adjacent to the existingpowerhouse ($899,000), the cost of the power plant feature is less for therecommended plan than the costs reflected in the latest approved estimate.The main factor contributing to the higher costs of the approved estimateis the excessive rates of inflation used to/prepare the estimate,especially in association with the turbine, generator and transmissionplant.(3) Roads and Bridges - As a result of the recommended design ofthe power conduit, the access road to the gate structure and surge tank hasbeen eliminated. The cost of this item is therefore reduced from$3,493,000 in the latest approved cost estimate to zero for the recommendedplan. There are some very minor costs associated with upgrading theexisting Crater Cove access road for the recommended plan. As this workwill be accomplished with tunnel muck, the cost has been incidential toPower Intake Works.(4) Buildings, Grounds, Utilities - The estimated cost of theBuildings, Grounds and Utilities for the recommended plan is $420,000,compared to $329,000 for the latest approved estimate. The increase incost is due to better detailed information for pricing this work.(5) Permanent Operating Equipment - There will be no permanentoperating equipment supplied for the recommended plan, therefore no costsare shown.(6) Engineering and Design - The engineering costs shown for therecommended project reflect the total anticipated expenditures expected tobe required to complete the Crater Lake phase of development. ThroughSeptember 1984 approximately $4.51 million has been expended of the total.The design costs shown for the latest approved estimate reflect a figure of11 percent of the total construction costs. The reason for the increased20-2
cost is primarily due to the conductance of an unplanned in-lake geologicalexploration program in the summer of 1984, extensive changes in the surgetank and penstock design as a result of review of the November 1983 draftof this design memorandum, and the subsequent revision and reissuance ofthis design memorandum.(7) Supervision and Administration - The costs of S&A for therecommended plan is higher than the latest approved plan even though theoverall construction costs decreased. The increase in S&A is due to theincrease in overhead computed for the increase in E&D. Of the total S&Afor the recommended plan, approximately $0.47 million has been expendedthrough September 1984.(8) Construction Facilities - The latest approved estimate showsno cost for construction facilities because at the time OM 23 was prepared(basis for estimate) the plan was to utilize the facilities from Long Lakephase construction. Delay in construction of Crater Lake resulted in lossof use of the old facilities for this phase, therefore, the recommendedplan reflects a cost for reconstruction of construction facilities.20-3
SECTION 21- POWER STUDIES AND ECONOMICS21.01 GENERAL. Power studies and an economic analysis of the Crater Lakephase of the Snettisham project were last presented in OM 23 "First StageDevelopment Plan, Crater Lake" dated December 1973. The followingdiscussions update the power studies and economic analysis presented in OM23. This section describes the power market area served by the SnettishamProject, its estimated future power requirements, and how existing andplanned power sources could meet those power requirements. This sectionalso presents the power capabilities of Crater Lake and a·benefit-costanalysis based on the capabilities, estimated project costs, and the unitcosts associated with the most likely thermal alternative to Crater Lakehydro. The <strong>Alaska</strong> Power Administration (APA) report titled "Juneau AreaPower Market Analysis," September 1980, and subsequent updates, was themain source of data for describing the market area, alternative powersources, future demands, and load resource analysis. The APA report andupdates referenced above are included as Exhibits 7-13.21.02 POWER MARKET AREA. The Snettisham Hydroelectric Project is the mainpower source for Juneau, <strong>Alaska</strong>'s capital. The power market area consistsof the City and Borough of Juneau. Juneau is not presently electricallyinterconnected with any other power market areas. Power in the Juneau areais marketed by two local utilities, <strong>Alaska</strong> Electric Light and Power (AEL&P)and Glacier Highway Electric Association (GHEA). Government activitiesconstitute the major economic base for the population of 22,880 (1983).Tourism is the major industry, with fishing, transportation, forestry, andmining contributing to the balance of the economy.21.03 FUTURE POWER REQUIREMENTS.A. General. The Juneau area has had a substantial growth in the useof electrlclty for space and water heating in the past several years. Themost noteable growth has been by residentail consumers, but is significantalso for commercial, industrial, and Government customers. Historic datashows a 10.9 and 9.3 pct average annual increase in energy sales and peakdemands, respectively, from 1970-1984. The number of residential customershas increased approximately 6.0 pct annually and use per customer hasincreased approximately 2.0 pct annually during this period. The latestload forecasts developed by the APA indicate that power demands will exceedfirm hydro energy capabilities until completion of the Crater Lake phase ofthe Snettisham project. During the 1982-83 heating season local utilitieswere required to provide over 5 million kWh of diesel generated electricityto supplement energy available from hydro plants.B. Load Forecasts. The Juneau area load forecasts presented in thistext were developed by the APA. The <strong>Alaska</strong> Power Administration studied anumber of growth rates to develop the low, medium and high projectionspresented herein. Forecasts were based on current and historic climatic,economic, population, and power sales data. The wholesale price of energyfrom the Snettisham Project was recently increased 10 mills/kWh to recoverportions of project interest expense which was deferred for the initial10 yr period of project operation. The local utilities passed on the10 mills/kWh cost increase to the consumer which amounted to approximately21 -1
a 10 pct increase in retail power costs. APA does not feel the 10 pctprice increase alone would stimulate a significant effort amoung consumersto conserve energy. Each growth rate considered conservation and the trendto electric heating in new construction and conversions. Conservation isreflected in the load forecasts as a decrease in use per customer in theresidential sector, reaching 1-2 percent annually by the year 2000. Themedium projection was used in the economic analysis presented in thisreport. Regardless of which load forecast is considered, 60 to 80 pct ofthe Crater Lake output will be used the first year that power is on-line(1988), and all firm energy will be fully utilized by 1995. Table 21-Ashow historic energy and peak demands and Table 21-8 shows estimated futurepower requirements for the Juneau area. A more detailed description of theJuneau area load forecasts are presented in Exhibits 7-13.C. Existing and Planned Generation.(1) The existing and planned generating units supplying power tothe Juneau area are shown in Tables 1 & 2 of Exhibit 6. The main powersource in the Juneau area was originally hydroelectric generation. Lowcost diesel generation became available and the hydro units were abandonedor not maintained. Increases in oil prices have made hydropowereconomically attractive and the local utilities now plan to rebuild andmodernize all their hydro plants.(2) . <strong>Alaska</strong> Electric Light and Power is a private utility servingprimarily the downtown Juneau-Douglas area. AEL&P is currently upgradingits main distribution line from 23 kVA to 69 kVA. Glacier Highway ElectricAssociation is a Rural Electrification Association (REA) cooperative andservices mainly the outlying areas along the Glacier Highway. GHEA has onestandby diesel generator operated and maintained by AEL&P.D. Alternative Power Sources. Possible alternatives to the CraterLake Phase of Snettisham considered by APA include other local hydroprojects, interconnection with other utilities in Southeast <strong>Alaska</strong>, tidalpower, wind power, geothermal power, and diesel generation.(1) Hydropower - Other potential hydro sites that have beenstudied in the past by the Corps include Lake Dorothy, Sweetheart Falls,Speel River, and Tease Lake. All sites are within 2 to 6 mi of theexisting Snettisham transmission line. All sites require congressionalauthorization, and environmental assessment and feasibility studies beforeconstruction can begin. A summary of the anticipated capabilities of eachpotential hydrosite is shown on page 40 of Exhibit 6.(2) Intertie - The APA is currently studying the technical andeconomic feasibility of interconnecting the Snettisham-Juneau area withPetersburg, Wrangell and Ketchikan using a submarine DC transmissionsystem. If the intertie proves to be feasible, the entire Southeast <strong>Alaska</strong>region would have access to the most economical new power sources. Canadais studying new hydroelectric sites on the Stikine and Yukon Rivers forpossible construction during the 1990's. It is possible that a Southeast<strong>Alaska</strong> system can be interconnected with the Canadian system sometimebeyond that time frame.21-2
TABLE 21-A.JUNEAU AREA ENERGY AND PEAK DEMANDSystemNet MWh Peak MWGeneration % Annual Demand % AnnualFiscal Year MWh 1/ Increase MW Increase1970 58,266 12.49.5 1l.31971 63,786 13.810. 1 8.01972 70,255 14.97.8 4.01973 75,753 15.59.6 4.51974 83,059 16.213.9 9.91975 94,609 17.812.4 1l.21976 106,296 19.85.6 3.01977 112,197 20.48.9 14.71978 122,218 23.49.2 -1.31979 133,457 23. 17.2 13.41980 143,128 26.216.5 22.91981 166,700 32.221.7 29.21982 202,900 41.610.4 -3.61983 224,000 40.110.4 3.01984 247,400 '!:./ 41.31/ Includes AEL&P and GHEA sales and losses.2/ Estimated based on 6 months of data. APA 4/8421-3
TABLE 21-B. JUNEAU AREA POWER REQUIREMENTSEstimate of Future DemandFiscal Year Low Medium ~1984 GWh 236 237 237MW 41 41 41 ~\1985 GWh 253 254 257MW 54 55 561986 GWh 259 267 273MW 56 58 591987 GWh 267 278 288 f"'MW 58 60.3 62.51988 GWh 275 289 303pMW 59.7 62.6 65.71989 GWh 282 299 317MW 61.3 64.8 68.91990 GWh 288 307 330MW 62 67 721995 GWh 316 353 402MW 69 77 872000 GWh 349 403 485 .. ~MW 76 88 10521-4
(3) Alternative Sources - Tidal, geothermal, and wind power arepossible future power sources. However, no potential sites withinreasonable proximity to the Juneau area have been identified to date,therefore they are not considered to be realistic alternatives at this time.(4) Diesel - Diesel power plants are expected to remain the mostlikely thermal alternative to hydropower for Juneau, mainly because that isthe accepted technology for standby reserves which are anticipated to beactually used about 1 pct of the time. In addition, diesel power is themost practical alternative at this time for firm power supply if hydro andother sources are inadequate.E. Load Resource and System Cost Analyses. A series of load resourceand system cost analyses were made by ApA to examine the hydro alternativesthat would most likly be utilized in meeting future power requirements inthe Juneau area. Three cases were analyzed:(1) No new hydro projects after completion of the Salmon Creekrehabilitation.(2) Construction of Crater Lake addition followed by constructionof Long Lake Dam.(3) Construction of Long Lake Dam followed by construction of theGrater Lake addition.Each analysis assumed that no new electric heating applications would bepermitted when area demands exceeded the available hydroelectric supply.Results indicate that average system costs for Case 2 (Crater Lake followedby Long Lake Dam) were significantly lower than for Case 1 (no new hydro)throughout the 1980's and 1990's. Comparison of Case 2 and Case 3indicates lower costs for a plan adding Crater Lake first. The need foradditional hydro projects beyond the mid to late 1990's was indicated inthe analysis, with Lake Dorothy and Sweetheart projects being the mostdesirable. Figure 21-A shows estimated future power requirements for theJuneau area and the hydro resources that could meet those requirements.F. Project Repayment Studies. Snettisham Project repayment criteriawere initially established in the authorizing document (Section 204 of theFlood Control Act of 1962, Public Law 87-874) and amended by Section 201 ofthe Water Resources Development Act of 1976; Public Law 94-587. The APAprepared repayment studies to show the impact of Crater Lake and Long LakeDam on power sales and revenue requirements for the Snettisham Project.All of the repayment studies allow for inflation in operation andmaintenance costs through 1984. Actual rates will of course reflect anyinflation beyond that date. Study results are as follows:21-5
550FIGURE 2JUNEAU LOADS AND RESOURCESr°,)I-'IO'l<strong>LAKE</strong> DOROTHY500 - LOW GROWTH (150 GWH)F----- MID-RANGE GROWTH/'I --- HI GROWTH/'R/'G----e HYDRO RESOURCES/'M 450/'/'E/'/'N/'E /'400R LONG <strong>LAKE</strong> DAM /'G(57 GWrj),' /'/'Y",-",-350",-<strong>CRATER</strong> <strong>LAKE</strong> ",-(99.9 GWH L/,'G ",-300 ,WH",- , ,/" .,' , ,EXISTING HYDRO250 (216 GWH)ffi-----iJ) SALMON CRE K (7. 5 GWH)2001984 1986 1988 1990 1992 1994 1996 1998 2000FISCAL YEAR
Repayment Assumption1. Existing project (without additions of .Crater Lake and Long Lake Dam): (assumptionsare identical to official FY 1979 APA powerrepayment study, except for slightly highersales figures in the early 1980's).Averagerate, 1986 to end'of repayment period26 mills per kWh2. Existing project with addition of Crater 23.5 mills per kWhLake (1986) and Long Lake Dam (1988) (1980 costs).3. Same as assumption 2, but with 35 pct inflationof construction costs for Crater Lake and LongLake Dam.26.5 mills per kWh4. Same as assumption 2, but with load growth 24.0 mills per kWhdelayed 10 pct.21.04 THERMAL ALTERNATIVE AND POWER VALUES.A. Thermal Alternative. The most likely thermal alternative to CraterLake hydro was determined by the San Francisco Regional Office of theFederal <strong>Energy</strong> Regulatory Commission (FERC) to be a diesel enginegenerating plant of 7,500 kW total capacity consisting of three 2,500 kWunits operating at 40 pct plant factor, over a 35 yr service life, with aheat rate of 10,550 Btu/kWh, capital cost of $530 per kW, and fuel andlubricating costs at $1.0795 and $5.00 per gal, respectively (seeExhibft 12).B. Power Values.(1) FERC Power Values - The power values provided by FERC were usedin part for the project benefit-cost analysis and the economic analysis ofthe power tunnel and penstock. The power values, based on January 1982price levels for Federal financing at 3-1/3 pct and 7-5/8 pct interestrates, are shown in Table 21-C. Real fuel cost escalation assuming aproject-on-line date of 1986 were also provided.(2) Project Capacity Value - Due to the single contingencytransmission line from Snettisham, the local utility should install 100 pctbackup of needed Crater Lake capacity. Reserve capacity could be providedby installing an oil-fired combustion turbine in Juneau. It would beappropriate to derate the capacity value developed by FERC by the capacityvalue of the combustion turbine. The resulting capacity value that couldbe claimed for Crater Lake would be quite small. The impact on totalproject benefits would be minimal and therefore capacity benefits forCrater Lake were not claimed.21-7
TABLE 21-C.AT-MARKET VALUE OF DEPENDABLE HYDROELECTRIC POWER(Price Level - January 1982)Without FuelWith FuelCost Escalation Cost EscalationRate ofFederalFinancing $/kW mills/kWh mi 11 s/kWh3-1/3% 40.17 95.04 1/ 162.287-5/8 % 61. 76 95.04 - 141 .531/ The breakdown of the at-market energy value without fuel cost escalationTs as follows:FuelO&MStep-upSubstation costsHydro-thermal<strong>Energy</strong> adjustment82.53 mill s/kWh8.47 II0.53II3.51 II95.04 mil ls!kWh""(3) Firm <strong>Energy</strong> Value - The nonescalated energy value provided byFERC was updated to September 1984 cost levels. Fuel costs per kWh werebased on a fuel cost of $0.90 per gal, an energy equivilent of 138,700BTU/gal, and the heat rate provided by FERC of 10,550 BTU/kWh. VariableO&M costs provided by FERC were escalated by 7.2 pct/yr for 1982 and6.4 pct/yr for the 21 mo in 1983 and 1984 in accordance with the Bureau ofLabor and Statistics data related tQ utility salary and wage increases in1982 and 1983. The step-up substation costs and the hydro-thermal energyadjustment provided by FERC were used. Fuel cost escalation above thegeneral inflation rate was used in the benefit analysis. That portion ofthe at-market energy value that is a direct result of the fuel cost wasescalated for 26 yr from the present and then held constant for the rest ofthe 100 yr economic life of the project. Real fuel cost escalation ratesand the duration of escalation were based on the 1984 <strong>Data</strong> ResourcesIncorporated Summer <strong>Energy</strong> Review Report. Escalation rates and theresulting value of energy are given in Table 21-0.(4) Secondary <strong>Energy</strong>The marketing agency (APA) and the <strong>Alaska</strong> District havereservations about the marketability of Crater Lake secondary energy.There are no opportunities for industrial fuel switching in the marketarea. The majority of the Juneau area power demand is currently met byexisting hydroelectric plants that are all subject to the same hydrologicregime, excess water is available to generate secondary energy at all sitesat the same time. Power generation at the hydroelectric plants owned by'"21-8
the local utility (AEL&P) is normally maximized while the SnettishamProject floats on the load and generates the remainder of the demand.During the Aug - Oct time frame when excess water is available to generatesecondary energy, firm and secondary energy from local hydroplants is in asense scheduled before even firm energy production from ~nettisham, thuseliminating the majority of the potential demand for seeondary energy fromthe Snettisham Project.Table 21-0. REAL FUEL ESCALATION RATES AND VALUE OF ENERGY(Source: <strong>Data</strong> Resources Incorporated)Period1984-19901991-19951996-20002001-201 02011-2088Year<strong>Energy</strong>198419851988 (power-on-line)199520002010 (end of applied escalation)2088 (end of project economic life)Escalation Rate (pct)0.63.73.41.8o1/ 10.12 mills/kWh of each energy value is variable O&M.2/ Drop in energy value attributed to lower fuel costs.Value (mills/kWh) 1/82.94 2/83.35 -84.6099.64115.17134.89134.89There are some instances when secondary energy from Crater Lakecould be marketed. Some secondary energy would be marketable duringperiods of firm hydroenergy short falls before a new hydro resource wasbrought online. Maintenance of the various hydro and thermal units in thesystem could be scheduled during the Aug - Oct time frame when secondaryenergy is available from Crater Lake. Forced outtages in the system wouldalso create a temporary market for Crater Lake secondary energy. APA iscurrently studying the possibility of interconnecting the SnettishamProject with other southeast <strong>Alaska</strong>n communities. Construction of such anintertie would provide a market for Crater Lake secondary energy. Theassumption was made that on the average there will be a demand for 25 pctof secondary energy potential from Crater Lake. Based on the discussionpresented in this section this assumption may be optimistic.21.05 POWER STUDIES.A. I~odel Assumptions. The Optimum Hydropower Yield Program, developedby the <strong>Alaska</strong> District, Corps of Engineers, was used to estimate averageannual energy, firm annual energy, and secondary energy for Crater Lake.The following assumptions were used in the computer model:21-9
(1) Storage Capacity Curve, Plate 46.(2) Minimum power pool elevation is 820 ft above project datum.(3) Maximum power pool elevation is 1,017 ft above project datum.(4) Storage available for power regulation is 81,500 acre-ft.(5) Tailwater elevation is fixed at 11.4 ft above project datum.(6) Crater Creek flows observed and estimated from correlationwith Long River and Dorothy Creek for WY 1914 - 1968 as presented in Table5-A.(7) Power tunnel equivalent diameter is 11 ft and the penstockdiameter is 6 ft.(8) Head -loss coeffi c i ent K is. 0001093 (expected losses) for therelationship HL = K02.(9) Plant capacity is 34,500 KVA at 1.0 power factor.( 10)( 11 )capacity andPlant efficiency is 86 pct.Transmission and station service losses of 5 pct for bothenergy.(12) Monthly distribution of power demand as shown in Table 2l-E.(13) All available water will be used for power production (nominimum releases required for fisheries in Crater Creek).(14) All observed and correlated monthly streamflows as describedin Section 5 of this OM were used in the power routing studies tB. Power Routing Results.(1) Power Capabilities - Results of the power regulations areshown on Plates 47 through 49. Based on 54 yr of routing, Crater Lake hasa firm energy capability of 99.9 GWh and a secondary energy capability of15.3 GWh (includes 5 pct. losses for transmission and station service).(2) Critical Period - The critical period resulting from theassumptions listed above is 31 mo, extending from October 1920 to May 1922(refer to Plate 48).(3) Dependable Capacity - The dependable capacity of a hydroelectricplant is that capacity that is available when needed. Dependablecapacity is needed in Juneau during the peak load season from Novemberthrough March. The minimum pool elevation reached during the Novemberthrough March period in the routing studies was 860 ft. Based on a poolelevation of 860 ft, maximum tailwater of 12.5 ft, expected losses throughthe power conduit, and the assumed turbine characteristics, approximately29,000 KVA can be considered as dependable capacity.21-10
However, because of the single contingency transmission line which servesthe project, this capacity is not dependable at the load center andtherefore has no economic value.Table 21-E.JUNEAU AREA ENERGY USE(1000 kwh)FY % of FY79 FY % of FY80 FY % of FY81 1979-81Month 1979 Total 1980 Total 1981 Total Average%OCT 10,711 8.0 11 ,750 8.4 12,932 8.5 8.3NOV 11 ,669 8.7 11 ,663 8.3 13,458 8.8 8.6DEC 12,065 9.0 12,858 9.2 16,466 10.8 9.7JAN 12,697 9.5 13,667 9.8 13,636 9.0 9.5FEB 11 ,963 9.0 11,904 8.5 12,906 8.5 8.7MAR 11,737 8.8 12,392 8.8 13,600 8.9 8.8APR 10,549 7.9 11 ,243 8.0 12,228 8.0 8.0MAY 10,603 7.9 11,066 7.9 11 ,313 7.4 7.7JUN 9,933 7.4 10,315 7.4 11 , 136 7.3 7.4JUL 10,397 7.8 10,795 7.7 11,132 7.3 7.6AUG 10,529 7.9 10,993 7.8 11 ,427 7.5 7.7SEP 10,604 7.9 11 ,482 8.2 11 ,836 7.8 8.0133,457 140,128 152,070C. Value of One Foot of Head. Average annual project benefits weredivided by the average project net head of 950 ft to obtain the value ofone foot of head. The average project net head is equal to. the gross headdefined below minus the losses in the power conduit at average flowconditions. Benefits were based on energy values and fuel cost escalationrates that were current at the time the power conduit was optimized. The.nonescalated energy value provided by FERC, real fuel cost escalation ratesdeveloped in 1984 by <strong>Data</strong> Resources Institute (DRI) and a discount rate of3-1/8 pct were used to determine the average annual project benefit of$12,165,000. The average annual value of one foot of head based on theabove figures is $12,805.D. Power Conduit Size Optimization. A number of power tunnel andpenstock sizes were analyzed to determlne the most cost effectivecombination. The effect of head-loss characteristics on project benefitsfor each conduit size, combined with their associated construction costs,was used as the basis for the optimization. The expected average headlossfor each size penstock and power tunnel with the plant operating underexpected average conditions was determined utilizing the followingconditions: gross head of 960.6 ft (based on average pool elevations of972 ft and normal tailwater elevation of 11.4 ft); average plant output of23,300 kW (based on an expected generation duration curve provided by APA);and plant efficiency of 86 pct.The resulting average headlosses were multiplied by the average annual valueof one foot of head determined in Section 21.05 C. This value was added tothe average annual construction cost of each conduit. Construction costs21-11
were based on equipment and techniques currently used in this type ofconstruction. Cost levels for the optimization studies wereSeptember 1984. The size having the lowest combination of construction andheadloss costs was selected as the most cost effective. Based on the aboveapproach, the 11.0-ft diameter power tunnel and 6.0-ft diameter penstockwere chosen. Results are shown on Plate 50.E. Sensitivity Analysis. Project benefits and the value of one footof head are based solely on energy benefits. <strong>Energy</strong> benefits are sensitiveto estimates of real fuel cost escalation rates. Because of the manyuncertainties in the world oil market today, a wide range of real fuel costescalation rate estimates have been made by various organizations. The1982 estimate by Canadals energy, mines and resources department predictsa 1.7 pct real fuel cost escalation rate. One projection used by the ~tateof <strong>Alaska</strong> in 1982 to project future oil prices is based on the assumptionthat oil prices will stay level with inflation. The ORIls 1984 estimateand the real fuel cost escalation rates referenced above were used in thesensitivity analysis. The analysis shows that a lower estimate of realfuel cost escalation results in a lower value of head10ss costs. The lowerhead10ss values do not offset the increased construction costs of thelarger size conduits. Therefore, the economic optimization tends towardthe smaller size tunnels and penstocks. A graphical representation of thesensitivity analysis is shown on Plate 51.21.06. PROJECT COSTS AND BENEFITS.A. General. Only costs and benefits attributed to Crater Lake arepresented in this report. An analysis was done in which Crater Lake wastreated as an ongoing phase of the Snettisham project. The present worthof Crater Lake costs and benefits were based on the Long Lake 1973power-on-1ine date and combined with those costs and benefits attributed toLong Lake. The analysis resulted in a positive benefit to cost ratio.This section presents construction costs and power benefits associatedwith Crater Lake on an average annual basis. All costs and power valuesare based on September 1984 price levels. Annual costs and benefits weredeveloped using ~-1/8 and 8-3/8 pct discount rates for Federal financing.The basic analysis and the power conduit optimization were done using the3-1/8 pct discount rate because the Snettisham project was originallyauthorized at the 3-1/8 pct discount rate for Federal financing. The 3-1/8pct discount rate falls in the range of estimates for inflation freediscount rates; therefore, the economic analysis using the 3-1/8 pct ratecan be considered an inflation free analysis. All costs are considered tobe inflation free.B. Project Investment Costs. Total project costs include constructioncosts, Englneerlng and Deslgn (E&O) costs, and Supervision andAdministration (S&A) costs. E&O costs are estimated at $6.23 million,$4.51 million of which has been expended through fiscal year 1984. S&Acosts are estimated to be ~4.02 million, $0.47 million of which has beenexpended through fiscal year 1984.Total project investment costs include total project costs plusinterest during construction. Interest during construction was calculated2-12
using 3-1/8 and 8-3/8 pct interest rates compounded annually. The actual(1974-1984) and estimated (1985-1988) annual project costs are shown inTable 21-F.TABLE 21-Fu ANNUAL PROJECT COSTSFiscalYear197419751982198319841985198619871988Project Cost($1,000)6006202,0005701, 19310,00020,00020,0003,51358,495Construction StartPower-on-lineC. Annual Costs. Annual costs include the amortized investment costs,operation and maintenance costs, and the costs of interim replacements.Investment costs were amortized over 100 years at 3-1/8 and 8-3/8 percentto obtain annual investment costs.The annual operation and maintenance costs associated with the CraterLake phase are estimated to be $235,000. Interim replacement costs areestimated as $15,000 annually. Table 21-G summarizes the annual costs forthe recommended plan.TABLE 21-G.ANNUAL COSTS OF RECOMMENDED PLANCostItem ($1,000)Construction Cost 1/Engr & Design Cost-2/Supervsn & Admin Cost 3/Total Project CostInterest During Canst.Total Investment CostInterest & Amortization i/Operation & Maint. CostReplacement CostsTotal Annual Cost48,2436,2324,02058,4955,11863,6132,084235152,334l/ Includes 20 pct contingency.~/ E&D is 13.0 pct of construction cost, of which $4.51 million wasexpended prior to FY 85.1/ S&A is 6.5 pct of construction cost plus 24 percent of E&D for overhead,of which $0.47 million was expended prior to FY 85.4/ 100 years at 3-1/8 pct.21-13
D. Project Benefits. Only firm and secondary energy benefits wereclaimed for the Crater Lake project. Juneau is not an area of high andpersistent unemployment, therefore employment benefits were not claimed.The energy value provided by FERC and updated by <strong>Alaska</strong> District wasused to determine project energy-benefits. Fuel costs were escalated bythe real fuel cost escalation rates developed by DRI. The energy valueswere applied to the year-to-year demand for Crater Lake energy, and presentworth was calculated for each based on the 1988 power on-line date. <strong>Energy</strong>benefits were totaled for the 100 yr economic life of the project andamoritized over 100 years to arrive at an average annual benefit. Table21-H shows yearly Crater Lake energy utilization, the energy values andenergy benefits claimed thru 1992, the year energy from Crater Lake isfully utilized. Table 21-1 shows project economics for the Crater Lakeproject at 3-1/8 and 8-3/8 pct discount rates and DRI real fuel costescalation rates. Project economics were also tested with a zero realfuel cost escalation rate.TABLE 21-H.ANNUAL DEMANDS AND BENEFITS<strong>Energy</strong><strong>Energy</strong> 2/ Supplied bySuppliea <strong>CRATER</strong> L.<strong>Energy</strong> by Exist Firm Sec Firm <strong>Energy</strong>Fiscal Demand 1/ Hydro <strong>Energy</strong> <strong>Energy</strong> ValueYear (GWh) (GWh) (GWh) (GWh) mi 11 s/kWh1988 POL 289 216 47 3/ 0 84.601989 299 216 82.9 0 85.021990 307 216 90.9 0 85.451991 316.2 216 99.9 0 88.081992 325.4 216 99.9 3.8 90.821/ Mid-range growth r-ate.2/ EXisting and planned by 1985 (firm energy).J/ Based on 1 May 1988 POL (May-Sept firm monthly energy)4/ 3-1/8 pct discount rate.Present Worth 4/<strong>Energy</strong> Benefits($1,000)3,8566,6117,0827,7828,075TABLE 21-1.PROJECT ECONOMICSWith DRI FuelCost EscalationNo Fue 1 CostEscalationDiscount Rate (pct)Total Annual Benefits ($1,000)Total Annual Costs ($1,000)Annual Net Benefits ($1,000)B/C Ratio3-1/81 2, 1 652,334~,8315.28-3/810,4776,4184,0591.63-1/88,0992,3345,7653.58-3/87,5046,4181,0861.221 -14
SECTION 22 - REAL ESTATE22.01 GENERAL. The main project area consists of approximately14,022 acres located within the publically-owned lands of Tongass NationalForest. This area includes Crater Lake and Long Lake and a portion of theSpeel Arm flats suitable for a power generating station and supportfacilities. The real estate was withdrawn from the public domain and fromappropriation under the United States mining laws, but not from leasingunder the mineral leasing laws, by Public Land Order No. 4108, dated26 October 1966, for protection of the facilities constructed inconjunction with this project. Other documents discussing the projectareas are the Supplemental Memorand~m of Understanding between the U.S.Forest Service and the Corps of Engineers, dated 18 September 1967, andDesign Memorandum No. 11, Real Estate, for the Snettisham Project, datedMarch 1967.22-1
SECTION 23 - COORDINATION WITH OTHERS·23.01 ALASKA POWER ADMINISTRATION. As the Federal Agency that will beresponsible for operating and maintaining the project after completion, the<strong>Alaska</strong> Power Administration (APA) has been consulted during the advanceengineering and design phase of this project. In addition, the APAprepared the Power Market Analysis and its subsequent updates which areincluded as Exhibits 7-13.23.02 U.S. FISH AND WILDLIFE SERVICE. The U.S. Fish and Wildlife Service(USFWS) has been coordlnated wlth throughout the development of thismemorandum. Studies by that agency were funded to determine the nature ofexisting ecosystems in the Crater Cove and Crater Creek area and toidentify the potential impacts of the project. The Fish and WildlifeCoordination Act Report supplement for the Crater Lake phase, as preparedby the USFWS, is on file at the <strong>Alaska</strong> District~ Corps of Engineers.Several protection and mitigative measures are recommended in that documentand are discussed in detail in the project environmental assessment(September 1983) and in Section 18 of this report. Coordination with theUSFWS will continue both during and after construction.23.03 U.S. FOREST SERVICE. The U.S. Forest Service (USFS) has beencoordinated closely with throughout the development of the project. As theagency responsible for ensuring the protection of the lands on which theproject is being constructed, the USFS has agreed to develop joint DetailedAction Plans with the Corps of Engineers, in accordance with an existingSnettisham agreement.23.04 NATIONAL MARINE FISHERIES SERVICE. The National Marine FisheriesService has been coordinated with in preparation of the Coordination ActReport and the environmental assessment.23.05 FEDERAL ENERGY REGULATORY COMMISSION (FERC). The energy values usedin the project economics analyses were prepared by FERC. Their informationis presented as Exhibit 14.23.06 ALASKA DEPARTMENT OF FISH AND GAME ~ADF&G). The ADF&G has providedinput to the Coordlnatlon Act Report and t e proJect Environmental ImpactStatement.23-1
SECTION 24 - SUMMARY RECOMMENDATION·24.01 DISCUSSION. The recommended plan as described in this designmemorandum is the composite result of studies and analyses of the severalfeatures of the project. Wet and dry lake tap alternatives were evaluated,with the wet tap methodology selected for the recommended plan. Variouspower tunnel alinements and surge tank schemes were considered. Economicevaluation resulted in an optimum plan utilizing a constant-sloped deeptunnel, a conventional vented surge tank, and an unencased steel penstocklocated in a combined penstock and access adit tunnel. Power needsanalyses were performed in cooperation with the <strong>Alaska</strong> Power Administrationto determine the required generator size, resulting in the recommendationof a 34,500 KVA generator.24.02 CONCLUSION. In conclusion, the recommended project plan asdescribed in this design memorandum represents the most favorable of thealternative plans examined for developmerit of the Crater Lake Phase of theSnettisham Hydroelectric Project. The plan will provide optimum reliablehydropower and attractive economic benefits.24.03 RECOMMENDATION. The District Engineer recommends that the CraterLake Phase of the Snettisham Hydroelectric Project be approved forconstruction in accordance with the design as put forth in this FeatureDesign Memorandum. The construction is to be performed by the Corps ofEngineers and financed through Federal channels.24-1
SECTION 25 - DETAILED COST ESTIMATES25.01 General. This section provides a summary and detailed cost estimatefor the recommended plan and each of the three alternative plans. Costsare provided by programming subfeature for the recommended plan only.Brief descriptions of the recommended and alternative plans are presentedin Sections 3 and 4, respectively.25-1
SNETTISHAM PROJECT, ALASKARECOMMENDED PLANTABLE 25-A. SUMMARY COST ESTIMATEPrlce Level - september, 1984SECOND STAGE DEVELOPMENT, <strong>CRATER</strong> <strong>LAKE</strong> <strong>PHASE</strong>04 DAMFeature or Item04.4 Power Intake WorksGate StructureSecondary Rock TrapPrimary Rock Trap and Lake TapGate Structure Access AditAccess Adit to LakePower TunnelPower Tunnel EmergencyPlugs and BulkheadsPrimary TrashrackSurge Tank (Vented)Penstock and Penstock TunnelFi na 1 Rock TrapPenstock Tunnel Plug andBulkheadPrimary Access AditTotal Cost, 04.4 Power Intake WorksTOTAL COST, 04 DAM07 POWER PLANT07.1107.1207.1307.207.3107.3207.3307.8Powerhouse CompletionTail raceMachine ShopTurbines and GeneratorsAccessory Electrical EquipmentSwitchyardMiscellaneous EquipmentTransmission PlantTOTAL COST, 07 POWER PLANT19 BUILDINGS, GROUNDS AND UTILITIESUtilitiesTOTAL COST, 19 BUILDINGS, GROUNDS,AND UTILITIES25-2Amount$4,244,000173,0001,460,0001,805,0001,367,0008,986,000985,0004,627,0003,067,0005,663,000416,0002,935,0001,247,000$36,975,000$574,0002,000899,0004,411,000739,000401,00026,00026,000$7,078,000$ 420,000~ 420,000Total$36,975,000$ 7,078,000$ 420,000TABLE 25-ASheet 1 of 2~ /I
SECOND STAGE DEVELOPMENT, <strong>CRATER</strong> <strong>LAKE</strong> <strong>PHASE</strong>· (Conti nued)Feature or ItemAmount30 ENGINEERING AND DESIGNTOTAL COST, 30 ENGINEERING AND DESIGN31 SUPERVISION AND ADMINISTRATIONTOTAL COST, 31 SUPERVISION AND ADMINISTRATION,50 CONSTRUCTION FACILITIESConstruction Camp Facilities$3,770,000TOTAL COST, 50 CONSTRUCTION FACILITIES $3,770,000TOTAL COST TABLE 25-ATotal$6,232,000~4,020,OOO$3,770,000$58,495,000~~~lOt•..,::; "
"'rSNETTISHAM PROJECT, ALASKARECOMMENDED PLANTABLE 25-B. DETAILED COST ESTIMATEPrlce Level - SeRtember, 1984SECOND STAGE DEVELOPMENT, <strong>CRATER</strong> <strong>LAKE</strong> <strong>PHASE</strong>04 DAMFeature or Item04.4 Power Intake WorksGate StructureRock Excavation, Service RoomRock Excavation, ShaftRock BoltsConcrete·ReinforcementSteel Ladder/Cage& 8 PlatformsVent Pipe, 24" dia.Tunnel Filling PipeGlobe V~lve, 12"Bulkhead Hoist SystemSlide Gate & MachinerySteel Floor GratingGuardrailBulkhead: . Gate Guide
SECOND STAGE DEVELOPMENT, <strong>CRATER</strong> <strong>LAKE</strong> <strong>PHASE</strong> (Co~tinued)04 DAM (Continued)Feature or Item04.4 Power Intake Works (Continued) ,Urlit Quantity'Primary Rock Trap and Lake Tap (Continued)SubtotalContingency 20%Total Cost, Primary Rock Trap and Lake TapGate Structure Access Adit'Rock Excavation CY 4,250~Common ExcavationCY 2,150Fill (Rock from Excavation) CY 2,150Concrete, Structural CY 12Reinforcement LBS 1,200Steel Gate LBS 1,060Helicopter Pad (ExcavationMaterial Leveled) LS 1-Electrical Lighting EA 40SubtotalContingency 20%Total Cost, Gate Structure Acces~Adit, Access Adit to LakeRock Excavation ,"'CY 3,150"'Common Excavation 'CY 1,670Rock Bolts, 1 in dia. x 10 ft EA 90" in di a. x 14 ft :EA ~!< 50"Concrete' CY 12Reinforcement LBS 1,200-Steel Gate LBS 1,060Electrical Lighting EA 20SubtotalContingency 20%$UnitPrice$320.0020.0030.00."890.001.803.753,000.00400.00" 320~OO" 20.00460.00640.00890.001.803.7540Q.00I, : '.Amount$1,217,000243,000$1,460,000$1,360,00043,00065,00011 ,0002,0004,0003,00016,000-$ ,1 , 504, 000301,000$1,805,000'$1,008,000 ,33,000,", , ,.41,000)32~00011 ,000' ,~, ,2,000' 4,0008,000.. ~j ~."',.,'Total Cost, Access Adi~to LakePower Tunnel (11 ft dia.)Rock Excavation CY 22,110Concrete CY 190Reinforcement LBS 57,760Rock Bolts, Grouted LF 19,020Steel Sets EA 10Shotcrete SY 3,530SubtotalContingency 20%$"~. "';,Or> ;.;.255.00890.001.8046.004,500.00186.00: .,"$l~'367 ,000; ... ~$5,638;000169,000104,000875,00045,000657,000$7,488,0001,498,000TABLE 25-B
./SECOND STAGE DEVELOPMENT~04 DAM (Continued)Feature or Item04.4 Power Intake Works (Continued)<strong>CRATER</strong> <strong>LAKE</strong> <strong>PHASE</strong> (Continued)Power Tunnel (11 ft dia.) (Continued)Total Cost, Power TunnelPower Tunnel Emergency Plugs andRock ExcavationSteel BulkheadConcreteReinforcementGrout HolesSubtotalContingency 20%Unit QuantityBulkheadsCY 608LBS 36,000CY 422LBS 10,000LF 1,320Unit.Price ;-:$312.005.30890.001.8035.00;~,Amount..$8,986,000$ . 190,000. 191,000376,00018,00046,000.',,"$ 821,000".164,000Total Cost, Power Tunnel Emergency Plugs and Bulkheads $ 985,000Primary TrashrackSteelConcrete WeightsReinforcementOperating CableInstallation CablesBarge and HoistRemove Overburden Above LakeTap (Under Water Excavation)SubtotalContingency 20%Total Cost, Primary TrashrackSurqe TankRock Excavation, ShaftRock Excavation, DriftConcreteReinforcementWire MeshRock BoltsVent PipeLevel and Pressure MonitoringSystemSubtotalContingency 20%Total Cost, Surge TankLBSCYLBSLFLFLSLSCYCYCYLBSSYLFLBSLS25-642,600 $ 4.10 $ 175,0002 1,500.00 3,000100 1.80 ., ;- ~'0400 20.00 8,000··800 20.00 16,0001 11 0,000.00 11 0,000:)\ ;.', ,'.- (, :7 1: t'~·:1·.'~3,545,000. QO
SECOND STAGE DEVELOPMENT, <strong>CRATER</strong> <strong>LAKE</strong> <strong>PHASE</strong> (Continued)04 DAM (Continued)Feature or Item. Unit QuantityUnitPriceAmount·04.4 Power Intake Works (Continued)Penstock and Penstock TunnelRock Excavation Cy 6,500Shotcrete SY 182Penstock Steel, A 517 LBS 630,000Concrete, Penstock Supports CY 348Reinforcement LBS 14,000Lighting EA 40Rock Bolts LF 970$ 214.00186.004.60890.001.BO400.0046.00\$1,391,00034,0002,898,000310,00025,00016,00045,000SubtotalContingency 20%$4,719,000944,000Total Cost, Penstock and Penstock Tunnel$5,663,000Final Rock TrapRock Excavation CY 1,579Steel Trashrack LBS 2,163$214.004.10$ 338,0009,000SubtotalContingency 20%$ 347,00069,000Total Cost, Final Rock Trap$ 416,000Penstock Tunnel Plug and Bulkhead.. Rock Excavation CY 2~300Concrete Cy 2,030Reinforcement LBS 21 ,0001 2 in d i a. Pipe LF 6512 in Valve EA 1Steel Bulkhead LBS 10,000Grout Holes (34 @ 30 ft) LF 1,050$214.00890.001.80150.008,500.005.3035.00$ 492,0001,807,00038,000.10,0009,00053,00037,000."SubtotalContingency 20%.. $2,446,000489,000Total Cost, Penstock Tunnel Plug and Bulkhead$2,935,000.~Primary Access AditRock Excavation, Tunnel CY 2,580Common Excavation, Portal CY 1,050Fi 11, Common CY 55Rock Bolts, Grouted LF 650Rock Excavation, Portal CY 1,225Conc ret e, Port a 1 Cy 27Reinforcement LBS 3,700$214.0020.0030.0046.00250.00890.001.80$ 552,00021,0002,00030,000306,00024,0007,00025-7TABLE 25-BSheet 4 of 9
SECOND STAGE DEVELOPMENT, <strong>CRATER</strong> <strong>LAKE</strong> <strong>PHASE</strong> (Continued)04 DAM (Continued)Feature or Item04.4 Power Intake Works (Continued)Primary Access Adit (Continued)Personnel GatePre-SplitClearingLightingSubtotalContingency 20%Total Cost, Primary Access AditTotal Cost, 04.4 Power Intake WorksTOTAL COST, 04 DAM07 POWER PLANT07. 11~Powerhouse CompletionSubstructure ConcreteSuperstructure ConcretePenstock Branch ConcreteCementReinforcementDemolitionMisce11~neo~s MetalPainting FeaturesPainting EquipmentDust Protection andBarracadingGenerator, Cooling, Glandand Wear Ring Piping'.. 'Electrical Conduit Systemc\ LightingSubtotalContingency 20%Unit QuantityLBSSFACREEATotal Cost, 07.11 Powerhouse Completion07.12 Tailrace1,0602,500220CY 204CY 73CY 66CWT 1,615LBS 40,000LS 1LBS 6,333LS 1LS 1LS 1LS 1LS 1LS 1Bulkhead Guide, Series300 Stainless Steel LBS 42025-8UnitPrice3.7530.005,000.00400.00$ 785.001,160.00215.009.201.805,000.005.6017,000.0024,000.0012,000.0031,000.005,000.003,000.00$ 3.90TABLE 25-BSheet 5 of 9Amount4,00075,00010,0008,000$1,039,000208,000$1,247,000$36,975,000$36,975,000$ 160,00085,00014,00015,00072,0005,00035,000-17 ,00024,00012,00031,0005,0003,000$478,00096,000$574,000$2,000
SECOND STAGE DEVELOPMENT, <strong>CRATER</strong> <strong>LAKE</strong> <strong>PHASE</strong> (Continued)07 POWER PLANT (Continued)Feature or ·Item Unit Quantity Price07.12 Tailrace (Continued)Contingency 20%Total Cost, 07.12 Tailrace07.13 Machine ShopRock ExcavationRock BoltsConcreteReinforcementHeating and VentilationLighting and Elect. PowerChain Link FabricWatertight BulkheadSubtotalContingency 20%Total Cost, 07.13 Machine Shop07.2 Turbine, Generator and Governor. CYLFCYLBSLSLSSYLBSTurbine .EAInsta ll .. Turbi neEASpheric~l Valve' EAInstall: Spherical Valve . EABranch Pipe and Installation(A 51.6 Steel) . LSGenerator and Installation EAGovernor and Installation EASubtotal.. Cont i ngen~y .20%~- ~- '.) , ......1,200 $4,850157501113610,000Total Cost; 07.2 Turbine, Generator and Governor;"f-,)"· ... ".- -' ;,. :,:'O~ .3l Accessory Electrical EquipmentMain Generator Cable. Tray SystemInsulated Power Cable(Over 1,000 Volts)13.8 KV Metal Enclosed BusGrounding System480-Volt Power OutletsLSLSLSLSLS25-9350.0046.00890.001.8015,000.0020,000.0030.005.301 $ 872,000.001 . 300,000.001 355,000.001 89,000.0011156,000.001,800,000.00204,000.001 $14,010.001 43,260.001 54, 180.001 3,300.001 1,000.00$TABLE 25-BSheet 6 of 9Amounto2,000$420,000223,00013,0001,QOO15,00020,0004,00053,000$749,000150,000$899,000$ 872,000300,000355,00089,00056,0001,800,000204,000$3,676,000735,000$4,411,000$14,00043,00054,0003,0001,000..
SECOND STAGE DEVELOPMENT, <strong>CRATER</strong> <strong>LAKE</strong>" <strong>PHASE</strong> (Continu~d)07 POWER PLANT (Continued)Feature or· Item Unit Quantity Price . Amount07.31 Accessory Electrical Equipment (Continued)Misce11anous ElectricalEquipment & Accessories LS13.8 KV Metal Clad Switchgear LSControl Cable Tray System LSInsulated Wire and Cable(below 1,000 Volts)LSSubtotalContingency 20%1 375,250.00,. 85,700.00l' 18,330.001 21,630.00375,00086,00018,00022,000$616,000123,000Total Cost, 07.31 Accessory Electrical Equipment $739,00007.32 SwitchyardExcavation and BackfillConcrete FoundationCementReinforcement. Bus Support InsulatorsHigh Voltage BussesPower TransformerLighting ArrestorsHigh Voltage DisconnectsSubtotalContingency 20%Tota 1 Cost,. 07.32 Switchyard07~33 Miscellaneous Equipment',(, ~ ,', ,~,Heating and VentilationUnwatering and DrainagePiezometer PipingC02 pi pin'g . ,Governor Air Stationand Brake Air PipingLub and Gove"rnor Oi 1PipingSubtotalContingency 20%CYCYCWTLBSLSLSEAEALSLSLSLSLSLSLS28510471,50011131$16.50: 650.009.201.806,000.0013,000.00253,000.00.11,910.0011 ,000.00$ 5,0007,000o3,0006,00013,000253,00036,00011 ,000$ "334,000, . 67,000. $:,,401,000$ 3,000.00 $ 3,000. /,~ l' ."," 10,000.00 "
SECOND STAGE DEVELOPMENT, <strong>CRATER</strong> <strong>LAKE</strong> <strong>PHASE</strong> '(Continued) ,07 POWER PLANT (Continued)Feature or Item Unit Quantity Price ",' Amount07.8 Transmission PlantStatus Switchboard LS '·1 $22,000.00 $22,000Contingency 20%Total Cost, 07.8 Transmission PlantTOTAL COST, 07 POWER PLANT19 BUILDINGS, GROUNDS, UTILITIESUtil itiesWaterline, Sewer1ine,Forced Main, Lift Stationsand Seepage PitsElectrical Service forLift StationsSubtotalContingency 20%Total Cost, UtilitiesTOTAL COST, 19 BUILDINGS, GROUNDS, UTILITIES30 ENGINEERING AND DESIGNLSLS111..;- I ...$336,000.0014;000.00. ,H., '. $ 4,000$26,000$7,078,000$ 336,00014,000$ 350,00070,000$ 420,000$420,000.,;Through September 1984Anticipated to CompleteTOTAL COST, 30 ENGINEERING AND DESIGN31 SUPERVISION AND ADMINISTRATIONOverhead on E&D Through FY 84Overhead on Remaining E&D6.5% of Construction CostTOTAL COST, 31 SUPERVISION AND ADMINISTRATION'I .-'-', ,4,512,000'1,720,000, ,:""$6,232,000';',"" ~"".,.,- ,. j ...."$0,232,000 ", 1:;',; r :" :: : :j ~~ . ~:\ ~r- ~ ->'~J :- ."$471,000 ,.,,'413~ 000; «',Jr" c,,:, 3, 136', 000/ ~>;:,:.$4,020,000,(;,nr, ,. i$4,020,00025-11TABLE 25-BSheet 8 of 9
SECOND STAGE DEVELOPMENT, <strong>CRATER</strong> <strong>LAKE</strong> <strong>PHASE</strong> (Continued)Feature or Item Unit Quantity Price Amount50 CONSTRUCTION FACILITIESTransformers and ElectricalConnections for ContractorsCamp LS $34,000.00 $ 34,000Lodging, Food and CampServicesSubtotalContingency 20%Total Cost, Construction FacilitiesTOTAL COST, 50 CONSTRUCTION FACILITIESTOTAL COST, <strong>CRATER</strong> <strong>LAKE</strong> STAGE DEVELOPMENTMANDAYS 44,400 70.00 $3,108,000$3,142,000628,000$3,770,0003,770,000$58,495,00025-12TABLE 25-BSheet 9 of 9
TABLE 25-C. ALTERNATIVE PLAN I - SUMMARY COST ESTIMATE(PRICE LEVEL - SEPTEMBER 30, 1984)FEATUREPrimary Rock Trap and Lake TapPrimary TrashrackSecondary Rock TrapGate StructureGate Structure Access AditAccess Adit to LakePower TunnelSurge TankFinal Rock TrapFinal Rock Trap Access AditRoad to Final Rock Trap Access AditPenstockPenstock Construction AditPowerhouse CompletionTurbine and GeneratorAccessory Electrical EquipmentMiscellaneous Power Plant EquipmentTailraceSwitchyardTransmission PlantPermanent BuildingsUt i 1 itiesConstruction Camp FacilitiesSubtotalSupervision & AdministrationEngineering & DesignTotal Cost, Alternative Plan ITOTAL COST$ 1,369,0004,627,000148,00010,844,0002,802,0001,546,00010,493,0001,594,000413,0001,547,000481,00011,537,000930,000574,0004,411,000739,00026,0002,000401,00026,000292,000420,0005,611,000$ 60,833,0004,838,0006,232,000$ 71,903,00025-13
TABLE 25-0. ALTERNATIVE PLAN I - DETAILED COST ESTIMATE(PRICE LEVEL - SEPTEMBER 30, 1984)UNITFEATURE OR ITEM UNIT QUANTITY PRICE AMOUNTPRIMARY ROCK TRAP AND <strong>LAKE</strong> TAPRock Trap Excavation CY 940 $ 312.00 $ 293,000Lake Tap LS 1 840,000.00 840,000Concrete CY 8 890.00 7,000Reinforcement LB 400 1.80 1,000Subtota 1 $ 1, 141 ,000Contingencies - 20% 228,000Total Cost, Primary Rock Trap and Lake Tap $ 1,369,000•I"~PRIMARY TRASHRACK ...Steel LB 42,600 $ 4.10 $ 175,000Concrete Weights CY 2 890.00 2,000Reinforcement LB 100 1.80 0..,Operating Cable (Wire Rope) LF 400 20.00 8,000Installation Cables LF 800 20.00 16,000Barge and Hoists LS 1 11 0,000.00 11 0,000 .',Remove Overburden Above Lake ~IB 1 LS 3,545,000Tap (Underwater Excavation).,Subtotal $ 3,856,000Contingencies - 20% 771,000Total Cost, Primary TrashrackSECONDARY ROCK TRAP$ 4,627,000 "',Rock Excavation CY 268 $ 312.00 $ 84,000Steel LB 9,628 4.00 39,000Subtota 1 $ 123,000Contingencies - 20% 25,000Total Cost, Secondary Rock Trap $ 148,000 .'..'"'"25-14
TABLE 25-0 (Continued)UNITFEATURE OR ITEM UNIT QUANTITY PRICE AMOUNTGATE STRUCTURERock Excavation, Service Room CY 4,440 $ 320.00 $ 1,421,000Rock Excavation, Shaft CY 5,260 780.00 4,103,000Concrete CY 1,880 890.00 1,673,000Reinforcement LB 94,000 1.80 169,000Slide Gate #1 LB 82,400 5.30 437,000Slide Gate #2 LB 60,000 5.30 318,000Air Vent LF 730 200.00 146,000Rock Bolts LF 5,180 46.00 238,000Hoist, 15-ton EA 1 25,000.00 25,000Steel Grating SF 620 95.00 59,000Steel Hatch' EA 1 3,000.00 3,000Ladder with Cage LF 276 75.00 21,000Elevator with Motor, 1,000#CAP LS 1 325,000.00 325,000Hydraulic Pump/Tank EA 1 32,500.00 33,000Structural Support for Vent & LF 276 10.00 3,000LadderLighting, Generators, Control'Panel w/Monitoring &Communication LS 62,600.00 63,000Subtota 1 $ 9,037,000Contingencies - 20% 1,807,000Total Cost, Gate Structure $ 10,844,000GATE STRUCTURE ACCESS AOITRock Excavation CY 5,940 $ 320.00 $ 1,901,000Common Excavation CY 2,150 20.00 43,000Fi 11 CY 2,150 30.00 65,000Rock Bolts: 1110 x 10 1 LF 2,700 46.00 124,0001110 x 141 LF 700 46.00 32,000Concrete, Mass CY 137 890.00 122,000Concrete, Structural CY 12 890.00 11 ,000Reinforcement LB 7,500 1.80 14,000Steel Gate, Personnel LB 1,060 3.75 4,000Helicopter Pad (Excavation LS 1 3,000.00 3,000Material Leveled)Electrical Lighting EA 40 400.00 16,000Subtota 1 $ 2,335,000Contingencies - 20% 467,000Total Cost, Gate Structure Access Adit $ 2,802,00025-15
TABLE 25-0 (Continued) .UNITFEATURE OR ITEM UNIT QUANTITY PRICE AMOUNTACCESS ADIT TO <strong>LAKE</strong>Rock Excavation CY 3,620 $ 320.00 $ 1,158,000Common Excavation CY 1,670 20.00 33,000Rock Bolts: 1110 x 10 1 EA 90 460.00 41,000110 x 141 EA 50 640.00 32,000Concrete CY 12 890.00 11 ,000Reinforcement LB 600 1.80 1,000,"Steel. Gate, Personnel LB 1,060 3.75 4,000Electrical Lighting EA 20 400.00 8,000"Subtotal ~ 1,288,000t-Gontingencies - 20% 258,000...Total Cost, Access Adit to Lake $ 1,546,000POWER TUNNEL~;lRock Excavation CY 25,500 $ 255.00 $ 6,503,000Concrete Tunnel Lining CY 1,134 890.00 1,009,000Reinforcement LB 345,100 1.80 621,000"..Stee 1 Sets EA 10 4,500.00 45,000Shotcrete SY 387 186.00 72 ,000Rock Bolts, Grouted LF 10,745 46.00 494,000 ".Subtotal $ 8,744,000Contingencies - 20% 1,749,000Total Cost, Power Tunnel $ 10,493,000SURGE TANKRock Excavati on, Shaft CY 1,283 $ 780.00 $ 1,001,000Rock Excavation, Drift~.CY 190 214.00 41,000Concrete, Surge Tank Enclosure CY 45 890.00 40,000Reinforcement LB '4,186 1.80 8,000Steel Orifice, 111 Plate LB 3,026 4.50 14,000Rock Bolts LF 2,200 46.00 101,000Wire Mesh SY 1,222 30.00 37,000Concrete, Drift Lining CY 58 890.00 52,000Reinforcement LB 19,140 1.80 34,000ItSubtota 1 $ 1,328,000Contingencies - 20% 266,000 ,Total Cost, Surge Tank$ 1,594,00r25-16
TABLE 25-0 (Continued)UNITFEATURE OR ITEM UNIT QUANTITY PRICE AMOUNTFINAL ROCK TRAPRock Excavation CY 1,328 $ 214.00 $ 284,000Steel Trashrack LB 2,100 4.10 9,000Concrete CY 35 890.00 31,000Reinforcement LB 11 ,000 1.80 20,000Subtota 1 $ 344,000Contingencies - 20% 69,000Total Cost, Final Rock Trap $ 413,000FINAL ROCK TRAP ACCESS ADITRock Excavation, Tunnel CY 2,610 $ 214.00 $ 559,000Excavation, Common CY 1,100 20.00 22,000Rock Bolts LF 400 46.00 18,000Rock Excavation, Portal CY 1,300 250.00 325,000Concrete, Portal CY 27 890.00 24,000Reinforcement LB 3,700 1.80 7,000Personnel Gate LB 1,060 3.75 4,000Pre-Sp 1 itt i ng SF 2,600 0.30 78,000Clearing ACRE 2 5,000.00 10,000Concrete, Plug CY 165 890.00 147,000Bulkhead LB 10,000 5.30 53,000Lighting EA 16 400.00 6,000Fill, Common CY 1,200 30.00 36,000Subtotal $ 1,289,000 .Contingencies - 20% 258,000Total Cos~, Final Rock Trap Access Adit $ 1,547,000ROAD TO FINAL ROCK TRAP ACCESS ADITExcavation CY 13,420 $ 20.00 $ 268,000Clearing ACRE 1.4 13,500.00 19,000Gravel Surface CY 1,800 30.00 54,000Guardrail LF 2,000 30.00 60,000Subtota 1 $ 401,000Contingencies -20% 80,000Total Cost, Road to Final Rock Trap Access Adit $ 481,00025-17
TABLE 25-0 (Continued)UNITFEATURE OR ITEM UNIT QUANTITY PRICE AMOUNTPENSTOCKRock Excavation CY 6,535 $ 214.00 $ 1,398,000Concrete Liner CY 4,900 890.00 4,361,000 ..Steel Liner, A537 CL2 LB 1,097,285 3.40 3,731,000Rock Bolts LF 2,700 46.00 124,000Subtotal ~ 9,614,000 ""Contingencies - 20% 1,923,000Total Cost, Penstock$ 11,537,000 lit,PENSTOCK CONSTRUCTION ADIT ,..Rock Excavation CY 2,610 $ 214.00 $ 559,000Concrete Plug CY 214 890.00 190,000Wire Mesh SY 17 30.00 1 ,000 I'Rock Bo lts LF 400 46.00 18,000Reinforcement LB 3,890 1.80 7,000..;.Subtotal $ 775,000Contingencies - 20% 155,000.1'Total Cost, Penstock Construction Adit $ 930,000POWER PLANTPowerhouse CompletionStructural ConcreteSubstructure Concrete CY 204 $ 785.00 $ 160,000 ..Superstructure Concrete CY 73 1,160.00 85,000Penstock Branch Concrete CY 66 215.00 14,000Cement CWT 1,615 9.20 15,000Reinforcing LB 40,000 1.80 72 ,000Demolition LS 1 5,000.00 5,000Miscellaneous Metals LB 6,333 5.60 35,000Painting, ArchitecturalFeatures LS 1 16,650.00 17,000Equipment LS 1 23,850.00 24,000Miscellaneous DustProtection & Barricading LS 11,930.00 12,000Mechanical ItemsGenerator Cooling, Gland& Wear Ring Piping L5 31,400.00 31,000Electrical ItemsConduit System LS 5,360.00 5,00uLi ght i ng System LS 3,300.00 3,000"25-18
TABLE 25-0 (Continued)UNITFEATURE OR ITEM UNIT QUANTITY PRICE AMOUNTPOWER PLANT (continued)Powerhouse Completion (continued)Subtota 1 $ 478,000Contingencies - 20% 96,000Total Cost, Powerhouse Completion $ 574,000Turbine, Generator and GovernorTurbine EA 1 $872,200.00 $ 872,000Insta 11 Turbi ne EA 1 300,000.00 300,000Spherical Valve EA 1 355,000.00 355,000Install Spherical Valve EA 1 88,750.00 89,000Branch Pipe (A5l6 Steel & LS 1 55,580.00 56,000Installation)Generator EA 1,800,000.00 1,800,000Governor EA 204,000.00 204,000Subtotal $ 3,676,000Contingencies - 20% 735,000Total Cost, Turbine, Generator and Governor $ 4,411,000Power Plant, Accessory Electrical EquipmentMain Generator Cable LS $14,010.00 14,000Tray SystemInsulated Power Cable LS 43,260.00 43,000(Over 1,000 volts)13.8 KV Metal Enclosed Bus LS 1 54,180.00 54,000Grounding System LS 1 3,300.00 3,000480-Volt Power Outlets LS 1 1,000.00 1,000Misc. Electrical Equipment & LS 1 375,250.00 375,000Accessories13.8 KV Metal Clad Switchgear LS 85,700.00 86,000Control Cable Tray System LS 18,330.00 18,000Insulated Wire & Cable LS 21,630.00 22,000(1000 Volts & Below)Subtotal $ 616,000Contingencies - 20% 123,000Total Cost, Accessory Electrical Equipment $ 739,000Miscellaneous Power Plant EquipmentHeating and Ventilation LS 1 $ 2,800.00 $ 3,000Unwatering & Drainage Piping LS 1 9,610.00 10,000Piezometer Piping LS 1 2,590.00 3,000C02 Piping LS 1 770.00 1,000Governor Air, Station & LS 1 1,800.00 2,000Brake Air PipingLube & Governor Oil Piping LS 3,020.00 3,000
TABLE 25-0 (Continued)UNITFEATURE OR ITEM UNIT QUANTITY PRICE AMOUNTPOWER PLANT (continued)Miscellaneous Power Plant Equipment (Continued)Subtota 1 $ 22,000Contingencies - 20% 4,000~' "11"Total Cost, Miscellaneous Power Pl ant Equipment $ 2,6,000TailraceBulkhead Guide 300 Series LS 420 $3.90 2,000 It'Stainless SteelContingencies - 20% 0..Total Cost, Tailrace $ 2,000SwitchyardSwitchyard Structures & Equipment."Excavation & Backfill CY 285 $ 16.50 $ 5,000 ~,Concrete Foundation CY 10 650.00 7,000Cement CWT 47 9.20 0 ".Reinforcement LB 1,500 1.80 3,000Bus Support Insulators LS 1 5,850.00 6,000 .'High Voltage Busses, LS 1 12,980.00 13,000Pittings & Accessories"Power Transformers EA 1 253,000.00 253,000Lighting Arrestors EA 3 11,910.00 36,000High Voltage Disconnects LS..1 10,820.00 11 ,000Subtota 1 $ 334,000Contingencies - 20%67,000 wTotal Cost, Switchyard $ 401,0001ftTOTAL COST, POWER PLANT $ 6,153,000TRANSMISSION PLANTj/jt'-:Status Switchboard LS $22,000.00 $ 22,000Contingencies - 20% 4,000Total Cost, Transmission Plant $ 26,000PERMANENT BUILDINGSTransmission Maintenance LS $92,500.00 $ 93,00rBldg (Remodel Extg Bldg)Machine Shop (Metal Bldg SF 1,200 125.00 150,000w/Slab on Grade, Complete)~'~'f'25-20
TABLE 25-0 (Continued)UNITFEATURE OR ITEM UNIT QUANTITY PRICE AMOUNTPERMANENT BUILDINGS (Continued)Subtotal $ 243,000Contingencies - 20% 49,000Total Cost, Permanent Buildings ~ 292,000UTILITIESWaterline, Sewer1ine, Forced LS $336,000.00 $ 336,000Main & Seepage PitElectrical Service For LiftStations LS $14,000.00 14,000Subtotal $350,000Contingencies 20% 70,000Total Cost, Utilities $ 420,000CONSTRUCTION CAMP FACILITIESProvide Lodging, Food & MD 66,316 $ 70.00 4,642,000Camp ServicesTransformer & Electrical LS 34,000.00 34,000ServiceSubtotal $ 4,676,000Contingencies - 20% 935,000Total Cost, Construction Camp Facilities ~ 5,611,000TOTAL COST, CONSTRUCTION ALTERNATIVE PLAN I $60,833,00025-21
TABLE 25-E. ALTERNATIVE PLAN II - SUMMARY COST ESTIMATE(PRICE lEVEL - sEPTE8MER 30, 1984)FEATUREPrlmary Rock Trap and Lake TapPrimary TrashrackSecondary Rock TrapGate StructureGate Structure Access AditPower TunnelSurge TankFinal Rock TrapFinal Rock Trap Access AditRoad to Final Rock Trap Access AditPenstockPenstock Construction AditPowerhouse CompletionTurbine and GeneratorAccessory Electrical EquipmentMiscellaneous Power Plant EquipmentTailraceSwitchyardTransmission PlantPermanent BuildingsUt i1 it i esConstruction Camp FacilitiesSubtotalSupervision & AdministrationEngineering & DesignTotal Cost, Alternative Plan IITOTAL COST$ 1,576,0004,627,000148,0002,942,0003,463,00010,493,0002,240,000413,0001 ,547,000481,00011,537,000930,000574,0004,411 ,000739,00026,0002,000401,00026,000292,000420,0003,980,000$ 51,268,0004,216,0006,232,000$ 61,716,00025-22
TABLE 25-F.ALTERNATIVE PLAN II - DETAILED COST ESTIMATE(PRICE LEVEL - SEPrEMBER 30, 1984)UNITFEATURE OR ITEM UNIT QUANTITY PRICEPRIMARY ROCK TRAP AND <strong>LAKE</strong> TAPAMOUNT.Rock Trap Excavation CY 1,490 $ 312.00Lake Tap LS 1 840,000.00Concrete CY 8 " 890.00Reinforcement LB 400 1.80Subtotal $Contingencies - 20%Total Cost, Primary Rock Trap and Lake Tap $PRIMARY TRASHRACKSteel LB 42,600 $ 4.10 ~Concrete Weights CY 2 1,000.00Reinforcement LB 100 1.80Operating Cable (Wire Rope) LF 400 20.00Installation Cables LF 800 20.00Barge and Hoists LS 1 11 0,000.00Remove Overburden Above Lake JB 1 L5Tap (Underwater Excavation)Subtotal $Contingencies - 20%Total Cost, Primary Trashrack $SECONDARY ROCK TRAPRock Excavation CY 268 $ 312.00 $Steel LB 9,628 4.00Subtotal $Contingencies - 20%Total Cost, Secondary Rock Trap465,000 II>840,0007,0001,000'"1,313,000263,0001,576,000..'..175,0002,000II'08,00016,00011 0,000 "3,545,000..3,856,000771,0004,627,00084,00039,000123,00025,000$ 148,000IF.,'"M'~,'25-23
TABLE 25-F (Continued)UNITFEATURE OR ITEM UNIT QUANTITY PRICE AMOUNTGATE STRUCTURERock Excavation CY 1 ,619 $ 320.00 $ 518,000Concrete CY 620 890.00 552,000Reinforcement LB 31,000 1.80 56,000Slide Gate #1 LB 82,400 5.30 437,000Slide Gate #2 LB 60,000 5.30 318,000Air Vent LF 1,275 188.00 240,000Hoist, 15-Ton EA 1 25,000.00 25,000Rockbo lts LF 220 46.00 10,000Hydraulic Pump/Tank LS 1 32,500.00 33,000Lighting, Generators, Control LS 1 63,000.00 63,000Panel w/Monitoring &CommunicationClearing AC 0.5 16,000.00 8,000Excavation, Common CY 3,200 60.00 192,000Subtota 1 $ 2,452,000Contingencies - 20% 490,000Total Cost, Gate Structure $ 2,942,000GATE STRUCTURE ACCESS ADITRock Excavation CY 7,311 $ 320.00 $ 2,340,000Common Excavation CY 2,150 20.00 43,000Fi 11 CY 2,150 30.00 65,000Rock Bolts: 1 "0 x 10' LF 4,760 46.00 219,0001 "0 x 14' LF 700 46.00 32,000Concrete CY 150 890.00 134,000Reinforcement LB 7,500 1.80 14,000Steel Gate, Personnel LB 1,060 3.75 4,000Helicopter Pad (ExcavationLS1 3,000.00 3,000Material Leveled)Electrical Lighting EA 80 400.00 32 2 000Subtota 1 $ 2,886,000Contingencies - 20% 577 ,000Total Cost, Gate Structure Access Adit $ 3,463,000POWER TUNNELRock Excavation CY 25,500 $ 255.00 $ 6,503,000Concrete Tunnel Lining CY 1,134 890.00 1,009,000Reinforcement LB 345,100 1.80 621,000Rock Bolts, Grouted LF 10,745 46.00 494,000Stee 1 Sets EA 10 4,500.00 45,000Shotcrete SY 387 186.00 72,00025-24
TABLE 25-F (Continued)UNITFEATURE OR ITEM UNIT QUANTITY PRICE AMOUNTPOWER TUNNEL (Continued)Subtota 1 $ 8,744,000Contingencies - 20% 1,749,000Total Cost, Power Tunnel $ 10,493,000.,SURGE TANK11"Rock Excavation, Shaft CY 1,283 $1,200.00 $ 1,540,000Rock Excavation, Drift CY 190 214.00 41,000Concrete, Surge Tank Enclosure CY 45 890.00 40,000 "Reinforcement LB 4,186 1.80 8,000Steel Orifice, 111 Plate LB 3,026 4.50 14,000 "Rock Bolts LF 2,200 46.00 101,000Wire Mesh SY 1,222 . 30.00 37,000Concrete, Drift Li n i ng CY 58 890.00 52,000Reinforcement LB 19,140 1.80 34,000 '"Subtotal $ 1,867,000Contingencies - 20% 373,000,."Total Cost, Surge Tank $ 2,240,000FINAL ROCK TRAPRock Excavation CY 1,328 $ 214.00 $ 284,000Steel Trashrack LB 2,100 4.10 9,000 •Concrete CY 35 890.00 31,000~,Reinforcement LB 11 ,000 1.80 20,000,.Subtotal $ 344,000Contingencies - 20% 69,000..Total Cost, Final Rock Trap 413,000FINAL ROCK TRAP ACCESS ADITRock Excavation, Tunnel CY 2,610 $ 214.00 $ 559,000Common Excavation CY 1,100 20.00 22,000Rock Bolts LF 400 46.00 18,000 •Rock Excavation, Portal CY 1,300 250.00 325,000Concrete, Portal CY 27 890.00 24,000Reinforcement LB 3,700 1.80 7,000"Personnel Gate LB 1,060 3.75 4,000Pre-Splitting SF 2,600 30.00 78,00rClearing ACRE 2 5,000.00 10,000Concrete, Plug CY 165 890.00 147,000.',.25-25
TABLE 25-F (Continued)UNITFEATURE OR ITEM UNIT QUANTITY PRICE AMOUNTFINAL ROCK TRAP ACCESS ADIT (Continued)Bu"1 khead LB 10,000 5.30 53,000Adit Lighting EA 16 400.00 6,000Fill, Common CY 1,200 30.00 36,000Subtota 1 $ 1,289,000Contingencies - 20% 258,000Total Cost, Final Rock Trap Access Adit $ 1,547,000ROAD TO FINAL ROCK TRAP ACCESS ADITExcavation CY 13,420 $ 20.00 $ 268,000Clearing ACRE 1.4 13,500.00 19,000Gravel Surface CY 1,800 30.00 54,000Guardrail LF 2,000 30.00 60,000Subtotal $ 401,000Contingencies -20% 80,000Total Cost, Road to Final Rock Trap Access Adit $ 481,000PENSTOCKRock Excavation CY 6,535 $ 214.00 $ 1,398,000Concrete Liner CY 4,900 890.00 4,361,000Steel Liner, A537 CL2 LB 1,097,285 3.40 3,731,000Rock Bolts LF 2,700 46.00 124,000Subtotal $ 9,614,000Contingencies - 20% 1,923,000Total Cost, Penstock $ 11,537,000PENSTOCK CONSTRUCTION ADITRock Excavation CY 2,610 $ 214.00 $ 559,000Concrete Plug CY 214 890.00 190,000Wire Mesh SY 1 7 30.00 1,000Rock Bolts LF 400 46.00 18,000Reinforcement LB 3,890 1.80 7,000Subtota 1 $ 775,000Contingencies - 20% 155,000Total Cost, Penstock Construction Adit $ 930,00025-26
TABLE 25-F (Continued)UNITFEATURE OR ITEM UNIT QUANTITY PRICE AMOUNTPOWER PLANTPowerhouse CompletionStructural ConcreteSubstructure Concrete CY 204 $ 785.00 $ 160,000Superstructure Concrete CY 73 1,160.00 85,000Penstock Branch Concrete CY 66 215.00 14,000Cement CWT 1,615 9.20 15,000 •Reinforcing LB 40,000 1.80 72 ,000Demolition LS 1 5,000.00 5,000Miscellaneous Metals LB 6,333 5.60 35,000 ."Painting, ArchitecturalFeatures LS 1 16,650.00 17,000Equipment LS 1 23,850.00 24,000 flf'Miscellaneous DustProtection & Barricading LS 11 ,930.00 12,000Mechanical ItemsGenerator Cooling, Gland "& Wear Ring Piping LS 31,400.00 31,000Electrical ItemsConduit System LS 5,360.00 5,0001'"Lighting System LS 3,300.00 3,000Subtotal $ 478,000Contingencies - 20% 96,000Total Cost, Powerhouse Completion $ 574,000 ,.,Turbine, Generator and GovernorTurbine EA 1 $872,200.00 $ 872,000Install Turbine EA 1 300,000.00 300,000Ii'Spherical Valve EA 1 355,000.00 355,000Install Spherical Valve EA 1 88,750.00 89,000Branch Pipe (A5l6 Steel & LS 1 55,580.00 56,000 l>Installation)Generator EA 1 1,800,000.00 1,800,000Governor EA 1 204,000.00 204,000Subtota 1 $ 3,676,000Contingencies - 20% 735,000Total Cost, Turbine, Generator and Governor $ 4,411,000Accessory Electrical EquipmentMain Generator Cable LS $14,010.00 14,000Tray SystemInsulated Power Cable LS 43,260.00 43,00tJ(Over 1,000 volts)13.8 KV Metal Enclosed Bus LS 1 54,180.00 54,000Grounding System LS 1 3,300.00 3,00025-27."
TABLE 25-F (Continued)FEATURE OR ITEM UNIT QUANTITYPOWER PLANT (continued)Accessory Electrical Equipment (continued)UNITPRICEAMOUNT480-Vo1t Power OutletsMisc. Electrical Equipment &Accessories13.8 KV Metal Clad SwitchgearControl Cable Tray SystemInsulated Wire & Cable(1000 Volts & Below)LSLSLSLSLS1111,000.00375,250.0085,700.0018,330.0021,630.001,000375,00086,00018,00022,000SubtotalContingencies - 20%$616,000123,000Total Cost, Accessory Electrical Equipment$739,000Miscellaneous Power Plant EquipmentHeating and VentilationUnwatering & Drainage PipingPiezometer PipingC02 PipingGovernor Air, Station &Brake Air PipingLube & Governor Oil PipingLSLSLSLSLSLS11111$2,800.009,610.002,590.00770.001,800.003,020.00$3,00010,0003,0001,0002,0003,000SubtotalContingencies - 20%$22,0004,000Total Cost, Miscellaneous Power Plant Equipment$26,000TailraceBulkhead Guide 300 SeriesStainless SteelContingencies - 20%LS420$3.902,000oTotal Cost, Tailrace$2,000SwitchyardSwitchyard Structures EquipmentExcavation & BackfillConcrete FoundationCementReinforcementBus Support InsulationsHigh Voltage Busses,Pittings & AccessoriesPower TransformersLighting ArrestorsCYCYCWTLBLSLSEAEA28510471,5001113$ 16.50650.009.201.805,850.0012,980.00253,000.0011,910.00$5,0007,000o3,0006,00013,000253,00036,00025-28
TABLE 25-F (Continued)UNITFEATUR E OR ITEM UNIT QUANTITY PRICE AMOUNTSwitchyard (Continued)High Voltage Disconnects LS 10,820.00 $ 11 ,000Subtotal $ 334;000Contingencies - 20% 67 2000Total Cost, Switchyard $ 401,000TOTAL COST, POWER PLANT $6,153,000TRANSMISSION PLANTStatus Switchboard LS $22,000.00 $ 22,000 ..Contingencies - 20% 4,000Total Cost, Transmission PlantPERMANENT BUILDINGS.,".26,000 1ftTransmission Maintenance LS $92,500.00 $ 93,000Bldg (Remodel Extg Bldg)Machine Shop (Metal Bldg SF 1,200 125.00 150,000w/Slab on Grade, Complete)Subtotal $ 243,000Contingencies - 20%49,000IIITotal Cost, Permanent Buildings $ 292,000UTILITIESWaterline, Sewerline, Forced LS $336,000.00 $ 336,000Main & Seepage PitElectrical Service forLift Stat ions LS 14,000.00 14,000Subtotal 350,000Contingencies - 20% 70,000Total Cost, Utilities $ 420,000CONSTRUCTION CAMP FACILITIESProvide Lodging, Food & MD 46,900 $70.00 3,283,000Camp ServicesTransformer & Electrical LS 34,000.00 34,000 ..Service..fI!'II,II"..25-29!>'
FEATURE OR ITEM UNITCONSTRUCTION CAMP FACILITIES (Continued)SubtotalContingenci~s - 20%Total Cost, Construction Camp FacilitiesTABLE 25-F (Continued)TOTAL COST, CONSTRUCTION ALTERNATIVE PLAN IIQUANTITYUNITPRICEAMOUNT$ 3,317,000663,000$ 3.,980,000$51,268,00025-30
FEATURETABLE 25-G.Primary Rock Trap and Lake TapPrimary TrashrackSecondary Rock TrapGate StructureGate Structure Access AditAccess Adit to LakePower TunnelSurge ChamberFinal Rock TrapFinal Rock Trap Access AditPenstockPowerhouse CompletionTurbine and GeneratorAccessory Electrical EquipmentMiscellaneous Power Plant EquipmentTailraceSwitchyardTransmission PlantPermanent BuildingsUt il it i esConstruction Camp FacilitiesSubtotalSupervision & AdministrationEngineering & DesignTotal Cost, Alternative Plan IIIALTERNATIVE PLAN III - SUMMARY COST ESTIMATE(PRICE LEVEL - SEPTEMBER 30, 1984)TOTAL COST$ 1,566,0004,627,000148,0004,268,0002,539,0001,546,0008,986,0003,190,000383,0003,106,0007,952,000574,0004,411 ,000739,00026,0002,000401,00026,000292,000420,0003,841,000$ 49,043,0004,072,0006,232,000$ 59,347,00025-31
TABLE 25-H.ALTERNATIVE PLAN III - DETAILED COST ESTIMATE(PRICE LEVEL - sEPTEMBER 30, 1984)UNITFEATURE OR ITEM UNIT QUANTITY PRICE AMOUNTPRIMARY ROCK TRAP AND <strong>LAKE</strong> TAPRock Trap Excavation CY 1,490 $ 312.00 $ 456,000Lake Tap LS 1 840,000.00 840,000Subtotal $ 1,305,000Contingencies - 20% 261,000Total Cost, Primary Rock Trap and Lake Tap $ 1,566,000PRIMARY TRASHRACK1~H-~~Steel LB 42,600 $ 4.10 $ 175,000 ",Concrete Weights CY 2 890.00 2,000Reinforcement LB 100 1.80 0Operating Cable (Wire Rope) LF 400 20.00 8,000~Installation Cables LF 800 20.00 16,000Barge & Hoists LS 1 11 0,000.00 11 0,000Remove Overburden Above Lake LS 3,545,000.00 $ 3 2545 2000Tap (Underwater Excavation) "Subtotal $ 3,856,000Contingencies - 20% 771,000Total Cost, Trashrack $ 4,627,000SECONDARY ROCK TRAPRock Excavation CY 268 $ 312.00 84,000Steel LB 9,628 4.00 39,000 .. 'Subtotal $ 123,000Contingencies - 20%25,000 ..'Total Cost, Secondary Rock Trap $,148,000GATE STRUCTURERock Excavation, Service Room CY 1,094 $ 320.00 $ 350,000DriftRock Excavation, Shaft CY 1,130 780.00 881,000Rock Bolts LF 5,180 46.00 238,000Concrete CY 654 890.00 582,000 .Reinforcement LB 32,500 1.80 59,000Steel Ladder/8 Platforms LF 250 45.00 11,00Vent poi pe (2 - 2211) LF 520 150.00 78,000'"f!'25-32
Table 25-H (Continued)UNITFEATURE OR ITEM UNIT QUANTITY PRICE AMOUNT-GATE STRUCTURE (continued)Tunnel - Filling Pipe, 8 11 dia. LF 80 36.00 3,000Globe 'Jalve, 8 11 EA 1 5,600.00 6,000Hoi st, 15-ton EA 1 25,000.00•Steel Floor Grating SF 96 95.0025,0009,000"Guardrail LF 70 20.00 1,000Tractor Gate LB 19,000 5.30 101,000Bulkhead LB 15,000 5.30 80,000Gate Guides, Stainless Steel LB 122,000 8.75 1,068,000Gate Dogging Assemblies LOT 1 2,000.00 2,000Lighting, Generators, Control LS 1 62,600.00 63,000Panel w/Monitoring & CommunicationSubtotal $ 3,557,000Contingencies - 20% 711,000Total Cost, Gate Structure $ 4,268,000GATE STRUCTURE ACCESSADITRock Excavation CY 5,260 $ 320.00 $ 1,683,000Common Excavation CY 2,150 20.00 43,000Fi 11 (Rock from Excavation) CY 2,150 30.00 65,000Rock Bolts: 1110 x 10' LF 2,700 46.00 124,0001110 x 14' LF 700 46.00 32,000Concrete: Mass CY 137 890.00 122,000Structural CY 12 890.00 11 ,000Reinforcement LB 7,450 1.80 13,000Steel Gate, Personnel LB 1,060 3.75 4,000Helicopter Pad (Excavation LS 1 3,000.00 3,000Material Leveled)Electrical Lighting EA 40 400.00 16 2000Subtota 1 $ 2,116,000Contingencies - 20% 423,000Total Cost, Gate Structure Access Adit $ 2,539,000ACCESS ADIT TO <strong>LAKE</strong>Rock Excavation CY 3,620 $ 320.00 $ 1,158,000Common Excavation CY 1,670 20.00 33,000Rock Bo It: 1110 x 10' EA 90 460.00 41,0001110 x 14' EA 50 640.00 32,000Concrete CY 12 890.00 11,00025-33
Table 25-H (Continued)UNLTFEATURE OR ITEM UNIT QUANTITY PRICE AMOUNTACCESS ADIT TO <strong>LAKE</strong> (continued)Reinforcement LB 600 1.80 1,000Steel Gate, Personnel LB 1,060 3.75 4,000 I!'Electrical Lighting EA 20 400.00 8,000Subtotal$ 1,288,000l!>'Contingencies - 20% 258,000Total Cost, Access Adit to Lake $ 1,546,000POWER TUNNELRock Excavation CY 22,110 $ 255.00 $ 5,638,000 IIIConcrete CY 190 890.00 169,000 ,.Reinforcement LB 57,760 1.80 104,000Rock Bolts, Grouted LF 19,020 46.00 875,000 ,..Steel sets EA 10 4,500.00 45,000,Shotcrete SY 3,530 186.00 657,000BeSubtota 1 $ 7,488,000Contingencies - 20% 1,498,000Total Cost, Power Tunnel $ 8,986,000 ,...'"SURGE CHAMBERRock Excavation CY 3,255 $ 780.00 $ 2,539,000Rock Bolts, Grouted LF 410 46.00 19,000Level & Pressure Monitoring LS 1 100,000.00 $ 100,000System11'...fI'Subtotal $ 2,658,000Contingencies - 20%532,000 '*'Total Cost, Surge Chamber $ 3,190,000FINAL ROCK TRAPRock Excavation CY 1,210 $ 214.00 $ 259,000Stee 1 Trashrack LB 2,163 4.10 9,000 "Concrete CY 35 890.00 31,000Reinforcement LB 11 ,000 1.80 20,000Subtota 1 $ 319,000Contingencies - 20% 64,00(Total Cost, Final Rock Trap $ 383,00025-34
Table 25-H (Continued)UNITFEATURE OR ITEM UNIT QUANTITY PRICE AMOUNTFINAL ROCK TRAP ACCESS ADITRock Excavation, Tunnel CY 6,890 $214.00 $ 1,474,000Common Excavation CY 1,050 20.00 21,000Fill CY 55 30.00 2,000Rock Bolts LF 1,740 46.00 80,000Concrete CY 27 890.00 24,000Reinforcement LB 3,700 1.80 7,000Steel Bulkhead LB 10,000 5.30 53,000Steel Gate, Personnel LB 1,060 3.75 4,000Rock Excavation, Portal CY 1,225 250.00 306,000Pre-Splitting SF 2,500 30.00 75,000Clearing ACRE 2 5,000.00 10,000Concrete, Plug CY 580 890.00 516,000Adit Lighting EA 40 400.00 16,000Subtotal $ 2,588,000Contingencies - 20% 518,000Tota 1 Cost, Final Rock Trap Access Adit $ 3,106,000PENSTOCKExcavation CY 4,140 $ 286.00 $ 1,184,000Concrete CY 3,100 890.00 2,759,000Rock Bolts LF 750 46.00 35,000Steel Penstock LB 575,786 4.60 2,649,000Subtotal $ 6,627,000Contingencies - 20% 1,325,000Total Cost, Penstock $ 7,952,000POWER PLANTPowerhouse CompletionStructural ConcreteSubstructure Concrete CY 204 $ 785.00 $ 160,000Superstructure Concrete CY 73 1,160.00 85,000Penstock Branch Concrete CY 66 215.00 14,000Cement CWT 1,615 9.20 15,000Reinforcing LB 40,000 1.80 72,000Demo 1 it i on LS 1 5,000.00 5,000Miscellaneous Metals LB 6,333 5.60 35,000Painting, ArchitecturalFeatures LS 16,650.00 17,000Equipment LS 23,850.00 24,000Miscellaneous DustProtection & Barricading LS 11,930.00 12,00025-35
Table 25-H (Continued)UNITFEATURE OR ITEM UNIT . QUANTITY PRICE AMOUNTPOWER PLANT (continued)Powerhouse Completion (continued)Mechanical ItemsGenerator Cooling,Gland and WearRing Piping LS 31,400.00 31,000Electrical ItemsConduit
Table 25-H (Continued)UNITFEATURE OR ITEM UNIT QUANTITY PRICE AMOUNTPOWER PLANT (continued)Miscellaneous Power Plant EquipmentHeating and Ventilation LS 1 $2,800.00 $ 3,000Unwatering & Drainage Piping LS 1 9~610.00 10,000Piezometer Piping LS 1 2,590.00 3,000C02 Piping LS 1 770.00 1,000Governor Air, Station & LS 1 1,800.00 2,000Brake Air PipingLube & Governor Oil Piping LS 3,020.00 3,000Subtotal $ 22,000Contingencies - 20% 4,000Total Cost, Miscellaneous Power Pl ant Equ i pment $ 26,000Tail raceBulkhead Guide 300 Series LB 420 $3.90 $ 2,000Stainless SteelContingencies - 20% 0Total Cost, Tailrace $ 2,000SwitchyardSwitchyard Structures & EquipmentExcavation & Backfill CY 285 $ 16.50 $ 5,000Concrete Foundation CY 10 650.00 7,000Cement CWT 47 9.20 0Reinforcement LB 1,500 1.80 3,000Bus Support Insulators LS 1 5,850.00 6,000High Voltage Busses, LS 1 12,980.00 13,000Pittings & AccessoriesPower Transformers EA 1 253,000.00 253,000Lighting Arrestors EA 3 11,910.00 36,000High Voltage Disconnects LS 1 10,820.00 11 ,000Subtotal $ 334,000Contingencies - 20% 67,000Total Cost, Switchyard $ 401,000TOTAL COST, POWER PLANT $6,153,000TRANSMISSION PLANTStatus Switchboard LS $22,000.00 $ 22,000Contingencies - 20% 4,000Total Cost, Transmission Plant $ 26,00025-37
Table 25-H (Continued)UNITFEATURE OR ITEM UNIT QUANTITY PRICE AMOUNTPERMANENT BUILDINGSTransmission Maintenance LS $92,500.00 $ 93,000Bldg (Remodel Extg Bldg)Machine Shop (Metal Bldg SF 1,200 125.00 150,000w/S1ab· on Grade, Complete)Subtota 1 $ 243,000,Contingencies - 20% 49,000Total Cost, Permanent Buildings $ 292,000UTILITIESWaterline, Sewer1ine, Forced LS $336,000.00 $ 336,000 .'Main & Seepage PitElectrical Service for Lift Station LS 14,000.00 14,000Subtotal $350,000 ,-Contingencies - 20% 70,000Total Cost, Utilities $ 420,000·'CONSTRUCTION CAMP FACILITIESr'Provide Lodging, Food & MD 45,247 ~ 70.00 $ 3,167,000.Camp ServicesTransformer & Electrical LS 1 34,000.00 34,000.,ServiceSubtotal $ 3,201,000Contingencies - 20%640,000 .'Total Cost, Construction Camp Facilities $ 3,841,000TOTAL COST, CONSTRUCTION ALTERNATIVE PLAN I I I $49,043,000I'25-38
DD'A(I'le OCIANLOCATION MAPCVICINITYMAPSCALE IN MILESo • 10<strong>CRATER</strong> COVEXDISPOSAL AREADOCK;L-CONSTRUCTIONCAMP FACILITIESxELEVATIONS OF TIDE PLANESLOWER LOW WATER AND PR(),JE~Tr DS~TEUEML RiVER REFERRED TO MEANARE AS FOL LOWS:MLLW PROJECT DATUMHIGHEST TIDE (ESTIMATE)MEAN HIGHER HIGH WATERMEAN HIGH WATERHALF TIDE LEVEL (MSLlNOTE:MEAN LOW WATERMEAN LOWER LOW WATER~~~~l~T T~~~u~ESTIMATE)ALL ELEVATIONS SHOWITH RESPECT TO PR~~Eg~ DT~TESEPLATES 9 a 10.22.5 11.415.9 4.814.8 3.78.2 -2.91.6 -9.50,0 -11.1-5.7 -16.811.1 0.0PLANS AREUM, EXCEPTB........-_...U.S. AMlY DIOMER DlSTNCTc.-sOO'EJIGINEEIISAIIOtORAGE. ALASKAt-::"_--, ...Ja. m SNETTISHAM PROJECT. ALASKA------J..___ SECOND STAGE DEVELOPMENT.._ <strong>CRATER</strong> <strong>LAKE</strong>G~K+.51 ~oeoLOCATION AND VICINITY MAP__ ~o ~~~~~j-~PITR~O~JE~C=T~G~E~N~E~R~A~L~P~L~A~N~~~... ...... SCALE:~ =- r..~A..::S::....::SH=O:.::W:.:.N=----1.~~~iiii'!ru~ru z~Av9 84_-.L- ..A5 4t2PLATE
52o<strong>LAKE</strong> SURFACEEL.1019oSECONDARY----~~\ROCK TRAP-I- CJ-PRIMARYROCK TRAP8 <strong>LAKE</strong> TAPCPLANc1400BAIZOO~AXIMUM HYDRAULIC GR:~=======--==-===SLOPE 0.0061019' (MAX. POOL)1000EL.IOZ7MAX. HYDRAULIC GRADIENTMIN. HYDRAULIC GRADIENT ATz 820' (MIN. POOL)EL.BIISURGE TANK '.765'0;:: ~~~~--~~----~~~;;~;;;;;;~~~~;;;;;;~~::::::::~-=-=-:-:-~------__________ .____________________________________________ BOO~M~IN~I~M~U~M~H~Y~D~R~A~U~L~I:C~G~R~A~D~I~E~N~T~ _______________________-=_=_=_=_=_=_=_==_=_=~~----__1BOO ~...>'" ...J'" 600400ZOO0-00PRIMARYROCK TRAPINV. EL. 761.55~OO 10-00 15:.00 20~OO--====== ;::- VENTED SURGE TANK ~~ .. ISLOPE. 0,'2437. J 40030!OO 35~00 40-00 45+00PROFILE200' 0 200'IISCALE' ,'. 200'50-00 55-00........._...JeL~~--~Or.-.------~GEKFINAL ROCK TRAP"'I+"' '" :000_............. _"""'-60-00 65!00 68+00mSNETTISHAM PROJECT, ALASKASECOND STAGE DEVELOPMENT':t::-"? <strong>CRATER</strong> <strong>LAKE</strong>POWER TUNNELPLAN & PRORLE-.1"= 200' -~:!i!~~L==~-;;;;;;---------1 ::=-1-------------1DIwwIng 1-8NE-88-0e-Code; 18-03/1___ 0. __ __5 4 3 DESIGN. MEMORANDUM NO, 26 PLATE 2tBA
~ ________5 I 4I3 I2EL 126SI 1D1200Maximum· Grad ienfH droU / lcD11001075~EL. 1080~?"EL. 759,-roo,......Min'/num H.ctroulic Groc(/enl600EL. 597... -Cf...'" ~~~f::~'" ~500400Ground surrace-C+-B300cOO~II~B/00-+__________________________ .,............~~~r--o66+00I67+00 68+00 69foo rofOO7/-1-00ITZfOO731'0074-1-00 751'00 76+00A~~;III59+00 70+005 I 4PENSTOCK TUNNEL PROFILEScale: 1"= 50'-0·1I II7/-1-00 TZ+OO 7.3"00....,Il!! I I I74+00 75+00 76+00PENSTOCK PLATE THICKNESS PROFILE1ASTM A517 St
54321D~PATTERN AN~ SPOT ROCI
5432oo6' ¢J A 517 .steelPenstockStiffener rin30 n ql l0C4tlon fb kckf"'rmin.td IfI tile F~/c/Exisfin9 £x.cq,vq+,on(To be abandoned)T r TAnchor RcdS----~L,~r=~J::r----------~~~~I I IcACCESS ADIT/PENSTOCI( TUNNEL LONGITUDINAL SE.CT/ONScale: i" ::=-/'-O'~c10'-0"ca'-o"Tunnel10'-0'6'-.3".------_+_~ TunneleKcol/UfionElectrical tCommunication {i{}t!5stiffenerrin9Penstock/' Tvnn.!!1£i
5432/DDMACHINE SHOP ADITSLOPES UP liT .IIPPROx.6 % GRIIDE TO MAINACCESS .II0lT\~b '-;:;,WATERTIGHTBULKHEAD ~wrrH VeHICLe. ~ACCE5:I COORccACCESS ADIT PLANSCALe: /'=30'-0"ACCESS/PENSTOCKTVNNEL(NOT sHOW;f)FOWEII:.HOUSe8/7+00/6+0015rOOSTATION14~OO'3~OO/z~oo1/+00 .... bot...........0... ApproyedACCESS ADIT PROFILESCALE: '":30'-0"A543tSCALE /N ~EeTo 30 608::.AL-EI'. 3O~O·1-::-"'- ... -,-0,,-.-----1EEL--mu.s. ARIIV ENGINEER DI$l1DCTCORPS OF ENGItEERSANCHORAGE. ALASASNETTISHAM PROJECT, ALASKASECOND STAGE DEVELOPMENT':t::;.:;::' <strong>CRATER</strong> <strong>LAKE</strong>~"'1!-b'/J( VfJlJ2- Drawlnrgl- SNE _ 96 _ 06-19-~~. Code: 03128 --_TUNNEL ACCESS-ADITPLAN & PROFILE..,-number. 1--------1.._-DESIGN MEMpRANDUM NO,26 APPENDIX "0" PLATE 6A
54 32DEXPCH1'5.IOn Joint-Bar .3 -J Hartz. IiiJ Ii" o. c.F¢ Rod Veri. (i) 4" o·c.DTemporar!l parfionof frashraclr "...":." ~ ...........75'-0"PLAN AT lScale: 1° = 10'-O~IC:" l' DrainPermanent p?rtionor frashrack/./\I'\ccNot""E~fric.q/ qnd co':'",J.JncqfJon line'5, nat ~hownJrl.¥} throJ./gh Q vfllidor eXGC/'v'f:lt~c/ In tlJt!- f(jnl1~1I/)verf. The exqct /OCQfIOI1 fo ~ d~f~r""Mtd.R .. rwvqbl .. F
5 I 41321Dr-CB-+-.-.-qio •.... v., - -' on~30til '81-'O-:'!'...Jz @ «~ u ::l\!ll O·~~\f'o- vr0007' -10' C.C. END It: S. ! VB'~ 1'-3' 4 SPACES @.- 1'_ 4'· 5' - 4'1'_3' :1':J'SEAL•:: :: :: ::":, :: :::: :: t--6-....o.L.---I :: -'i. 0 ~O· ,~,IT:1'I II 11 II C r'T' _II II II II IIf-'--:--f---I II I, II " " t--....,,--'-I.... =;R"J==Flfi======fll=~== ... == :?- ======f~F===== ::= =='=;~='F" " II II ::',' II CONT. III II: III II VERT. III II BAR__ :: II II:: II -... II :: ::t-'------t ,I " II I' t-----I " t----.L-II1=-===== l1oJ=:::'===fIl=F==::',\= If/===== .. t=lf~===== ~/== ... =.&,II " II "CONT. Il[~ II SKIN It. " II.,'I". 1\II HOR. II\"IIII"" I' II II "" " II II II1-'-----1 00 " II " I, f----'-I1===.===== :?1="=====F\l= ::.==:!=~~t======Fll'F===== -lFF===-==:t-r-----t " II II II "II " II II II" " II II ""II"IIIIIIIIIIIIII1\ II II IIf-L----I " II " " 1------1 " t---...L...j•11 ~('--!.i' SEALF'" = = = =F~ ~=== ... = ~ 1=====::. if i="== === I"~ f"===== ~ )====::.-:: kT i5 •['J"II " 2' TYP. "11II I.II" II II"" II /I"II II 1\ 01'-"1-'-"7""---1 "" "" t---:::-....L.-J ,1 "---'t _ ol~=...,r'-=;~.)-------;T=== =. Fr=== == F(,::::::~ '':;T:F: r:"=='"-= '"('~ 'J ""1,., II"",· 1\ \I" II II ,,\I "'to f--u---I--:: :: :: 1\ :: l. :: f--..."r.-,._; 0 ~~~~o~A±'::o~~~~o~~~~o~~~~~~~~"~~~:~:::~~o~~:~~~o~~~o~-(~~~BB~~o~~c--~~·--J , ·J·SEAL....) ':".,.. '~END~~L.~7~·~.~I. ____________ ~5~S~P_~_C~E~@~I~~=4·_.~6='-~B~·~T~Y~P.~A~L~L~S~ID~E=S~ ___ ------.~i_.-7-·_.~tENO It.ELEVATIONSCALE:I·J.:'·,'_O"2ENDIl.\~ \ ~Tl i: IiI. II IIIi:! II iiII IIa ~ "" '! Ii [~BA~\STIFF TYI:' +iiII" II" Ii""'----:i "IIII"11rSTEEL STAINLESSROD-B"'~ j2t~'~"--""~ri~~~~ld'~-4:::!....4 ----jL J I I rh ~\.~ -- - , 1t---'--T'i"I~~_ ~~ :: J ~ l"-.i"1.:..::tl'jOfrl ~I'----------.-UPSTREAM 1GATE FRAME../I I I 'I I'\jL~tSECTION ~ fo'SCALE:6"=I'·0· ~-----STAINLESSc'.......I".......I....-SCALE IN FEET0 ISC.4LE: IN 1/"cIfES0 c' 4' 6', , ,SCALE IN INCHESo ,- c?" 03"I I I IDcBr-A~~iENDIt......qy5,;.... ,--jIB'-O'CONT.HOR. )4rt..ENDIl.~...---; iort"'-~--- -,-----~.t"1\"2"I3'3tRUBBER 'J' SEALSOLID BUL82SymbolDat.u.s. A_V ENGINEER DISnUCTCORPS OF ENGINEERSANCHORAGE. AUSl'tAApprovedf--00 ........, ~ SNETTISHAM PROJECT, ALASKAt-;::=J-;:-:B:-L ____--j IiiIOI SECOND STAGE DEVELOPMENTDno ....., ~::.::.:::::- <strong>CRATER</strong> <strong>LAKE</strong>WOODARDS~~~' LTUNNEL PLUGt'~;:H'=~STI="",;,,-.::"'.E=c.,,--r-t:=:--_B=-=U-,=L:::..:K:.:..H'iE~A=D~D'lE,~T~A~IL~S~ __... lEa· ~. -'"'AS SHOWN .. ~~ , D£S.~~·I--::-:::::-'-=-';=:":':"':''----< nu";':;;-r------....r.=~~---j D"~'7 II- v A B Ac ~"1'-~£ ·.··~·M r.IHh~dtJ~~~~~~~~~~·____ 0. __~ Code:I-SNE-96-OS-I9-
D'3.i-5 4 3~A K £T £ RR AC ,,0~ ~zL'
5 I 4 I 3 I 2D" rAPPROX. LOC::"* OF HOIST-( ----?e ~ANCHOR IN ROCK ~~\ .ACK""Ul !.INe1-__ ·""K!IA... _ _ _ .... e - - -------- -- - ---~~,\ £A_8IROCkVl~~APPROX. LOCATION OF HOISTDIS
543 2o1--_____ -'p~R!'.IM'!A~R'!:Y~RO'!:C'e!K'___'T.'!R"_A'::P.:. ~6:!.4' _______ +_---T~R~A~N-"-S'..!IT~IO!CN!.:.:..;3"B'--· ___~.'"g...,.,__-,PO"W.."-,,ER~MOreS;1. AOOmONAl PRESSI..R: ~ TO EE LOCAlED AT STATK)N 10 .. 70 Net AT8EAYICE GATE (.AP'FIRO)(. STA.. 1'" "00). FOR MOtITOANG <strong>LAKE</strong> T~' IElLAST2. FWW. ~11ONOF 1>£ <strong>LAKE</strong> TN' LOCATION IS DEPENlEN'T ON THEIt-STU ROO< CONDITIONS t-KJ -.L BE MADE If( 1>£ FELD.3. TlWlHlAO< TO BE PUT If( PlACE AnBl <strong>LAKE</strong> T lIP BLAST AHO BEFORE POWEROPERAllONS _oNOTE' BAR SPACING NOT TO SCALEFOR TRASHRACI( DETAILS SEE PLATE 8.cPLAN10 '"..,IcSCALE IN FEETI~" JO'.O"BB...........DncriptlonsU.S. ARMY ENGINEER OtSTlUCTCORPS OF ENGINEERSANCHORAGE, ALASI(Ar.IIP.II SNETTISHA'" PROJECT, ALASKAIi;IiiI SECOND STAGE DEVELOP"ENTJ---~.Jl>~-----l ::~ <strong>CRATER</strong> <strong>LAKE</strong>At-------,.-~..., <strong>LAKE</strong> TAP AND PRIMARY ROCKTRAP PLAN AND PROFIlE543t2AS SHOWNDnwIng 1- SHE -96 - 06Cod_: ~ -0 4____ 0' __DESIGN MEMORANDUM 26 PLATE 11
----'s43 219' -0"DTRASH RACK<strong>LAKE</strong> TAO\..:oLUG TOBE REMDESIGN LINESECTION. ~I-.,""', 8 ......SCALE, ,"·,0',2 :-1PRESSURE CE:LL *3TRASH RACKDESIGN LINE8SECTIONDII 12SeE PLATE 4 ~iECTIONNOTE: POWER TUNNDETAILSIIlIm.:. LDCATEn AT STATIIJj 10+70SSURE CElLS 1P BE1. AIII\TI~\~~R!JX. STA. 1Q+{X)). IS DEPENDENT 00 THEVICE GAOF THE I.AI:£ TAP LOCAT:~ THE FIELD.Ao~DAT SER-2. FIIW. ~~I~~~~I!JIS AIID WILL BE I'IAOC CIN(; BLAST AHD BEFOREIN-SITUAFTER I.AI:£ PIERTO BE PUT IN PLACE3. TMSIl~f1ATI!JIS BEGIN,PlIlER vnc8~~~ZlRC~I~~COVER FOR AlAROCK£L.~ 780AIR CUSHIONFILLER PIPEWIRES l~:~EVICEMONI'Tt)1---- --"\ AIR FILLE R PIPE .. IGNITION-7 It----- WIRESTEA SURFACE ~ IIIIDETAIL"ASCALE: 1-· 5 \ II 12s' o· ...'!w ~~ SCALE: I".S-O10'543 2t
5 432DcT5 6>< 3 ~T- F'i2AM"Ej..- -'l'Xn;:HSIOI-1 Fi::>f2.COU~wr: l;U PA::>RI°1£- FT. PIA./ ___ IHTAKf- Ol'Z1f1 a Oli!11II11I1 i(i!llt/Ii1:1 I I ! I' t-,1'1 I''I...... , I"- II iii" "-"Q, I'i, !:\"'0-\II' ,~10I I) I' I' I'i II I )1\I ' i I\f:~=-=---- -= -= ~ ~ =-= ==- =:c 'l~(, i% J II ~ II) j III., ,I'\!I I, ':: / I11IUl'I~: A I \ ~ : II! ':: ;' iii\\2' "- " I 1/I'il0 ,ilill"'-ll)! ............. =------.-~~,..-1i!: 'i Ii~iI II ii Iii! 111~: Iiii'..--- LI---TI/
5I 4I 3I2 Io-cI@;IIII8ulkhead~ IIContact grouted.10"~G'0\(~II10'-0"i'r,,~.,,10Co,'0,~SECTIONScale: 1"= ,J'-ON/0~~YE)(cGvcr/ed fO~'\. \open bulkhead \~~-' J~D.'0,-
5432Brtdge craneRemovableCOYer fOr hn"k)""iOrl-~Dr .~t~==C~~~~~~~Access 4dif2-2'-0' ¢ Air venlsRun to loire access add podolRemovable sl
5432DIf J '.3" ¢ --1r-",",-IF=ji;\, -#K-6'-10"~/"-lljNPT"deepDrill and reum i' fiJr FN-Zfit ond provide // bronzelock pin (TYP. all capscrews)Yerf. /eM sealfs~#SECTION 0Scale: 6": 1'-0''"stemleafsealRingDcBAPLANscale: In; 1'-0'I 1000oIflSECTION 0Scale: I"" 1'-0"_JL- ____ ,Lr=-=-~-~_ti_1Q__ ll_-,,-----,'- 11' -rr=!F-"----n-I1 II [[ II :: II IIII II II :: II II IIII II II "" II II=»====~=~~~=~=~====~~-,~II II II II II II II IIII II I[ " 1/ II II IIII II II Ii \: II II II=»====-=M==I:=~=~=~====~~=,1=:: £.!L-:::::: ---D.i" :: ::=~====~=~~~~~=~====~~-4~II II II II IIII II II II IIIi II II II II_ ~ ____ ~ __ ~~~~_~ ____ ~L_ L- rr - - - --n----=--=:;;=---=--=::!1-- - -,,- rII II II II II IIII II II II II IIII II II II II II_~ ____ ~ ___ ~ ___ ~ ____ ~L_ LrII II Iii" II~" IIIi /I ~ II II-rr----~---~---~----"-=~====~===~===~= ==~~=J~/I II II II II IIII II II II II IIhII_____II II II II II~ ___ ~ ___ ~ _____ ~L LIT rr-~---"T1---_n---__n---_n--\, ,Ii 1/ II /I II II II \\ III II II II II II \i~ __ Jj ___ Jj ___ " ___ JJ ___ ~ ___ ~5UPSTREAMELEVATIONScale: 1"- 1'-0"SECTIONScale: ,y': 1'-0"\).1~•~~(!;) .'~~tl "~~END ELEVATIONScale: 1"= 1'-0'tellEISial ead IE ror ribTO pass Throt/flo@Ifl,: \)1'",C?~ ~ I.....1-6~~~SECTIP': 0Scale: I ; 1-0GATE LEAFBarlJ
543 2ILLER AND BREATHER CAPoOIL SUPPLY TANKoINDICATOR SCALE PLANSCALE: 6": I~O"PISTONTHERMALRELIE F ..-/VALVEPRESSURESWITCHSTEMcPOINTERL ''''ITSWITCHAT /0,0'MILE. :THE LETTERS, FIGURES, 'ANDGRADUATIONS HAVE BEEN CIITIN THE PLATE, FILLED wi THBLACK ENAMEL ON WHITEBACKGRoUliD AND BAKED.SCALE PLAN DETAILSCALE: 6": /'-0"CYLINDER~cSLOTW/BEVELED6ESL IOIN6INDICATORRODBLACK-....;...i_~-_~__.L ~_: I~/ ~l25 HPELECTRICBGUIDE TUBEREAR VIEWSCALE: 12 "=-!'- 0"[§g---~-:-- -:', I ... ~ ,I .J ________ ::'-!JLIMIT SWITCH ATMI67'(OR 0.2")POINTERSCALE; 12"~(- 0"HYDRAULIC PIPING SCHEMATICNTSOPEN SOCKETr---' CA 8LE F! TTiNGB0GUIDE SUPPORTSCALE: I ": I~O'AHYDRAULIC PISTON POSITION INDICATORSCALE: I"=: (-0"__ LIFTING LUGS~L-_____ G_A_T_E_L_E_~F ~U.S. APMY ENGWEER OIST'RCTCORPS Of' ENGItEERSANCHORAGE. ALASKAAHorST CABL E POSITION INDICATOR DETAILNTSGATE POSITION lNrJrCATORS aHYDRAULIC CYLINDER~'!r-p.~, -'~;;ro~C"~ 1--------1-::::.-i--------1___ 01 __5 43t2DESIGN MEMORANDUM NO. 2.6 PLATE 17
Dc54p r n\\\\\32DcBLIST OF MATERIAI_SITEM DESCRIPTION OTY STOCK SIZE1SINGLE HELICAL GEAR REDUCERS, OVERALL RATIO 20670:1 Z RATIO 15911, 130:12 REVERSIBLE MOTOR, 1750 RPM I IHP 208160133 GATE POSITION INOICATOR TAKE-UP REEL AND LIMIT SWITCH I4 OVE RHEAD MOTORIZED SHEAVE ON BRIDGE CRANE I 10 TON CAPACITY5 ELECTRIC ALLY RELEASED BRAKE I6 FLEXIBLE COUPLING 27 DRUM SHAFT, UNS 610350 CD I 6':.:L X 72" L8 DRUM I 3'
•5 I 4 I 3I 2DT~~Berm~'\J"::t.....\ApproKimale eXlsimq~ /grade v/////IzJ-Berm //DcEL.1035?'O' /~[:.J ;,1~/ I 1'0canoP!J~~./ • -Z--I'~ x 14' Rock bolls ""\0 :t(') / e (jj) 5' c -...f?\'''''~/\IV-- o .. ~~-r-/ cPORTALELEVATIONScale :if"= 1'-0"(J o (J 16 24..£L. 1035c'-o"_ S'ope-O.g?5 I~vFill rrom cufs (Ta be'" graded and compacfed)SECTIONscale:i-~ 1'-0"88-1/ '-0"TYPICAL ADIT SECTION 0Scale: 1'= ;'-OMI! 0 C 4 6_...............DateAppro_"~-~-----------~-+--~~u.s. ARMY ENGINEER DISTRICTCORPS OF ENGINEERSAMCttORAGE, ALASKAA5 I 4 I 3tI 2_ ..' r.IIr.'I SNETTISHAM PROJECT. ALASKAI-:---__ J_B_L--j IIiiIOI SECOND STAGE DEVELOPMENT A-_Or. ~:::;:.:::::o <strong>CRATER</strong> <strong>LAKE</strong>EELGATE STRUCTUREACCESS ADIT & PORTAL~.~ ac.a.: A8 SHOWN ~-_... -z7A"5~ -. f--------I-"'''7!1::t):,:'}1(ntL- DrawIne 1-aNE-,.-oe-~.""DlY. Code: 1'-01/10...... ofDESIGN MEMORANDUM NO. 26 PLATE 19
5J 4I3 I 21DD-PLAN li? OF POWER TUNNELSCALE: 1--10'APPROXIMATELY 1M FEET TOBEGINNING OF GATE STRUCTURETRANSITIOND£SIQII LINE. --/, fr\,--'-I"'I-44
54321DTUNNEL PLUGD, ." '4'NOTE:REMOVABLE FAIRING WALL WILLALLOW ACCESS TO ROCK TRAPAND POWER TUNNEL.REMOVABLEFAIRING WALLI3'HIGH)FAIRINGALLPLAN AT
5 I 4 T3 I 2IU)'-O· DIA. SURGE TANKSTEEL PIPE ~ tD~:--.,o;.,Dr--- DRIFT TUNNELC+, ~ "'-0·1 1~ B I -r--
521ooGATESTRUCTURESECONDARYPlOCK TRAPC1400/350PLANc1.300IZ50IZOOB1150/100~ 950~;:: 900~850'"~800750GafeStructureEL 1038 Slope Slope-~ ~~Q~. 00~5====d,~==::'§O~' 0§O§'6~====~~E. 035Crot", Loke EL 1019 '---I- ~-EL.I040TroshrackSt'condar!lRock TrapSlope0.005Sur~ Tank~Ir)l 1150-1 /10010501000950J 900850I 8007501050f.-~ 1000f.-~IJ;~~i::~'"~B700Rock TrapFinal fibck Trap 7005 foo101-0015foo ZOfOO Z5fooPROFILE,loo' 0' lOa' zoo'•••••IGRAfWlC SCALE: 1"-100'-0"VERTICALzoo' 0' zoo' 400'...... ! IGRAPHIC SCALE: I', ZaJcO"HORIZONTAL45foo 50+00 SSfoo-6OfOO 65"00-._..........-...AUNLINED POWER TUNNELMINIMUM ROCK COVERmu.s. AIIIIY ENQIIIEER DISTRICTCONI'S OIF ENGItEERSANCtIORAGE" ALASKASNETTISHAM PROJECT, ALASKASECOND STAGE DEVELOPMENT1-::-_---, ... -----10::::;"'- <strong>CRATER</strong> <strong>LAKE</strong>GEKALTERNATIVE I PLAN & PROFILE1--______ -1- -~~~~~:::'~h_;;;;~A;!S....!S!.!H:!.!O,!JW!!!!N---j =-:1iQ"1{Jt'- ~~031~5 4 3 2 DESIGN MEMORANDUM NO.26~------~--------~------~----------~---------~t----------~--------------~~·___ af __PLATE 23A
54321D~=:!'!::=::::::!!==~=±::w±=::::::!l==l····ELEVATOR: .• '--~ ~~"'~:;;;::"':;-L -+-----iIT -+--+--+--- +--+--+-1-...... : ... .t.,"ACCESSELEVATOR1000· CAPHAT-=-H_~j ___ "'Q~ .. ........(~" LAaDER _--.111:+-____ _\ -; -VENT...... ,-: ,----'" ".> 1:. ••• :': •• '.....•13 VERTICAL SIDEWALLACCESS ADiTSTEEL GRATINGFLOOR24'-0·B.EV. I04()?..D[LEV. 1040.0C"AT ELEIJ. 766.0GATE ROOM FLOOR PLANCI'MIN.BCONCRETELlNING-----iLADDER70'-0·.. : ~'-- .,.~.~. • i! .... '":'" .' -: ...... , ,-., '%I _"", • ,.."\ ••----------'i. "aNORAIL ______ _HATCHELEVATOR'i'-.. -+-+--'--=
54321800---800POWER TUNNELROCK TRAPD700---700D600---600500-PENSTOCK, 6' DIA.-500cCONCRETE ----~400- STEEL PENSTOCK---~,..:...zo--400 ;:~...JWc-+BA,..:...ZQF~W...JW0-.,wz"~....w~...J...I6~OOI· 11l~300-zOO-If-12f-66+00I66+0067+00I67+0068+00I68+0069+00I69+0070+00I70+0071+0071+00I12+00PROFILESCALE,.'. 50'-0'I73+00PLATE THICKNESS PROFILEI74+00 75 +00PLATE THICKNESS SHOWN ARE FOR ASTM A537, CLASS :II STEEL73+00 74+00 75+00 76+00I76+0077+0077+0078+00I78+00...J...J;8a:w~.. w.. en+ 5CD","'0:~~en ...--300--200--100--0I79+00SCALE IN FEET~~~~-=_~O~==~50~ __ ~/qvSTA. 65+65 --L-SNETTISHAM PROJECT, ALASKASECOND STAGE DEVELOPMENT1-:-_-... --,- ••-,----I:::;:-- <strong>CRATER</strong> <strong>LAKE</strong>JKL~~·~.L;'~~~~JIII-. --u.s. ARMY ENGIfrEER DlSTllCTCORPS OF ENGIfrEERSANCHORAGE. ALASKAPENSTOCK PROFILEFOR ALTERNATIVES I & n~~~~::::~D~;;:_A_S_SH_O_W_N--j~~ _____ --i___ 0' __BA543t2DESIGN MEMORANDUM 26 PLATE 25
D<strong>CRATER</strong> <strong>LAKE</strong>D-+-GATESTRUCTURESECONDARYROCK TRAPPLAN,o· 200' 400'cPROFILE AT SURGE TANK<strong>CRATER</strong> <strong>LAKE</strong> ELEV. 1019 ~TRASHRACKGATE STRUCTUR'EPOWER TUIINEL. 12' DlA,SLOPE 0.00& ,I "1150" 1100," 151050SURGE TANK~t: 1000~FINALROCK TRAP~'"Z950"'""., ...".."': ...900 z0 Q.~~«850" ~ >.,'"'" -':: 800 '""" 750700B5-00 10+00 15->0020+00 25+0035+0040-00 45~00 50
5 l 4I 3I 226' - O·o. v . r: "r","L ,'- ~'M'N"}.rc1: yl-----15TON HO'ST~==~=====~~~==~o-.";" - 0' "'N- I---..':','~",HATCHc . ,'"II, -AIR VENT WILL CONTINUE DOWN APPROXIMATELY500 fEET ANO THEN RISE IN A DRILLED HOLEFROM THE AOIT TO ABOVE MAXIMUM <strong>LAKE</strong>ELEVATIONfl. 766cPLAN AT GATE ROOM FLOORSCALE: 1/4- • ,'- o·-+-,',SECTIONSCALE: 1/4"· 1'-0·A88AD' 1,Jf.-.,~~ ,I~,~ : I:I~YO' ~ M I,UN'T II i •~~r~~~~ __ ~E~L,~1~"~, "II ""I • II ,~, ~,.'II. " I 0 II 0',I '"I" .11' ~.,.,':lj'll '''.,oil'> ," II'I,> 'I' '," -II, '. ' I. ' I •, I ', I ' C'I ~--.' • 0' SLIDE GATE OP£N'NG.1 --"VI < "'.~11: Ll '". t) 0.. ~ O.•'~'.1 ,I •, ta. "..'" '~~7i'i"" SEC TI ON 1"':'\SCALE' 114', ,'-o,-\.....8 J5 1 413t_.-s' o· s' '0'GRAPHIC SCALE: 1/4"1',0"""",,ptIon.Iu.s. ANlY ENOIIEER DISTRICTCORPS OF EMGDEERSANCItORAGE,AlASKA_Or- ftIP.II SNETTISHAM PROJECT, ALASKAJBL IiiIiiI SECOND STAGE DEVELOPMENT1-::-_--,-..,-, ----I ~::::"'":" <strong>CRATER</strong> <strong>LAKE</strong>RDCf1r'mr:_L :.. ALTERNATIVE][ GATE~~~ STRUCTURE PLANS & SECTIONS~'If' ,_-, -..~. 1'4-="-0· Nt~DES. HR. a.te: nvmtMr: 1--------1~~bN4o-;=-=~:;:, '::-SNE-~----I -.. .fI 2 DEStGN MEMORANDUM NO, 26 PLATE 21A
521D<strong>LAKE</strong> SURFACEEL.1019\ [.~/"! '/; ,. ,I /'~ ..(DGATESTRUCTURESECONoARY--...--..\ROCK TRAPa <strong>LAKE</strong> TAPPLANMAX. HYDRAULIC GRADIENT ATAIR CHAMBER = 1128.4'c.sLl~~ ______ ~~~~~~~r-~G~A:T~E~S~T~R~U~CT~U~R~E~~~~~::~~~==~=-~~~~~::::========::==:===~~-======-~~~~ ______ =M~A_X IM~U=M~H=Y==D=R=A=U~L~IC~G_R_A_D~I~E~N:T~==::::====:::::::===~====~~==~===-~~~tl 2(FLOOR ELEV.1040.o11', SLOPE 0.006_____0£L.IOll4.6MAX. HYORAIJUC GRADIENTMINIMUM HYDRAULIC GRADIENTMIN. HYDRAULIC GRADIENT ATAIR CHAMBER '_7:...:3:..4:..:.~4~'_____0 00 0SECONDARYROCK TRAPCHAMBER~AIRSURGE TANKIzo;:::600 ~'" .....400200'"BFINAL ROCK TRAP0+00~+oo 10+00I~+OO 20+00 25+0030+00 3~+OO 40+00 4~+OO 50+00PROFILE200'. o 200'I I~5+00 60+00 65·00a_-SCALE· I·· 200'AUNLINED POWER TUNNELMINIMUM ROCK COVER_...SNETTISHAM PROJECT, ALASKA1--:,----:-----------1 .. ED __<strong>CRATER</strong> <strong>LAKE</strong>DrawN'" G£K ., ......... FIRST STAGE DEVELQPMENTt---------j ALTERNATIVE m~&.;"';'~d'- POWER TUNNEL PLAN 8 PROFILE_____~.~~~~~.~~~:~,~~~~_r_. _,_,~_.~,~~1·_' __2_0_0_'~~~ ____________ ~A543 2t....... _N ___ t_CeM: OVJ3 -___ of __DESIGN MEMORANDUM NO. 26 PLATE 28
543 2ELI 1.329.413000IGQS~t--.I()01150EL. 1128. 4-..;
ocB5.! ;.. '"L'---.---- - ~--~ -4 l 3 I.30'Removable sfl. grating~oy.er fOr bulkhead,.,"".,',- ."""\ 3C'
DDefad~01GUIdeshoeDetall--oI5__ 4_'-4i"C d ¥:5./~It: i ~Draln" Skin ;E.3'-.3!"HALF SECTION 8)~~0Scale: Ij'= 1'-0'4s'-lIPDo99in9 beamHALF PLAN3i"¢>HU. sockelneadlJdt WI/h nutand wmmpt"--r¢> Pin--~~~if' Side Oat-__ ~'-,;>1"¢ Rn//PI--~RollersDETAIL 0Scale: 6'= I~O"Seal2'Skin IEseali "¢ IIt''( sockethead screw2}'¢ Rol""rddS/de barr ¢ P/i'-_~'''''''f-If/xS;" Roller frack _~~~~~~~~~DETAIL ®Scale: 6"= 1'-0"DOu f to out of'rollerscI" Skin ~---~:nIi II Seal bar-i 'Seal rdainercB.Cl"~il(~lrj'"+------JiiDJ=============~========= ===================r-----F=====================l==================il!=============~=======~================= =J :1:It: i x 5-------1 III=====================~=================!I!=====================i=================1II:1:iiiI!:II:-GUIdeshoe1'-4"#"¢ lIex sockelhead ScrewSymbolJ"'-DETAIL @Scale: 3'~ 1'-0"SCALE IN FEETI 0~=-~~~'--='I'~-O~'~-----SCALE IN INCHESo .3" 6" 9' Ic',3"
5 432DDccSERVICE GATE AND BULKHEAD HOIST PLANSCALE: '/4""",- 0"BLIST OF MATERIALSr-!-TEM NO. ITEM QUANTITY STOCK SIZESill ,L~ "CIe"'- Go ...... REDvCONT, L I', It'1 1 RI-'It. Ft< ".,. ,lonNTA I I'd> , 2~'L1 2 fl...O~LE, lIE ...., A Z I'dJ ~ 3' (....13
54..321-cpBERMD>C\J:I:-0,br
5-- 432TRANS I TID" • 30'1~~~ ___ ~~_EP_LA_TE~3'~~~. __OtAM8ER DftIl;TOR ~~~tsl_TRANSITlON·20·:il~It;jTRANSITION- 25'3/4- PIEZOMETERDUCT ~:i~I~ZOMETER RING~~r:TA. 6S+00.He"JFLOWPLANSCALE: .- -10'-0·~UMENTATIOfIf,CT CARRYING N'~ AIR CIi.MeER.WIRES a PlPELIs' DIAMETER S~ItIiEII'MOOIAED/ • - ~ HORSESHOE---::6 \---1 ,\\EL.-140.004.0'·PENSTOCK TOENCASEMENT:!S' CONCRETE........... ",,,:::ENTRANCE .lOfTTRASHRACK~~iR PORTION.WITH TEMPORARYELEVATIONSCALE: '-·10'-0"COMBINED DUCTAIR CHTA~::LDRIFTI ASHRA()( WILLIJ'PER 1 OF J:rER INrTlALBE REMOVED OPERATION.PER tOO OF• R'tINFORcm CONCRETEf'DUCTDESIGN LINESECTIO~SCALE: ,-. 5"-010.I- -10'-0·20I'0 .=:=::l=====----li- lUI.,.S. ";::s~=.=- ~HORAGE,• DISTRICTJECT ALASKA- SNETTISH\~~~~EVELOPMENT1m SECOND CAKE m--:-:::-- I ':t::::" Clff~RNATI~~p ANDFINAL RO;K T1ASHRACKSECONDA~ .... tScaie:AS SHOWN ::!~543t2
543 2 1Dc_~ -~ 1I'-O"_~Fi-rr,":V''J 'Excavation lOr ~ __ i.>--, \0 open add bulkhead : i==T~~9 ~, \~ ~ ,.
8.'4I2 CISTERNSI r"-LAOOER~PLATFORM~4 WATER PlPE9 ~ 514- DIA.V - ~ PRESSURE 01 FERENTIAL GAGES3 I 2129.7'.VITAL STATISTICSMINIMUM AIR PRESSURE tOEM.\ND1 • '567 FT (GAGE)MAXIMUM AIR PRESSURE (REJECTIONl • 955 FT (GAGE)L~~UY~~:EEL orOE T '::' AT MIN. POa..l • r:s~FTFT'MAXIMUM WSEL (REJECTION AT MAX. POO..)o 173.1 FTMINIMUM WSEL (STEAm STATE)168.0 FTMAXIMUM WSEL (STEADY STATE) • 17Z..2: FTAIR YOLUME FOR STABILITY ANALYSIS • 51,000 FT'::~ ~~~ ~g:: ~~gc:o~""~~':~'S ~:~ ~!NOTE'.THE SURGE TANK DRAWING AND OTHER INFORMATIONON THIS PLATE ARE BASED ON AN 11FT. NOMINALD'-METAL COtiDUIT~SONK; EDtO DEVICEDJAMETER POWER TUNNEL.13.4'PLANSCALE~ '-·'0'r-EL te6"'_,.--_Lr--SMALL CONDtJIT CARRYINGWIRES TO METAL CONDUIT ~1--4~~'//~'~--------'Y'~BEL. I.I."~I--:-=:;:;-________________-n--SONIC EOf) OEVX:E+PLATFOR"'----fl1"11'-~LADDER_____________________ ~~.#.M'~~~~" _______ EL. I ....'I _________________________----j _______ EL.I.I..'~ El...113.1'c.... f--EL 155.0'---~-iiif=DRIFT TUNNEL ~~RANGE OF WATER SURFACE'E1" EL 166,9'EL. 163.8'_~'j,~[j~;L--------------:_------------===:;;;;~~;::=~I-::_:~---' "._______ EL. 183.8'~ ~~~ ~V/A'," I 13.4' .1BEl.140.0'wCSECTIONSCALE' ,--,0'f-SON It B:tI) DEVICEEL.I ••.• • /~AEL. 181..' __ / [ ~ACISTERNAIR CHAMBER CONDITIONS WITH ZERO FLOWTHROUGH POWER CONDUITGAGE PRESSURE IN AIR OiAMBER (FEET OF WATER)600 .~ TOO 7!5Q 800 8~ 9001025 ,-------,'----.,--,-----,----c----,-:----,_. -.Dot.Appro"eeI8A5r~~AL CONDUITSECTIONcSMALL CONDUIT___CARRYING WIRES ____---tw-1~ro """-" ~ ~~= U,EL "6.0'_I~~,('W.s;w 1 EL.IU.·SECTIONSCALE: '-.10'BIu.s. ARlilY ENGINEER DISTRICTCORPS OF ENGIEERS~GE,'ALASI
54321ooCCANCHOit UNE8-4 REO,D.(2 ... T BOW, 2 AT STERN)HOPPER BARQE<strong>LAKE</strong> SURF"'CE'"BSECTlOtIAL BARGESECTIONAL .... RQEBSIDE VIEWFRONT VIEW----Descrtption.u.s. ARMY ENGIfIEER OIS'TRCTCORPS OF ENGINEERSANCHORAGE, ALASKAA543t2SNETTISItAM PfIO.JECT, ALASK ...SECOND ST ... GE oevB.OPIIENT A~:::-- CR ... TER <strong>LAKE</strong>KE TAP CLEARING-AL TERNATPLANLAMSMELL METHOD-~!!i,j~Li!,~!!!l~o;;;;'-----1 ::.:::.-1--------1~,-,&_04... ___ of __DESGIN MEMORANDUM 26 PLATE 37
5 43 2ocPLANNO SCALe.3 '3 Guidesupport, TYP.steel pipe (Seh. 40)shrae k guide3 'i @J 3"0. c.P---Sf_) frussesIecorners)TS3(Seh.\;J'\i~ ....~ ....st"",,/ frUSS~0-x.3-~80)fROCk balfs20' /IZ'Dia,lntak.eI 2't-- -' i~-Ikb~\ / I"+ + -t + /+ /~-~ r.III'I SNETTISHAM PROJECT. ALASKAC.AME.I(O IiiIiiI SECOND STAGE DEVELOPMENT1-----107>-. ----'----.< ~:::-- <strong>CRATER</strong> <strong>LAKE</strong>EELALTERNATIVEPRIMARY TRASHRACKA543t2Code:I-5f£-96-0&f9-03I21""""""DESIGN MEMORANDUM NO.26___ 01_-PLATE 38
5 4I321oEL.IOI' VGEAR AND MOTORCONTROL STATION1038'ACCESSADIT_TO POWER SOURCEo41°/.\.O'?~·~S~~~~S, ""0(''1-, 'f'" ,, ,\ ', ,\ \<strong>LAKE</strong> TAP EL.BOOPRIMARY ROCK TRAPLcINTAKE BULKHEAD PROFILE AT <strong>LAKE</strong> TAPSCALE: 1".50'-0·f-ol,~--t22 SPA6\lI'-O· "22'c~I~!L1lz==ll=jrii==zJ.'=="9INTAKE BULKHEAD DETAILSCALE: I·· 4'-0·BULKHEAD OPENCABLE16'BULKjiEADCLOSECABLETRANSVERSE SECTION~ 12'-6" I 12'-6" t--------jBSHEAVE SUPPORT2'(1 WIRE ROPE (MARINE TYPE)CLOSEICSUtU~.8 LONGITUDINAL SECTIONSCALE:I"·2'-0·BA4.5' QI SHEAVEINTAKE BULKHEAD_ ~12'QlINTAKE..../"-//"/" "\ /\\\~~~~~~~========~======~~PEN :5\ IOPEN \ISOCKET \I\ II ', /"- "-...........--- --25..;.;SE;:,;:C:;-:,T:=-;IO::-=N..,.,.......,.,:-®SCALE· I". 4'-0·,I4it>NCONTROL STATION45'PLAN@,- EL.1038'GEAR AND MOTOR CONTROL STATIONSCALE' I" .60'-0·12'---'-----'/r---'---~ 0' 2' 4'-- jGRAPHIC SCALE: I". 2'-0'~ o' ~ I'-. jGRAPHIC SCALE' I" '4'-(/'DI 0' D' 10'"III.I::.-I::..t::::=~_~·GRAPHIC SCALE:lo,.,'-O·.' \000 __ O· I " IZ'GRAPHIC SCALE"',.'-O'3 2t---u.s. ARMY BGNE£R DISTRICTCORPS OF EHGItEERSANCHORAGE, ALASKA_... r.III'I SNETTISHAM PROJECT. ALASKAI-::-G_"'_M:-£_~ __--lliiliilSECOND STAGE DEVELOPMENT-.... -:c.:..""?' <strong>CRATER</strong> <strong>LAKE</strong>~ALTERNATIVE PRIMARYTRASHRACK-BULKHEAD~~~~:::JD~~~-~~~r------~_--_0'---DESIGN MEMORANDUM NO. 26 PLATE 39A
5 I 4 I 3 I 2 1
521DDCB1400~i: 1200«0....t)"'3 10000:Q.Zg 800«>"'...l"' 600400200PRIMARYROCK TRAP.,- /HILLTOPFAULTDH-IIISECONDARYROCK TRAP\" \ \\"PLAN,I\GROUND SURFACEQUARTZ DIORITE GNEISS,GRAY, LIGHTLY WEATHERED, HARDGENERALLY MASSIVEPOWER TUNNELTLiNGITFAULT\\ \\ \\ \\ \\ \\\\\\\\\\""\\\\\"\, ," " ,, \" \"~ \,\ \{ .,, \\\"~\"\'\ "\ \ "\ '" \ Bo.\ '\\ Bo.\ F •. ~, A.~"\ "\\\\zo;::cBAI'+00K)+OONOTE:1. TUNNEUFAULT INTERCEPTS ARE STRAIGHT LINE PROJECTIONSOF APPARENT DIPS. DIPS NORMALLY VARY. PROJECTIONSILLUSTRf'TE THE LlKEU HOOD OF AN INTERSECTION AT TUNNELELEVATIONS. EXACT LOCATION' OF INTERSECTIONS CAJINOT BEGUARANTEED.15+002~+OO30+00PROFILE9 290 '200'ISCALE' 1·.200'3e+OO_Ba.~Qtz.-It.,Fr.Occ.SI.Mod.HI.4to+ooCuortz diorlt. QneillGranodiorite/GraniteBaloltQuartzJoint. FrClctur.ShearOccCllionolSlightlyModeratelyHighly4e+OOLEGENDHi. 40"".F, Sfn.FeSCo.Ch.CI.Woo.50
543211400-)-1400D13!50 -1300-\ -1350) \ )))-1300D12~0-1200-1150-\-1250\)-1200)I-11501100-1050-...C :i0>:1000-> ""W..Jw 950-900~<strong>LAKE</strong> SJRFACE\lElEV.IOI9!CLIFFSIDEAWLTDH-I02I\{IfJIf (f{~{ II.. ~ ... -4--\--""""j1-1100-1050...:i...-1000 ~> ""W..J-950 w-900-B50-BOOcB750-P,.MARYROCK TRAPi:~: ==============~~===;;=f.~ tTUNNEL STATION POWER TUNNEL !, "- lSECONOARt ROCK TRAP ;;~~ Co.L---7~~~~-~B~+~00~---~9~'0~0~---~~~+~00=----~I~I+~00~----1~2~+OO~---~13~+oo~--~-.:r~~1~4=+OO~---~~~·OO7~0 _ ;<strong>LAKE</strong> TAP AND GATE STRUCTURE SECTIONSCALE: I' • 50'SECTIONASCALE: 1"-50' 4142-750-700-650BSEE PLATE 41 FOR LEGEND....................Description • Oat. A.pprovedA5 43tott o·!wow ...."" .d,-. sct'-o·200'r.:-_-_-----:.-.,----1
5 432DH-IOSIOSO)\D1000950TL.INIlIT \FAULTSEE SECTION @1&)0D1250cBo-POWER TUNNEL.SECTION BSCALE! 1-.50' 41900850zo800 5 ..~7507006506001200115011001050~\ \\ \\ \\ )SECTION 0SCAL.E'! -so\ \\ )\ \\ \\ )\ )\ )\ \\ \\ \\ \\ \TSIMSHIAN FAUL.T~. l~:':\ ' +'...-• ,POWER TUNNEL.. I IN'I. EL 301IZOO11501100DH-I061000950900850800750cB950zoj:900 ~-'W850IIOTE:l. FAUlT 11!TaC£l'T$ AlE. STMIGIfl LINE PROJECTIONSOF API'AAEJIT DIPS. DIPS.lIOIIIW.lY VARY. PROJECTIONSIllUSTMTE lIE L1w.I1Ql!l OF AI! IITEItS€CTIOII ~l TlJNIIIlElEV~TIONS. EXACT lOCATlOII OF lllEIISECHOIIS CNmOT 11£GUARNlTEED.SEE PLATE 41 FOR LEGEND--_.........750u.s. ARMy ENGINEER Dt$TRlCTCORPS OF ENGINEERSANCHOPtAGE. ALASf(AASECTIONSCALE: I '!IO'5 4I POWER TUNNEL• IN'I. EL. 3277006503t.td fIlow wi""-"', r.III'tI SNETTISHAM PROJECT, ALASKAl-_PA_._T ___--I1iiIiiISECOND STAGE DEVELOPMENT A- Or.JKL'/It:;:::'.'::" <strong>CRATER</strong> <strong>LAKE</strong>GEOLOGY. SECI.I.ONS .NO. 2F===~~-+~ ___ M==IS~C=Er=LLANEOUS....., 1"'50' .......~~~~~~o;,;;;----'----'-'--I ~ J-------IF ~:I-S.-96-01"Code: 01-0-".___ 0'_-2 DESfGN MEMORANDUM NO.26 PLATE 43
5 4 321D1100NOTE'1, TOOEVFAULT INTERCEPTS ARE STRAIGHT LINEPROJECTIONS OF APPARENT DIPS.VARY.DIPS NORMAllYPRDJECTlOHS ILLUSTRATE THE LlKELli100D OFAll INTERSECTION AT TUNNEL ELEVATIONS.EXACTLOCATIO!! Of INTERSECTIO~S CAtlHOT BE GUARANTEED.D1000GROUND SURFACE90080c\c700 \\~;----,--8ASAl.T DIKESB~ 600 \M )~ \zoii ,.....JIII400\))~LARTZ DIORITE GNEISSPENSTOCK FAULTSEE SHEE;T II FOR LEGEND_.0001!K>' o·"",'1~~'\ SEE PLATE 41 FOR LEGEND......... -........Oate Ap~200A100PLUGE"STOCKTUNNEL72>00 73
51o,:~.
5 I 4 I 3 I 2 10~~cAREA IN 100 ACRES QDRAINAGE AREA IN PERCENT OF TOTAL, 11.25 SQUARE MILES4 3 I~U 100 90 80 70 60 50 40 30 20 101300 I I I I I I I IliDO•-.0I-/-----01£L- ~6001....rHIGHEST ELEVATI N IN W~ ITERSHEI ""7I-~ V...~ v...0:I-.,j:! 04zr-c c-~ S'f°" ~'----- ~-----Q .,I--~ :>>U 01100r--............1100 a:z:....MEAN E .n7l"Vf ~~P< ----zI-- ... ~ ~~2>0 ....ELEVATION 1017~,t01 ~MAXIMUM POWER PO ~/;-..... ....... .... ~~:I 1000 1000 11.1 ::>-\0.... .... T\A\L <strong>LAKE</strong> S RFACE E L. 101 •0c.../0QC....g ~ cUw I- - z-. 5 100 ~DRAINAGE AREA IN a: ....SQUARE MILES ABOVE A GIVEN ELEVATION11. >~AINAGE AREA VS. ELEVATION ABOVE <strong>CRATER</strong> <strong>LAKE</strong> OUTLET... 900.ao'"V\....> 0..01.... l--...I- ~ I-800 100z'/~.......> -....700 700BIZOO 1200 ...V-..B-I I I I I I6001000 5 100 15 200 250 300 350STORAGE IN 1,000 ACRE - FE ETSURFACE AREA - STORAGE VS. ELEVATION CUIWa- - _............... D .....-Iu.s. ARMY ENGItEER DISTRICTCORPS OF ENGINEERSANCHORAGE, ALASKAA ;~~"", ~.m SNETTISHAM PROJECT, ALASKA SECOND STAGE DEVELOPMENT A-..., ~::::.:::- <strong>CRATER</strong> <strong>LAKE</strong>~w ""SrQRAGE~ELEV.l1.=-.~":: .AND -~EA ELEV. CURVES~.". ...---AS SHOWN . .L.. ..- --u~ ~'~-o~J~15 I 4 I 3 I 2 'DE~ MEMORANDUM 26 PLATE 46,t-af
5 4 I 3 I 2 I 1RESERVOIR ELEVATION - DURATION CURVE1914-1968RESERVOIR INFLOWS - MONTHLY DISTRIBUTION10501914-19681000i MAXIMUM1025 AVERAGED 900 MINIMUMDE~L 1000E~ 800r--V 975~ IAN 700T F r-- .---I 950 ........... L0 -------- ......... 0 600N ~W r-- .---925I ~I 500,----- N N f--900F C 400-\F .---875ES 300T ,--- r--850825\1 200100I gQD800C 0tm:J ~ CI I I I I II'll 20 30 40 50 60 70 80 90 100OCT NOV DEC JAN FEB MAR APR MAY JUN JUL AUG SEP AVERPERCENT OF TIME EXCEEDEDMONTHf--I--HEAD DURATION CURVERESERVOIR INFLOW - DURATION CURVE1914-1968 1914-19681040 80010208 I---- FA1000---I----- 1\980 I 600H .........E'-...... NA 960 FLD 0700 8500\"940I-------- ~ WN 920 I'-...I 400 ~-- -.-..........~ N....... ..... -...~900f--""EEC 300T 880FS'\~860 200 i'-.'\""840_~ 100 ~ u.s.I~y ENGINEER DlSlWCT......... CORPS OF ENGINEERS820 AIICIIOIIAGE, AlASKAI'--...800 0 \.SNETTISHAM PROJECT, ALASKA\).., m SECOND STAGE DEVELOPMENT A0 10 20 30 40 50 60 70 80 90 100 0 10 20 30 40 50 60 70 80 90 100 - ... r::;:-- <strong>CRATER</strong> <strong>LAKE</strong>I) \IV~ ¥ONTHLY INFLOWPERCENT OF TIME EXCEEDED PERCENT OF TIME EXCEEDEDl:r ...... J;lISTRIBUTIO.N& .ELEVATION DURATION CURVES~.~ ... --,uSHOWN~."':;'6L --~~.~- .--_I-!M;-M-CN-5 I 4 I 3 I 2 :lit! f~28 PLATE-47tCode; 01-0112.. -
5 432D~~.,00,.. .. 0700e .. oeoo.... 0.. 004S0~ 400IN360~ 3001II7lE:M.L aIMS III TltIS PlATE lIE. IASfI III TIE FilIAl f'OIjER1I£6IIUf\1Il STIIlIES _ITIt A IW(IIUI PQIER POOL EL£VATIIIlOF 1017 JUT ~ "1.llUI f'OIjER POOl EL£VATIIIl OF 820 FEET.M.L EL£VATJOIIS ME lASED III I'IIIlJ£CT MM.D2S0200lS010060010401020C1000.. eo~.. eoiNIN"40920.. 00~ .. eo.. eo"40.. 2031 MONTHCRITICAL PEROID~ 1\\ \ \ \ \ \ 1\ \\ \ \ \ \ \ \ \ \\ \ \ \ \ \ \ \ 1\\ \j \ \ \" \ \VIi\ ~~~\ r 1\ ~ '\\ II \ \ \ \ \ \ \ I 1\\ \ \ \ \ \ \ \ \\ \ \ \ \ \\ \ V \ ~ \V V V V\VV\I,V"\ \ {I\ ~\ \ 1\ \ \\ \ \ \ \\ \ \ \~ V \ VVVII1\I\\UVc"00BB1&17~IN18.., ...13121110co-.-ptiona De'e Approved~&t:l 7H8os..._0 ..SNETTISHAMu.s. .... , ENGINEER DISTRICTCORPS OF ENGINEERS_GE,ALASKAA3'"0WATER YEAR (OCT 1 TO SEPT 30)D.-"'" \)w.M.PROJECT, ALASKAseCOND STAGE DEVELOPMENT:l::-"""" CRA TEA <strong>LAKE</strong> -RESERVOIR REGULATIONYEARS 1914-1941A___ 0'_-5 43t2PLATE 48
5 432"'00750700660D.. 00~H660600460(l~ 400r!.360~S 300260200150100500.-rE:MJ.. t1IMS 1* 11I1S tiuTE lIE. lASED 1* TIE FIlIAL I'0IO_TlI* STlIIIES WITH A 'WUM POIIEIt POOl ELEVATlI*(If 11111 fEET AA) "IRllUI POIO.POOl EllVATlI* OF 820 fEET.MJ.. ELEVATlI*S fCE lASED 1* PIIOJECT DATIII.D1040C10201000.. eo.... 0~.... 0;.. 20iNr!. .. 00~ .. eo1\ ~ ~ 1\ r II 1\ ~ ~J 1\ \ \ 1 \ \ ~ 1 1 1\ / \ 1\ I~\ \ \ \ \ \ \ \\ \ \ I \\ \ \ \ 1 \ 1 \ \u \ V ~ \, \/ \ \\j~,~ \\ \V~ {~ r 1\ 1\ 1\ ~\ \ 1\ 1\ \ 1 \ \\ \ \ \ 1 \ \\ \ \ \ \ \VV \\ \~u~1\ 1\II1\ 1 \ 1\\ \ \ \\ ~ \ \\ \ \~ j1\ rU~'Vc.... 0.... 0 l620B"00''''1716115B1413121 110Ir!...§'"tJ 7H6..3A 2........- o.t.u.s. AAIiIY EJ«:i8IEER DtSTWlCTCORPS OF ENGINEERSANCHOIWlE. ..... SkAAppro,,"SNETTISHAM PROJECT, ALASKASECOND STAGE DEVELOPMENT'::;-- <strong>CRATER</strong> <strong>LAKE</strong>AWATER YEAR (OCT 1310)RESERVOIR REGULATIONYEARS 1942';;1968___ of_·_5 43t2PLATE 49
D5 I 4 I 3 I 2 1PENSTOCK DIMETER N FEETEClUVAlENT DIMETER-uu£D POWER 'fI..N.El....45 5.0 55 ~ 65 7D 9 10 11 12 13 14I I I I I I I II I I I ,.qres,I1. CXJNSTR.CllON COSlS _ BASED 00 SEPlEMlER 1984 ~350 r-I1100 r- 2. ALI. COST""'z~« z«UJc:J~I~a:« 100 r- -~ «B75 - 150 r---- s ....... Dot......- VAllE OF I-EADlOSS -Approved50 - 100 r-VAllE OF l-EADLOSSA25 - STEEL PENSTOCK V S. COST 50 r-0l.N.N:D POWER TlN£l...EClUVAlENT DIMETER v.s. COSTDn6rgMcI brsr£TllSHAMPRo.ECT, ALASKAO.~ <strong>CRATER</strong> <strong>LAKE</strong> Aus_eaooDnwn by;. FAST STAGE DEVELOPMENTV.H.S.TUNNEL AND PENSTOCKOPTIMIZATION I COMPARATIVE- COSTS~i1'~1-I I I I I I I I I I I I0~~ -... 4.5 5.0 55 60 65 7D' 9 10 11 12 .13 14 ...... ASSHOWN ..-ED- ..Iu.s. ANI' EMGftrEEA DlSTfUCTCORPS OF EMGDEERSANCHORAGE, ALASkA--PENSTOCK DIMETER N FEET EOUVALENT DIM£fER-U'.I..I POWER TlN£l...r..,1;. ~ ...... .1Code: -SM:....... l ...'l45 I 4 I 3 I 2 . DESIGtI MEMORANDUM 26 PLATE 50t---1'1'- Dote,'.L,
5 4 3 2EQUIVALENT DIAMETER - UNLINED POWER TUNNELo375oMOST ECONOMICALCONSTRUCTION COST MOST ECONOMICAL800 :m DlAMETER- - - --DIAMET/;/L ___CCONSTRUC~ COSTMOSTECONOMICAL DiAMETER 1. CXlNS1IU:lION = _ &.SED ON SEPIB&R 1984 P!EES- C2. AU. COST HAVE BEe< A>N.JAUZm 1S(l3 1/8 P13'I::eIT700 Z75 01SC0l.NT RATE.ICIES:3. TOTAl. = EQ..W. AV£IW3E. """-.I.\l. VAlLE OF I£ADLOSSPLUS AV£IW3E. """-.I.\l. COSTS.«--'~--'~.... 00B(/)II:600 2SO;;;;§C/)0aX~Xf!?(J)(J) 500 225 L.E
EXHIBIT 1INSPECTION REPORTEXISTING SNETTISHAM FACILITIESJULY 1983ALASKA DISTRICTCORPS OF~ENGINEERS(-
NPAEN-PM-CMEMORANDUM FOR RECORD 12 July 83SUBJECT:Snettisham Hydropower Project, Long Lake Power Conduitand Powerhouse Inspection1. On 21-22 June, an inspection was made of the Long Lake portion ofthe subject project. The inspection afforded the unique opportunity ofwitnessing the effects of ~O years of continuous operation of a Corpsdesignedhydropower facility, at a time when design is being preparedfor the second phase of the project. The attendees were as follows:Hod MooreJoe GianottiPete WilliamsonPat Gal braithJoe LeeakRoy CamaroDave MierzejewskiNPAENNPAEN-DBNPAEN-FM-GNPAEN-FM-GNPAEN-DB-STNPAEN-DB-STNPAEN-H-HYJoe WexlerJeff JohnsWayne RoweBruce MunholandLew GustafsonRon MeadNPAEN-H-HDNPAEN-H-HDNPAEN-PM-CNPAEN-PM-CNPDEN-GSWESMessrs. Gordon Hallum, Tom Spicher, and Ralph Alps of the APA wereprincipally responsible for coordinating and conducting the inspectiontour. The log of a follow-up phone conversation with Tom Spicher isattached as inclosure 4.2. Long Lake. The lake was down approximately 70 feet from the spillwaycrest. Tom Spicher indicated in subsequent conversations that the lakeis filling rapidly.3. Dam and Weir. Other than the presence of small pieces of woodenform still embedded in the structure, the concrete for the weir is ingood condition. There is a calix hole located approximately halfwayalong the weir and 20 feet downstream that is still open for a depth ofapproximately 30 feet.4. Diversion Tunnel. The diversion tunnel slide gate is still jammedin the gate slot in an open position. The tunnel could not be inspectedbecause a rock dam in the diversion tunnel outlet channel has caused theaccumulation of water to a considerable depth. The reason for the rockdam is unknown. From a distance, there does not appear to be any structuralfailure.5. Tunnel Dewatering.a. The bulkhead gate is not usable because the rubber seals arebadly deteriorated. The deterioration was likely caused by the dieselfuel used to prevent ice from forming in the bulkhead slot during thewinter.
NPAEN-P~l-CSUBJECT:Snettisham Hydropower Project, Long Lake Power Conduitand Powerhouse Inspectionb. The slide gate was closed and there was some leakage around it.There was a constant flow of water approximately 5 inches in depth outof the 12-inch diameter pipe used for draining the access adit drifttunnel. The source of water was primarily the leakage around the slidegate, as there was no appreciable leakage in the tunnel itself.c. The 8-inch bypass in the powerhouse system was used to drain thefinal portion of the power tunnel and the penstock. Draining throughthe turbine was stopped when governor hunting began and turbine speeddropped below 450 RPM, which is approximately the minimum speed necessaryfor lubrication.d. Dewatering of the power conduit spanned the time period from0800 hours on 18 June to 1400 hours on 21 June.6. Inta ke Structure.a. The intake structure was inspected down to the level of theslide gate bonnet cover. No damage or irregularities were observed.However, Gordon Hallum said that when power was lost to operate the sumppump, the intake structure dry well filled with water to the lake level.The level of water in the dry well seemed to remain in equilibrium withthe fluctuating lake levels.b. The intake channel and trashrack were inspected by three scubadivers. The concrete was in good shape, and the trashrack and intakechannel were found to be free of debris.c. The powerline to the gate structure is disrupted every winterand needed to be repaired to provide lighting to the gate structure forthe inspection.7. Power Tunnel..'a. There is very little dripping or leakage in the power tunnel andno evidence of distress whatsoever. The concrete and the rock are inexcellent shape.b. The entire power tunnel is free of rockfalls. In a few spotsthere are some gravel and silt deposits.c. The walls and ceiling of the power tunnel have a thin coating offine glacial flour silt adhering to them..'
NPAEN-PM-CSUBJECT: Snettisham Hydropower Project, Long Lake Power Conduitand Powerhouse Inspection8. Shotcrete.a. In a few places (approximately station 81+00), the experimentalshotcrete lining is peeling off in large chunks.b. At the time of placement, the shotcrete, which utilized approximately3/8 inch aggregate, was sprayed over rock bolt plates without anyreinforcing mesh.9. Rock Trap.a. The rock trap is virtually clear of any gravel, sand, and rock.b. Sediment samples were taken at stations 78+50, 81+00, and 82+78.The results are shown on inclosures 1 through 3.c. Rocks up to approximately 1/2 inch in diameter (may be larger)were found deposited on ledges and outcroppings near the penstock entranceapproximately 4 feet above the floor of the rock trap.10. Surge Tank.a. The surge tank was viewed from the drift tunnel because therewas 6 feet of water in the bottom of the tank.b. We were told there is no problem with rock fall in the tank.c. The surge tank appears to have been overexcavated at its base asrock bolts extend about 4 feet horizontally from the rock surface in thisarea.d. The steel plate for the surge tank orifice is covered with abuildup of barnacle-like deposits that can be easily removed by hand(not tightly bonded). They do not seem to have a detrimental effect onthe steel plate. The deposits appear to be a result of chemical actionbetween the steel and the water.11. Penstock Trashrack. Approximately 15 percent of the trashrack wasclogged with grass, with the bulk of the clogging toward the top of therack. Structurally, the trashrack is in sound condition.12. Bifurcation.a. There is considerable peeling of the vinyl paint upstream anddownstream of each spherical valve. Tom Spicher attributes this to poorapplication technique, probably because the steel was near 40 degree F whenapplication was made.
..NPAEN-PM-CSUBJECT: Snettisham Hydropower Project, Long Lake Powerand Powerhouse Inspectionb. No other penstock sections experienced peeling.c. A 0.1 cubic foot deposit of silt was observed on the penstockinvert just upstream of the bifurcation.13. Draft Tubes. Slight cavitation was noted at the pipe openings intothe draft tubes and in the draft tubes where there is an irregularsurface from welding. None of the cavitation is serious enough towarrant repair. Ralph Alps believes most of this cavitation took placein the early days of operation when there was low demand and low flow.14. Scroll Cases. The leading edge of the first stay vane showedconsiderable cavitation, with the remainder of the stay vanes showingonly slight pitting (up to .1 inch deep). No other damage was observedon the scroll cases. No damage was observed on the exterior faces ofthe guide vanes.15. Turbines. According to Ralph Alps, the turbine runner blades arechecked yearly and there has been a slight "frosting" on the blades butno cavitation damage observed.16. Instrumentation.a. There is very limited space in the powerhouse for an acousticflow meter. This will have to be taken into consideration when designingthe Crater Lake instrumentation.b. Tom Spicher indicated that all the piezometers behind the slidegate in the intake structure are plugged.c. There are piezometer rings in the penstock at station 94+25 and93+25 to be used in conjunction with Gibson tests. These piezometer1ines~ which enter the powerhouse near the spherical valves, should beused ;n any future hydraulic loss tests.d. In light of the condition of the upstream piezometer rings, TomSpicher is concerned about the adequacy of the study and report made byWaterways Experiment Station on the head losses in the tunnel. Thestudies were also made while there was a low power demand. Apparently,the people making the study were unaware of the piezometer taps in thebifurcation and penstock (referenced above) that were available and theconditions of the piezometers at the intake structure.17. Valve Room. The valve room has water dripping from the ceiling atthe location for the third spherical valve and the maintenance area atthe same end of the valve room...
NPAEN-PM-CSUBJECT: Snettisham Hydropower Project, Long Lake Power Conduitand Powerhouse Inspection18. Powerhouse.a. Generally, the powerhouse is in good contition and housekeepingappears adequate.b. According to Joe Gianotti, there appears to be less leakage intothe powerhouse now than 10 years ago, indicating that the rock seamshave tightened up a little over the years.c. The powerhouse crane is not connected to the standby powersupply, requiring a jury rig mechanism to operate the crane when thegenerators are shut down.19. Machine Shop/Erection Bay.a. Located in the erection bay are two lathes, two drill presses,one power hacksaw, a grinding wheel, several work benches, and toolbins. APA says they need this equipment and a machine shop space adjacentto the erection bay to fa~ilitate routine maintenance of the powerhouseequipment.b. APA proposes that a machine shop be built by enlarging the'Crater Lake power tunnel access adit with a drift tunnel that connectsto the existing erection bay. The drift tunnel should be of sufficientsize to allow a pickup truck to pass through. The adit would be used asthe machine shop area. In addition, an exterior adit door, lighting,heating and ventilation would be required.20. Tailrace. The <strong>Alaska</strong> Department of Fish and Game (ADFG) has put inself-regulating, irrigation-type gates in the tailrace to maintain anessentially level tailrace pool and to keep out salt water that wouldotherwise enter with high tides. They did this to provide a constantsource of fresh water for their adjacent fish hatchery. This essentiallyholds the water level of the tailrace above Elevation 11.21. Transmission Line.a. Gordon Hallum mentioned that the tower that went down a littleover a year ago on the ridge above the east cable terminal building wascaused by the failure of a guy. The guy has been replaced and the towerrepa-ired and reerected. Apparently, the damage to the tower was minor.b. Gordon Hallum also stated that APA spent approximately onehalfmillion dollars about 2 years ago to remove the tower at the locationwhere ~ previous tower was downed by an avalanche years ago, and movedthe adjacent tower toward the location of the removed tower; essentiallyreplacing two towers with one tower and increasing the two spans so thatthey now have no tower in the avalanche path. This has given them notrouble since.
NPAEN-PM-CSUBJECT: Snettisham Hydropower Project, Long Lake Power Conduitand Powerhouse Inspectionc. The APA line crew was checking the transmission line for looseguys, wear on insulators and hardware, and the general condition whilewe were at the site.d. Gordon Hallum stated that APA has waited years for BonnevillePower to receive fun~ing to run experimental tests on the abandonedtransmission line on Salisbury Ridge. APA intends to remove that linenext summer. They lost one of the towers on that line last winter.Much of the line still has the conductor on it.e. The new steel towers in the relocated portion of the transmissionline are almost impossible to see because they blend so well against thebackground, whereas the old green colored aluminum towers are morevisible.22. Permanent Facilities. The transmission maintenance building,formerly the resident engineer office, is partially used for projectoffice, storage of lumber, and other incidental items. Some rooms areunused. The warehouse building is being used for warehousing and maintenanceof vehicles. The double quonset hut, erected by the contractorduring construction of Long Lake phase, is leased to the ADFG. Theother warehouse on the lower level of the camp is being used to storetransmission line parts and hardware, with the partially assembledtowers lying outside the building. The old concrete lab is leased byAPA to ADFG, who use it as a temporary dormitory, housing up to a dozenpeople during the summer. The ADFG has three family homes erected nearthe dormitory. The APA dormitory building accommodates four twobedroomapartments for permanent operating personnel, plus a one bedroom apartmentfor Ralph Alps when he is at the project site. The other rooms are usedfor temporary personnel, sleeping as many as four per room in doublebunks.23. Access.a. Intake Structure Access Road - In reasonably good shape; waseasily traversed by a two-wheel drive vehicle after APA had performedsome maintenance and restoration work prior to our visit.b. Access Adit Road - The road and culverts are totally washed outat the Glacier Creek crossing. After some roadwork prior to the inspectiontour, the road was traversable with a four-wheel drive vehicle; otherwise,in good shape.c. Crater Cove Haul Road - The Crater Cove haul road has been cutin two places: at Crater Creek, for fish passage to spawning areas, andbetween Crater Creek and the borrow area. To use the borrow area orachieve access to it, the road must be restored with culverts in ~ccordancewith criteria from ADFG that NPAEN-DB-C has on file~ furnished byNPAEN-PL-EN. Other minimal work is required to restore this road to apermanent haul road.
NPAEN~P~-CSUBJECT:Snettisham Hydropower Project, Long Lake Power Conduitand Powerhouse Inspectiond. Messrs. Alps and Hallum advised that APA found it necessary topush material out of the boat basin channel at low tide with a dozer inorder to maintain navigation to the dock. This was prior to the 1982Corps hydrographic survey, resulting in the survey showing a deeperchannel than previously existed. The portion of the channel excavatedis located across from and between the dock and outflow channel fromCrater Cove. Apparently, Crater Cove outflow keeps the outer entrancechannel scoured out adequately. Barge traffic is possible at high tide.24. Maintenance/Repair. The sump pump in the intake structure had beenremoved and APA advised us that they planned to install a submersiblesump pump in its place.25. Power Demand And Sales.a. Ralph Alps stated that APA operated through December, January,and February with two generators supplying power for the city of Juneau,essentially drawing Long Lake down in accordance with the rule curve.In late March, the weather turned cooler than normal; increasing theseasonal power demand, resulting in the need for two generators inMarch, also. There was insufficient water supply to operate two generators,so diesel generation was used. The lake was drafted to approximatelyelevation 723, 19 feet above minimum pool.b. Ralph Alps also mentioned that APA is currently charging 16mills per kilowatthour. When the 10year rate freeze moratorium expires,the rate will probably go up to 28 mills because APA has to pay annualoperating costs plus pay back 1 percent per year of the original investmentcosts for construction of the project. The <strong>Alaska</strong> Electric Light andPower Company (AEL&P) is currently charging its residential customersapproximately 6 cents per kilowatthour. AEL&P's costs for generatingelectricity with their diesel units is presently running 11 to 12 centsper kilowatthour, which results in a loss to the company. Included inthe 6 cents charge mentioned is the cost of payment for the diesel fuel.Attempts are being made to apply a moratorium to the installation ofelectric heat in Juneau, thereby, reducing the increase in electricaldemand.26. General.a. The rate of growth of alderbrush and other vegetation on thespoil pile at the access adit is such that the spoil pile should not bevisible from the main camp and Snettisham Arm within another 8 to 10years.b. The project as a whole looks good, the maintenance and housekeepingis good, and the power tunnel, penstock, underground powerhouseconcept is an excellent one that should continue in use for many years.
NPAEN:=-Prv'I-CSUBJECT: Snettisham Hydropower Project, Long Lake Power Conduitand Powerhouse Inspectionc. Except for some minor points, the power conduit and accessoriesappeared to be in good condition.d. Crater Lake was icefree at least 2 weeks prior to the subjectinspection. This is unusual in that ice does not normally leave CraterLake until late July or early August.27. Conclusions.a. As applied in the Long Lake tunnel, the usage of shotcrete fortunne 1 support appea rs to be a fa i1 ure. The" pop out" may be caused bya lack of drain holes. By changing the Long Lake tunnel shotcretedesigns to incorporate precautions to prevent breakup, it is possiblethat shotcrete could be used as a tunnel support device for the CraterLake tunnel.b. Additional grass-matting of the penstock trashrack is notanticipated, as it appears that the majority of the flow passes over thetrashrack.c. The recent increase in power demand and limited ability of theLong Lake units to meet that demand clearly demonstrate the need for POLfrom the Crater Lake Phase as soon as possible. It also indicates thatthe heavier than historically recorded construction activities in theJuneau area are causing the power demands to increase rapidly.28. Recommendations.a. A solution should be found to permanently repair the powerlineto the intake structure to provide a constant reliable power source.b. Piezometer lines should be cleared before further hydraulic losstests are carried out for the Long Lake tunnel. Pressure readings atthe powerhouse should be taken from the Gibson test piezometer lineslocated in the lower penstock. The existing pressure gages in thepowerhouse are connected to the 8-inch raw water bypass and should beused only when limited accuracy is required.c. The suspended ceiling in the valve room should be extended thefull length of the valve room when the Crater Lake unit is installed.d. The powerhouse crane should be wired so that it can be operatedfrom the standby emergency power supply.
NPAEN-PM-CSUBJECT: Snettisham Hydropower Project, Long Lake Power Conduitand Powerhouse Inspectione. Consideration given to the APA request for expanding the powerhousefacility by including a drift tunnel between the Crater Lakeaccess adit and the erection bay and expanding a portion of the accessadit to house a machine shop.f. To meet the rising power demand in the Juneau area, the dam onLong Lake should be constructed as soon as Crater Lake is on line, andfeasibility studies should be started in the near future for developingone of the many other stages of the Snettisham project.29. On 22 June, Messrs. Wayne Rowe and Bruce Munholand visited VivianKee and Guy Pence of the US Forest Service (USFS) in Juneau. Thefollowing topics were discussed:a. Side Scan Sonar Permit - Ground work was laid with Vivian Keefor obtaining a USFS permit for Ocean Survey to be onsite to conduct aside scan sonar of Crater Lake. Bruce Munholand stated that he wouldhave Phil Fontana of Ocean Survey contact Vivi an Kee di rectly to workput the remaining details.b. Detailed Action Plans (DAP)- Guy Pence was concerned about theneed to begin processing DAP to cover the Crater Lake Phase construction.Mr. Rowe explained to Mr. Pence what the existing schedule was and thatwork on DAP was not really necessary, or appropriate, until P&S are nearcompletion. Mr. Pence concurred after being briefed on what the likelyproject schedule is.c. Environmental Assessment (or Considerations)- Mr. Pence alsoquestioned the status of the environmental investigations or discussionsfor the Crater Lake Phase. Mr. Munholand stated that he felt Mr. Pencehad received all material that is available to date for reviewal, butwould coordinate with Mr. Guy McConnell, NPAEN-PL-EN, and have him giveMr. Pence a call to confirm.4 InclasCF:NPAEN-DBNPAEN-DB-STNPAEN-FMNPAEN-H-HYNPAEN-H-HDNPAEN-PL-ENNPAEN-PM-C (Munholand)NPDEN-TE (Bickley) (dupe)APA (Spicher)
U. S. srANDAHD SIL~(I Of'£NING Itj 'NCIlESlVJr--:"---r-.--.:;6-_~;., A 2 11" Itt +I I~ I 11U. S. STANDARD SIEVE NUMOERS HYDROMETER:lO 1080t-I-+--+----j-X ~ I~_' -\---HrH-i-t-t---j--I---I- -H--J-t-t--/--I--H++-+-+-i-+--i---I' - - -+--1--1--+----13 • 6 8 10 14 16 20 30 40 50 70 100 ]40 200;:.....---.---r--,------,,___---,.-.,,-r-r-,--,---.--.-------,1 II I I 'I I I II I I I 0- '\r-- - -- - - .- -- --- - -- - -. - - .- --11---;----- - - - --- - .- ----- - -'-_.- .•- - --_.-\ 20--r-~-+_-+---H1~~+-~+-~\.4----1rH~~_t___lr-+_---0>-:r'-'~~>-CD.....crzL::>-ZLoJU..... cr...70~ H-iH--H_+-1--+_--I- I1-1--/----1----+' -.- -1----·· -.- - --- -.~ --.-.--- 1.'1-- --!.--+------J+1--H---l .. +1.-------1- -. -1--1-60 ~--~-+--_rl~~+-~+--+-~,H~~~~i-_+--_+-H_I_r~~-~~,___-_+~t_r+_+_+_~I--_+~+r+-+-~-+--j---~ 40- 1-\ 1-- - -- - ---.( ~i\" - ... - I' -.- - .- --T~--t---I-H-H-I--I---I--I---j-H-I-+-t-+-;---l---IOf>5050 rr.IH-~-+----rt-H-/-+- _.J -...-+-----1 . -1--- ------ .- - - -I-~------\ ~ --1---: i---+-I-~--i.(0u}++-+----l -.~60 ...ucr1 w1'''- '--c-- ---- .- --+-.-/-+--Q.-'---70--.---" - .(~ ... -~ ------ ... -.... _ .. - '-1---'"I : - \ rr i - -1-1 ++-+--+--+--+--+---1T1--lI-I-·H-H--I- --t--I--I- •.- \. . .• ~ - -1------f --,-1- - ·-H- - - - 1-20 1 ! I.. -t_-t----t.-!+.t-t-l-+-+-l-=r-·(.0D."", ___ .- - __ ++----I+-t-f-l--l-+--+---+----H -H-+--i-i----l.~-,:r, )-ffi-'I-t-f-t--I-----/---H10 I~ i " - --t_-r~--+H-+-+-r+_+_-r---+~~H_~_+--+____j3090!rL'Wj:>-OJ0:uJ01--+---'-1--+----++++-+-/·---t-.-+---Hr-t-t-t-+....,I--I---j---- . f"500 100 50 10 5 I 0.5 0.1 '-' 0.05 0.01 0.005 0.001GRAIN SIZE IN MILLIMETERSCOBeLESI GRAVEL I SAND II I ~E I FINE I COolRSE M(DIUJ,C I FINE ISILT OR CLJ.YI S~rr.p:e Nu. Elev or Depth Cla~ifi:.ltion Nat w ~ LL PL I PI ! I ~ILS 4092___._ -G~-=-Z-~~*f~~}Y.1;l--_-- .____ . ____ ~_ --.~1--- .~lli __1 .-~: t~.~~~~k~-ll.1J.a.j-.Lq:t.~e.-.ll!'.a~/+------ -----.-.... -.-_______ ._f3~.,O'% .. _Gr~y.eJ .. ___ ~ ~-== ~-=--=-jT-- Area -~::t--tl' S-h·a~-·--·---·-·-~·-----36.0% Sand - ........ -!.I ..... - ..... -----------------+------~ - 1 tr.i.ll8oring~~.~~,------------------------__+GRADATION CURVES Dale 6-29-83100ENGFORMI MAY CJ 2087
U. S. STAHOARD $1(\'[ OPENING IN INeliES U. S. STANDAIlD !>ILV£ NUMllEflS6 4 3 2 I -t -~ -~ . 3 4 6 8 10 14 16 20 30 40 50 70 100 140 200I II .... l--Tir---i-I I I I ----rl II I I I IIIYDflOIA En II. ICXl o'\.~-I-----I++-++-j'-'-- -f-.-- --H-~~-~~-----+~+-~-r~--+~\.+-----rHrr~-+--I---I-----H-1-+~-4-~-~----14-1~·f4~--~-1-----~-I~-t-+~-~-~---~--~lO~--r-~----+r++14-~-+-V-----j-riH-·~-+-4---j--------·~~+4-~-+--+-----j1---4--1___+----~~r+-~-J--II~~I)---_+t-J-t-+-_J_+_-t---t_---- - f-- - --/--j-·-----.,..-+-II-1-1-+-+--I,--I---I----1-·I-!--1--+--+---+-----j.70f---1r--+--4-----++++-+~-1---+--+--\1,---t+-1f-+-+--t--+--I---+----~ 1 30~ 6Qf-t--i---+---t-+++-i-t--I--+---+--\-\-\-i- ~ -I-I--t---+---- I t1-r-j---.+++1 +-+-+--I--+---I++++-~-+--l---l---I40~ " ~--+~- -- ---+-----.- -1-'-1- -f-- ---- - ----.-.------ - -I-+--:::=:=.=:~-=--=-:~; .- \ -- -t--I--t--- ----- 1- -j-'.--'----I__---I-H-I-+-f-!---+---t--I- -+-l-+-+-+-----t---i~ 40~--r-_+----_r~r+~~~--+---~lrH~r+-+-4---+-----~+-~-j-+_!~-+---l----_++++4-r-+--4---~----.~t~~~--r-_+----~60Q,. t-------------- .. -. -. -- .. ------- .~. -- - -- --- --- ----.. ---- .. .. --I···· - --- --- - - r-.--.---. I---i--f------~r_t--~_+----_r~~·~~~--+---~ .. '~I- --~+~_+~--_i-----~~~-+-+_+_~---I__--_4++-~_;--t-~--+_----t70f----l-------t--++++-+-i - -t---1--- ++-·t-+-t-I---~k .. -. ++--,- 1- - -f-f-t--·t--t--/---t - r- -4__l---t-----~10f---1--L-~----_+~~~4-~~+-----HH~~-+-4--~----+\·~tl~-~~--~-+-----H~~4-+-4---~---444~~_+~---r--~~~-r-: --+---_i-l-+-+-j-_.- ---·t---t-----t+-t-i-I---t--t---I---·.,.. ft===E~ -,~=-----t----t - t- -/--_1___+-+-----1t--i--r---t----4+·-I-f--+--!- -- -----.. ~D. --- -._-... -.---- . --~ -.- - -- - .--_.- ..... -1- -- -I----~2o~~--r_--_H++~-+-r--~--~rrr+'~~'-+_--_h~~r+I_+--r_--_H++~~_r~r_--1+t1_t_4_~~_+--~~goo I100 50 10 5 I 0.5 0.1 - O.O:-:-5-'-....L..--.L..----~O.O::-':I...J...,.J.---'="0.-;!:;00:-:-5.J--...J...--'-----;:;-;:!0.~·FCOBBLESGRAIN SIZE IN MILUM ETERSIGRAVELISANDI I I COARSE I ICOARSE FINE MEDIUM FINESam~le No. Elev or [)cpth ClassifiColtion Nat w "LL PL PII--'L-:::S,.;...-..4-=09-=-3=-+------'---+----=G-.:::"p-_ -S'--a-n-d":""y-G-r a-v-e-'----+--=---+-----=-=----+-----==---+-----=--I Project--------~------------+--~---7~~~-~~~~---------I-------SILT OR CLAYera te r La k e----t---------------'I---_-'---""-G r'-"(wit~.L __. __._____________ 1 _____ S ta. 81+0074.0% Grave' S .----·--I--------~---------~25·~O~San~d·~------ ·---------t------+------'~~pett~sham ---------------------1LO% 200· ~No. #2GRADATION CURVES Dale 6-29-83ENGFORMI MAY 63 2087~LOW>)0-CJc:'" VI'"C;IU>-ZwUa:wQ..
IIOJf----+_+_-I __U. S. STANDARD SIEVE OPENING IN INCH£S U. S. STANDARD SIEVE NUMBERS HYDRDMETER6 (3 2 ' I t 1- ·l 3 4 6 8 10 14 16 20 30 40 50 10 100 140 200I_I_ -H~"'r8.;'1 I f I :~_~ r--'---~~ :l+~- I ~ +r ---t-----1%,--l---il--l'-- _ ___ __ ___ I~> _, ___ - ... "1_1_1_,_, ___ t~___ ._)-I--+--+---i·---o-l-l-. -I-_+-r---I-I_-+~~_~'~~===:IO~~t~~~---~~'~~r-r--+---h~~~~-~-r---~++4-~--~-+--~+4~~~~-+-----H-~~~j--+--+---~20.1\t--i-j--\----l-f-l-I--1-+-c--f---1---l-H-+"J --.-,-- . - r- - -I--+---1+·I-+-~I-I- ---'---1- -1-I--l---1--+--If----1tj j) ---- -.-- -~-1-_+_--+I-++_1_I-+__If-_1-~-_+_I__l_1--1-I-I--f_~--__130t--i-t---+-----~-. -~ - -\---1---- " ,70H-+--l----f .. - _1---1-_1-_1___ 1_--r-----h~·· rr- -11---- +t.-i--t--i-f-----1~ 60 ;JJH·--+-+I--+---+----++++-H-+--1--+----l+++-l-1I-1----ir--+----i40 ~Illl-l*fj== __ ___ __ ; :o:::I==:~~:+_1-++'~-l-~-l--_+I--~:I-~---+-_-_-_---1:- ~ ~_ ~_~_:~- r!II~,~ -~= ~ -I----l--.--I~ i_~ i 60§~ 3Cf-,+- I, -+,:----I----+-+-1--I-n1Oltf-t- . ~~-----f-.----- -I--l--"---ii +-.l __ + __ - - _ ~:=,=,:::::=:: ---- -. ---I-r-1":---= -~HI. -i 1_ -+--'\---,_-=,. --f-i-I--T--- /Q ~·····-------!-I- --"-\:1------·----·-:· --'~f------ eo--t--- - .. --- -----. f----·t~-I--·-l1j- -- -~ -l--i1'_--110 90f--4--li; --+-._. - - - -- -- -. ----' -1- -t-- - --- -. -'~----f-- --'- .. -r-,.- - --- ---H-I--1--1--i,---·+--I--I-·_-O~-~~---.~l~~~-L-L-~----~LL~~--L--L--~J~~~~~I--~: __ L-__ ~~~~~-L __ ~ __ ~~J~~~-L_~_~IOO5C
TELEPHONE OR VERBAL CONVERSATION RECORDFor use of this form, see AR 340·15; the proponent Clgency is The AdjutClnt General's Office.OATE8 July 83(•SUS.JS:CT OF CONVERSATIONSnettisham - Long Lake Facilities Inspection, 21-22 June 83INCOMING CALLPERSON CAL.L.ING AOORESS PHONE NUMBER ANO EXTENSIONTom Spicher <strong>Alaska</strong> Power Administration 586-7405PERSON CAL.L.EO OFFICE PHONE NUMBER ANO EXTENSIONBruce MlJnholand NPAEN-PM-C 2-3925OUTGOING CALLPERSON CAL.L.ING OFFICE PHONE NUMBER ANO EXTENSIONPERSON CAL.LED AOORESS PHONE NUMBER ANO EXTENSIONSUMMARY OF CONVERSATIONMr. Spicher called to provide some preliminary information from observation~during subject inspection. The following information was supplied at this timebecause he felt that it may be applicable to Crater Lake design at some futuredate. Details will be supplied to us in seven independent reports to be publishedand distributed in the near future.1. Gibson Tapsa. Not installed as specified.Spec location 92+45 for upstream tap.Actual location is 92+06.5,."b. Installed plugs are 1/8 inch too short.c. Drawing 117 4 l-SNE~ 6-06-19-01/20/A'':i.-,'''I,-J;:,,-c. r£ - 'tC' ;.:;.;.:.lr~/L, ::1.fC .. ·..;,'~c.-· C~El~/i!-'-_c' LE~/~~~T// ~.f- /");.:=:{. '~it-'~:-~':2. Winter-Kennedy Taps. Taps are 1/8 inch too long; never filed when installed.3. Penstocka. Very uniform cylindrical shape...b. Paint is in lIexceptional" condition.c. Mr. Spicher estimates that it could be operated another 30 yearsbefore repainting need be considered.4. Gi bson Testa. APA would like to conduct Gibson Test on Long Lake units at this time;however, the utility (AEL&P) has indicated that at the present time, theycan't handle the load surge created by wicket gate opening time of as shortas 5 seconds...REPLACES EDITION OF I FEB sa WHICH WILL BE USED.!H31-71
. Would like to plan on testing Long Lake-at the time when we areready to test the Crater Lake unit. By then AEL&P should have adequatecapacity.c. Will require very tight time schedule (correlation) for -radiosignals from powerhouse to gate structure to get an accurate determinationof time. Suggest we consider a hardwire system of communications betweenthe powerhouse and gate structure for this test.5. Discharge Tunnel. The discharge tunnel for unit 3 (Crater Lake) hasa bed of very light fines that is greater than 2 feet in thickness.6. Intake Taps. The bottom taps at the intake are totally plugged andthe upper taps are partially plugged. Attempts to unplug them have failed.7. Maintenance. In August APA will replace the governor air compressor anda station service receiver. The existing compressor will be replaced with alarger and higher pressure unit, as the existing compressor takes too longto get back on line after the unit is down. The existing compressor willbe cJeaned up and retained as a backup unit.CF:NPAEN-ANPAEN-DBNPAEN-H-HD;~,'rt,~ ,;,,\ -c:-' (,l.IV:/"','k';':q..,.)~/,J ., /';:/) --/~,// //~ ~ , .. / ,'.. ,". '" -I .BRUCE A. MUNHOLANDProject Manager
EXHIBIT 2SEISMIC RISK ASSESSMENT<strong>CRATER</strong> <strong>LAKE</strong> <strong>PHASE</strong>SI'~ETTISHAM PROJECT J ALASKAJULY 1982DOWL ENGINEERS
!iSeismic Risk AssessmentCrater Lake PhaseSnettisham Project, <strong>Alaska</strong>July 1982----- -------........ ..' . 0°'......M~ • '.ot£~O .... '..o . ow._. ~ '.- .'. ".~';.p.~~~• •. ' ·8~.~".... '. .,..O.O'o..~ U ..."'"~0 ..... .. . . ..... . . . .IJ" I I.._JPrepared for[P~~I:UU. S. Army Corps of Engineers<strong>Alaska</strong> District
.... D ...... O ..... W...... L~E~ngineers4040 "8" Street Anchorage, <strong>Alaska</strong> 99503Phone (907) 278-1551 (Telecopier (907) 272-5742 )July 26, 1982W.O. #013777u.s. Army Corps of EngineersP • O. Box 7 0 0 2Anchorage, <strong>Alaska</strong> 99510Attention: ~r.Pete WilliamsonSubject: Seismic Risk Assessment - Crater LakeGentlemen:Transmitted herein is the Seismic Risk Assessment Study forthe Crater Lake Phase of the Snettisham project which DOWLEngineers performed at your request. Our report describesthe seismic risk at this site in the broader context of theregional tectonic setting of <strong>Alaska</strong>. We address both geologicand seismologic elements of the seismic evaluation process andthereby provide information on earthquake sources, recurrencerates, ground acceleration, and guidance in selecting "design"earthquakes.This study is intended to provide those persons charged withselecting project design criteria and acceptable risk levelsa rational basis on which to make decisions. If you have anyquestions regarding our report please feel free to contact us.Very truly yours,Approved by:lQ e-.~lfMelvin R. Nichols, P.E.PartnerDC: jb2kD~~NGINEERSdcu::tt!~{!LGeotechnical EngineerRobert L. Burk, Ph.D.Geologist
SEISMIC RISK ASSESSMENTSNETTISHAM HYDROELECTRIC PROJECT<strong>CRATER</strong> <strong>LAKE</strong> <strong>PHASE</strong>July 1982Prepared by:DOWL EngineersAnchorage, <strong>Alaska</strong>prepared for:u.s. Army Corps of Engineers<strong>Alaska</strong> District,."
TABLE OF CONTENTSINTRODUCTION · . . . . . . . . . . . . . . . . . . . . . . . . . . . . . . . . . . . . . . . .METHODOLOGY/SCOPE OF WORK . . . . . . . . . . . . . . . . . . . . . . . . . . . .REGIONAL SETTING AND PLATE TECTONIC HISTORY . . . . . . . . . .MAJOR FAULT SYSTEMS . . . . . . . . . . . . . . . . . . . . . . . . . . . . . . . . . .PageFairweather/Queen Charlotte Fault System •••••••• 13Chugach/St. Elias Fault System •••••••••••••• 17Denali Fault SystemAleutian MegathrustLesser Local Faults· . . . . . . . . . . . . . . . . . . . . . . . . . .· . . . . . . . . . . . . . . . . . . . . . . . . . . . .· . . . . . . . . . . . . . . . . . . . . . . . . . . . .SEISMIC GAPS · . . . . . . . . . . . . . . . . . . . . . . . . . . . . . . . . . . . . . . . .SEISMIC RISK · . . . . . . . . . . . . . . . . ....................Statistical Procedure ••••••••••••••••••••••••••• 31spatial Distribution of Ground Shaking •••••••••• 36Cumulative Seismic Risk ••••••••••••••••••••••••• 36FAULT SLIP ACROSS THE TUNNEL ALIGNMENT . . . . . . . . . . . . . . . 43CONCLUSIONS AND RECOMMENDATIONS ...................... 46REFERENCES CITED . . . . . . . . . . . . . . . . . . . . . . . . . . . . . . . . . . . . . . 48126131921242730i~ ENGINEERS
LIST OF FIGURESFigure123456789101112131415Earthquake Epicenter Map -<strong>Alaska</strong> 1899-1981 ••Geologic Time Scale .........................Generalized Geologic Section ••••••••••••••••Major Faults in <strong>Alaska</strong>Major Faults and Lineaments -Fault and Lineament Map (USGS)Fault/Lineament Map (COE)Seismic Gaps in <strong>Alaska</strong>Earthquake Epicenters Map••••••••••••••••••••••Southeast <strong>Alaska</strong>••••••••••••••••••••••••••••••••••••••••••••••••••••••••••••••••••••••••••Cumulative Magnitude/Frequency RelationshipAverage Attenuation Relationships for Rock· ....Idealized Distribution of Ground ShakingCumulative Seismic Risk (Areal Source) . . . . . .Cumulative Seismic Risk (Linear Sources) · . . .Comparative Seismic Risk . . . . . . . . . . . . . . . . . . . .Page7810121425262833343537394043LIST OF TABLESTableI."Maximum Earthquakes" Associated with theMajor Faults in the Port Snettisham Area· . . .23II.Potential Slip Along Local Faults WhichCross the Crater Lake Tunnel Alignment45ii~ ENGINEERS
SEISMIC RISK ASSESSMENT -<strong>CRATER</strong> <strong>LAKE</strong>INTRODUCTIONDevelopment of Crater Lake as a hydroelectric power source isthe final portion of a three-phase plan for the diversion ofCrater Lake and Long Lake outflows through separate waterwaysto a common powerplant at tidewater. These lakes are in thePort Snettisham area, approximately 25 miles southeast ofJuneau, <strong>Alaska</strong>. The proposal involves tapping Crater lakewith a pressure tunnel similar to the one now in existence atLong Lake. Due to geologic constraints dam construction hasnot been proposed for Crater Lake. Power generated by thisproject would be conducted by overhead transmission lines andsubmarine cable to the Juneau substation.The Crater Lake project borders one of the most seismicallyactive zones in the world. In order to incorporate appropriatedesign measures to mitigate seismic hazards the U.S.Army Corps of Engineers, <strong>Alaska</strong> District contracted DOWLEngineers to conduct a seismic risk assessment study for thisproject.- 1 -~ ENGINEERS
METHODOLOGY/SCOPE OF WORKThe complete assessment of seismic risk for a developmententails the combination of three related, yet independentdisciplines:Geology/Seismology (Seismicity)Soil/Rock Mechanics (Geotechnical Engineering)Structural Engineering (Dynamic Analysis)The physical factors and the mathematical modeling discussedherein are by their nature general to the entire PortSnettisham area, and are not restricted to the Crater Lakearea. The geological and seismological information gathered'during this study and the evaluation of seismic risk presentedherein should be useful in establishing designcriteria for development of a power project at Crater Lake.This report addresses the geologic and seismologic elementsof the seismic evaluation process in order to provide informationon earthquake sources, recurrence rates, groundacceleration, and guidance in selecting "design" earthquakes.The sources of earthquakes which may affect a proposedstructure(s), and the character of the shaking produced byan earthquake as it travels to a study si te are evaluatedwi thin the framework of geology/seismology. The way inwhich local soil or rock condi tions below the study si terespond to and alter that motion is addressed through groundresponse analyses (geotechnical engineering). And finallythe dynamic behavior or response of a structure founded onthat site to the ground shaking transferred through the soil..- 2 -~ENGINHRS
deposit is analyzed through dynamic structural analyses.Therefore, a complete earthquake analysis examines thesource of earthquakes, the effects of travel path on theshaking produced at the source, and the response of structuresto that modified shaking.Ground respon~eanalyses and dynamic structural analyseswere not within the scope of this study, since the structureunder consideration is a tunnel carved through bedrock. A"structure" of this configuration generally is unaffected bysite specific ground response peculiarities associated withabove ground structures. Its behavior is more accuratelytied to the local bedrock deformation and shaking induced bylocal and regional earthquakes.The assessment of the seismic exposure or seismic risk of asi te begins wi th an investigation of the regional tectonicand geologic setting, and the seismicity of the area aroundthe site. The size of the study area must be large enoughto include the largest event that may minimally affect thesi tee A typical seismic study area is usually 75, 000 to100,000 square miles, although regional geologic features(faults) may dictate different areal limits.Once the study area has been defined, all known or inferredfaults within the area are investigated regarding theirpast, present, and potential activity. This proceduredescribes the seismicity within the study area. The averagerate of occurrence of various size earthquakes wi thin thearea can be inferred from statistical analyses of historicalearthquake records, and in some cases from well documentedfield investigations of known faul ts. The computedrecurrence intervals for earthquakes large enough to affect- 3 -~ ENGINEERS
the structures or systems within the subject development arethen used to assess the seismic risk or seismic exposure ofthe site. This portion of a seismic study defines thecharacter and limits of the "input" to the second phase ofthe general procedure involved wi th earthquake engineeringanalysis -- site response or ground response.Ground response is that portion of the analysis (geotechnicalengineering) which assesses how the soil at the developmentsite will respond to regional shaking that mightreasonably be expected to occur in the bedrock below thesite during a particular des ign period. Since the soildeposit below any surface si te is a mechanical system or"structure" in the same sense as a building or bridge mightbe considered, it will respond uniquely to vibratory motionsjust as a structure of more classic description will.Although human-made structures such as buildings and bridgesare usually assemblages of discrete elements (beams,columns, walls, floors, etc.), and soil deposits are moreclearly described as continuous media, the classic laws ofmotion appear to describe the response of both systemsequally well. Therefore, the second element of the earthquakeengineering schema describes how a specific soildeposi t will respond to probable earthquake motions, andthereby describes the "input" motion, which might beexpected at the base of a structure founded at the subjectsite. This second element of the total process then leadsto the final consideration - dynamic structural analysis..'.'The general text of this report describes in some detail theregional tectonics and geology of the study area, the- 4 -~ ENGINEERS
seismici ty of the study area, and finally the seismic riskassociated with the site in terms of peak bedrock motions.The reader should recognize that the geologic and seismicdata, the methods of analysis, as well as the conclusionspresented herein, can be expected to change somewhat andbecome more refined as new data· become available to theprofession, and as the physical mechanisms which describeearthquake phenomena (source models, attenuation relationships,etc.) become better defined. One should view thisreport as being "state-of-the-art" within the engineeringprofession in <strong>Alaska</strong> in 1982, based on accepted designpractice and probabilistic methods of inference, and not asan absolute definitive prediction of earthquake exposurewithin the Port Snettisham area.- 5 -~ ENGINEERS
REGIONAL SETTING AND PLATE TECTONIC HISTORYThe northwestern margin of the North American continent isone of the most active mountain building, seismic andvolcanic regions of the world (see Figure 1). Most of thisactivity is related to movement along the boundary betweentwo major, adjacent, blocks (plates) of the earth's crusttermed the Pacific and North American tectonic plates.Plate tectonic theory forms the basis for understanding thegeology of continental margins and plate boundaries, andprovides a framework for discussing the seismicity andbedrock geology of Southeastern <strong>Alaska</strong>.According to theories of plate tectonics the crust of theearth is divided into a number of lithospheric plates whichmove relative to one another. Ocean trenches such as theAleutian Trench, are viewed as sites of large-scale underthrustingof plates of oceanic crustal materials. Sedimentsthat fill these trenches may be subsequently scraped fromthe down-going plate and accreted to the overlying plate asthis underthrusting continues. Due to various tectonicforces these accreted materials also become amalgamated.Ten tectonostratigraphic terranes bounded by known andinferred faults have been identified in southeast <strong>Alaska</strong>.The differences in the rock units and the implied structuraland depositional histories are so great that large-scaletectonic juxtaposition is required (Berg, et el, 1978).This mosaic of discrete tectonic elements is indicative of along, complex history of both amalgamation and accretion.Amalgamation apparently began in Permian time (see Figure 2)and major accretion took place in Late Cretaceous time.Subsequent tectonic activity has modified these terranes by- 6 -~ ENGINEERS
EXPLANATION0 B·j-07.0 TO 7.90 6.0 TO 6.9MAGNITUDE~ .... EngineersLOCATION OF MAJOR EARTHQUAKES - ALASKA 1899 - 1981 FIGURE
GEOLOGIC TIME SCALESubdivisIons of Geologic TimeRadiometric Ages(millions of yearsEr~s Periods Epochs before the present)Quaternary(Recent)Pleistocene1.8uPliocene-06NMiocene0zw22u Tertiary 01 I gocene36Eocene58Paleocene63u Cretaceous-0145N0 JurassicU)w210~Triassic255Permian280Pennsylvanian320u Mississippian- 0 360N0 DevonianwoJ415
displacement along the major fault zones such as the ChathamStrai t fault and by Cenozoic intrus ions and thermal metamorphism(see Figure 3).Terranes which have been documented for Southeastern <strong>Alaska</strong>are part of a larger sequence of discrete terranes along thewest coast of North America. Remanents of at least six1 i thospheric plates are present wi th in th is area. DuringPrecambrian and Paleozoic time multiple microcontinentalplates and volcanic arcs moved away from and toward NorthAmerica to accommodate the marginal ocean basins that openedand closed behind the migrating arcs (Churkin and Eberlein,1977).This succession of microplate movements was followed bylarge-scale northwestward drift in Mesozoic and Cenozoictime and development of an arc-trench system. An arc-trenchsystem is normally thought of as having a three part systemcomposed of a trench, and arc-trench gap and a magmatic arc(volcanic and plutonic). This triparti te system wasoriginally thought to be represented by the Chugach,Matanuska-Wrangell, and Gravina-Nutzotin terranes. Theseterranes form concentric arcs across Southcentral and Southeastern<strong>Alaska</strong>. The Chugach terrane which consists of lateMesozoic formations, such as the Valdez Group, was thoughtto represent trench deposits similar to those forming in thepresent-day Aleutian trench (Berg, et aI, 1972). Morerecent evidence suggests that Chugach terrane is allocthonousand has been displaced northward at least 1000 km sincethe early Tertiary (Cowan, 1982, Plafker, et aI, 1977).I''--- 9 -~ ENGINEERS
L ____________________swQUEEN CHARLOTTEfAULTCHATHAM STRAITPERIL STRAIT FAULTSBARANOF ISLAND KUIU ISLAND KUPREANOF ISL AN 0PROJECTAL AS K A I CANADAAREA\ COAST RANGE BATHOLITHICCOMPLExgn,i .. dome TgNECHUGACH CRAIG ADM IRALITYTAKUTRACYARMo 2~ 1)0 Km~'~'FleUltE 3--Generalized Geologic Section across Southeast <strong>Alaska</strong>--see Figure 5 for location--Sb,Bay of Pillars fm.; CSu,undivided Silurian to Carboniferous formations;Dc,Canneryfm.;Dg,Gambier Bay fm.;Pzs,"Stikine" "Asitka";Ph,Halleckfm.;Pp,Pybus fm.;Trv,Hyd Group;Trw,Whitestripe Marble;Trg,Goondip Greenstone;Trt,"Takla"iJtrg,Jurassic or Triassicgranitic rocks;Kt,foliated tonalite sill;Tg,Tertiarygranitic rocks;amph,amphibolite;m,marble;ops,orthogneiss,paragneiss and schist;um,ultramafic rocks. Upper Cretaceousand Tertiary plutons west of Tracy Arm terrane are notshown. Hodified from Berg ~~, 1978.HORIZONTAL SCALE'ot) W~·b......... Er. ineers~' ...GENERALIZEDGEOLOGI CSECTIONFIG! E 3~ '. "! '" 1
Today the Pacific plate is being subducted at the Aleutiantrench at a rate of 6-8 cm/year. Movement along the easternborder of the Pacific plate is represented by dextral (rightlateral) slip along major fault systems such as the QueenCharlotte fault. The apparent trend in motion through timein Southeastern and Southcentral <strong>Alaska</strong> is a shift from anoblique transform-arc juncture to a simple right-anglejuncture. This implies that motion is being shifted to theFairweather-Chugach-St. Elias system so that eventuallyapproximately a right angle will exist between the Aleutiantrench and this fault system. Whatever the long-term trendswork out to be it is clear that motion along the easternborder of the Pacific Plate occurs along discrete faults andmajor earthquakes are associated wi th those faults. Majorfault systems in <strong>Alaska</strong> are shown in Figure 4.- 11 -~ ENGINEERS
~;*** .-.;.. ~------- *,FAUL T SYSTEMSI ,I. DENALIIA FAIRWELL SEGMENTI,IB HINES CREEK STRANDIC MeK IN LEY STRANDI 10 SHAKWAK VALLEY STRANDIE CHATH AM STRAI T2 CASTLE MOUNTAIN3 KNIK4 CHUGACH - ST. ELIAS,5 FAIRWEATHER6 JACK BAY a WHALEN BAY7 ALEUTIAN MEGATHRUSTB CONTINENTAL MARGINTRANSITION'9 CLARENCE STRAIT LINEAMENT*"~"\". ..< ," '\MAJOR FAULTS IN ALASKA FI( ~E 4~ ~•'I 1
MAJOR FAULT SYSTEMSAt least since early Paleozoic time southeastern <strong>Alaska</strong> hasexperienced significant tectonic deformation, plutonic intrusionand widespread metamorphism. The most recent majorevents occurred in Tertiary time and activi ty in varyingdegrees has continued into the Quaternary. Major structuralfeatures have a northwesterly trend and prominent amongthese features are several faul ts for which major Recentmovement has been suggested (Yehle, 1977).various names have been applied to the faults in Southeastern<strong>Alaska</strong>, and various interpretations can be found forthe connections between faults. We use the following nomenclaturefor the faults shown in Figure 5 after work by Yehle(1977): (lA) Queen Charlotte Fault, (lB) probably adjoinedsegments, (2) Transition Fault, (3) Chichagof-Baranof, (4)Fairweather, (5) Chugach-St. Elias faults, (6) ChathamStrait fault, (7) Lynn Canal, (8) Chilkat River, (9) Dalton,(10) Duke River, (11) Totschunda, (12) Shakwak Valley, (13)Denali System, (14) Sandspi t Faul t, (15) Clarence Strai tlineament, (16) Coast Range lineament. This section refersto these faults and lineaments and discusses fault historyas it applies to earthquake potential.Fairweather/Queen Charlotte Fault System,The Fairweather fault is the most significant active faultexposed along the eastern coast of <strong>Alaska</strong>. This fault hashad a long and complex history; however, Late Quaternarymovement has been predominantly right-lateral strike slip.The surface trace of the Fairweather fault is topographicallyexpressed as a north~est-trending depression that- 13 -~ ENGINEERS
1 s' ~ \ "-\'2. ' 13-4'~\ I' ~\9 \ "-,'\ YUKON ___ T_ERRIt-"T--~\ \ __ _\-j-0:6 ~r ~.. -' '-ORY _____ _BRITISHCOLUMBIA_----,60·~~~ ~.~~"(~~N \,\ ...\\\U ..'".,..AREA OF GENERALlZE~ ~ .. , .,GEOLOGIC SECTION---. -.~I..)~,\\ItSEE TEXT FOR EXPLANATION.MODIFIED FRON' YEHLE, 1979.",.IQ 0 1'0 .ao 60 eo 100 "I\.U8 H 8 F3 F3 F3 E+3 F"3 E="3seAL!::MAJOR FAULTS AND LINEAMENTS~EnglneerSFIGURE 5SOUTHEASTERN ALASKA
extends for approximately 280 km from Icy Point to the upperSeward Glacier area where it probably merges with the easttrending Chugach-Saint Elias faul t system (Plafker et aI,1978). This topographic depression is approximately 1 kilometerwide at Lituya Bay, the site of a major landslide andwater wave triggered by the 7.9 event on this fault onJuly 10, 1958 (Miller, 1960). No other historic earthquakeshave been related to known slip on the Fairweather Fault.Where the fault can be seen at the surface the bedrockis intensely sheared; however, much of the depression alongthe fault is covered by ice or water. The closest approachof this fault to Port Snettisham is about 160 kilometers tothe northwest.Several major and great earthquakes have been associatedwith the Fairweather/Queen Charlotte Fault System. Themaximum event attributed to the fault is the 1899 YakutatBay earthquake, which had an estimated magnitude of 8.6. Amagnitude' 8.1 earthquake just north of Queen CharlotteIsland was recorded in 1949. - Several major events wi thmagnitudes greater than 7.0 have also been attibuted to thisfault during the past 70 years. The entire fault system hasa length of approximately 725 kilometers.Because of the historic seismicity associated with thisfault, and because of its potential rupture length, a magnitude8~5 event should be the "credible maximum" associatedwi th this fault.During the July 10, 1958 event movement probably occurredover a 280 km segment of the faul t wi th a maximum of 6.5- 15 -~ ENGINEERS
meters of dextral slip and 1 meter of dip slip observed atCrillon Lake (Tocher, 1960). Over the last 1,000 years theslip rate of the Fairweather fault has been at least4.8 em/year and probably closer to 5.8 em/year. This rateis roughly equal to the 5.4 em/year rate of relative slipcalculated for the motion of the Pacific and North Americanplates. This suggests that the Fairweather fault is atransform fault that takes up all or nearly all of thePacific/North American plate motion. Major valleys crossingthe fault are probably older than Sangamon interglacialstage and are dextrally offset an average of 5.5 km. Thesedata suggest that the present displacement rate could nothave begun more than 100,000 years ago (Plafker, et aI,1978) •An analysis of the length of subducted ocean crust beneaththe Aleutian are, and offsets on the San Andreas system,among other evidence, suggest hundreds of kilometers oftotal slip between the two plates during the past 10 millionyears (Isacks et aI, 1968). The Denali fault system whichconsists of Chatham Strait, Dalton, Duke River, Totschundaand Denali faults has had a Holocene slip rate of at least2 em/year (page, 1972). Total slip since Miocene time isprobably no more than 4-5 km (Plafker, et aI, 1978) and notgreater than 40 km (Lanphere, 1978). To take up the largeamount of slip indicated by other evidence Plafker et al(1978) infer that the Transition fault, which is part of theFairweather system, bridges the gap between the eastern endof the Aleutian trench and the northwestern end of the QueenCharlotte fault zone. They further suggest that this zonealong which major Cenozoic movement occurred may still beweakly active seismically. This activity was indicated by a,.- 16 -~ ENGINEERS
series of earthquakes of up to Ms6.7 that occurred southwestof Cross Sound during July, 1973.Chugach-St. Elias Fault SystemThe Chugach-St. Elias Fault System is thought generally tobe the continental expression of the impingement of theNorth American and Pacific tectonic plates immediately northof the Gulf of <strong>Alaska</strong>. The area is believed to be one of thezones of transition between dextral tectonic slip along theplate margins southeast of Yakutat Bay and underthrustingalong the Aleutian megathrust.The Transition fault representsanother transition zone. Continuity of relativeImotion between the two plates implies both dextral and'thrust components along the continental margin south of theChugach-St. Elias Front; however, 'only thrust slip isexpressed within this fault system (Bruns and Plafker,1975).The Chugach-St. Elias Fault System is expressed by lateTertiary or early Pleistocene uplift along the southernfront of the Chugach and St. Elias Mountains. The faults ofthis system are high angle north-dipping reverse faultsaccompanied by intense folding. The relative displacementalong the faul ts, and the intensi ty of folding increasenorthward from the continental margin in the Gulf of <strong>Alaska</strong>toward the mountain front. The main fault of this system,the Chugach-St. Elias Fault, extends a distance of 270kilometers from the delta of the Copper River eastward toits juncture with the Fairweather Fault at Yakutat Bay.- 17 -~ ENGINEERS
This fault, which dips northward at an angle of 30 0 to 60 0 ,is estimated to have a stratigraphic throw of at least 3,000meters (Miller, et al, 1959).--Three great earthquakes associated with the ChugachSt. Elias Fault System occurred approximately 80 years ago.A magnitude 8.3 event occurred in September 1899 followed aweek later by a magnitude 7.8 event.Almost one year to theday after the September 8.3 event, the area was again rockedby a magnitude 8.3 earthquake.Although the time frame inwhich these events occurred is generally accepted as that inwhich lesser earthquakes would be classified as aftershocksof the main 1899 8.3 event, the magnitude of the subsequentevents is such that one is forced to view them as independ'ent major earthquakes in their own right (Richter, 1956;Sykes, 1971).cataloged (NOAA)Although these earthquakes are "officially·as having occurred in the same location(60 o N. 142°W.), the lack of an extensive array of seismologicalinstrumentation at that time made precise locationof the earthquakes impossible.It is probable, however,that release and redistribution of stresses within this verycomplex "corner" of the regional tectonic environment mayhave initiated a sudden redistribution of accumulated strainalong other adjacent or nearby structural elements of thefault system.Only minor surface expression of fault rupture was reportedfor these events because of the remoteness of the epicentralarea from population centers, inaccessibility of the affectedarea, and the masking of rupture zones by glaciers andsnow fields.- 18 -~ ENGINEERS
Because of the h istor ical se i smici ty assoc ia ted wi th thisfault system, and its potential rupture length, a magnitude8.3 event should be considered the "credible. maximum"associated with the Chugach-St. Elias Fault System.However, due to its distance from the study site (over 200miles), it was not cons idered to be capable of appreciablyaffecting the site.Denali Fault SystemThe Denali Fault System is a major arcuate tectonic featurewhich extends for more than 2,000 km across south-central<strong>Alaska</strong>, Northwestern Canada and Southeastern <strong>Alaska</strong>. Thisfault system includes a number a different segments whichhave had separate histories of activity. Movement on thissystem has been dominantly dextral although vertical separationhas been suggested for portions of the system.The Dalton segment of the Denali system extends into Southeast<strong>Alaska</strong> where it is sometimes called the Chilkat Riverfault. This fault then joins the Chatham Strait fault whichin turn intersects the Queen Charlotte fault to the south.Although the Chatham Strait Fault is usually considered partof the Denali system, Lanphere (1978) raises the possibilitythat the Denali continues along what Brew and Ford (1977)have considered the Coast Range megalineament or some otherunrecognized structure. Brew and Ford (1977) do not considerthis megalineament to represent a major structuraldiscontinuity at least in near surface rocks.The Chatham Strait fault has had several kilometers of verticalseparation since Eocene time wi th the west side up- 19 -~ ENGINEERS
(Loney et aI, 1967). Ovenshine and Brew (1972) suggest asmuch as 205 km dextral separation and cite what they termweak evidence for dextral separation of 50-100 km sinceearly or mid-Tertiary time and other evidence for 100 km ofseparation in pre-Late Triassic time. Detailed fieldworkalong the Chatham Strait fault is difficult since it is concealedby a series of linear fjords. Deformation, includingfaulting of sediments has been interpreted from seismic profilesmay indicate Holocene movement along the south end ofthe fault west of Coronation Island.The Shakwak Valley segment of the Denali Fault is thenorthwest striking lineament which joins the McKinley andHines Creek Strands in the central portion of the state, and'strikes southeast more than 580 kilometers into the YukonTerritory, Canada. This remarkably linear topographicfeature separates Paleozoic or Precambrian schists to thenortheast from Paleozoic and Mesozoic slightly metamorphosedsedimentary rocks to the southwest. The closest approach ofthe Shakwak Valley segment of the Denali Fault to PortSnettisham is 160 kilometers.In spite of the geologic evidence of major prehistoric displacementsalong the Denali Fault System, the currentlymeasured slip rates along the fault (less than 3mm/yr) (Pageand Lahr, 1971), and the historic record of past earthquakeacti vi ty indicate that this fault system has historicallyhad a low level- of seismicity. Only two historical eventswi th magnitudes larger than 7.0 are believed to be associatedwith this fault sys tern. A magni tude 7.4 earthquakealong the McKinley Strand in 1912, and a magnitude 8.3 eventin 1904 are associated with the Farewell segment of the- 20 -~ ENGINEERS
fault system. These segments are in central <strong>Alaska</strong> and areout of the area of major concern for this study. Elevenearthquakes of magnitude 6.0 or greater have occurredthroughout the central and eastern segments of the systemsince 1900. Al though the historical evidence suggests amoderate magnitude earthquake for design considerations,geologic evidence forces the adoption of a magnitude 8.5event as the "credible maximum" for the Shakwak Valley andthe Chatham Strait segment of the Denali Fault System.Aleutian MegathrustThe subduction zone between the North American and PacificOcean tectonic plates is topographically expressed in the'North Pacific by the arcuate Aleutian Island chain, themountains that form the <strong>Alaska</strong> Peninsula and the deep Aleutianoceanic trench. The subduction zone in this area ofthe Pacific is thought to be shallow north dipping thrustzone termed a "megathrust" (Coats, 1962). The unusuallyshallow angle of thrust is inferred from hypocentrallocations and fault plane solutions of the earthquakes thatcontinually express the tectonic realignment along thenorthern limits of the Pacific plate. Although a simplisticinterpretation of earthquake epicenters and topographicexpression implies the Aleutian megathrust is a smooth circulararc wi th a radius of approximately 800 miles, it isnow believed that the arc is composed of relatively shortstraight line segments joined together at slight angles. Itis further thought that these segments are tectonicallyindependent, and may be separated by transverse tectonicfeatures somewhat like the transform faults associated withareas of sea-floor spreading. There has been a tendency for- 21 -~ ENGINEERS
the hypocenters of large earthquakes to occur near one endof these blocks, and the accompanying aftershocks to spreadover the remaining portion so that during large eventsstrain is released over an entire segment of the megathrustzone, but stops abruptly at the discontinuity betweenindividual segments (Sykes, 1971).Nearly the entire Aleutian Arc between 145°W and 1700E hasruptured in a series of great earthquakes since the late1930s (Kelleher, 1970 r. The last great event was the 1964Prince William Sound earthquake, which was the largest everrecorded on the North American continent (8.4-8.6). Theepicenter of the event was 40 miles west of Valdez. Strainrelease accompanying this earthquake resulted in gross tec-'tonic warpage of an area of approximately 108,000 squaremiles.Because of the high historical seismicity, and the potentialarea of rupture along the megathrust, a magnitude 8.6 earthquakeshould be the ncredible maximum" associated with thisfeature. However, because of its distance from the studysite (over 300 miles) it was not considered to be capable ofappreciably affecting the project area.Table I lists the major fault systems that can affect thestudy site and describes some of the ground motionparameters expected at the site that are associated with"maximum earthquakes" along those faults.- 22 -~ ENGINEERS
TABLE I"MAXIMUM EARTHQUAKES II ASSOCIATED WITH THEMAJOR FAULTS IN THE PORT SNETTISHAM AREANw1.Approx. Distance IIMaximumLength to Site Earthquake"(Mi) (Mi) (M )Fault SystemLDenali 1,050(Chatham Strait Segment) (250) (40) (8.1)(Shakwak Valley Segment) (360) (100) (8.3)Peak PredominantAcceleration Period(%g)(Sec)20 0.50.72.Fairweather/Queen Charlotte 725 100 8.65 0.73.Transi tic;m 400 120 8.35 0.8*4.Coast Range Megalineament 300+ 10 8.249 0.4*5.Clarence strait Lineament 400+ 70 8.410 0.6~ • Not considered to be an active fault.",z~z",",~'"
Lesser Local FaultsSmall faults andlineaments have been identif ied in theCrater Lake area, however, it is important to emphasize thatlineaments are not necessarily faults.the earth I s surface can be produced by:flowLinear features atglacial features,foliation in plutonic rocks, dikes, erosion alongbedding or geologic contacts, erosion along foliation planesin metamorphic rocks, and erosion along predominate joint. sets.Figure 6 shows a fault and lineament map of the Crater Lakearea. Faults and lineaments are undiffertiated on this map,however, fault gouge and breccia have been noted in field'observations (Miller, 1962). The mapped length of thesefaul ts and lineaments is less than six miles, however, itshould be pointed out that even active faults are typicallydifficult to trace in granitic rocks, and this difficulty iscompounded when forest and muskeg· cover exists. Majorfaults and lineaments trend either northeast or east-west.A more detailed map of faults and lineaments at the projectsite is given as Figure 7 after work by the U.S. Army Corpsof Engineers. All of these faults have a mapped length ofless than 3,000 feet. No offsets of Quaternary deposits wasnoted by the Corps and these faults are probably inactive;however, activity of faults in the Crater Lake area has notbeen fully established..'"••- 24 -~ ENGINEERS..
.//. / /---,/7--//;1/II//// ,L.~,'J ___:•--EXPLANATION'-----_ ..... .LINE AMENT/fAULTDASHED WHERE APPROXIMATELY LOCATED, DOTTED WHERE CONCEALED/'",/MODifiED fROM' t.t ILLER, 1~62.1000 0H E32000 4000 6000 1000IICALl~o~ ........ EngineersFAULT AND LINEAMENT MAPtRATER <strong>LAKE</strong> AREAF.lGURE 6
EXPLANATIONJOINTS a FAULTS /UNDIFFERENT IA TED)JOINTS a FAULTS I INfERRED)QUARTZ OIORITE /PREDOMINANT ROCKTHROUGHOUT PROJECT).00' o zoo' 400'SCAlfMODIF lED FROM' DESIGN MEMORANDUM 23,U. S. ARMY CORPS OF ENGINEERS,ALASKA DISTRICT.€~l¥v:# ". Engineers FAUL T I LINEAMENT MAP - <strong>CRATER</strong> <strong>LAKE</strong> AREAFIGURE 7if-, ,
-SEISMIC GAPSKelleher (1970), Sykes (1971) and others have studied thespatial and temporal distribution of great earthquakes(M>7.7) along the Aleutian megathrust zone and the majorsystem of Southcentral and Southeastern <strong>Alaska</strong>.Although the historical records are somewhat meager for thi~region, apparent trends suggest the space-time distributionof great earthquakes approaches lineari ty, . and progressesfrom east to west. Moreover, the aftershock zones of greatearthquakes (rupture surfaces) tend to abut one another withvery little overlap. Great and large earthquakes do notappear to rerupture the same area within a span of severaltens of years. The exception to this "rule" is the sequence'of great events that occurred at the turn of the centuryalong the Chugach-St. Elias Fault System.Areas of seismic quiescence ("seismic gaps") between rupturezones have been observed along the <strong>Alaska</strong>-Aleutian tectonicboundary as well as other tectonic margins in the Pacific.Observation of the historic space-time sequence of earthquakeoccurrence has shown that gaps between two rupturezones tend to "fill in" with large or great earthquakeswithin a few tens of years in the <strong>Alaska</strong> region (Figure 8).'........'....A gap of 120 to 180 miles is evident between the aftershockzones of the 1958 Lituya Bay earthquake (M=7.9) and the 1964Prince William Sound earthquake (M=8.5). The ChugachSt. Elias Fault System lies within this gap.Kelleher (1970) postulated that region to be the likelylocation of a major earthquake wi thin the next 20 years./- 27 -~ ENGINEERS
19648.5SOURCE: LAHR, !.! £! (1979) a PAGE (1975).~~Enb .leers' .. j,"~' ~"SEISMIC GAPS INALASKA'J 1-~FIGl E 8
His hypothesis was borne out on Feburary 28, 1979 when amagnitude 7.7 occurred north of Icy Bay (60.62°N.141.5l o W. ). This event, and attendant aftershocks, arebelieved to have released the accumulated strain in theeastern portion of the gap (Lahr, 1979) (Figure 8).Esti~mates of the seismic moment and accompanying fault slip(approximately 4.5 m) associated wi th the main shock canaccount for the strain accumulated in the area since the1899-1900 series of events, if an average relative motion of5 to 6 cm/yr between the Pacific and North American platesis assumed. However, the entire gap was not filled in thistectonically complex "corner" during the rupture sequence(Lahr, et aI, 1979); therefore, the probability of a majorearthquake occurring within the gap in the near future'should still be considered high. Until the 1972 Sitkaearthquake the offshore area of central southeastern <strong>Alaska</strong>was considered to be in a seismic gap.Although advances have been made in the field of earthquakeprediction in recent years, the necessary precursory parametersare not yet well defined, nor is the requisite instrumentationdeployed regionally to measure and record suchdata. Therefore, the seismic exposure or seismic riskassociated with the Snettisham area should be a:;;sessed bythe more classic probabilistic approaches, but should betempered with the less rigorous observations of regionalseismic history.- 29 -~ ENGINEERS
SEISMIC RISKThe term "risk" as it applies to earthquake engineering canbe defined as the probability that a specific site willexperience a given level of ground shaking during a specifieddesign period. The design period is usually consideredas the socioeconomic life of the structure or systemunder consideration.Several methods of assessing seismic risk are currently usedwithin the industry. Each is based on statistical interpretationof the historical earthquake record of the regionunder consideration. If the seismological history and thegeological setting of a study area is well known, the morerefined methods of risk assessment can be used with a goodlevel of confidence. However, if the earthquake record isshort and incomplete and the seismotectonic framework is notfully defined, a more general and conservative approach maybe appropriate.We have considered two source models in this study. Thesource in the first model was considered to be an arealsource encompassing the entire study region. That is,earthquakes were considered equally likely to be generatedanywhere within the study region.For the second sourcemodel we considered only the mapped faults (and lineaments)within the study region to be earthquake sources.earthquake history of the region is rather meager for theperiod before 1964, and the seismograph network is still toosparse to delineate the local and regional activity withsufficient detail to assess individual faults with confidence.TheTherefore, we made assumptions regarding the seis-- 30 -~ ENGINEERS
micity of individual faults within the study region relativeto the gross seismicity of the region.statistically based seismic risk analyses generally assumethat earthquakes occur randomly in space and time wi thin agiven source area or along a given 1 inear source ( faul t) ,but with the same average rate of occurrence as that establishedin the past. A Poisson distribution model, whichestimates the probability occurrence of rare events, is usedto assess the probability of various levels of ground shakingat a specific site within a source area. The model assumesthat future events will occur randomly, and independentlyof past events, but with the same mean frequency distributionof the historical events within the region.This procedure is based solely on statistical interpretationof the historical seismic activity of the subject region.Little account is given to regional geologic setting, or thegeophysical processes that actually produce earthquakes.The recent theories of global plate tectonics, and the continuingexpansion of the Worldwide Network of Standard SeismographicStations have begun to allow significant advancementsto be made in the field of regional seismology.However, until more complete seismic source models are developedand the actual earthquake data base is greatly expanded,long-range earthquake prediction techniques will continueto rely heavily on statistically based stochasticprobability analyses.Statistical ProcedureThe historical . distribution of earthquakes (seismicity) ,according to magni tude, location, and time of occurrence- 31 -~ ENGINEERS
within the Southeastern <strong>Alaska</strong> region was researched throughour data files obtained from the National Oceanic and-AtmosphericAdministration (NOAA) Environmental <strong>Data</strong> Service(Figure 9). These files are updated periodically to includethe most recent worldwide events. Our data spans the periodfrom 1899 to 1981.The historical seismicity of this region was analyticallydescribed according to the relationship proposed by Richter(1958). A graph of this relationship is shown in Figure 10.This graph shows the historical frequency distribution, orthe mean annual distribution of earthquakes within the PortSnettisham study region. The size of the region was determinedin the following manner. A lower limit of bedrockmotion that might affect the project site was selected--inthis case a bedrock acceleration of 0.05g. The maximum distancefrom the site that an upper bound magnitude earthquake(M=8.6) would produce this level of rock acceleration wasdetermined by using one of several published attenuationrelationships (Schnabal and Seed;" 1972) (Figure 11). Thecomputed distance was used as the- "search radius" for thisstudy. All earthquakes known to have occurred within thearea circumscribed by that radius were used as the database...Figure 10 shows two interpretations of the historical earthquakedata. The solid line is a plot of the actual datanormalized to" an annual basis for the 80 year historicalrecord without regard to the change in monitoring instrumentationthroughout that period. The dashed line representsthe data extrapolated to account for those lesser eventswhich were not recorded prior to the deployment of theII!- 32 -~ ENGINEERS
.,........YUKON TER RI ORY134" 1 o·Wj~;;-~i\_-g.. ____ IiJ.-__ -I-__________ --___ ~60"'..,0' ,....\jl ... ~• -,"~ .,~~f,N000oD--0EXPLANATION8+0 07.0 TO 7.96.0 TO 6.95.0 TO 5.94.0 TO 4.9LESS THAN 4.0 ORUNASSIGNED- EARTHQUAKE SEARCH AREABRITISHCOLUMBIA14\\\\\\\58"~,10 0 10 10 100 IIf\.OiHA I E3 ISCALI·MODIFIED FROM: YEHLE, 1979.~EngineerSEARTHQUAKE EPICENTERS MAP(1899-1981) SHOWING MAJORFAULTS 8 LINEAMENTSFIGURE 9
,Ii~10.0B \B\\~c:II0:: 1.0exILl>-......enILl:!oI:ex;:)o:rI-0::exwILo0::ILl 0.10CD:::IE;:)zoolOG n = 2.23 - 0.52 MH ISTOR leAL DATA\ E1\ . lOG n = 3.67 - 0.72 M~EXTRAPOlATED\\\Go \\\\\E\. \\\DATA..O.OIL---~---L--~----L---~--~--~--~--~o 2 3 4 5 6 7 8 9MAGNITUDE,M1'"~EngineerSCUMULATIVE MAGNITUDE/FREQUENCY RELATION'SHI PFIGURE 10
80> .. ~; ~ ,7010060b~.... ....IEtI.........b~'-~O40~0-....oqQ:~..J~
Worldwide Network of Seismograph Stations, and prior to the-installation of the local seismograph networks.The methodof extrapolating the recent data used for this study m"ainlyaffects the number of occurrences of smaller earthquakes.The increase in the frequency of earthquakes with magnitudesless than about 6.0 is evident in Figure 10.The consequencesof the increase in the number of lesser magnitudeearthquakes within the study region will be addressed in thesection of this report dealing with seismic exposure and itsengineering significance to the project.Spatial Distribution of Ground Shaking~hespatial distribution of various levels of ground shaking(earthquake "intensity") for a given magnitude earthquakehave been found to be reasonably described by ellipticallyshaped contours spreading concentrically away from the planeof fault rupture (Housner, 1969; Marachi, 1972) (Figure 12).This spatial shape was combined with an appropriate rockacceleration attentuation relationship (Figure 11) to estimatethe areal extent associated with specific levels ofbedrock motion for various magnitude earthquakes.""Cumulative Seismic RiskThe temporal distribution of earthquakes by magnitude, andthe spatial distribution of bedrock acceleration for a givenmagni tude earthquake, were combined to compute the meanannual frequency of occurrence of a given level of bedrockacceleration within the" study region.'"'"til,The spatial and temporal distribution combinations were thenused with the Poisson probability distribution to compute- 36 -~ ENGINEERS
lOOO~--~--~----.---~---r--~r-~500~--~---+--~r---+----r---;-'~. 100en&1.1.= ~.l&.Ia:: 10:ll-ll.:l ~a::FAULTI-..J:l~0.5O./~--~ __ ~ __ ~~ __ ~ __ ~ __ ~~~234567 B 9MAGNITUDE1-4----L,JIDE AlIZED CONTOUR LINES OFINTENSITY OF GROUND SHAKINGI~'6rrw Engineers IDEALIZED DISTRiBUTiON OF GROUND SHAKING FIGURE 12
the probability of the site experiencing various levels ofbedrock acceleration at least once for several "designperiods·. The graphical representation of those probabilitiesfor an areal source is shown in Figure 13.A similar procedure was used to develop risk curves for thesite by assuming the mapped faults and lineaments in thestudy region to be limiting linear sources. The risk. curvesassociated with the Chatham Strait Fault and the Coast RangeMegalineament for a 100 year design period are shown inFigure 14. The difference in the seismic exposure at thesite associated with the two.linear sources is due to theirdifferent 2roximities to the site (40 miles and 10 milesrespectively) • The difference in seismic exposure betweenlinear sources and an areal source is due to the assumptionsthat earthquakes on linear sources are constrained to occurno nearer than the closest approach of the fault to thesite, whereas earthquakes associated with an areal sourceare not constrained and can· affect the site from any distance..'The risk curves shown in Figure 13 can be very powerfulplanning and design tool. They allow the owner/agency/design team to quantify the risks involved with their selectionof seismic loading criteria in terms of the present andfuture economic ramifications of their selected criteria.Simply stated, seismic damage to structures can be lessenedby "buyingW added strength in the original design. Or, the·costs· can be deferred until after an event, and spent inrepairs. Generally, retrofit repairs are more costly thanprecautionary design extras.-1J{i:.'.'- 38 -~ ENGINEERS
100r-~~~--__ ~-------------------------------------------------------'~0wuzw0wuxwu..050~.... DESIGN P~RIOD (YR.)-...J-mctIII00::Q..10 20 30 40 50 60 70PEAK BEDROCK ACCELERATION, 0mox (%g)@Y~ Engin~erS CUMULATIVE ,SEISMIC RISK (AREAL SOURCE) FIGURE 13
100~------------------------------------------------~--------------,~ 0wuzw0wuxwLL.0>-I---J50COAST RANGEMEGALINEAMENTĪIIexIII0IX:(l.CHATHAMSTRAIT FAULTDESIGN PERIOD 100 YEARS10 20 3040 50 6070PEAK BEDROCK ACCELERATION, 0mox (% g), , ... '~11! ..,,.,, "! "Il"CUMULATiVESEiSMIC RiSK (LINEAR SOURCE)...-_____________________________________________ ~_ - - ~ -lL-__________ _
"Aseismic design practice usually includes the 'selection of-two levels of acceptable risk and their associated expectedground motions for an established design period.One is an.extreme event ftcollapse threshold earthquake ft , and the otheris a more probable ftdamage threshold ft or ftoperating basis ftevent.Above ground structures such as buildings or transmissionlines are usually designed to elastically accommodatethe ground motion associated with the ftdamage thresholdft event. Elastic design fo~ that level of excitationshould keep architectural damage. to a minimum or insure theuninterrupted operation of life lines during those eventslikely to occur during the design life of the structure orsystem. The more severe (ftcollapse threshold ft ) groundJ1lotion with low risk exposure is then used as the extremeevent survivability loading condition. More refined ductileanalyses can be employed to insure the survivability ofabove ground structures, and to mitigate loss of life of theoccupants during the extreme events that may occur duringthe design period.For example, if the useful life or designlife of a structure is assumed to be 100 years, and itis decided that the structure should suffer little or nodamage during those events likely to occur during thatperiod, then one might choose to design the structure toelastically withstand ground motions with a probabil i ty ofexceedence of, say, 40 to 50 percent.However, more importantly,one might account for extreme event survivability bydesigning for ground motions associated with exceedenceprobabilities of 10percent or less during the designperiod, and employ design procedures which account for ductilebehavior of the structure.Although architectural andminor structural damage may occur during an extreme event,the survivability of the structure should not be compromised.- 41 -~ ENGINEERS
In assessing the ground motion parameters associated withthe two levels of risk considered for this study, we examinedthe effects of the lack of complete instrumental datafor the very short period of record available. The riskcurve for a 100 year design period is reproduced in Figure15 (solid line) along with a similar curve, which representsa somewhat lesser seismic exposure. The curves developedfor Figures 12 and 13 were based on the extrapolated magnitude/frequencyrelationship as shown in Figure 9. The.dashed curve in Figure 14 was based on the magni tude/ frequencyrelationship for the historical data only. It isevident that as the number of lesser magnitude earthquakesincreases relative to the number of large magnitude events,the exposure to low levels of .ground shaking at the siteincreases, whi.le that for significant ground shaking remainsabout the same. Therefore" the level of ground shaking thatshould be accounted for during the ·operating basis earthquake-increases, while that for the ·collapse thresholdearthquake· remains essentially the same. We recommend. using the more conservative approach by incorporating theextrapolated magnitude/frequency relationship into the riskanalysis.t··"- 42 -~ ENGINEERS
~ 0UJ(,)ZUJ0UJUJ(,)XUJLL..0~I-...Jā:Jc(a:J0a::a..100~~~~--------------------------------------------------------~50,'\.\\\\\,-----------~-"II'\. I: ~"'-I .........I , ...........I I ~~______________ I J. ______________ ~ _I Io ~--------------~----~----------------------~------------~--~o 10 20 30 40 50 60 70PEAK BEDROCK ACCELERATION, 0mox (%)~ Engineers' COMPARATIVE SEiSMIC RISK FIGURE 15
FAULT SLIP ACROSS THE TUNNEL ALIGNMENTSix faults which cross the proposed tunnel alignment weremapped by the U.S. Army Corps of Engineers, <strong>Alaska</strong> Districtduring their geologic site investigation of the site (Figure7) • Al though shear zones were identified during theirreconnaissance, no offsets in recent glacial or alluvial depositswere discovered (U.S. Army, 1973). These faults areconsid"ered" to be inactive by the Corps with regard to thepresent geologic evidence at the site. However, one of themost destructive effects of earthquakes on buried linearstructures such as pipelines or tunnels is fault displacementwhich crosses their alignment. In some instances thatpossibility can be accounted for in design and construction.Therefore, we have included an estimate of the potentialamount of slip produced by earthquakes generated along eachof the six mapped faults (Table II). These estimates arebased on an empirical relationship between fault rupturelength and surface slip established by Bonilla (1970).Since the data available to establish thi's relationship arequite sparse, the amounts of slip shown in Table II shouldbe viewed as orders of magnitude only, and not with the precisionthat the significant digits indicate.- 44 -~ ENGINEERS
TABLE IIPOTENTIAL SLIP ALONG LOCAL FAULTSwalCH CROSS THE <strong>CRATER</strong> <strong>LAKE</strong> TUNNEL ALIGNMENTMaEEed Len2thPotential SliE**Fault* (Ft) (Mi) (Ft) (In)1.2.3.4.5.6.Junction 2,975 0.56 0.21 2.5Cliffside 1,715 0.33 0.13 1.6Tsimpsian 1,485 0.28 0.12 1.4Hilltop 1,315 0.25 0.10 1.3'rlingi.t 1,115 0.21 0.09 1.1Penstock 345 0.07 0.03 0.4* From USGS Map, Miller 1962.**' Based on a empirical relationship between mapped faultrupture length and known average surface slip (Bonilla,1970).- 45-~ ENGINEERS
CONCLUSIONS AND RECOMMENDATIONSThe seismic considerations for tunnels are somewhat differentfrom those normally associated with above ground structures.Lined or unlined tunnels through competent rockbasically respond to the passage of seismic waves as therock responds. That is, the tunnel and the rock deformtogether. There is usually no separation between the tunnelliner and the rock. Similar behavior has been observed forthe exposed rock within unlined tunnels where the rock iscompetent and fracturing along the tunnel face is minimal.However, where the surrounding rock is highly fracturedand/or the bond between the liner and the rock is poor,local spalling has been observed after strong earthquakeshaking. Therefore, we recommend that the quality of therock through which the tunnel is to be constructed beexamined closely. Some areas of the tunnel may requirelining to overcome deficiencies in rock quality that may beencountered. The gouge zones of the faults crossing thetunnel alignment would be prime areas of concern in thisregard..'If the economic consequences of impairment to th~ tunnel dueto offset along the mapped faults warrants mitigation measuresbe taken in the design and construction of the system,then further field studies would be warranted to ascertainthe probable amount and direction of slip.We also recommend that the mechanical properties of therock, especially the deformation characteristics, be thoroughlyestablished, so that the integrity of the tunnelsurface can be evaluated regarding the probable deformations- 46-~ ENGINEERS.'
across the alignment axis due to the passage of seismicshear waves. Unlike buildings, transmission lines can belonger than the wave length of the seismic waves which mayimpact them. Therefore, long linear structures such as theproposed tunnel at Crater Lake should be assessed with regardto their overall capacity to deform without damage.Finally, we recommend that the dynamic stability of theslopes at the intake of the tunnel be evaluated with regardto the seismic risk criteria selected to be appropriate forthis project by your agency.. Past experience has shown thatmost of the distress to underground pipelines during majorearthquakes occurs where the line daylights or has shallowcover. Generally, the effects of earthquakes in those situationswas related to slope instability of the soil or rockabove or below the structure.- 47-~ ENGINEERS
REFERENCES CITEDBerg, H. C., D. L. Jones, and o. H. Richter, 1972, GravinaNutzotin belt tectonic significance of an upperMesozoic sedimentary and volcanic sequence in southernand southeastern <strong>Alaska</strong>: U.S. Geological Survey ProfessionalPaper 800-0, p. 01-024.Berg,. H. C., O. L. Jones, P. J. Coney,' 1978, Pre-Cenozoictectonostratigraphic' terranes of southeastern <strong>Alaska</strong>and adjacent areas: U.S. Geological Survey Open FileReport 78-1085.Bonilla, M.G., 1970, Surface faulting and related effects:in Weigel, R.L. (Editor), Earthguake Engineering:Englewood Cliffs Prentice-Hall, Inc., 317p.Brew, D. A. and A. B. Ford, 1977, Coast Range megalineamentand Clarence Strait lineament on west edge of CoastRange batholithic complex, southeastern <strong>Alaska</strong>: U.S.Geological Survey Circular 751-B, p. B-79._ Bruns" or. R. and G. Plafker, 1975-, Preliminary structuralmap of the offshore Gulf of <strong>Alaska</strong> Territory province:U.S. Geological Survey OF 75-504...Churkin, M. Jr., G. o. Eberlein, 1977, Ancient borderlandterranes of the North American Cordillera: correlationand microplate tectonics: Geo. Soc. Amer. Bulletinv.98, p. 769-786.Coats, R. R., 1962, Magma type and crustal structure in theAleutian arc in the Crust of the Pacific Basin, AGUGeophysics Monograph 6.Cowan, O. 5., 1992, Geological evidence for post - 40 m.y.B. P. large-scale northwestward displacement of part ofsoutheastern <strong>Alaska</strong>: Geology v.10, p. 309-313.Housner, G.W., 1969, Engineering estimates of ground shakingand maximum earthquake magnitude: Proceedings of the4th World Conference of Earthquake Engineering,Santiago.Isacks, B., J. Oliver, L.new global tectonics:119, p. 5855-5999.Sykes, 1968, Seismology and theJour.·· Geophys. Research v. 73,- 48 -~ ENGINEERS
Kelleher, J. A., 1970, Space-time seismicity of the <strong>Alaska</strong>Aleutian seismic zone. Jour. Geophys. Research v.75,#29, p. 5745-5756.Lanphere, M. A., 1978, Displacement history of the Denalifault system, <strong>Alaska</strong> and Canada: Can. Jour. EarthScience v.15, p. 817-822.Lahr, J. C., 1979, Personal Communications.Lahr, J. C., G. Plafker, et al., 1979, Interim report on thest. Elias earthquakeof""""28 February 1979: u.s. GeologicalSurvey OF 79-670~ .Loney, R. A., D. A. Brew, M. A. Lanphere, 1967, Post-Paleozoicradiometric ages and their relevance to faultmovements - northern southeastern <strong>Alaska</strong>: Geo. Soc.Amer. Bulletin, v.78, p. 511-526.Marachi, N.D., Dixon, S.J., 1972, A method for evaluation ofseismicity: proceedings of the International Conferenceon Microzonation, v.1.- Miller, D. J., 1960, Giant waves; in Lituya Bay, <strong>Alaska</strong>:. U.S. Geological Survey, Professional Paper 354C, p.51-86.Miller, D. J., T. G. Payne, G. Grye, 1959, Geology of possiblepetroleum provinces in <strong>Alaska</strong>: u. S. GeologicalSurvey Bulletin 1094.Miller, J. e., 1962, Geology of waterpower sites on CraterLake, Long Lake and Speel River near Juneau, <strong>Alaska</strong>:.U.s. Geological Survey Bulletin 1031-0, 101p.OVenshine, A. T. and D. A. Brew, 1972, Separation and historyof the Chatham Strait fault, southeast <strong>Alaska</strong>,North America: 24th Proe. of the Int. Geo. CongressSection 3, p. 245-254.Page, R., 1972, Crustal deformation on the Denali Fault,<strong>Alaska</strong>, 1042-1070, Jour. Geophys. Research, v. 77, i8,p. 1528-1533.Plafker, G., J. Hudson, T. Bruns, M. Rubin, 1978,Quaternary offsets along the Fairweather faultcrustal plate interactions in southern <strong>Alaska</strong>:Jour. Earth Sciences v.15, p. 805-816.LateandCan.- 49 -~ ENGINEERS
Plafker, G., D. L. Jones, E. A. Passagno, Jr., 1977, ACretaceous accretionary flysch and melange terranealong the Gulf of <strong>Alaska</strong> margin: u.s. Geological SurveyCircular 751-B, p. B41-B43.Richter, C. F., 1958, Elementary Seismology: Freeman andCo., San Francisco.Sc.hnabel, P.B., and H.B. Seed, 1972, Accelerations in rockfor earthquakes in the western United States: ReportNo. EERC 72-2, University of California, Berkeley, July.Sykes, L. R., 1971, Aftershock zones of great earthquakes,seismicity gaps, and earthquake predicition for <strong>Alaska</strong>and the Aleutians: Jour. Geophys. Research. v.76,132, p. 8021-8041.Tocher, D., 1960, The <strong>Alaska</strong> earthquake of July 10, 1958 -movement on the Fairweather fault and field investigationof southern epicentral region: Seismol. Soc.AIDer. Bulletin, v.50, 12, p. 267-292.U.s. Army Corps of Engineers, 1973, Snettisham, <strong>Alaska</strong>,Design Memorandum 23, First Stage Development Plan,Crater Lake."Yehle, L. A., 1977, Reconnaissance engineering geology ofthe Metlakatla area, Annette Island, <strong>Alaska</strong>, withemphasis on evaluation of earthquakes and other geologichazards: U.s. Geological Survey OF 77-272.- 50 -~ ENGINEERS
(EXHIBIT 3SIDE SCAN SONAR ANDSUBBOTTOM PROFILING SURVEY<strong>CRATER</strong> <strong>LAKE</strong>J ALASKASEPTEMBER 1983. OCEAN SURVEYJ INC.
FINAL REPORTSIDE SCAN SONAR ANDSUBBOTTOM PROFILING SURVEY<strong>CRATER</strong> <strong>LAKE</strong>, ALASKAPrepared For: Departmen~ of the Army<strong>Alaska</strong> Dis.trictU. S. Army Corps of EngineersP. O. Box 7002Anchorage~ <strong>Alaska</strong> 99510Prepared By:Ocean Surveys, Inc.91 Sheffield StreetOld Saybrook, Connecticut 06475
TABLE OF CONTENTS1.0 INTRODUCTION2.0 DATA ACQUISITION - EQUIPMENT AND PROCEDURES2.1 Horizontal Control and Vessel Positioning2.2 Trackline Coverage and Control2.3 Vertical Control2.4 Soundings2.5 Subbottom Profilingf'f2.6 Side Scan Sonar3.0 DATA PROCESSING AND PRESENTATION3.1 Trackline Reconstruction3.2 Soundings3.3 Subbottom Profiles3.4 Side Scan Sonar Images4.0 INTERPRETATIONS5.0 CONCLUSIONS AND R E CO Mr., END A T ION Sf'.>APPENDIX A -Equipment Specifications
FINAL REPORTSIDE SCAN SONAR AND SUBBOTTOM PROFILING SURVEY<strong>CRATER</strong> <strong>LAKE</strong>, ALASKA1.0 INTRODUCTIONDuring the period of July 15 to July 17, 1983 Ocean Surveys,Inc. (OS'l) conducted a multi-sensor geophysical survey at asi te at Crater Lake in southeastern Al aska. Thi s work wasperformed- for the <strong>Alaska</strong> District of the U.S. Army Corps ofEn~ineers (Contract No. DACW85-82-C-0019) to aid in thedesign of the lake tap for the Crater Lake phase of theSnettisham Hydroelectric Project.The primary objectives of the survey were to:a. Map the elevation of the bedrock below the lakesurfaceb. Map the thickness of unconsolidated materialsoverlying the bedrockc. Determine the location of submerged debris (bouldersand trees) greater than 5 feet in anyone dimensionTo meet these objectives, OSI acquired sounding, subbottomprofi1ing, and side scan sonar data in an area 400 feet northand 200 feet south of a shore point along the tunnel route tothe proposed tap position. The survey area extends west fromthe shoreline to the 250 foot depth contour.In addition to the acquisition of the geophysical data, OSIalso conducted an onshore horizontal control survey to verifythe existing land control and to tie an additional controlpoi nt establ i shed for thi s offshore survey to the exi sti ngcontrol.
Final Report-Crater Lake, <strong>Alaska</strong>Page 22.0 DATA ACQUISITION - EQUIPMENT AND PROCEDURESThe study area at Crater Lake is characterized by very steepbottom slopes (25 to 90 degrees) and water depths rangingfrom approximately 5 feet near the shoreline to 250 feet atthe outer limit of the survey area. Because of these slopes,it was critical that survey vessel position .data and waterdepth .measurements acquired during the survey were especiallyaccurate to allow proper interpretation of the seismic andside scan sonar data. To meet the above requirements, O'SIemployed the following equipment and procedures.2.1 Horizontal Control and Vessel PositioningOn July 15, 1983, existing horizontal control stations ~"Creek", "USGS 20-G" and "USGS 21-G" were recovered. Anattempt to recover station "DeCopperwald" failed as itappears that the station had been buried beneath the debrisof a recent landsl ide. EDM and transit measurements madefrom the recovered stations verified that the relativepostions of the three stations with respect to one another"",are correct as calculated from the local grid coordinatesdetermi~ed for the stations during previous land surveys.Employing stations "20-G" and "Creek" as a baseline, anadditional control station, "OSI-1" was established tooptimize the g~ometry for accurately determining the postionof the survey vessel.To insure the 'a~quisition of the most accurate vesselposition data, OS1 employed a Cubic DM-40A "Autotape" dualrange dynamic electronic positioning system to simultaneouslydetermine the ranges between the survey vessel and controlstations "Creek" and "OSI-1".The "Autotape" system is comprised of three components:two
Final Report-Crater Lake, <strong>Alaska</strong>Page 3responder units which are deployed on shore at hori,zontalcontrol stations and an interrogator which is installedaboard the survey vessel. Range measurements are acquired byphase comparisons of microwave reference signals which arereceived and retransmitted by the two responders to theinterrogator. The measured ranges~ which are automatically,updated at a one second rate ha~e an accuracy of + 0.5 meters.:!:. 1: 1000 ~ 000 0 f the mea s ur e d d i, st a n c e, and are dis P 1 aye donthe interrogator console. During this survey, each onesecond update was logged on paper tape employing a HewlettPackard S150-A thermal printer.2.2 Trackline Coverage and ControlSurvey data were acquired along 36 tracklines orientedeast/west and 11 trackl ines oriented north/south. For theeast/west tracklines, the survey vessel was conned alongtransit "boresight lllines originating from control stationIICreek II. Empl oyi ng stati on 1120-G II as a backsi ght, thetransit angles for the IIboresights" were calculated toproduce a series of near-parallel tracklines runningnominally perpendicular to the bottom contours and spaced 25feet'apart at the eastern 1 imit of the survey area (i .e. atthe shoreline). The course of the vessel during surveyoperations was controlled by the transit operator who relayedcourse corrections to the boat driver via VFH radio insuringthat the survey vessel would be kept precisely on the desiredtrackline.The 11 north/south tracklines were run parallel to theshoreline employing visual ranges to keep the vessel on thedesired course.During all survey operations, sequentially numberednavigation lIeventsli were marked on all data records every 15to 20 seconds to allow correlation of the geophysical and
Final Report-Crate~Page 4Lake, <strong>Alaska</strong>positioning data.2.3 Vertical ControlAn elevation of 1020.00 feet (referenced to the Mean SeaLevel Datum [MSL]) was employed as the zero depth datum forall vertical measurements. This elevation corresponds to themean elevation of the lake surface during the period of dataacquisition and was determined by running a level traversefrom station "20-G" (elevation 1036.77 MSL) to the lakesurface and back to "20-G". Along the traverse a temporarybench mark was established near the lake edge from which thewater surface elevation was measured periodically throughoutthe two day period of survey operations. Measurements overthe two day period showed a variation in lake level of nomore than 0.3 feet from the initially measured elevation of1020.01 feet...2.4 SoundingsSounding data wer~ acquired along survey tracklines employinga Raytheon DE-7I9 survey grade echo sounder equipped with aspeci al narrow beam (3 degrees) transducer. Because of thesignal path geometry produced by the steep slopes and deepwater within the survey area, use of a narrow beam transducerwas essential to obtain a more nearly vertical measurement ofwater depth than could be acquired with the standard (8degrees) transducers..'When properly calibrated the DE-719B has a stated accuracy of+ O. Os ~ + 1 inc h 0 f the i n d i cat e d de p t h • P rio r tot h emobilization of the field equipment, the echo osounder waselectronically calibrated to provide depth measurements for awater mass sound speed of 4800 feet per second. In order tocorrect the field measurements for the actual speed of soundin the water of Crater Lake, a series of depth/temperature
Final Report-Crater Lake, <strong>Alaska</strong>Page 5profiles was obtained to a depth of 300 feet and the actualspeed of sound calculated for zero salin-ity water accordingto the formulas presented in U.S. Naval Oceanographic Officepublication SPHS8 IITables of Sound Speed In Sea Waterll. Inaddition to the measured depth/temperature profiles, a IIbarchetk" was performed at a depth of 30 feet to provide asecond means of determining the sound speed existing in theupper portion of the water column.2.S Subbottom ProfilingSubbottom profil ing data were acquired along ten east/westt r a c k 1 i n e ssp ace d 1 0 0 fee tap art and a 1 0 n g two nor t h / sou t htielines employing two separate systems; a 300 joule IIBoomer lland a 7 kHz "pinger". Both profiling systems were runs i m u 1 tan eo u sly wi t h t he res u 1 tin g data p resented ina s p 1 i ttrace format on an EPC3200 graphic recorder with each tracedisplaying 1/4 second of two way travel time.The "Boomer" is a relatively high power, broad band systemthat provides shallow seismic reflection information througha variety of overburden materials (silts, sands, gravel s,etc.). The system employed consi sted of an OSI 300 joul epower supply~an OS! high resolution "Boomer" transdu.cermounted on a surface towed sled, an OS! 10 element hydrophonearray and a Krohn-Hite electronic passband filter. Sourcesignals were transmitted at 1/4 second intervals with thereceived Signals filtered through a 400 Hz to lS00 Hzpassband and amplified by 20 decibels prior to being printedon a graphic record.The U pin g e r u, in con t r a s t, i salow power, r e 1 a t i vel y h i g hfrequency system which provides high resolution seismicreflection information through soft sediments (muds, silts,soft clays, etc.). The system employed at Crater Lakecon s i sted of a Raytheon Model PTR-I06 two k i 1 owatt
Final Report-Crater Lake, <strong>Alaska</strong>Page 6transceiver and a Raytheonwi th the IIBoomer", IIPi nger"at a 1/4 second rate.r~odel TC-7 kHz transducer. Assource signdls were transmitted2.6 Side Scan SonarSide scan sonar images of the lake floor showing an area 300feet on either side of the survey vessel were acquired alongseven north/south tracklines employing a Klein Model SA-350Adual channel side scan sonar transceiver~ a Klein Model402A-00IA towfish, and an EPC 3200 graphic recorder forrecord presentation.Side scan sonar images of objects projecting above the lakefloor are best defined when the sonar beam strikes a targetat an oblique angle. This condition was achieved at CraterLake by rotating the towfish (where the sonar beamsol"'i gi nate) to angl es of 0 ~ 15, 30 and 45 degrees from thehorizontal to compensate for the varying slopes of the lakefloor throughout the survey area.3.0 DATA PROCESSING AND PRESENTATIONThe field data acquired at Crater Lake were interpreted andprocessed to produce 5 plan drawings:Drawing No. 72242A -Drawing No. 72242B -Drawing No. 72242C -Drawing No. 722420 -Drawing No. 72242E -Survey Trackline MapLake Floor Elevation MapBedrock Elevation MapUnconsolidated Material Isopach MapSubmerged Object Location Plan,..
Fi nal Report-Crater Lake, Al askaPage 73.1 Trackline ReconstructionSurvey trackl ines were reconstructed from the "Autotape"ranges recorded every second during data acquisition. Thesevalues together with the local grid coordinates of theappropriate control stations were input into OS1 I s DEC PDP11/34A computer which calculated the grid coordinates foreach recorded position. During calculation of vesselpositions, geometric considerations for control stationelevation, antenna heights and range calibration data werealso input to yield the most precise computations. Thecomputed XY positions were plotted on a base map at ahorizontal scale of 1:240 (1 inch = 20 feet) to produce thesurvey tracklines presented on Drawing 72242A. Also shown onthe drawing are the run number for each trackl ine, theposition of each· navigation "event" and the types of dataacquired along each trackline.3.2 SoundingsAll sounding data were automatically input into the computerby digitizing the echo sounder records on a Summagraphicstablet digitizer. These data were then corrected for thewater mass speed of sound computed from the temperature/depthprofiles and correlated with the survey vessel position datavi a the numbered "events" marked on each data set. Thecorrected depth measurements were, in turn, referenced to MSLand plotted at 2.5 foot intervals along each trackline on abasemap at a horizontal scale of 1:240. The plotted valueswere hand contoured at 5 foot intervals to produce atopographic map of the lake floor (see Drawing 72242A). Thismap provided the true water depth and bottom slopeinformation required for the analysis of the subbottomprofiling and side scan sonar data.
Final Report-Crater Lake, <strong>Alaska</strong>Page 83.3 Subbottom ProfilesA 1 tho ugh s e i s mi c d a t a we I" e a c qui red f rom bot h t he " Boorne I" "and IIpingerll systems, only the IIBoomer" consistentlypenetrated through the overburden within the survey area toallow discrimination of the bedrock surface. Since the mainobjectives for acquiring the subbottom profiling data were tomap the top 0 f the bed I" 0 c k sur f ace an d the 0 vel" bur denthicknesses, only the "Boomer" data were rigorously analyzed.Analysis of these data proceeded in two phases: determinationof the position of the bottom reflection points anddetermination of overburden thicknesses. Since the "Boomer"transmits a signal with an essentially hemispherical beampattern into the water column, the first received reflectionsare not necessarily returns from directly beneath thesource-receiver system but instead from that portion of thebottom with the shortest slant range path. In areas withdeep water and steep bottom slopes such as those encounteredat the Crater Lake site, the first reflections received maybe returned from a considerable horizontal distance in frontof, to the side of, or eve~ from behind the source-receiverpair. For this reason, it is necessary to first determinethe positions of the apparent reflection points in order toaccurately map the subbottom data.For the "Boomer" data acquired at Crater Lake, the slantrange to the lake floor reflection point was determined ateach· navigation lIevent ll from the recorded travel times andthe water mass sound speed. Employing these ranges, the truewater depths below the "event" positions, and the localbottom slopes measured from the lake floor elevation map, thehorizontal distances to and the water depths at the apparentlake floor reflection points were calculated. Plotting thepositions of these points with respect to the lIevents llproduced a trace of the first or IInormal incidence ll
Final Report-Crater Lake, <strong>Alaska</strong>Page 9reflection path along each trackline.Following the determination of the positions of the firstreflection points, the graphic records were visually analyzedfor the presence of a subbottom reflector representing thetop of the bedrock surface. A top of bedrock- reflector wasinterpreted on the "Boomer" records and traced onto a mylaroverlay along with the trace of the lake floor reflector;the vertical separation between these two reflector traces. bei ng the one way si gnal travel time through the overburdenmaterial.In order to map the thickness of the overburden and the topof the bedrock, a conversion from travel time to thicknesshas to be performed. This conversion requires that themeasured travel time between the two reflectors is multipliedby the propagational velocity of a compressional seismic wavethrough the materials composing the overburden.. Since thecompressional wave velocities for the overburden materials atthe site were not physically measured, an average value wasobtained by comparing the travel times to the apparentbedrock reflector with the thicknesses of the overburdenmeasured in 3 drill holes (DDH-108, DDH-109, DDH-110).Comparison of these two data sets resulted in a value of 4850feet per second for the overburden velocity. It should benoted that typical velocities for the types of overburdenmaterials reported in the drill hole logs average 10% to 15%greater than 4850 feet per second (Hamilton 1969). However,since no other data were available, the 4850 feet per secondvalue computed based upon the available borings has beenemployed. Given the apparent discrepancy in the computedvelocity versus characteristic velocities, computedthicknesses should be considered as minimum values withactual thicknesses possibly being up to 15% greater.The computed overburden thicknesses were plotted on the base
Final Report-Crater Lake, <strong>Alaska</strong>Page 10 .map at the appropriate positions determined from the firstarrivals and hand contoured to produce an isopach map ofunconsol idated material s overlying the bedrock (Drawing No.722420).Bedrock elevations were determined along each trackline byoverlayinQ the isopach map onto a plot of measured waterdepths and adding the thicknesses to the water depths. Theresulting depth to bedrock values were then referenced to MSLand hand contoured at 5 foot intervals to produce the bedrockelevation map (Drawing No. 72242C).t'3.4 Side Scan Sonar ImagesThe side scan sonar records were inspected and all di scretetargets larger than 5 feet in anyone dimension were tracedon mylar overlays attached to the side scan records. PAdditionally~ locations which displayed a grouping or clusterof individual targets overlapping each other preventingdiscrete identification and/or presentation have beendel ineated on the overlays. Unfortunately, the exposedbedrock and coarse sediments present on the lake floor causeda high density of background backscatter 'on the recordspreventing the determination of the nature of each individualtarget (i.e. boulder, tree, etc.). There was one exception,however, where a target, interpreted as a tree remnant,appeared to be partially within the sediments and partiallywithin the water column.As was the case with the subbottom profiles, determination ofthe true position of the side scan sonar's first arrivingsignals had to be made before the exact positions of theson art a r get s c o·u 1 d be a s c e r t a i ned. I nan arE! a w her e thebottom is essentially horizontal, the first returns printedon each channel of a side scan record come from directlybelow the towfi sh. Si nce the towfi sh i s to'~ed at some
Final Report-Crater Lake, <strong>Alaska</strong>Page 11altitude above the bottom, reflections received from objectson either side of the towfish are returned along a slantrange path. These reflected signals are presented atdistances proportional to their slant range travel times on adual channel graphic recorder and the horizontal distance tothe object is e~sily calculated.At a site like Crater Lake, however, where the images wereacquired along tracklines parallel to steep bottom slopes,the first bottom returns can be from points at some distanceupslope of the towfish position. For each target marked onthe overlays, the travel path geometry had to be resolved byemploying the measured water depth below the towfish, thedepth of the towfish below the lake surface, the local bottomslope and the travel time for the first bottom return.Accordingly, measurements and calculations were made for eachta~get and the true positions plotted on the base map tQproduce the Submerged Object Location Plan (Drawing No.72242E). The center of each object has been plotted and ameasure of its apparent length indicated on this drawing.4.0 INTERPRETATIONSReview of the acquired data and visual observations made atthe site revealed that the study area is markedly differentnorth of the tunnel alignments than it is to the south. Onthe north side of the alignment, the shoreline is typified bya steeply dipping rock surface that continues offshore for ashort distance before becoming covered with increasingamounts of sediment. From the shoreline down to an elevationof approximately 800 feet, the rock appears to maintain thesame general gradient as observed on shore. Below the 800foot contour and out to the offshore limit of the surveyarea, the slope of the rock surface lessens with increasingamounts of sediment cover which reaches a maximum thicknessof 30 feet near the outer edge of the defined project site.
Final Report-Crater Lake, <strong>Alaska</strong>Page 12In contrast, on the south side of the alignment, thestructure of the rock is more complex. The rock along theshoreline forms a "shelf" which appears to be covered by 10to 15 feet of sediment and rubble. Between elevation 1000and 900, the rock is exposed on the lake floor and the rockslope is nearly vertical. There are indications on thesounding, seismic and sonar records that rock overhangs mayexist along the trend of the vertical face (see Drawing72242B). At the foot of the steep slope, the rock contoursshow a high degree of irregularity down to an elevation of870 feet where the general slope becomes more uniform and theoverburden gradually thickens..'
Fi nal Report-Crater Lake, Al askaPage 13In contrast with the apparent variations observed in thebed roc k, the com po sit ion 0 f the 0 v e r bur den t h r 0 ugh 0 u t thesurvey site appears to be fairly uniform with the exceptionof the area outl ined on the side scan sonar presentationwhere 1 and s 1 i de deb r i sis bel ie v e d to be present •Information acquired from the drill hole logs and theappearance of the seismic returns from the overburden suggestthat the unconsolidated material is a poorly sorted glacialmoraine or till composed of constituents ranging in size fromclay to cobbles with occasional boulders.In addition to the above unconsolidated material, there isa1 so a third "layer" immediately overlying the lake floor.This layer exists asa thin, discontinuous zone of lowdensity material which was evident on the echo sounderrecords as a a weak, discontinuous reflection approximately 2to 4 feet above the hard lake floor. As this zone caused areflection of the high frequency echo sounder signals (200kHz) but not the lower frequency "Boomer" or the "pinger"signals, it was interpreted to be extremely low densitymaterial (fluff) and was not considered as part of theoverburden during overburden thickness calculations. Thelarge amount of rock flour observed to be entering the lakein runoff from the nearby ice fields suggests that the"fluff" is composed of concentrated rock flour that lacks therequired specific gravity to compact under the influence ofgravity and which may exist as a viscous layer at the lakefl 00 r •5.0 CONCLUSIONS AND RECOMMENDATIONSFi g ure 1 presents a cross secti on of the 1 ake along theproposed tunnel alignment showing approximately 15 to 17 feetof unconsolidated material overlying the bedrock at theproposed tap location. The upper portion of the overburden,
DISTANCE ALONG TUNNEL ALIGNMENT0 20 40 60 80 100 120 140 160 180 200 220 240 260 280 3001020 01000I 20980 I40Iw960a:l z ~o60ONt-- zl z ....J 940 00CJ) u- t-80:::E:.::I(/)uz920 octr a: a: lJJlJJWlL..It-100 r900 120 zz I:I:z 880 140 ra...0 w0rc::{>W....Jw860 160840 180820 200lJJlL..800 ---- TUNNEL ROUTU 220 PROPOSED TAP790 240FIGURE NO.DAT7E. SEPT· 83~~--~~~~--+---~~~~~--4SCALE I = 50 BYVERTICAL S IiORIZONTA. .: ~.,VAKOCEAN SURVEYB,INC.OLD SAYBROOK, CONNECTICUT
Final Report-Crater Lake, <strong>Alaska</strong>Page 14near the tap, may be comprised of landslide debris containinglarge boulders and tree remnants. Analysis of the side scansonar data indicates that the possibility of encounteringsizable objects on the lake floor at the tap location wouldbe greatly reduced by moving the proposed tap positionfarther offshore (see Drawing 72242E).Attention is also directed to the possible existence of aweak zone in the rock along the proposed tunnel alignment asthis feature may represent a potential problem to the tunneldesign. The possibility of a weak zone has been inferredbased upon the change in structural trends observed in thecontour map of the bedrock surface and not upon physicalevidence from within the rock column. If such a zone wouldhave an adverse impact on project construction and/oroperation, additional drill holes are suggested to determinethe actual condition of the rock in the area in questions.As an alternate and more cost effective method to determinethe consistency and competency of the bedrock within theabove zone, overlapping seismic refraction data could beacqui red empl oyi ng ei ther di screte 1 ake floor and/orcontinuous marine refraction techniques. These data can beanalyzed to determine the compressional wave velocity valuesof the rock which is, in turn, indicative of the competancyof the rock through this zone.
REFERENCES1. Hamilton, E.L. 1969Sound Velocity, Elasticity and Related Propertiesof Marine Sediments, North Pacific Naval UnderseaResearch and Oevelopment CenterTechnical Publications 1432. Tables of Sound Speed In Sea WaterU. S. Naval Oceanographic OfficeSpecial Publication 58
APPENDIX AEquipment Specifications
-.CUBIC WESTERN OATA-OCEAN SUR\IEYSoINC •. (a,jOLD SAYBROOK. CONNECTICUT"'~--""'"Automatic positioning system for ships, dredges and helicopterSt
-,,\IUII 'I'(·t.,~-·at• ,;l~).• , r'} .~, ~.)• ..oJ ~Iio.~.} ... JSpecifications, Autotape DM-40AOperating Range: 150 kilometers (300 Km by linecrossing)Range Accuracy: 50 cm + 1:100.000 X range.Maximum Range Rate: 160 knots - higher ratepossible with reduced resolution.Operating Frequency: 2900 to 3100 mHzTransmitted P:)wer: 1.0 watt maximum.Frequency Stability: 1 part per million.Antenna 8eam Width: (1/2 Power)Directional: Variable beam from 120 0 10 300in Horizontal.10 0 Vertical0lT!ni: 360 0 Horizontal10 0 VerticalDisplay Rate:Automatic: 1 per secondFine: 4 per secondIntermediate/Coarse: 2 per secondExternal: on manual or electronic command:1 per second maximum.Dispiay: 5-digit numerical 10 9999.9 melersfor both ranges based on index of refractionot 320 N.<strong>Data</strong> Outputs: 20 line binary-coded decimal1-2-4-8 for each range.Communications: Integral t'No-way communicationsfrom Interrogator to all Resoonders.Range Resolution: 10 centimetersPhysical Characteristics:RF Assembly: 30/.", 6IY,", 7V,", 6 Ibs.Interrogator: 11", 20Y,", 21", 55 Ibs,Responder: 8", 14", 11", 22 Ibs.Variable Beam: 12" X 15" X 23 H at 120°, 12 Ibs.Omni: 15" long, tV •." diameter, 1 lb.Temperature:Operating: _10 0 to +50 o C.Storage: _65 0 to +65°C,Power Requirements:Interrogator: 95 watts. 12 vdc.Responder. 70 watts, 12 vdc.Either unit available for 24 vdc. operation..',.......
FATHOMETER@DEPTH SOUNDERSModel DE-71gBPRODUCTDATAPAGE 1OEseR IPTIONThe Raytheon Model DE-719B Fathometer®Depth Sounder has been designed for useas a portable survey instrument to provideaccurate, detailed permanent recordings ofunderwater topography. Its low power consumption,portability, ease of set-up andrugged construction make it ideal for use onsmall boats.The complete system consists of a transducerand recorder. The transducer mountand rigging are stowed in the recorder casewhen not i,l use. I n operation, the transduceris mounted on the sectional tubesupplied and the tube is then secured to theside of the boat. When the battery cable hasbeen connected, the equipment is ready tooperate~The DE-719B is advance design equipmentutilizing completely solid state circuitry,magnetic keying and electronically controlledstylus speed. The equipment is housed in asplash-proof aluminum cabinet required foroperation in unprotected locations.High resolution chart recordings result from a combinationof very narrow transducer beamwidth, high soundingrate, fast stylus speed and fast chart paper speed.The DE-719B's flexibility is increased by a front paneltide and draft adjustment, speed of sound control andDE-719B Interior ControlsModel DE~719B Fathometer® Depth Sounderfour paper speeds_ Calibration markers that indicatephase in use, tide/draft and sound speed compensationare permanently recorded on the chart for futurereference. Equipment can be adjusted to either footor metric scale recording with use of chart paper ofappropriate scale.FEATURES• Portable, compact, lightweight• Calibration marker• TIde and draft adjustment• May be used with up to 1500 feet oftransducer cable• Standby switch• Four selectable chart speeds• Foot or metric scale calibration• Hinged chart window for runningchart notations• Available for 12V DC, 115/230V ACoperation, 50-60Hz• Fix Marker switch• Plug-in printed circuits• Phase Marker• Magnetic keying• Remote fix-mark receptacle• Belt driven stylus• Chart paper speed adjustable byexternal control• New stylus design - long life,quick replacement• Completely solid stateOCEAN SURVEYS, INC.o~CSI
[RAYTHEOEJDE-71gB SPECIFICATIONSFATHOMETER® DEPTH SOUNDERPRODUCT DATA'Depth Range ....Sounding Rate ................................ .Voltage Input ...................... . ...... .Current Input ............... ~ . . . . . . . ...... .Accuracy ......................... . ......... .Operating Frequency .................. . ........ .Transducer ...•.•.....•.•........... . ........ .Transducer Beamwidth .......................... .Chart Paper Speed ............................. .Chart Paper ...•...............................Recorder DimensionsNet Weight ......................... .0-55, 50· lOS, 100-155, 150·205 Feet0-16.S. lS·31.5. 30-41.5, 45·61.S Meter!> (Note 11534 Soundings per minute12 Volts DC (Note 2)2.S Amperes±O.S%± 1" of indicated depth208 KHzBarium titanate - model 200T5HADOptional model 724SAa O at the half power points1, 2, 3, 4 inches per minute7 inches x 60 feetHeight (including handle) - 18"Width 15-3/8"Depth 9· 1 /16"Recorder w/transducer and rigging 47 Ibs.Recorder only - 38 Ibs.Tide and Draft Adjustment: A .minus 5 to plus 30 foot adjustment may be set in by means of a controlknob. This varies the position on the chart of the transmitter signal, but allows a sharp fixed referp.ncezero-line to remain at the chart zero calibration line.Sound Speed Compensation: A control is provided to compensate for water temperature and salinity can·tent. Adjustment of the control permits the recording accuracy to be calibrated to a "check·bar" reading.A calibration marker, that indicates the degree of compensation, is permanently recorded on the chart.Fix Mark: A front panel switch is provided to inscribe a solid, vertical reference line on the chart. This line isused as an event marker or time reference. A receptacle is included to rermit connection 0f iln externalfix·mark switch, available as In accessory.Standby Switc:b: This switch eliminates warm-up drift during survey operations.Transducer: The DE·719B is supplied with the 200T5HAD transducer which may be fitted to the six footsection tube for outboard mounting or permanently installed through the hull. In situations where extremebottom definition is required, the optional model 7245A narrow beam (2V,o at - 3dB) transducer is recommended.1J1~/;/2OOT5HAD Transducer. ------_--..__ .----..... -7245A Narrow·Beam Transducer(Note 11(Note 21All of the above basic depth ranges may be multiplied by two by means 01 the range doubling switch.The system will operate within specifications between 11.5 and 14.8V DC 1I1PU:' On ordrr. the €louipmenl can hefurnished with a built·in power converter. The converter will permit operation on 115/230V AC. 50 1060Hz. :I'addition to 12V DC.RAYTHEON MARr:E COMPAr~Y676 ISLAND POND ROAD • MANCHESTER. N.H. 03103i .. ." Il1p()n I--.It:! [JI 'i
OCEAN SURVEYS, INC. Q-Yj). os.OLD SAYBROOK, CONNECTICUT . . ... '"HYDROSCANKLEIN SIDE SCAN SONAR . - _. ------j.~~~.. ~ ~ ".' ~: .r:: .. -.'
DUALCHANNELRcCORDER·J\'JODEl_ 401-.SPECI FICATIONS:SONAR FREQUENCY:RANG:: SCALES:PAPER SPEEDS:10JKHz istandardl. 50 KHz or 200 KHz (oi=!ional). Qtl':crs ilvailable forbo~tom profilirg or other applications.75, 150 and 300 meters (standard I. The recorder may easily be calibratedfor any three rang~ scales from 37 to 600 meters,100, 150 and 200 lines per inch (40, 60 and 80 lines per centimeter)(standard). The recorder may be easily recalibrated for alternative paperspeeds.SIZE:Height. WidthOep~h25.4Cm (10")84.4Cm (33 ~/:. "I59.7Cm (23 :/2")':VEiGhT:INPUT VCLTAG~:D.C. INP'JT CURREJ\!T:PAPER'/v'IDTH:45.4Kg ! leO LCs.l w;thout A.~. Supply53 Kg (117Lbs) wirh A.C. SupplyD. C. 23-30 VOl ts (In;J ut p~')tecred from reverc:e \/el ~~;if) or o'Jervoltage)A.C. iWith Opti.)l1al Model 401 ·010 A.C. Suprlyl105- 125 Volts Or 210-230 Volts. 47·63H.:.23 Cm \ 11 inche3!.:WRITING \VIDTH:SCALE UNES:RECORDI'~G COLOR:12.7 Cm (Each ChannellEver)' 15 meters {Adjustable from 210 25 meters;S~pia (standard) cr black (opti.,.",'.i'APER CAPACiTY:91.4 Mer,,:,::> ;300 F-~etl.
OCEAN SU~VEVSJ INC.OLD SAYBROOK, CONNECTICUTTEL: (20J)J88-46JI TLX: 966429SPECIFICATION BULLETIN SP-13PROFILINGSOUND SOURCESSEIS~;1ICVaried types of Sound Source transducers have beendeveloped by EG&G for a wide range of Seismic Profilingapplications. The basic Sound Sources are inter-changeableand modular in design to be used with the standard EG&G<strong>Energy</strong> Source Components, Hydrophones. and SeismicRecorder.UNIBOOM TMThe Model 230 UNIBOOM Unit Pulse Boomer is a moderatepenetration, high resolution Sound Source transducer utilizedfor widely varied seismic profiling applications. Theelectromechanical sound transducer is mounted on a catamaranand is designed to operate 'JlIith the EG~G capacitance <strong>Energy</strong>Sources, Seismic R~oide~a~d matching H-ydrophone streamer_The unique electromechanical assembly consists of an insulatedmetal plate and rubber diaphragm adjacent to a flat-woundelectrical coil. A short duration. high power electrical pulsedischarges from the separate <strong>Energy</strong> Sources into the coil andthe resultant magnetic field explosively repels the metalplate. The plate motion in the water generates a single broadband acoustic pressure pulse.The elimination of the strong cavitation or ringing pulseassociated with standard Boomers and Spark arrays - combinedwith the broad band frequency spectrum. (1) permits thebottomecho to appear as a fine line; (2) provides a clearcross·sectional record of the sub·bottom interfaces; and. .~) penetrates most types of marine materials, including hard·~ A:kedsand. up to 75 meters. The UNIBOOM op.erates equallywell in salt water or fresh water.Applications for the Model 230 Unit Pulse Boomer includereconnaissance geological survey. mineral exploration.foundation studies for offshore platforms. harbor developmentand cable/pipeline crossing surveys.
UN I BOOM (continued)SUMNER AND CALLAHAN TUNNELS, BOSTON HARBORUNIBOOM SYSTEMENERGY SOURCE234I230SOUND SOURCESEISMICRECORDER254'1265HYDROPHONEUNIBOOM SYSTEM &1000 WATT·SECOND SPARKERSPECIFICATIONSPulse Character<strong>Energy</strong> Level:Duration:Sou rce Level:Spectrum:Repetition Rate:@100watt·seconds0_2 milliseconds95 db ref. T microbarat T meter700 Hz to 14 kHz6 pulses/secondTRIGGER BANK231APOWERSUPPLY232ASEISMICRECORDER254II I I230 267A 265SOUND SOURCE SPARKARRAY HYDROPHONE@200 watt-seconds @300 watt-seconds0.2 milliseconds. 0.2 milliseconds104 db ref. 1 microbar 107 db ref. 1 microbarat 1 meterat 1 meter500 Hz to 10 kHz 400 Hz to 8 kHz4 pulses/second 2 pulses/second1"'fI,'Dimensions:Weight:Cable Length:Towing Speed:84 em (WI to 59cm{HI x 158cm (Ll (33" x 23" x 62")90 kg (200 Ibs.)25 meters (80ft.)2 to 8 knots\ --
UCt:AN :::;URVEY5. INC.l::!~as .. IOLD SAYBROOK,CONNECTICUTPortable Survey SystemModel RTT-l000AnS\\ ers the n~' for a portable sub-bottom profilingsystem that gi\es consistently good results underdifficult shallow-water conditions.• Law cost• Simple to set up. operate, maintain• Simu Itaneous operation at two frequencies-One foot layer resolution• Highly accurate hydrographic records (0.5%)The RTI-lOOO Survey System is a dual purpose,portable system designed for shallow-water, subbottomprofiling and high resolution bathymetry.Sub-bottom penetratian is achieved with a pawerfultransceiver and a law frequency transducer mountedaver the side af a small boat. Resu Its are displayedan a campact, dry paper recarder capable of ane footresolutian. The recorder's high frequency transmitterand transducer enables precise depth sounding to beconducted Simultaneously with sub-bottom profiling.Advanced system features such as automatic initicl andbattom-triggered time variable gain, law-ring trc::sducer,and a receiver tailored ta high resolutionprafiling requirements assure optimal perfarmar.ceunder the difficult conditians posed by shallow wc!'er.All items are packaged in rugged carrying cases ;::ndcon ce set up and operating in minutes. The system isideolly suited to the survey of lakes, rivers, andcoastal reg ions.
5 · 1'- •o e~]-rJ cCltlonsJRaytheon Transducer Model TC-7Material: Lead Zirconate TitanateInput power capability: 2000 watts mcximumFrequency: 7 kHzBcndwidth: 2.7 kHzBeamwidth: 36 degreesDimensions: 17" dia.x 7' highWeight: 35 poundsCable length: 50 feetRcytheon Precision Transceiver Model PTR-l06Power Output: 2COO watts maximumFrequency: 7 kHz (others available in tv\oCelPTR 105A)Voltage input: 115 AC or 12 volts DC withoptional inverterPulse width:.1 ms.-tO msElectronics: All solid stateDimensions: 19" x 17' x 51,4"Weight: 55 poundsFeaturesRcytheon Survey Fathometer ~ Mocel DE-719 RTTAccepts extremely short pulses.Wide bandwidth minimizes ringing.light weight/portable.Easy to mount.Heavy duty mounting hardware.Rugged carrying case.Manual gain, initial time variable gain, andautomatic bottom triggeredlVG foroptimal performance in shallow water.High powerfor maximum penetration.Variable pulse lengths.Coherent keying for sharp pulses.AcaJracy: 0.5% + 1" of depthEight selectable depth scales.Voltage input: 12 volts DCFour chart speeds.Electronics: All solid stateTide, draft, and speed of sound adjustments.Chcrtpaper: 7' x 60'Center or edge keying.Calibration: Feet or metersIntegral transmitter/transducer for highOperating frequency: 7 kHz and/orresolution survey.200kHzDimensions: 18" x 15 3 /a"x 91f16"Weight: 47 pounds .. : For spedfic information on price anddelivery, or for applications assistance,contact: Raytheon Company, OceanSystems Center, West Main Road,Portsmouth, R.J. 02871. Telephone:(401) 847-8000. TWX: 710-382-6923.~AYTHEO~Outside U.SA and Canada, contact:Raytheon Company, International Affairs,141 Spring Street, Lexington, Mass. 02173.Telephone (617) 862-6600. TWX:710-324-6568. Cable: RA YTH EON EX.....II'"
CORPS OF ENGINEERSU. S. ARMY- Il,l~I-----/-I .I.I.I~--i~: --!~@ .@-;;/. ~ .I_I®_- r!.. '. ~ ..... ' ..... : ".SCALE I N FEETCHECK GRAPHIC SCALE eEFORE USING.RUN NUMBEREVENT MARK WITH £VDfT NUM':RINDICATES TIUOtLlH£ v:TENOS BEYC»CD5U'V£Y LIMITSSOUJlfOINGS TRACKLINE5aJNOINGS AND SEISMIC TRACKLIHIE1. ~'ft: snT8'll IS IN JUi /IHJ IS ~DI:M..'''' S1"51!M (lISofC£ l~).2. ~IN! 1$ ......... UOAlt. AT If4 EU'IAn('~or 1020 P'EET I«Nf. I'!il. ItKJ .-s I"\..OTln)"""" srot SCJIrr4 SOtIIl Mr ....,. 111E II'N"tJIItotAT1CJo1 PItfSBfTE) BoI THIS OWI.T~ n1E II£SIA.T'S Q~ SI..RVEY'S II"£RP"CII'EDB'I'~SI.aYE"I'5,Jr«:.,"16-.17...I.A..Y 14!)~OCEAN SURVEYS, INC. ALASKA DISTRICTOLD SAY8ROOK. CONNECTICUT @COR PS OF ENG! NEERSANCHORAGE. ALASKA""" V.A.KASKSNETTISHAM PROJECT ALASKAI ST STAGE DEVELOPEMENT<strong>CRATER</strong> <strong>LAKE</strong><strong>PHASE</strong>TRACKLI NE PLOTESIDE SCAN Sl:*AR TRACKLINEDATI::15·AUG-1983051 ORAWING NO. TZ242-ASHEET I Of 5INV. NO. DACW85- 1 SNE 92-07-04
CORPS OF ENGINEERSu.s. ARMYRLAce'".. 'e\'§e'19t,z,01'~ /~~~ ~-----------." _ ~k-~ ~~ ::;~.,efPeff>.. -eTO$6.".",."E 86200'04000 00SCALE IN FEETCHECK GRAPHIC SCALE BEFORE USIHG-.:.1. ELfVATICt6 AAE IN FEEl ,IH) I\EFElIDCmro P'£AN S[A lE'tEl (I'ISL). ~INTERVAl '5 5 !'fiT.2. CCQttII~n:S AA£ IN FfEl N
CORPS OF ENGINEERSU. S. ARMYcR A TR<strong>LAKE</strong>_----&10 &,'J e,'L00"8o
CORPS OF ENGINEERSU. S. ARMYc R A t ERL A K Es=?~~z-'0'0"+z10ro-----------,,,---------'0--__ _E 86 200+E 862........ : .".20 40 00 00SCALE IN FEETCHECK GRAPHIC SCALE 1[f'0Rf USIN6",DOH-II.. DOH-IQZ1. TliIOlJ'ESSes NIE. IN I'!n IHl WERE DfRIVEt>AIO'I SlISHIC MTA eftD'I'l" ~ CCM'RfS-SICHIIIl VELOCITY (I" !tIS) Fl/SEC. CCNTCJ...R.IKfERVAL'5 5 FffT.{SEE RI:J'OAT DISCUSSION):l. COOROIMlU'fS M£. IN fEET flKJ rN Tt£ OOMlft.GSYSTD'I (USACE 1961+) •..,. StDRELIi£. IS N'P'IIOXI""TE, AT />N Elf'VATlCf.!OF 1020 fEET /'t5L .IK) ""'-S P\.OTTED FRC)IoISlOE SCNoI SOWt: MT ....~. ~~~=~~~:T~ In' 0CEJrf0j s~s, 1....:. ON 16-17..u..y 198) I/H) CN4 CN..Y 8E (ONSIDERfi> AS1N)ICATlt-G Tt£ CCKlIYIONS EXISTlt-C ..."1'l1'TtJI'E ••.DelIAH .uIIIALASKA OISTR leTV.A.I(ASI(CORPS ~ ENG I NEER5ANCHORAGE. ALASKASNETTISHAM PROJECT AlASKA! ~I ST STAGE DEVELOPEMENT<strong>CRATER</strong> <strong>LAKE</strong> <strong>PHASE</strong>ISOPACH MAP-UNCONSOLIDATED MATERIALSINV. NO. DACW85-.1 SNE 92- 07- 04
CORPS OF ENGINEERSU. S. ARMYc R A T £ R L A K £+ ++• 10'• t·-'I'' ..• rooT'., .14'-'0'.12'.....·12'• t·• t·.. ,.' .......,,' ...' ...•.' ..-II' ' •. ."'..• 20' a..IQ'...• 10·........14'..-'0'....~+0010, 00SCALE I N FEETCHECK GRAPHIC IlCALE lUOIt£ USI ...•.."A"a CENTDI Of SUJIII[RGED oe.I£CT •_!lOt lNOICAns APPARENT L.£NGTHI. -..ffS u-..urn"" SIll!: 5C.ItI ...2. ~ST11D'IrSIM"E!T,tH)ISTH!DCIWlI"'" S'TS'TS't (U5,lra. ."'),,: ~I~ 's ......, ... ft. AT". ElrIIAT!tJtrl1020P"fnIWl1tf.HSt.f!H).al1"'l.D11'!I).... stOl:S(JIIMSOIIIItDl'TA.t. 'M1~nCII~CIIIMlotm~ n«.·.eu.n rI ~ f'DIt'CIIfBI' lIT .IXVIM ~. lfiC. ON 1,""17.u. T 191' J«) ColIN CN..T • CDlS10B1!D ASIJiOICA11IC 11« (I(IC).nCN DISTI", JoT~T !t"....A.ItASItIU_ALASKA DISTR ICTCORPS 0' [NGIN[!:'"ANCHORAGE. ALASKASNETTISHAM PROJECT ALASKAI ST STAGE DEVELOPEMENT<strong>CRATER</strong> <strong>LAKE</strong> <strong>PHASE</strong>SUBMERGED OBJECT LOCATION PLAN.... 15· AUG· 1983I NY. NO. DACW85- SNE 92-07-04
EXHIBIT It<strong>LAKE</strong> TAP - INVESTIGATIONS<strong>CRATER</strong> <strong>LAKE</strong>SNETTISHAM PROJECT, ALASKANOVEMBER!, 1982-POL~RCONSULT,INC.
polarconsultENGINEERS. ARCHITECTS· ECONOMISTS· PLANNING CONSULTANTS4 November 1982U. S. Army Corps of EngineersDave HendricksonContract Offlcers RepresentativeP. O. Box 7002Anchorage, <strong>Alaska</strong> 99510Reference: Contract No. DACW85-82-C-0017, Appendix A,Scope of Work and Modification P0002.Dear Mr. Hendrickson:In accordance with the referenced contract, enclosed is ourfinal report, dated November 1982. This report addressescontract concerns dealing with 1) Additional Explorationsand/or Surveys; 2) Recommended Lake Tap Design Configurationwi th Supporting Text and Recommendations as to Whether ai-1odel Study is Required; 3) Recommendations on Viability ofPressure Shaft and Surge Chamber Versus Concept Shown in theDesign Memorandum; and 4) Completion of two oralpresentations to the Corps, one on July 28th and the otheron October 21st.It has indeed, again, been our pleasure to work wi th theCorps of Engineers on the Snettisham Project.Very truly yours,rris J. Turner, P.E.roject ManagerMJT/tsbenclosures:ReportBilling2735EASTTUOORROAO • SUITE201 • ANCHORAGE. ALASKA 99507 • PHONE (907)276·3888 • TELEX:26708PCAAHG
SNETTISHAM PROJECT ALASKASECOND STAGE DEVELOPMENT<strong>CRATER</strong> <strong>LAKE</strong><strong>LAKE</strong> TAP - INVESTIGATIONSREPORTNOVEMBER, 1982<strong>CRATER</strong> <strong>LAKE</strong>FUTUREPOWER TUNNELaPLANpolarconsult, inc.ENGINEERS ARCHITECTS ECONOMISTS PLANNING CONSULTANTSANCHORAGE,ALASKA
SNETTISHAM PROJECT ALASKASECOND STAGE DEVELOPMENT<strong>CRATER</strong> <strong>LAKE</strong><strong>LAKE</strong> TAP STUDY -INVESTIGATIONSFINAL REPORTPrepared by:Polarconsult2735 E. Tudor Road, Suite 201Anchorage, <strong>Alaska</strong> 99507November 1982
TABLE OF CONTENTS1.01.11.2REFERENCES.General.Summary.1. 2.11. 2.2Additional Explorations ...Alternative Lake Taps, Model StudiesDesign Contigencies ................. .1. 2. 3 Viability of Increasing Unlined Partof Headrace ......................... .and. 1· •••• 2· • 3• . 3. ...••. 3. . . . . . . . . . . 52.02.12.22.32.42.52.62.7GEOLOGY.General ..Rock Description.Weakness Zones.Rock Stress ...Water Leakage.Air Leakage .....Seismic Risks... .- .· . . . . . . . 8• •• 8• ••••• 8.810· . . . . . .11... 12· ... 133~03.13.23.33.43.5ADDITIONAL INVESTIGATIONS.General ............... .The Lake Tap Area.Sonar Surveying Under Water ..TheTheGate Chamber/Shaft Area ..Surge Chamber/Unlined PressureShaftArea ..· ... 15· . 15.15. ..... 16• •• 1 7· 194.04.14.24.34.4<strong>LAKE</strong> TAP-ALTERNATIVES/MODEL TESTS.General .....Alternative 1 : Closed System/Dry Tunnel.4.2.1 Notes ...Alternative 2: Open System/Wet Tunnel ..Conclusion ..· .... 21.21.21.24· .25.305.05.15.25.35.45.5<strong>LAKE</strong> TAP ALTERNATIVES ET.AL./DISCUSSION ..General •.....The Lake Tap.Trash Rack ...Intake Structures.Conclusion ..•• •••••• 32· .3233• •••••• 35• ••• 36386.06. 16.2HEADRACE ALTERNATIVES ....... . ........................... . 39Tentative Layouts/DiscussionGeneral .............. . · . 39The Penstock Solution .. . . -, . .. , · .... 40
6.3 Alternative 1: Tunnel at High Level and UnlinedPressure Shaft ........................... 416.4 Alternative 2: Sloping Headrace Tunnel With AirCushion Surge Chamber .................... 466.5 Conclusion ............................................... 517.0 SU~mARY OF ADDITIONAL INVESTIGATIONS/INFORMATIONREQUIRED DURING THIS STUDY ............................... 548.0 ATTACHMENTS ..................................... ;; ........ 57
(1.0 REFERENCESTheReport is based, in part, on the followingstudies,drawings, and information:U. S. Army Corps of Engineers.Design Memorandum23, 1973.Ingenior Chr. F. Groner.Recommended arrangement.January 1973.Report to U.S. Army Corps of EngineersContract No. DAC\'J85-7 4-C-0004. <strong>Alaska</strong> GeologicalConsultants, 1974Foundation Report Geologic Map - Penstock.LongLake and Crater Lake, U.S. Army COE.Seismic Risk Assessment. DOWL Engineers, 1982Air Photos from Crater Lake to thePowerStation, U.S. Army COE.Video Tapes of proposed lake tap area, U. S. ArmyCOE.1
1.1 GENERALUnder Contract DACW85-82-C-0017, Polarconsult<strong>Alaska</strong>, Inc. has undertaken the review of theSnettisham Design Memorandum 23, First StageDevelopment plan, Crater Lake.Specifically our areas of contract concern havebeen:o Additional exploration and surveys required, if11'any.o Lake Tap Design Configuration and Model Studies;o Discussion of Viability of Unlined PressureShafto Two oral presentations to the Corps of Engineerson these subjects.The report which follows discusses these points insome detail with the exception of the oralpresentations (only briefly mentioned), which werepresented to the Corps on July 28 and October 21,1982.:2..
1.2SUHMARY1. 2.1Additional ExplorationsOuranalysis of the available geological data(elsewhere referenced) and drill logs, and thesite visit of July 28 to Snettisham have lead usto conclude that:1) A seismic refraction survey of the tap maybe appropriate, especially if the sidescan sonar, which currently has not beendone, cannot provide the necessarydelineation of the overburden, rocks,boulders, trees, etc. in the vicinity ofthe tap area; and2) that there is a need for additionalexplorations and tests, which are coveredin somedetail in Section 3.5, dealingwith the surge chamber and pressure shaft.These tests to establish the location ofthe air chamber et. al.should be possibleduring the construction phase of the work.:3
1. 2.2 Al ternative Lake Taps, Model Studies and DesignContingenciesBased on the study of the existing data, the sitevisi t, and discussions with Corps personnel, acompletely definitive recorrunendation on the laketap cannot be made at this point in time but mustawait the receipt of additional information on thetap area and an overall economic comparisonbetween the various schemes. However, ourimpressions of the lake tap design configurationsand model studies are are outline below:1) We do not believe the model study isnecessary for the Crater Lake lake tap.Section 4.0 and 8.0 of this report discussour reasons for this opinion.,."..co.'2) The recommended lake tap designconfiguration would (subject to evaluationof the additional data as noted above) bea) either a tap similar to what is shownin the Design Memorandum#23 except for"'"two changes, i. e.: 1)tunnel invert andtap invert at the same elevation and 2) aslightly different configuration from thetunnel crown to the tap crown at the pointof piercing, or b) our current preferenceof a wet well intake chamber with an air4
cushion which we find easier to construct,possibly cheaper, and with excellenttapping results.We are not sure at this time whether a dry intakechamber or a wet well intake would be theeconomically preferable solution. Because oftha t, we cannot categorically recommend which ofthe two lake tap configurations should in fact beutilized on the Snettisham proj ect.All thingsbeing equal, our preference would be for awetwell with adampened lake tap, utilizing watercolumn differential between the lake level and theintake structure with an air cushion at the pointof piercing. It is also important thatexperienced crews be used in the constructionphase.1. 2.3Viability of Increasing Unlined Part of HeadraceThe concept is technically viable.Additionally,information is needed as to how the Corps viewstunnel size economics, since theundergroundparameters really dictate the overall economics ofapenstock versus unlined pressure shaft, andsurge tank versus surge chamber, etc. Ourpreference is for an unlined pressure shaft andsurgechamber.5
We cannot now, without revised estimates anddiscussions with the contractors, say which ischeaper.However, it is felt to be important to find outmore about the Corps Iviews on size of drillingequipment andthe utilization of rubber tiredequipment.For example, in Norway today largertunnels are used both with standard drilling andblastingoperations orwith boreing machines.Muchofthis is donefor ease of constructionrather than as arequirement for the hydraulicwaterways.In other words, if the Crater Lakeproject was being done in Norway today it is quitecertain that apressure shaft rather than thepenstock would be utilized.However, the size ofthe pressure shaft and the unlined power tunnelwould dictate whether or not an intake structureversus a surge chamber would be used. If thetunne 1sizes stay in the vicinity of the si zesthat are now shown, most likely a surge tank wouldbe utilized.Addi tionally, there is aclear feeling that anaccess adit should be provided so that the6..
penstock construction work, to the extentpossible, is separated from the existing valvechamber and power house including the /maintenancearea and access tunnel.7
2.0 GEOLOGY2.1 GENERALBased on review of available reports, core logs, andvisit to the site, which also included an inspectionof some of the cores, the following summaries can bemade.2.2 ROCK DESCRIPTIONThe most suitable term for the rocks at the site seemsto be gneissic quartz diorite.The rocks vary inmineral composition and color from dark hornblende andmica gneisses to light granodiorite. The quartzcontent varies also for all types of rocks.Basaltdykes have been found by core drillings and one is tobe seen at the entrance of the access to the powertunnel of the Long Lake project.Except for weaknesszones (shear or fault zones) the rocks are sound andof a good quality for tunneling. The jointing isgenerally moderate to' low except for weakness zonesand core drillings give mostly 100% core recovery.2.3 WEAKNESS ZONES ...:The term "weakness zones is, in this report, used as ageneral term for fault or shear zones to point out the8
importance of the rock quality in such zones.It is arelative term, and the rock quality in a weakness zonemight vary from just a few parallel joints causing notunneling problems to crushed and decomposed rockincluding swelling clay, which can cause heavystability problems.According to core drillings, two rather large weaknesszones (15 25 foot width) with very poor rockquality are found.One of these zones is found inborehole (Oct. 1972) drilled at aninclination from the shore of Crater Lake against thegate chamber (see Plate 1). This zone is probablyalso found in the new drill hole DHl12 (1982) . Theother zone if found in drill hole DH105 (1972) , andborehole DH101 shows (probably) part of the same zoneas shown in borehole DHI05.The rock in these twozones is of very poor quality and concrete lining atthe tunnel face will be required.(The term "at theface" means that the lining should be done beforedrilling for the next round is started.)The othermapped weakness zones seem to be of minor importancefor the tunnel stability even if some of them willrequire reinforcement (rock bolting, shotcrete) and/orgrouting.1The numbering refersdrillholes (July 1982).tothelast renumbering of the9
Plate 1 shows a cross section through drillholesDH111, DH112, and DHl13 where the weakness zonesobserved are marked. As can be seen, the gatechamber/shaft is well sited.The power tunnel between the intake gate and the tappoint will probably intersect the bad weakness zonelogged in hole DHI02.The exact location of the pointof intersection should be found by sounding drillingsahead of the tunnel face as the tunnel excavation iscarried out.Special attention should be paid to two weakness zonesshown on drawings of the penstock/bifurcation for theLong Lake project.These two zones (650 and 1000 feetfrom the bottom of the shaft) might cross the CraterLake penstock or surge chamber area. They have 2" -6" gouge material, are heavily jointed and gave waterseepage into the shaft during construction.2.4ROCK STRESSTo our knowledge, there have not been any rock stressmeasurements done, but according to topography(mountain heights up to 1500 2500 feet) rockstresses high enough to give spalling in tunnels atlow levels are possible. However, experience from10
the Long Lake project (power station and penstock)give noindications that high rock stresses shouldcause spalling or any other major problems for thetunneling.On the other hand, the rock stresses should be highenoughto give possibilities for unlined pressuretunnels provided proper overburden criteria are usedfor the design.In order to better evaluate the rock stressconditions, stress measurements should be performed atthe bottom of the shaft excavated in 1970(for theCrater Lake phase) and as far as possible from thepower station.2.5~"lATERLEAKAGEVery often water leakage into a tunnel is aproblem.During the presentation meeting at the u.S. Army COEoffice on October 21,1982, we were informed thatpermeability tests as well as measuring of theartesian head in drill hole DH11S (1982) had beenperformed. As the results are not available atpresent, however, only general evaluations can be donehere.11
From the Long Lake project, no water leakages causingprob lems are reported except for the tap area.Thecore logs for the Crater Lake project describegenerally good and sound rock that should give.'practically no water leakage, but there is someinformation of calcareous veins and circulating waterloss during core drillings, indicating that waterleakage can occur in some places..'An area of concern is the lake tap at Crater Lakewhere precautions have to be taken (such as groutingof the tap area) to prevent/reduce water leakage asthe tunnel proceeds towards the point of tap....Water leakage from a high pressure tunnel should notfoccur as long as the ground water pressure is higherthan the head in the tunnel.Even if the water headin the tunnel exceeds the ground water level, thewater leakage from the tunnel should not be more thang,'the water inflow and, as such, be of minor importance.2.6AIR LEAKAGEIf an air cushion surge chamber is chosen for theCrater Lake project, the permeability around thechamber is of great importance.In this respect thepermeability tests and artesian water headmeasurements carried out in drill hole DHllS (1982)12
might provide a valuable basis for judgement at thisstage of planning.As the results are not availableso far, only general comments can be given.The artesian head could give information about theelevation at which the water enters into the rock.Besides, the head might say something about the dip ofthe two weakness zones detected in drill hole DHl15.If the head is higher than what corresponds toelevation 1125', an air leakagefrom the compressedair chamber should most likelynot occur.Judgingfrom the observed rock quality and experience fromsimilar construction in Norway, it seems to be quiterealistic to find a site for the chamber in the properarea giving low or practically no air leakage.Thechamber could- either be located on the downstream sideof the sheer zone (Tsimpsian) or between this zone andthe next zone moving upstream (Tlingit).2.7SEISMIC RISKThe report from DOWL Engineers, dated July 1982,provides an assessment of the seismic risk at theSnettisham Proj ect.The conclusion to be drawn fromthis report for the Crater Lake project seems to bethat the generally good geologic conditions (Le. noactive fault zone within 40miles of the station)13
equires no special precautions except for possiblesurface structures and the lining of major weaknesszones.Such construction has to be designed accordingto the general seismicity in the area (zone III).'fHof'14
3.0 ADDITIONAL INVESTIGATIONS3. 1 GENERALThere seems to be two areas where furtherinvestigations are necessary before the constructionphase:1) the lake tap2) the air surge chamber3.2 THE <strong>LAKE</strong> TAP AREAIn the lake tap area, leadline logging and surveyingfrom submarine have been performed showing the slopingof the bottom of the lake and surface conditions.Also, core drillings have been done to confirm rockquality and investigate the location of the weaknesszones in the area.Depending on the sonar loggingresults there might still be uncertainties concerningthe intake ground conditions at the tap point.sonar loggings show overburden, which can beIf therockblocks, slabs or boulders, highly consolidatedmoraine, logs, or uncertain depth to bedrock, thenseismic refraction measurements should be performed at30' on center as shown on Plate 1 to givesupplementary information concerning depth to bedrock15
and rock quality near the rock surface.Five profilesshould be measured as shown on Plate 1, thus providingopportunities for choosing the best place for the tap.'The profiles should cover the elevation range 780'1020'.3.3 SONAR SURVEYING UNDER WATERThis surveying is a very important point for asuccessful tapping operation. ~Design Memorandum 23, Plate no. 3, Dec 1973 shows oneunderwater map. Drawing I-SNE-95-08-08-02 shows apartly changed underwater map (Nov. 1974). DrawingI-SNE-95-08-08-03 has some changes from the abovementioned drawing between D850-125.".It is important that the underwater area is mapped asaccurately as possible. vle suppose that theunderwater surface map should be controlled by theplanned side scanning sonar investigations and mappedat a scale 1" = 25'.The direction at the tap and the last part of thetunnel from the gate shaft out into the lake, willdepend largely on this underwater mapping and with theoverburden situation, the rock fault location, and the16
esul ts from the sounding dri llings which should bedone as the tunnel excavation advances towards theweakness zones and the tap point.3.4THE GATE CHAMBER/SHAFT AREABorehole DH102 (1972)shows an 8 -10 meter length ofthe core at tunnellevel near the gate area wherethere are core losses of up to 30% and the rest of thecores are highly broken and altered. On Plate 1 asketch is provided of the outcrop of weakness zoneswhich can be seen in the terrain and also from aerialphotos.The new borehole DH111 (1982) drilled verticallythrough the gate chamber shows 5-6 weakness zones atelevations 1330' and 1180' approximately.Since thesezones are located at high level, they are of minorinterest in the chamber area.This drill hole doesnot give information about the direction (strike anddip) of the weakness zones indicated on Plate 1.The new angle hole DHl12 shows weakness zonesapproximately 225' and 440' from the top of the hole.The first of these might coincide with the zone tracevisible on the surface.17
18The new angle holes DHl13 (1982) and DHl14 (1982) havebeen drilled, but the proper summary logs are notavailable in Anchorage at present.However, from verypreliminary logs, received over the phone from thesite, it has been learned that DHl13 shows weaknesszones at depths of approximately 110' and 380'.Thelatter might be connected to the zone trace on thesurface indicating that the zone's dip might be closeto vertical.Drill hole DHl14 intersects a bad zonedipping northerly.According to the phone-reportedlog, a 100% loss of circulating water occurred at 151'depth.Further down the hole, clay gouge, soft gouge,chlori te and calcium carbonate are found.This zonewill probably give water leakage into the tunnel andmight demand a concrete lining.Thegate chamber/shaft area and the tap area arelooked upon as a whole and appear to be pretty wellcovered by core drillings. Based on the findings fromthese drillings, it should be possible to draw thetraces of the weakness zones at tunnel level to areasonable accuracy,thus finding the best tunnelalignment up to the tap point.It is found that further investigations should not be..needed for the final design phase.It is, however,stressed that sounding drillings should be carried outahead of the tunnel face (length at least two times
the length of each round) during excavation to controlplans and avoid surprises.The soundings should go inas apart of the specifications and be started some30' before the intersection tunnel - weakness zonesare expected.3.5 THE SURGE CHAMBER/UNLINED PRESSURE SHAFT AREAThe new angle drill hole DHl15 (1982) starting atelevation 775' (which is a better starting point thanthe originally proposed elevation 600') gives valuableinformation about the rock conditions in the air surgechamber/unlined pressure shaft area.However, as thehole length is kept to 650' after moving the startpoint 175' higher up the hillside, the bottom of holeis located at elevation 315', whereas the pressureheadrace tunnel and the alternate unlined pressureshaft will be situated at a lower level. The lengthof the drill hole DHl15 should preferably have beenincreased to bring the bottom of the hole downtoelevation 100'.If a pressure tunnel with an air surge chamber or anunlined pressure shaft is chosen for the project, theaccess adit to the gravel trap at the upstream end ofthe steel-lined part of the headrace will enableexploration ahead of the excavation of the adit to bedone so that the weakness zone(s) found in DHI06 and19
DHl15 could be located at tunnel level, thus giving abase for making the final decision concerning thelocation of the upstream end 6f the steel lining.It is of importance that the headrace tunnel should beexcavated beyond the air chamber area before thechamber's location is finally decided.Also, coredrillings with water pressure tests should beperformed from the pressure tunnel before the finallocation of the air chamber is chosen.Registration of water inflow (leakage) to the pressuretunnel during excavation is an important means ofevaluating possiblesurge chamber andair leakage from the air cushionof deciding whether or notprecautions such as grouting should be necessary.Atthis stage of the construction work,rock stressmeasurements should also be performed to ensure thatrock stresses are of an acceptable level for the airsurge chamber.20
4.0 <strong>LAKE</strong> TAP - ALTERNATIVES/MODEL TEST4. 1 GENERALTwodifferent systems or alternative taps could beapplicable for the Crater Lake piercing, neither ofwhich by our judgement should require amodel study.The reasons for this, as well as descriptions of thesystems, are hereunder outlined.4.2 ALTERNATIVE 1, which could be called the CLOSEDSYSTEH/DRY TUNNEL alternative, is equal to therecommended solution shown in Design Memorandum No. 23,Plate 17, except for two minor modifications.Thisalternative is covered fairly well by a model study runat the Water and River Laboratory of the TechnicalUniversity of Norway in 1968.The study was done for aNorwegian lake tap, the Askara Lake tap, blasted some10 years ago. This tap had dimensions and water depthnot too different from what is proposed for the CraterLake scheme, except that the tunnel dimensions anddepth were somewhat larger at Askara than thoseproposed for Crater Lake.The series of model tests were run for 14 differentconfigurations for the tap and rock trap area.Nineof these configurations are illustrated on five21
22attached sheets, marked 111.1 through 111.5, extractedfrom the laboratory's report of 30 January, 1969.Itis believed that the figures speak for themselves, evenif the text is in Norwegian, and thus that there shouldbe no need for a description in words of the variousconfigurations tested. Most of the configurations weretested both with the dead end rock trap drained andfilled with water up to the invert of the power tunnel.From the model tests it was concluded that theconfiguration shown on sheet 111.4, bottom of page,with an lS-meter long dead end tunnel 2-meters widerthan the power tunnel over a length of 14-meters fromthe dead end, and the trap invert l.S-meters lower thanthe power tunnel invert was the best of the testedconfigurations.The model tests ilso showed that it isessential that the dead end trap is drained when thefinal blast is executed.This is clearly seen fromfigures extracted from the test report as givenbelow.
Distribution of rock from the final plug in percent oftotal amount (figures in ( ) valid when the rock trapis filled with water) :In dead end rock trap87(29)%In additional rock trap approx.halfway between dead end trapand gate shaft7(34)%On invert of power tunnelbetween dead end trap and gateshaftAt intake gate1(10)%5(27)%The model studies carried out for the Askara Lake tap,as briefly above, described were useful as they lead toimportant adjustments of the preliminary plans for thistap. As the conditions for the planned lake tap atCrater Lake are only slightly different from those forthe Askara tap, there should be little doubt that modelstudies on ~heCrater Lake tap would not provide moreknowledge of significant importance for the design ofthe Crater Lake lake tap.The conclusion reached isthat no model study on the lake tap for the Crater Lakescheme is required, if the closed system/dry tunnelalternative is chosen for the lake tap.23
4.2.1 Notes:1. The configuration for the lake tap at Askara as shownon sheet III. 4 of this report (same principleas on plate 17 of Crater Lake Design Memorandum No. 23)was modified during the final design, such that thepower tunnel invert and the dead end tunnel invert hadthe same level.in the trap, aTo retain the rock from the final plugconcrete sill was established at theinlet to the power tunnel from the rock trap. The sillhad drainage holes at the bottom large enough to makethe rock trap self drained.The reasons for thesemodifications were of practical/economical nature, as...draining the trap by pumping was avoided and the deadend tunnel could be excavated cheaper than would be the"case with the shown configurations.2. As a consequence of the configuration of the tap androck trap area as shown on plate 17, Design MemorandumNo.23, as well as on Exhibit 1, Groner drawing no.1515-103 (see also plate 12 of Design Memorandum No.23), a substantial amount of air will be trappedunderneath the power tunnel roof between the tunnelinlet and the intake gate. The only way this air,which will be compressed following the final blast, canescape the tunnel is through the vent pipe downstreamof the intake gate.As the air will be fairly highly24
compressed, rather violent outbursts of. air must beexpected as the intake gate is fully drawn the firsttime.To reduce these outbursts, slight modificationsof the tunnel roof near the final plug should beconsidered during detail design in such a way that mostof the air could escape through the tap inlet followingthe final blast.4.3ALTERNATIVE 2, which could be referred to as the OPENSYSTE~1/WET TUNNEL alternative, is illustrated bysketches shown on the attached figures 1 through 4.This sytem has been applied for several lake tapscarried out in Norway the last years, and is now oftenpreferred over other methods both for technical andeconomic reasons.The sketches are taken from the Oksla hydro power plantowned by NVE-Statskraftverken (Norwegian StateElectricity Board) completed 26 January, 1980 byfireing the final plug of the Ringedalsvatn lake tap.The power tunnel for this plant is considerably largerthan the Crater Lake tunnel (with a cross section qreaof or 3752ft. ).The water depth at the tappoint is also higher for the Ringedalsvatn tap (85meter or 280 ft.) than for the Crater Lake tap.:25
26As the open system/wet tunnel may not be w.ell known, ashort description of the Oksla hydro power plant andits lake tap follows.Figure 1 provides an overview showing an undergroundpower plant with an inclined power tunnel (called apressure tunnel in Norway) avoiding a pressure shaft orpenstock.The figure also shows that a compressed aircushion surge chamber was chosen for this plant insteadof aconventional surge shaft, usually with an upperand a lower chamber.Figure 2 shows the upper part of the power tunnelbetween the intake gate shaft and the lake tap point.The elevations in meters 456.0 and 448.0 indicates thewater levels in the lake and gate shaft, respectively,at the moment when the final plug was blasted.On thesection drawing the location of pressure cellsinstalled (as a part of an ongoing research program) tomeasure the pressure rise during the final blast areindicated. Near the upstream end of the tunnel the 19last rounds towards the plug are indicated by linesnormal to the axis of the tunnel.Soundings carriedout ahead of the tunnel face over this portion of thetunnel are also indicated.(The change of the tunneldirection was doneto reach the most favorable tappoint. )
Figure 3 show.sin some detail the intake gate shaftwith the location of the main gate and bulkhead gate.The gate positions are shown as of when the plug wasblasted.Location of equipment to control the waterfilling of the tunnel between the gate shaft and thetap point, and to assure that the air cushion·underneath the final plug is maintained until the plugis executed, is also indicated.Figure 4 shows the result of the pressure fluctuationsduring the final blast and ashort time afterwards.Also, used delay capsule numbers and amount of dynamiteignited by each delay cap are shown.From the figure it can be seen that in the case of anopen piercing, the main intake gate is closed, thebulkhead gate and the gate shaft are open, and bothgate shaft and the tunnel between the gate and the plug,are filled with water -in this case pumped in from thelake through the gate shaft.The quantity of waterpumped in is so determined that the waterhead (lake togate shaft) will meet two principal requirements: 1)the surge in the gate shaft after the final blastshould be kept below the top of the shaft, and 2)sufficient water inflow to the tunnel should beprovided such that the debris from the final plug and27
the possible overburden could be suitably distributedand deposited in the tunnel (which for this purpose hasan enlarged cross sectional area in the vicinity of theplug) .From the figures it can also be seen that thetunnel towards the plug is designed such that, whenfilling it with water, an air cushion is created belowthe final plug.For the Ringedalsva tn lake tap thiscushion enclosed approximately 150normal-m 3 of air(150m 3 under atmospheric pressure).It is of vital importance that such an air cushion iscreated and maintained until the final blast occurs toavoid that the pressure shocks from the break-throughblast are transmitted through water against the maingate, which might thus be damaged.The volume of theair cushion depends upon the quantity of dynamiteneeded to blast the final plug (especially the loadigni ted by the first caps), the distance between theplug and the gate structures, and the dampening of theshock aimed at.It is obvious that the shock dampeningwill be larger, the larger the air cushion.From the results of the measurements done during theRingedalsvatn lake tap the following is extracted:28
Pressure in air cushion beforeblasting approx. 9 barMax. pressure measured near the plugMax. pressure measured at the gate12.5 bar9.1 barMax. surge in the gate shaft abovethe water level in the lake5.8 meterThe water level rise ln the g~te shaft took 26seconds which corresponds well with the calculatedvalue of 29 seconds.The 5. 8 meter surge above the reservoir level whichoccured in the gate shaft after the final blast counted72.5% of the chosen 8-meter water level differencebetween shaft and reservoir before the blast.Thiscorresponds well to experience withthis type ofpiercing from other lake taps, and the computations.Based on the experience from the Ringedalsvatn lake tapand other taps carried out according to the same openshaft/wet tunnel method, one can with reasonablecertainty assume that the water in the gate shaft willoscillate to a level amounting to 70 -90% of the leveldifference (reservoir to shaft) before the final blast,depending on head losses due to friction andturbulence.Based on experience from the Ringedalsvatn lake tap and, ..other lake taps of the same type, our conclusion isthat there is no need for a model study on the lake tap29
at Crater Lake if the open system/wet tunnelalternative is used as long as the distance between thetap point and the gate structures is sufficient.4.4 Conclusion:Referring to contract No. DACW-82-C-0019, Lake TapCrater Lake, Description Item c; our conclusion is thatthere should be no need for a model study on the laketap at Crater Lake, whether or not the closedsystem/dry tunnel method or the open system/wet tunnelmethod is chosen for the tap.If the closed system/dry tunnel alternative is chosen,the lake tap configuration could be as shown on plate17 of Design Memorandum 23, First Stage DevelopmentPlan, Crater Lake with the smaller modificationsindicated in this report.Should, however, the plannedinvestigations regarding overburden(loose material,boulders, debris, etc.) show unfavorable conditions, a ~double-plug lake tap as shown on plate 18 of the DesignMemorandum might be chosen to minimize the chance of.'having the inlet blocked by overburden material.Inthis case, there shouldn't be any need for amodelstudy as long as the configuration is kept as shown onplate 18.The modifications mentioned above for thesingle-plug tap should also be considered for apossible double-plug lake tap.30
If the open system/wet tunnel method is chosen theconfiguration briefly shown above for the Ringedalsvatnlake tap could be adapted to suit the Crater Lake laketap, and no model study should be required as long asthe distance between the final plug and the gatestructures is sufficient.Based on the knowledge atpresent about the conditions in the tap and gatechamber/shaft area the distance between the tap plugand gate will most likely be approximately 600'; whichis considered a sufficient distance.Should there, forsome unforeseen reason, be aneed for reducing thisdistance, this would be possible if the air cushionunderneath the plug is made large enough to reduce theshock effect from the blast against the gate structures(possibly, in combination with strengthening of thestructure s) ..From an overall standpoint (design and construction),it isownerimportant that the contractor asshould have experienced personnelwell as theat the site,especially during the excavation phase, from the intakegate towards the final plug blast.31
5.0 <strong>LAKE</strong> TAP ALTERNATIVES ET.AL. DISCUSSION5. 1 GENERALThere are at least two different alternative systemsfeasible for the Crater Lake lake tap:1. The closed system/dry tunnel alternative.2. The open system/wet tunnel alternative.(Other alternatives -such as the closed system/partlyfilled tunnel -are considered of minor interest forthe Crater Lake project, and will not be dealt with inthis report.)Alternative 1 can be chosen whether a gate chamber atlow level or the shaft solution with the gate chamberabove the lakes Hm'lL is selected. Alternative 2demands the shaft solution.Each of the mentioned two alternatives has its pros andcons, which will be discussed in this part of thereport.It is found that none of the alternatives clearlystands out as to be preferred from a technical point ofview.This is probably also valid when questioning32
economy covering both construction cost and operation/maintenance. The latter should be proved by costestimating for comparison. Items for comparingestimates are, besides the tap itself, gate structureswith gate chamber/shaft/access and access to thelakeside for trash rack cleaning.5.2THE <strong>LAKE</strong> TAPCompared to alternative 2, Alternative 1 requires,amore complicated configuration, resulting in morecostly rock excavation for alternative 1than foralternative 2. Alternative 1 exposes the largestportion of rock close to the rock surface towards thelake and is thus the most sensitive alternativeconcerning weakness zones and rock reinforcement works.Both alternatives will have pipes through the concreteplug around the intake gates for ignition wires.Al ternative 2 will, in addition, have pipes both forcables to the water level gauge needed in the aircushion underneath the final rock plug and for fillingcompressed air into the cushion during the filling ofthe tunnel.The end of this pipe for compressed airshould have a diffuser cap to avoid damage to theigni tion wires and water level gauge. Alternative 2calls for pumpsand pipes to be able to fill the33
tunnel and gate shaft rather quickly before the finalblast. The pipe (s) down the gate shaft, for waterfilling, should preferably be flexible, for example, 8~or 10" ARMTEX pipe (to reduce and "smoothen" the watervelocity down the gate shaft). Alternative 2 couldalso have a pipe (depending on tap configuration) fordeairing. Alternative 1 is more demanding than...al ternative 2 concerning drainage as close up to thefinal blast as possible. For alternative 2, theperiods of time from start of filling the tunnel untiltriggering the final blast is critical.The work forthis period should be planned to the smallest detailaiming at 16 hours from start of filling until firing(this even if the delay caps should be specially madeto resist 300' of water pressure for 72 hours).Talking about installation needed and complexity,alternative 1 is preferable over alternative 2.Alternative 1leads to uncontrolled inflow of waterto the tunnel following the final blast, whereas theinflow is controlled if alternative 2 is chosen.Inthis respect, alternative 2 has a clear preference.Whilst alternativethe intake gate1 gives the largest impact againstcaused by the water' s inflow,al ternative 2 could perhaps be considered as somewhat34..
more risky when talking about maintaining the aircushion which is essential to avoid an undampened shocktransmission from the detonations to the gate.However, as the pressure in the air cushion is lessthan the water head in the lake, the quantity of airthat eventually must be pumped into the 9ushion shouldprobably not exceed the quantity of water leaking in.The water leakage into the tunnel should not be sogreat as to prevent drilling and loading of the finalplug, and hence the question is considered of littlepractical interest.Considering the lake tap itself only, it can be saidthat there is no important difference between the twoalternatives. According to current Norwegian practice,alternative 2, the open system/wet tunnel method is, asarule, preferred both for technical and economicalreasons.As, however, the choice between alternativescan be influenced by conditions outside the tap/intakearea, the closed system/dry tunnel method sometimes ischosen for economical reasons.5.3TRASH RACKAs learned from the submarine inspection, considerablequantities of trees, logs and branches are found on thelake bottom in the tap area.It is evident that35
these trees et.al., should be removed prior to the lakepiercing.It is further clear that the lake carriestrees, etc.~and therefore that the tap opening shouldhave a trash rack preferably even a rough,intermediate rack installed before the first draw-downof the lake.It is recommended that the permanent rackshould have cleaning equipment, and that there, forcleaning purposes, should be an access to the hillsideabove HWL in the lake.This might well, for reasons ofcost, influence the choice for tap alternatives towardsthe open system/wet tunnel alternative.5.4INTAKE STRUCTURESAs stated above, the lake tap alternative 2 demands agate shaft up to a gate hoist chamber with invert some10-20' above Crater Lake's HWL, whereas alternative 1could either have the same shaft or a gate hoistchamber some 30' above the invert of the headracetunnel at the gate (recommended plan according to DM23). In this respect, alternative 1 could thus be saidto be the most flexible one.!II'"'.Alternative 2gives the opportunity to excavate atunnel from the gate chamber to the lake side as an'"acce ss to the trash rack cleaner.This adit would be36
only 380'-400' long.Close to the lake side thistunnel could be enlarged to form an underground housingfor the trash rack cleaning equipment.It is judged that alternative 1 should also have anaccess to the lakeside to be able to serve the trashrack cleaner.As the hillside along the lake is quitesteep, this access should probably also be through atunnel.It is assumed that a tunnel is found to be themost economic access solution in this case, one willhave the following total lengths of access adi ts andgate shaft:Alternative 1:Adit to gate chamberAdit to trash rack clean~rGate shaftApproximately 1270'Approximately 1270'Approximately 12-15'Alternative 2:Adit to gate chamberAdit to trash rack cleanerGate shaftApproximately 820'Approximately 390'Approximately 240'Ai ternative 2 will need a225-230' higher gate shaftthan alternative 1, also a 225-230' longer gateoperating rod.The rod will need side supports {side37
38bearings) anchored to the shaft wall by mean~· ofconcrete brackets to avoid buckling of the rod whensetting the gate.Even if the gate shaft with operating rod and ladder isexpensive (could the hoist be omitted and the shafts'be dimensions reduced?) , it is felt that theconstruction cost for the longer access adi ts, whichalternative 1 needs, will be close to balancing thecost for the higher gate shaft with equipIllent whichalternative 2 calls for. Thus, difference inconstruction cost between the two tap alternatives isthought to be of no particular iIllportance with respectto choice between the alternatives.5.5CONCLUSIONBased on the above discussion of some of the pros andcons attached to the two alternatives for performingthe lake tap at Crater Lake, the conclusion is that noimportant arguments are found which could lead to aclear recommendation that one alternative should bepreferred before the other.This is valid when talkingabout technical differences, probably also whencomparing costs (operation and maintenance included).The last statement should be proved by cost estimatingfor comparison.
6.0 HEAD RACE ALTERNATIVESTentative Layouts/discussion6.1 GENERALThe following two alternatives to the solution shown lnDesign Memorandum 23 are seen for headrace features totake the power water from Crater Lake to the powerhouse:Alternative 1: Unlined headrace tunnel at high levelwith unlined 45° pressure shaft and aflat, steel-lined pressure tunnel atelevation 100'-140' to meet the inclineddead end shaft excavated in 1970.Alternative 2: Unlined pressure tunnel slopingapproximately 12%from the intake gatedown to a flat steel-lined pressuretunnel at elevation 100 '-140' to meetthe inclined dead end shaft excavatedin 1970.This alternative implies anair cushion surge chamber.The final alignment and configuration for thealternatives will probably be inf 1 uenced by thelocation of the two mapped weakness zones in the area(Tsimpsian and Tlingit faults), and the plans should39
probably be modified to some extent as the excavationworks detailed knowledge about the rockconditions.(As an example, possible modification afthe location of the air surge chamber is indicated onPlates 7 and 8.)Based on tentative layouts (plan and profile) roughlyillustrated by Plates 3 through 8, the headracealternatives 1 and 2 are briefly discussed in this partof the Report.Some remarks are given on the basicsolution, reference Design Memorandum No. 23.6.2THE PENSTOCK SOLUTION.,.The basic. solution as shown in Design Memorandum 23implies that the muck from the shaft excavation must beloaded in the valve chamber and from there transportedto the deposit through the existing power house andaccess tunnel. Besides space for the loadingoperations, the valve chamber and adj acent tunnels/caverns should also give room for the shaft hoist withworking platform, drill jumbo and other equipmentneeded for the shaft excavation.The excavation works will result in polluted air andwater which have to be pressed/pumped from the valvechamber. To reduce the possibility that dust airshould enter the power house Ipossibly being harmfulfor the electrical equipment, the power house and
workshop area should be shut off from the constructionarea and subjected to some over-pressure.Both the scarce working space available and thedust/water questions makethe solution indicatedsomewhat problematic, timeconsuming,and,thus,expensive.It is thereforesuggested that anaccessadit to the shaft be considered to separate theconstruction from the existing power house.6.3ALTERNATIVE I:TUNNEL AT ·HIGH LEVEL, UNLINED PRESSURESHAFT. (Plates 3 and 4)The configuration shown on Plate 3 is probably the onethat brings the tunnel and pressure shaft as near tothe hillside as possible for reasons of needed rockcover, thus providing the shortest waterway from CraterLake to the power house.It might be necessary tobring the upstream end of the steel-lined tunnelfurther into the rock masses depending on rock qualitywhich will be revealed during excavation of the accessadit.Plate 4indicates two al ternative elevations to thesteel lined tunnel. The alternative indicated bydashed lines is found to be the preferable one.Thereasons for this could be given as follows:41
The full-lined alternative gives the best rock cover atthe downstream end of the gravel trap and also possiblythe shortest steel lining (90' -lOa' shorter) togetherwith the simplest steel lining configuration.Thealternative means that the inclined shaft, excavated in1970, should be omitted and that blasting is necessaryvery close to the existing valve chamber and the LongLake bifurcation.It also means that the access aditinvert at the portal should be at a low level to landat the proper level at the gravel trap so as to avoid acontra-sloping adit and pumping.Thedash-lined alternative brings the blasting awayfrom the Long Lake penstock, allows the access adi tportal at a favorable elevation,self-drained and well-sloping.thus making the aditJudging the pros andcons, it is found that the alternative indicated withdashed lines should be preferred and it is suggestedthat the fur~herplanning for comparing alternatives bebased on this solution.The following description isbased on the assumption that this suggestion is agreedupon.Description:An access adit with a length of some 1150' leads into agravel trap with invert at elevation in the range of100'-140'.The invert of the adit at the portal could42
e chosen so that the adit's slope will be appropriatefor rail-carried equipment (i. e. maximum 1:100,preferably flatter). By this, the cross sectional areaof the adit could be kept to a minimum for excavationpurposes (in Norway a cross section area in the rangeof06-9 m 2 (65 100 ft2) would have been chosen forpractical/ economical reasons).The upstream end ofthe access adi tshould have a concrete plug not lessthan 75' long (depending on rock quality).The plugshould have a steel door, approximately 6'5" by 6'5" toallow the entrance of a small tractor for digging outgravel from the gravel trap.Cement grouting aroundthe plug should be carried out.The dimensions of the gravel trap will depend on howsmall grains one wants to have settled in the trap.Asafirst approach, the length of the trap could beassumed to be in the range of 100'-150' (30-45 m)andthe volume probably some 1200-1300 yd 3 (900-10003m ). A shot-crete or concrete lining on the trap'sroof adjacent to the steel lining should be consideredto avoid that falling rocks are sucked into the steellining.The gravel trap should provide reasonably good spacefor loading out the muck and for the shaft hoist withplatform, drill joints, etc.43
Fromthegraveltrapboththehorizontalsteellinedpartofthewaterwayandthe45 0 pressureshaftareexcavated.The steel lined part is assumed to be excavated using railcarriedequipment.The cross section could be as indicated bythe sketch.The lengthof the tunnel fromthegravel trap to the shaft,excavated in 1970, wouldprobably be some 750'-800' and the length ofthe steel· lining down tothe spheric valve, some...STEEL RAIL900'-950'.The 45°-pressure shaftwill probably have alength of 950'-1000'.44
The cross sectional area should be decided by economiccalculations (which likely will show more than 40which again 1S minimum for constructionequipment available in Norway).Plate 4 outlines an alternative surge shaft solutionoften chosen in Norway for reasons of cost:Instead ofchoosing the vertical shaft (or tank)solution, theinclined pressure shaft is continued up to the crosssectional leve I needed to serve as a surge tank. Ifthe area of the pressure shaft is sufficient to give astable power plant (which often is the case), thissurge tank solution tends to be the cheapest one.There are two main reasons for this: 1) the surgeshaft can be excavated in the sameworking rhythmlearned during the pressure shaft excavation without anew rigging, and 2)the surge tank excavation can beperformed without disturbing impact onthe headracetunnel excavation.Plate 3 indicates an alternative location for theaccess adit to the headrace tunnel, namely that theadit could be moved upstream. Making up theconstruction schedule, this might prove to beadvantageous as one will arrive at the intake and taparea sooner, obtaining better time for the works in45
this area such as gate erection, grouting, and otherrock reinforcing works which should be reckoned withand taken into account.6.4ALTERNATIVE 2: SLOPING UNLINED PRESSURE TUNNEL WITHAIR CUSHION SURGE CHAMBER. (Plates 5 through 8)Two tentative layouts are shown for this alternative.Plates 5 and 6 show a configuration where both theaccess adit to the pressure tunnel and the steel linedpart of the waterway are taken up beyond the assumedlocation of the Tsimpsian Shear Zone at tunnel level.This layout proposes the access adi tto be excavatedthrough the shear zone before the excavation for thesteel lined part is started.Thus,the shear zonecharacter and conditions at tunnel level will berevealed at the earliest stage of work. Theconfiguration indicated could be said to be the safe..one.However, as the shear zone is judged to representno serious problem for the tunneling, it is suggestedthat one should go for the more "venturesome" solutionindicated by Plates 7 and 8 to take advantage of thepossibilities for saving costs that this configurationyields. The two layouts are, in principle very much ~,alike, and what is said in the following will, to alarge degree, apply also to the more safe {and less46
flexible) layout. It could be remarked that theconfiguration shown on Plates 5 and 6 takes asteellining some 1400' long at low level, and that for thisreason the solution indicated might not compete withthe recommended configuration shown in DesignMemorandum 23.Plates 7 and 8 show a configuration that could belooked upon as a first approach to the sloping tunnel/air cushion surge chamber solution.It is proposedthat this approach should be subject to more detailedconsiderations to arrive at a choice betweenalternatives.The configurations could be described/discussed asfollows:An access adit some 1300' long leads into a gravel trapwith invert at elevation approximately 100'. Theadit's invert at the portal could beat elevationapproximately 20', giving a slope of approximately 1:16for the adi t. As the sloping headrace tunnel forpractical/economical reasons should be excavated usingrubber tired equipment (this is true in Norway,probably also in <strong>Alaska</strong>), the cross sectional area ofthe adit should not be less than around 190 ft2(1 7-182m ). The upstream end of the access adit47
should have a concrete plug with a steel door asdescribed for alternative I' (see page 43).In thiscase, the steel door might have increased dimensions toallow the entrance to the gravel trap and tunnel of asmall truck; for example, a circular door with adiameter of 11'-12' (3.5 meters).NOTE:It is proposed that (before turning towards thegravel trap) the adit be excavated through the weaknesszones found in drill hole DR11S(1982) in order to beable to judge the true character of these zones andthus to be able to identify the final location of thegravel trap.What is said on page 43 about the gravel trap foralternative 1 also applies to alternative 2 and is notrepeated.The steel-lined part of the waterway should beexcavated using rail-carried equipment to keepthedimensions down to what is needed for concreting aroundthe steel liner.This means that the muck from thisexcavation should be reloaded in the gravel trap andtransported out the adit on trucks;otherwise thedimensions for this part of the waterway will be asstated on page 43 for Alternative 1.48
The pressure tunnel sloping from the upstream end ofthe gravel trap is proposed to continue in the samedirection as the steel lined part to cross the first ofthe main shear zonesTsimnsian) at a favorable anglebefore turning towards Crater Lake.The tunnel willhave a length in the range of 5500'-5800' and a slopeof 1:8 to 1:9 to land at the proper elevation a littledownstream from the gate structures. As alreadymentioned, the tunnel will, for technical/economicalreasons have across sectional area of some 190 ft22(17-18 m ), and the reduction in head loss will, ofcourse, be taken into account when doing economiccalculations to compare alternatives.As this alternative does not need an access adit in theintake/tap area, it should be noted that the largertunnel probably should proceed beyond the gate shafttowards the lake tap.Even if this procedure will takemore concrete for the gate structures, it is thought tobe cheaper than changing over to rail-carried equipmentat the top of the sloping tunnel with reloading ontotrucks at this point.The last part of the tunneltowards the tap point should probably not haveanenlarged cross sectional area, but the mucking-outshould be carried out according to the load-and-carrymethod, using a small (wheel) loader.49
Depending on the rock conditions In the air chamberarea revealed by the excavation of the downstream'partof the pressure tunnel and the investigation/me~surementsduring construction proposed elsewhere inthis report, the air cushion chamber could either belocated on the downstream side of the Tsimpsian shearzone or on its upstream side (i.e. between theTsimpsian and the Tlingit zones).The air chamber should have an adit of 150'long (45-50meters) -cross sectional area and slope as for thepressure tunnel -to bring the chamber itself up to theappropriate level. The chamber should, again forpractical/economical reasons, have the form of a shorttunnel. According to simplified calculations thefollowing chamber dimensions should probably provide astable power plant and meet the upper and lower surgelimits:Width 35' - 40' (11-12 meters)Length 110' -120' (34-37 meters)Height 25' - 30' (8-9 meters)This should result in the excavation of some 3200 yd 3(2400 m 3 ) of rock or a little more, and an air volumeof some 2600 yd 3 (2000 m 3 ) or a: little more. Thiswould be in addition to the access adit.50
To obtain easier water flow out of the chamber due toload increase, or starting up the unit, the invert ofthe chamber should preferably be given a gentle slope(for example 1: 40) towards the pressure tunnel. Itshould also be noted that the upstream part of the aditprobably should have a conical shape (roof to be liftedtowards the chamber) so that a substantial part of theadit could go in as a part of the surge chamber.A restricted inlet (orifice) to the air chamber is notused in Norway and should probably not be consideredfor the Crater Lake project.The surge chamber should have a water level gauge tomoni tor the air cushion. There should also be a pipein to the cushion so that air lost through adsorption,and possibly also through some leakage of air out ofthe chamber, can be replaced.The compressor (for airfeeding into the chamber) could be placed in asmallcave located in the upstream part of the access adit.6.5CONCLUSION1. Having reviewed the penstock alignment and adjacentfeatures as shown in Design Memorandum 23, there is aclear feeling that an access adit should be provided sothat the penstock construction work,to the extent51
possible, is separated from the existing valve chamberand power house/maintenance area/access tunnel. Bydoing this, the features otherwise needed to avoiddusting down are omitted, and the shaft excavation,especially the loading and transportation of the muck,could be carried out in the simplest and mosteconomical way.In spite of the cost of the adi titself and the somewhat more complicated penstockalignment, it is thought that the adit solutional together represents the best and cheapest penstocksolution.2. Subsequent to reviewing the geologic informationmade available, tentative layouts for two alternativeheadrace solutions have been worked out:1. Headrace tunnel at high level with unlinedpressure shaft.2. Sloping headrace tunnel with air cushion surgechamber.The alternatives are illustrated on Plates 3-4 and 7-8.The conclusion arrived at is that there should be nodoubt that both alternatives are feasible.Consequently, reduction of the length of the steellinedpart of the waterway is viable.52
3. Comparing the basic headrace solution (OM 23) andthe two alternatives indicated from a technical(operational) point of Vlew,it is judged that thethree solutions could be considered equal.Comparing the basic solution to the alternatives froman economic point of view, it can, judged on the basisof Norwegian experience and prices, be stated that thebasic solution would most likely be overruled by eitherof the alternatives.4. Comparing the two alternatives from an economicpoint of view it is not possible to judge which is thepreferable one.The choice could be done followingcomparative cost estimating. When doing this, thelesser headloss 60nnected to the sloping pressuretunnel-air cushion surge chamber solution should betaken into account.53
7.0 SUMMARY OF ADDITIONAL INVESTIGATIONS/INFORMATIONPROPOSED OR REQUIRED DURING THIS STUDYThis section summarizes our views on requiredinvestigations et.al. Most of these have now been doneas a part of our previous recommendation and areincluded herewith, just to note our overall concerns inthese areas.Proposed by Corps of Engineers:A. Sonar survey of intake area, and mapped at ascale of 1" = 25'.B. Drillhole No. 111, No. 114, and No. 115*.Proposed by ConsultantA. Seismic refraction measurements in 5 profilesat the intake.B. Drillhole No. 112 and No. 113.C. Rock stress measurements in the shaft behindthe power station.54
D. Detailed measurement of the blasted Crater Lakeshaft behind the power station. Exact measuresof length, angles, and cross section arerequired for preparation of the plan andspecifications.SECTIONPLANE. Measurement of the rock pressure in the end ofinclined shaft behind the power station.55
F. All new core drilling should include:1) Permeability test (Lugeon tests with testlengths of 5 meters)2) Photographs of the cores.3) Core logging inlcuding RQD~values4) Drillhole No. Length111 90° 750'112 60° 400'113 60° 600''cc,,:,114 60° 600'115 45° 750' (or thebottom elevationof215 feet. ):56
8.0 ATTACHMENTSo Askara Model Tests (Pages 59 to 63)o Ringedalsvatn Lake Tap (Pages 65 to 68)0 Plates- Plate 1 - Drill Hole Location- Plate 2 - Drill Hole Location- Plate 3 - Headrace Alternative 1 - Plan- Plate 4 - Headrace Alternative 1 - Profile- Plate 5 - Headrace Alternative 2 - Layout #1- Plan- Plate 6 - Headrace Alternative 2 - Layout #1- Profile- Plate 7 - Headrace Alternative 2 - Layout #2- Plan- Plate 8 - Headrace Alternative 2 - Layout #2- Profile57
ASKARA MODELTESTSCHEMATICSSheets 111.1 through 111.558
INNLEDENDE FORS0K + FORS0KSSERIE A,S,C( J FR. I N G. C HR. F. G R 0 N E R S T E G N . N R. 43 2 - 037 ).,. .......1a m,. . -. ..)FORS0KSSERIED,E.... >,.ASKARA KR.~FTVERKTUNNELUTSLAG UNDER VANN1----...:::.....--.VASSDRAGS· OG HAVNELA80RATORIET VEO NTH I 600423\JAN. 1969 I IIL1 I. .,-....
,~~( ~-~~I ~~,~~.~~~~. ~-~--~\~:;;:=::::;-:;:--=' ·~·I ~~~.~ ~.. Ir _. ___ .~\~,..-.... · --.- -,... ... .. -- ~ 1FORS0KSSE:J ..10 rr."lo,...ALT IiI ALTl-lI JLJ'r12mI -) .,-----;,6m~'I'-------'------'.1III ->~rFORSGKSSER1E G. H.(IFR. JNG. CHR .F. GR8NERS SKISSE 432- SK-23)ASKARAKRAFTVERKTUNNElUTSLAG UNDER VANN111.2VASSORAGS- OG HAVNEl.ABORATOR:ET VEO NTH I 600423 I JAN. 1969'.I.
FORS8KSSERIE I( IFR.JNG. CHR.F. GRO~JERSSKISSE 432-SK-23)I___ oJ),...- ...... """),)/I ,." .. ....... ./cI~~'====>~~====Y~,....====~),====.v/==~.~~=-=~~,====~~~==~.'~==~l'====~==~"==~ __ -FORS0KSSERIEJ, ..ASKARA KRAFTVER~\TUNNELUTSLAG Ur~Dt.:R YANNVASSORAGS- OG HA'INELABORATORIET VEO NTH I 600423I1--13I JAN. 196~j iL.
,..,...--------.I~ "'Ij.FCRS8KSSERIE: Y.Ie---- 18m ------..1FORSGKSSERIEL, N.., -.".....ASKARAKRAFTVERKTUNNELUT5LAG UNDER "ANN . IIi L1VASSDRAG5- OG HAVNELABORATC~IET VED NTH I 500423 l JAN. 1S69J - --- ;
'''', II ,,. .Ie ,>, '"--FORSGKSSERIE MASKARAKRAFTVERKTUNNELUTSLAG UNDER VA~NT1- -VASSDRAG5- OG HAVNELABORATORIET VEO NTH I 600423 I JAN. 1969. 1.8.'
RINGEDALSVATN<strong>LAKE</strong> TAPFigures 1 through 464
~
~70 (1542 ttlr.1.)0. 1.20~ . ~ 1 0'1.00. m.380• )70~.l6O(1470 ft.lit1&~ . --III~bO~ - ... ==-~v~4~56~,O~(~14~96~f~tJ~ __!.--______________ ~so... _-...... _-- --1 SOUNDINGS------ / /-------.... IL-----------------======:EEftR:tlrbrfrd3')0 1114e ttl .'PRESSURE CELU· -I-HO-rt~~~ PRESSURE CELL 2.SECTION,-----=====--. __ 2~8.Q~m~. ---------.rt~2) r-1 I B 79 ttl c::--0.l'tl-rlL-..:.-0----=-1'"' PJ~ ________ ~~P31PLAN-"- .I~P33 .~70~~oj~ 10 I~OO)qO •}80 •370,)bO,3'>0 JFig. 2
E FO~R __BLES (MEASURE)PIPE EQR:AIR-FILLING.CABLESDE-AIRINGWATER LEVEL. .f;- -t GAGE,A AI',I "SECTION. A .. A.PIPES. FOR-------.=C-,---,--"A B~~. S - M E A SUR E . 1.AIR-FILLING' .2.'----"'C~A6.1ES ~ IGNITION 3.,---,QEJ~Jj~JILG_ . . . 4.WATER LEVEL ''I.-----GAGE {PERMANENT) ,5.AIN GATE.{120B ftl.~04. ft.)~ , ~--5 3__ ~~~~~~~~~~"~~~1 2SECTlON OF GATESHAEL-'"P 33'FINAL· PLUG' AND ADJACENTTUNNELSECTION Fig. (
. 500(1640ft JEzoI~490480470~ 460-Iw4504f. 0~1444 f t.)1. ", ."SEC.I,,0-,----~/PRESSURE CE~~ ~.:.-.- ,..1.f,:PRESSURE CELL 2.-~~ I '.~., >:. PRESSREf ~. \.~ .CELL 1..i_ - - - - - "---~ ...".., '-.~.--W~.; __- .",. ,-.. "'- '" -....... ...... .... ~-.--.- '~ . " I'-. ..::.:a- :.::::-,..:. ? --681012141618i "10""" ,',' DELAY NO.3 5 '/ 9 1113 i511I0,51,5-21 2,5:'"fDELAY.DYNAMIT~NO~ KG. ibs,0 7,8 173 15,6 34 1 n5 15,6 341/26 11,7 267 ' 15,6 34 1 /zB 23,4 51 1 /z9 ' 39,0 . 8610 23,4 51 1/211 621+ . 13812 31,2 6913' 64,1 141. 1/. 90,9 200~5 117,6 25916 96,2 21217 21,4 47 .18 801 177SUM:: 716 1578Fig. 4.'!
(0.'$ Ot INGINIlU---------;,_ I / i 11. I .,..-/ j', \\ \"'I:Z:....... "~ . . " " \ ~..f'. .~/\ •c. .. ",., ""'''''','' LA . . \. \ \UlllllllOllS Oli mil (;ItA"'lIUt AI..,. Ott 112.0" IIISECTION A-A... _ " '1lfJ-o"!." .. IIc,... .... __1 -... c
U. $ . .aIMl'... o ...... ~-...:... 'j'"u •• ~.~ ••••• " .og .'O,..,." ... ,·,tI, .... '1 'MalO ... ,)O,o'U .... ", .. '''.',. UO,:. lOol~) U. II'''W. , .. ~ ",ltl" 11:"o LI .... ~ UI I· .. ~ •• , Lk3 ''';''l.· ",.
PLATE 3
SNETTISHAM - <strong>CRATER</strong> <strong>LAKE</strong>HEADRACE ALTERNATIVE 1TUNNEL AT HIGH LEVEL'WITH45% UNLINED PRESSURE SHAFTPROFILE80{)j'O()30()100'.·1 ~PLATE 4
), .:./-LEGENDL ___ ~=:J •.u.JO~ w~.I,"'l'il~S lONE..../ '"' L~-=:J ~~~~:::;, .. !~~tl,~,;~'r~~T""~AAI ~()(..------- -- JD'N1S It '''!Jll~ l""U,Illl1{to" .. l[Ol_.~ __ -.---~.- lJlHt CIION Ot 1I0lENUll ~"0 f1 jga' NO'....... ~-:.---=.:--:.=jr..~~ .. ,' " .. ,' ,". I()O·· O·o j'UlWu:.lD 11()llS - 11131o Cllr;lIl""l,f.j IIO\.e5 ~ 11113ol> (.ullI·~ 01 lli(,'" lll~ Mdll5 ~ III'~-~---,U.S. AHMY lNGINl't..:H OI~IHICT. ALASKA""~'~HEADRACE- ALTEFiNATPJE2~-' -,,, .. --- LAYOUT .. 1 ',-" ... -- SLOPING PRESSURE TUNNEL..... ". WITH AIR CUSIlION SUnGE CHAM[JER:1o.'1r>.!JC-- --~---. - .. ,. ... ,., •• ~~------~••. ' .... I' .. If;PLATE 5
SNETTISHAM - <strong>CRATER</strong> <strong>LAKE</strong>HEADRACE ALTERNATIVE 2LAYOUT -#1SLOPING PRESSURE TUNNEL WITHAIR CUSHION SURGE CHAMBERPROFILE"Joe)6a~.5 ()tJ\\~'9~•J.\.i;O()'3 atJ~I..PtA I F ij
PLATE 7
,rSNETTISHAM - <strong>CRATER</strong> <strong>LAKE</strong>HEAD RACE ALTERNATIVE 2LAYOUT #2'-..::\~\\~-....'"" -l>?"'"-",-to~......I-/U/£'.~------~-~Q_--Cl'ahl' /t:?keSLOPING PRESSURE TUNNELWITH AIR CUSHION SURGECHAMBERPROFILE£1. ()______ .-"V 5.5 OD I "0 ,;.;/t!.IPL. E 8
ADDITIONAL CLARIFICATIONSIN RESPONSE TO THECORPS OF ENGINEERSREQUESTJanuary 1983
~-o "Page 3, Section 1.2.1, paragraph 2: "No additionalexplorations are deemed necessary prior to construction,however, as is discussed in Section 3-.5, explorations inadvance of construction will be necessary in the surgechamber area." Since DH1lS did not penetrate the potentialsurge chamber area and since the exact location and extentof the faults are unknown, it is·only prudent to explore thearea, by visual inspection, as part of the constructionactivities before a final decision should be made as to theexact location of the chamber. If questionable conditionsare encountered a possible pressure test may be necessary todetermine its air holdin~ capabilities."o Page 6 - 2nd paragraph, 14th line, last two words: "Deletethe words intake structure and add vented surge tank in lieuthereof".o Page 13, first parac:tfaph: "The air surge chamber solutiondoes not demand that the pore pressure _ in the Iockcorresponds to elevation 1125 feet (or higher). If this isthe case, however, ~ne can be almost sure that there will beno need to tighten the rock by expensive -works such asgrouting, steel-lining, etc. to prevent air leakages."o Page 21, Section 4.2, and sheet III 4: "<strong>Data</strong>- from theAskara Lake tap:Hater head at tap point approximately 280 ft. (85 !>1)Cross section area of tunnel approximately 105 sq. ft.( 9 • 8 sq. H)Cross section of plug approximately 70 sq. ft. (6.5sq. M)II.o Page 27, last paragraph: "The surge in the gate shaftfollowing the final blast can be calculated. According toexperience, the measured surge corresponds fairly well tothe calculated surge. Neglecting the effect of the blastitself, the calculations are in principle simple. Decidingheadloss parameters is a problem and the reason whycalculated and measured values do not exactly correspond.Depending on the loss conditions, our experience tells thatthe surge in the shaft will amount to 70-90 per cent of thedifference between the water levels in the lake and in theshaft.Water inflow between the plug and the gate is determined tobe sufficient once suitable air cushion in the trap area hasbeen obtained, such a configuration of water, air and trapsize should ensure proper distribution and intrapment of thefinal blast at the point of tap."1
o "Page 36 "Since access to the area near th"e tap is alrnos1assured with an open system/wet tunnel, little if any ey 'acosts will be involved in obtaining access to clean '-11~trash racks. In contrast, the closed system/dry tunne:aiternative m~y not have access and in order to 'clean thLtrash rack, such would have to be provided."o Page 35-36, trash rack: "In correlation with our comment!on debris and overburden removal , a trash rack is mostcertainally a requirement at" Crater Lake. He recommend C'temporary trash rack of a size to keep trees out of the: tal:point and tunnel. Once this twap has been successfullyaccomplished, a permanent trash rack, which can be cleanedI"should be installed. As we also noted to the Corps on OUIBradley Lake evaluation, the trash rack should be, sodesigned as to allow easy access to cleaning of the rack.,Trees have been determined to be ~n the' tap area,consequently, we have every reason to expect debriscollection facilIties to be of paramount importance tosuccessful operations from Crater Lake. . ~o Page 51, 1st paragraph: "We are suggesting that th~ crosssectional areas of 2the "surge chamber n (1, 000 . ft) and"access adit (190 ft) be transitioned. at their Doint ofintersection. By doing this, the adit cross secti;nal areawill provide even greater volume for the surge chambe::: ".while yet allowing a smooth (rather then an abrupt)transi tion between the two structures therebv allowinc theair to also flow easier through an orifice tr~nsition. JThi~can best be accomplished through a conical sloped roof froITthe adit.to the valve chamber."o Debris and overburden in the lake tap area: "Three i terns·are of critical importance in the tap area, they are rockslabs over the tap point; tightness of rock at the point ofpiercing and debris and overburden. The first two concern~will be further evaluated during probing operations as oneapproaches the point of tapping. As to the last concern,this question should be addressed as soon as possible,~certainally the evaluation of the yet to be accomplished,.side scan sonor is of paramount importance. Since withoutthe bene fit of the sonar scan of the tap area, all we have",been able to evaluate are the existing sounding andsubnarine video tapes which 'were marginal at best. Yet, wedid notice what appeared to be large trees and debr~s in and~among the overburden in the tap area. Hi thout question,this must be removed to an area sufficiently below the point'of tapping and area wise, such that the overburden material".]ill no longer present a probable tap blockage. There is'just not enough information available so that we could g~ ~a more preci~e definition af the extent at this time."
3" "(oReport Recommendations pertaining to additional surveys andexplorations (summarized here is one section for the Corps):(a)Surveys:1.,..,f"AL.+lol'\Tap area - A seismic ~QfFatuee survey of the tap(see also plate I) may be ap~fPpriate, especiallyif the side ~ sonar cannot providenecessary delineation of the debris and overburdenin the vicinity of the tap area (paragraph 1, page3 and paragraph 3.2 page 15).2.Powerhouse "area - In order to better evaluate therock stress conditions, stress measurements shouldbe performed at the bottom of the shaft excavatedin 1970 (for the Crater Lake phase) and as far aspossible from the power station (paragraph 3, page11) .3. Registration of water inflow (leakage) to - thepressure tunnel during excavation. is an important~eans of evaluating possible air leakage from theair cushion surge chamber and of deciding whetheror not precautions such as grouting should benecessary. At this stage of the constructionwork, rock stress measurements should also beperformed to ensure that rock stresses are of anacceptable level for the air" surge chamber (lastparagraph, page 20).4. Detailed measurement of the blasted Crater Lakeshaft behind the power station. Exact measures oflength, angles, and cross section are required forpreparation of the plan and specifications(paragraph E, page 55).5. Heasurement of the rock pressure in the end ofinclined shaft behind the power station (paragraphF, page 55).(b)Explorations:1. Sounding drillings should be carried out ahead ofthe tunnel face (length at least two time thelength of each round) during excavation to controlplans and avoid surprise (last paragraph, page 18and first paragraph, page 19) .( 1 )Side scan sonar ~s considered very important to betterevaluate the tap area and overburden conditions, suggestunden·,7ater surface mapping should be done at scale of 1 "=25' .
2. If a pressure tunnel with an air surge chamber c:':an unlined pressure shaft is chosen for +-1!project, the access adit to the gravel trap at leupstream end of the steel-lined part of t~~headrace will enable . explora tion ahead of tl ~excavation of the adit to be done so that theweakness zone (s) found in DH106 and DHl15 could ~,Rlocated at tunnel level, thus giving a base ft ~making the final decision concerning the 10caticJllof the upstream end of the steel lining.It is of importance that the headrace tunn~_should be excavated beyono the air chamber areabefore the chamber's location is f inally decide~'Also, core drillings with water pressure test.;should be performed' from the pressure tunn~lbefore the final location of the air chamber .Y'chosen (last paragraph, page 13, and first t\· Iparagra?hs, page 20).3. Any new core drilling should i.nclude:1) Permeability test (Lugeon tests with te~~lengths of 5 meters) .2) Photographs of the cores.3) Core logging including RQD-values.4) Drillhole No.111112113114115Dip.90 060 060t)60°45°(Paragraph F, page 56.)Length750'400'600'600'750' (or the bottomelevation of 11\215 feet.)
·""'EXHIBIT 5<strong>LAKE</strong> TAP CLEARING FEASIBILITY STUDY<strong>CRATER</strong> <strong>LAKE</strong> <strong>PHASE</strong>SECOND STAGE DEVELOPMENTSNETTISHAM J ALASKAJUNE 1984TRYCK JNYMAN AND HAYES
<strong>LAKE</strong> TAP CLEARING FEASIBILITY STUDY<strong>CRATER</strong> <strong>LAKE</strong> <strong>PHASE</strong>SECOND STAGE DEVELOPMENTSNETTISHAM ~ ALASKAPrepared for:THE DEPARTMENT OF THE ARMYCORPS OF ENGINEERSANCHORAGE, ALASKAALASKA DISTRICT~Contract No. DACW85-84-D-0003Delivery Order No. 3TRYCK~Prepared by:NYMAN & HAYES740 "I" StreetAnchorage~ <strong>Alaska</strong> 99501With Assistance From:Mr. Al MathewsConsulting EngineerTacoma, Washington
<strong>LAKE</strong> TAP CLEARING FEASIBILITY STUDY<strong>CRATER</strong>. <strong>LAKE</strong> <strong>PHASE</strong>SECOND STAGE DEVELOPMENTSNEl'TISHAM, ALASKATABLE 0 F CONTENTSPage No.1.0 Introduction2.0 Site Description3.0 Climatology3.1 General3.2 Precipitation3.3 Temperature3.4 Sunshine3.5 Snow3.6 Lake Ice3.7 Avalanches4~0 Existing Lake Bottom Conditions5.0 Proposed Methods of Clearing5.1 Clamshell Method5.1.1 Plant and Equipment5.1.2 Production Schedule5.1.3 Mobilization Schedule5.2 Slusher Method5.2.1 Plant & Equipment5.2.2 Production Schedule5.2.3 Mobilization Schedule122223333334568891012 -126-.0Pros6.16.26.36.4and ConsSlusher Method - ProsSlusher Method - ConsClamshell Method - ProsClamshell Method - Cons13131414147.0 Bench Above Tap8.0 Construction Difficulties and Costs9.0 Mobilization Through the Tunnel9.1 Pros - Lake Access Through the Tunnel9.2 Cons - Lake Access Through the Tunnel1415161717
TABLE OF CONTENTS(Continued)Page No.10.0 Crew Sizes for Slusher Method10.1 Clearing Crew, Each Shift (2 shifts)10.2 Clearing Crew, Day Shift (1 shift)10.3 Mobilization Crew at Lake (1 month10.4 Mobilization Crew at Snettisham (1 month)10.5 Unload and Pre-assemble Crew (1 month)10.6 Administration and Supervision (6 months)10.7 Demobilize10.8 Diving for Inspection and Emergencies11.0 Crew Sizes for Clamshell Method11.1 Clearing Crew, Each Shift (3 shifts)11.2 Clearing Crew, Day Shift Support (1 shift)11.3 Mobilization Crew.at Lake (Same as 10.3)11.4 Mobilization Crew at Snettisham (Same as 10.4)11.5 Unload and Pre-assemble Crew11.6 Administration and Supervision11. 7 Demobilize11.8 Diving for Inspection and Emergencies12.0 Additional Studi~s13.0 Contractor Comments13.1 Underwater Construction Inc., Anchorage, AX13.2 S. J. Groves & Sons Company, Bellevue, WA13.3 Parsons-Brinkerhoff, Sacramento, CA13.4 J. A. Jones, Charlotte, North Carolina14.0 Conclusions1717171818181919191919192020202020202021212121"2121APPENDIXPlates 1, 2, 3 and 4Cost Estimating Sheets (6)Mesotech Sonar Systems Literature
<strong>LAKE</strong> TAP SITE CLEARING FEASIBILITY STUDY<strong>CRATER</strong> <strong>LAKE</strong> <strong>PHASE</strong>SECOND STAGE DEVELOPMENTSNEITISHAM HYDROELECTRIC PROJECT, ALASKA1.0 INTRODUCTIONThe purpose of this report is to make recommendations regarding feasiblemethods of clearing the overburden from the proposed lake tap site at CraterLake, Snettisham Hydroelectric Project. This work was prepared for the <strong>Alaska</strong>District of the U.S. Army Corps of Engineers (Contract No. DACW 85-84-D-0003)to assist in the preparation of contract documents and solicitation of bids forthe clearing of the proposed lake tap.Government furnished materials provided to assist in the preparation of thisdocument included: ~,• "Final Report Side 'Scan Sonar and Subbottom Pro'filing Survey, CraterLake, <strong>Alaska</strong>"; Ocean Surveys, Inc., 1983• Video Tapes of the bottom of Crater Lake at the Lake Tap Site, takenin 1973• Exhibit Drawing, Project Location and Vicinity Map• Photographs of Crater Lake and surrounding area• Drill hole logs for in-lake dtill holes No.' s DDH-l08, DDH-l09, andDDH-llO; drilled October 1974 and logs prepared November 1974•Exhibit Drawing, Proposed tunnel alignment in Lake Taptunnel, tap, bedrock contours, drill-hole locationslimits)• U.S. Geological Survey Quadrangle, Taku River (A-6)area (showingand cleating• "Snettisham Project <strong>Alaska</strong>, Crater Lake First Stage Development;Design Memorandum #26, Plate 2, Power Tunnel Plan and Profile," U. S.Army Engineer Disttict, <strong>Alaska</strong>• "Snettisham Project <strong>Alaska</strong>, Crater Lake First Stage Development;Design Memorandum #26, Plate 6, Lake Tap and Primary Rock Trap Planand Profile," U. S. Army Engineer District, <strong>Alaska</strong>•"Snettisham Project <strong>Alaska</strong>, Crater Lake FirstDesign Memorandum #26, Plate 9, Gate Structure;'~District, <strong>Alaska</strong>Stage Development;U, S. Army Engineer• Snettisham-Crater Lake Phase Critical Path Schedule (Design Memorandum#26 through power-on-line)• "Snettisham Project <strong>Alaska</strong>, First Stage Development; Design Memorandum#1, Hydrology," U. S. Army Engineer District, <strong>Alaska</strong>, 1964 .
ooo"Snettisham Project <strong>Alaska</strong>, First Stage Development; Design Memorandum117, Ge~eral Design Memorandum Vol. 1 of 2, Main Report, t. U. S. ArmyEngineer Distri~t, <strong>Alaska</strong>, 1964t'Snettisham Project <strong>Alaska</strong>, First Stage Development; Design Memorandum112, Hydropower Capacity," U. S. Engineer District, <strong>Alaska</strong>, 1964"Snettisham Project <strong>Alaska</strong>, First Stage Development; Design MemorandumHI, Hydrology," ·U. S. Army Engineer District, <strong>Alaska</strong>, 19642.0 SITE DESCRIPTIONThe Snettisham Hydroelectric Project is located near the northern end of SpeelArm of Stephens Passage. approximately 28 miles southeast of Juneau, <strong>Alaska</strong>.EXisting facilities include an underground powerhouse at approximately sealevel~ a power tunnel to Long Lake, a 2500 ft., long gravel runway, and associatedmaintenance facilities. The proposed expansion of the Snettisham Projectis known as the Crater Lake Phase to be constructed in two or more stages. TheLake Tap Clearing, as presently scheduled, will be performed prior to the startof Stage II excavation work. Stage I excavation includes the primary adit, thepower tunnel from Station 75+00 to approximately 45+00, camp facilities and ahaul road. Stage II excavation includes the power tunnel from approximatelyStation 45+00 to 8+50, gate structure, adit, surge tank, pen stock tunnel,machine shop and drift.Crater Lake is 1019 feet above project datum (1022 MSL) in a narrow,steep-wa:.1led valley 3-4000 feet below the surrounding peaks. The lake is approximately1 mile long, 0.4 miles wide, a maximum of 400 feet deep with a surfacearea of about 330 acres.The proposed Lake Tap Site is located in 220 feet of water at a point about 230feet from the closest shoreline. The area to be cleared ranges in depth from250 feet just below the tap to 0 feet at the shore line above the tap site. Asteep rock face rises 1,400 feet above the shoreline (See Plat 1).3.0 CLIMATOLOGY3.1 GeneralThe climate of the Crater Lake area is characteristic of southeastern <strong>Alaska</strong>consisting of high precipitation, lack of sunshine and frequent winter storms.Weather patterns are a result of the rugged terrain and the areas position inthe path of sto~s which track across the Gulf of <strong>Alaska</strong>. The mountainousterrain has a strong influence on temperatures and results in significant variationsin precipitation and temperature within relatively short distances.3.2 PrecipitationAlthough no records exist at the Crater Lake site, estimates made in 1964 forthe general area have proven to be accurate. It is estimated that the averageannual precipitation over the Long Lake and Crater Lake basins is approximately200 inches. Precipitation for Crater Lake is estimated to be 230 inches. Theheaviest precipitation occurs in southeastern coastal areas during the fall andwinter.
3.3 TemperatureBased on records at the Juneau Airport, which are considered representative ofthose encountered at lower elevations, monthly normal temperature for Januaryis 26° F and for July is 55° F. Extreme temperatures range from a high of 84°in July to a low of -21° in December. It is to be n9ted that variations in 10- •cal radiation and air drainage produce significant differences in temperaturesparticularly between upland or sloping areas and flat, low terrain. BecauseCrater Lake is deeply incised in the steep mountainous terrain, air drainagemay result in the build-up of a cold layer of air on the lakes surface.3.4 SunshineThere- is very little difference in the amount of sunshine received at variouslocations throughout southeastern <strong>Alaska</strong>; in general, the amount of sunshine isrelatively low. The length of day varies from about 6.3 hours in late Decemberto about 18.3 hours in late June.3.5 SnowNormally the first snowfalls begin toward the end of October, however,snowfalls have been recorded in the early part of September at Juneau. Atlower elevations, there is very little snow accumulation until the latter partof October with accumulation beginning at higher levels in the early part ofOctober. Peak accumula~ion is reached in the middle of March with the snowfallat Crater Lake reaching 7-15 feet.3.6 Lake IceDuring three visits to Crater Lake during the winter months the accumulation ofsnow, sleet and slush measured at the lake surface has been on the order of7-15 feet. The consistency of the material at the lake surface has been thatof a soft ice or slush, not hard ice nomally associated with a frozen lake.".'3.7 AvalanchesBecause of the depth of snowfall and the steepness of the terrain, avalanchesin this area are common, as evidenced by debris in the lake and from aerialphotographs taken during the winter months.4.0 EXISTING <strong>LAKE</strong> BOTTOM CONDITIONSA geophysical survey at the Crater Lake site was conducted July 15-17, 1983 byOcean Surveys, Inc. to aid in the design of the lake tap. This work was accomplishedunder contract No. DACW85-82-C-oOl9. The purpose of the survey was tomap the subbottom bedrock profile, determine the thi~kness of unconsolidatedmaterials overlying the bedrock, identify the location of any submerged debris.greater than 5 feet in anyone dimension. This was accomplished usingsoundings, subbottom profiles and side scan sonar.
A detailed description of the equipment procedures and findings of thegeophysical work conducted by Ocean Surveys, Inc. is contained in their finalreport "Side Scan Sonar and Subbottom Profiling Survey, Crater Lake, <strong>Alaska</strong>".It is to be noted that as a result of the report findings, the lake tap locationhas been moved to the north. As currently located, the depth ofunconsolidated deposits at the tap is in excess of 20 feet. Moving upslopefrom the tap, the deposits thin out to ° feet at about 20 feet from shore. Thematerial to be cleared consists of soil and rock ranging from rock flour andsilt up to fragments and boulders several feet in diameter. Other debris consistsof tree remnants ranging from small twigs and branches up to large trunksand stumps several feet in length. The amount of this material is variable,. from occasional trees and limbs to piles of intertwined trees and stumps.Video tapes of the bottom conditions were- made in September of 1973 using aminisubmarine. Several traverses of the bottom were made at that time coveringthe general area of the proposed tap from the shoreline (elevation 1,0],9) toapproximately the 770-foot elevation or about 2S0-foot of depth. The locationof the traverses are shown on the drawing "Snettisham Project <strong>Alaska</strong>Hydrographic Survey of Crater Lake - Hydrographic Map lA" by <strong>Alaska</strong> GeologicalConsultants, Anchorage, <strong>Alaska</strong>; part of contract No. DACW8S-C-0004. Thegeophysical work conducted in 1983 1s consistent with the information containedin the submarine reconnaissance of the lake bottom. In addition to the trees,boulders and rock flour, an old metal building was located along line "B" at adepth of approximately ISO feet (south of the proposed tap).Other information consists of three borings made in October of 1974~ Theborings encountered 2-7 feet of overburden consisting of boulders, cobbles,gravel and mud with some wood recovered. The borings were primarily concernedwith the nature of the bedrock and, therefore, provide limited information withregard to the unconsolidated deposits. The holes were drilled from a float atCrater Lake, and at the time of drilling, lake fluctuations up to 3-foot daily,made it difficult to determine the exact elevation of the top of bedrock.S. ° PROPOSED METHODS OF CLEARINGUnderwater excavation can normally be accomplished by hydraulic dredging,dragline, clamshell, slackline cableway and slusher. Due to the nature of thematerial, which includes large rocks and boulders, and because of the depth ofwater, hydraulic dredging has been ruled out for this project. Conventionaldragli~e excavation with a barge-mounted machine is not considered to be feasiblebecause of the steep angle of the drag cable due to the depth of water.Additional methods considered included mechanical vibration, underwaterjetting, and airlift pumping. It is doubtful that any of these three methodsalone would be capable of accomplishing the lake bottom clearing. More informationregarding size and distribution of rock and soil particles would beneeded to evaluate the effectiveness of these methods.
The airlift pump method would be capable of removing particles up to 3 or 4inches in diameter, however, it would not be able to remove the larger materialor much of the vegetative debris. A very ,large compressor would be required(3500 CFM at 200 psi) to airlift material at these depths.Mechanical vibration or water jetting might be used in conjunction with othermechanical means of clearing in an effort to increase productivity. It isquestionable whether contractors would be willing to mobilize the equipmentnecessary to try these methods unless they could be assured of their successfuluse.Therefore, the three methods considered technically feasible for the CraterLake project are: 1) excavation by clamshell; 2) slackline cableway; and 3)slusher. The slackline cableway and the slusher method are basically similarin that they are both operated by a cable system and would require almostidentical equipment including cables, winches, sheaves. In terms of equipment,the basic difference between the two systems is that the slackline cablewayutilizes a bucket-type excavation device, whereas the slusher uses a blade orhoe-type excavation implement. Operationally, the slackline cableway would requirehauling and discharging into a receiving hopper for disposal. Theslusher method would drag the material downslope to the west and leave it onthe bottom of the lake. It has been decided to consider slusher and clamshellexcavation in order to compare the costs and risks associated with the twomethods.The steep bottom slope combined with the tapered fill--the thicker deposit atthe bottom of the slope--may result in the fill sliding downhill if excavationbegins near the bottom. In this scenario, excavation would create an unstableupslope condition thus causing the material to slide into the area alreadycleared. This would allow excavation to proceed from a single point therebyincreasing the efficiency by reducing the amount of time required for moving.However, the success of this approach is difficult to predict, particularlywithout additional information on the nature of the material on the lakebottom.5.1 Clamshell MethodIt is contemplated that the clamshell method would employ a stiffleg derrickmounted on a sectional barge and operated by a double drum hoist with a swingerattachment. The barge would be moored to 2 anchors offshore and 2 rockanchorages in the cliff above the east shoreline and positioned by means ofwinches. The clamshell would dump into a hopper barge for transportation anddischarge in deeper water. Trees and logs would be loaded onto a separatecargo barge and taken to the west shore for disposal (See plate 4).
5.1.1 Plant and Equipment (Clamshell Method)(a) Excavation Equipment1 24' x: 42' sectional barge - 75-ton capacity1 - stiff-leg derrick, 40 ft. boom, l5-toncapacity (@40')1 - 200 H.P. diesel-driven, double drum hoist.Each drum to have capacity for300 ft. of .. l-inch wire rope. 200 fpmline speed. Also, power takeoff tooperate swinger.1 - 50 kw diesel-electric set1 - power-driven (elec.) mooring winches3 - 500 lb. anchors2 - 4 cu. yd. clamshell buckets1 - 15 ft. jib boom, 5-ton - elec. hoist2 - 20 cu. yd. hopper barges, each consistingof two sets of sectional floats, 25-toncapacity each, and one 20 cu. yd. bottomdump hopper1 - 18" x: 36' sectional barge, 27-ton capacity(for hauling trees)1 - grapple (for lifting trees from bottom)1 - D-4 tractor with dozer and boom (fordisposing of trees)(b)Marine Equipment4 - 24-ft. motor launches1 - lot: anchors, lines, fenders, etc.(c) Installation Equipment1 - 300 cfm air compressor
2 - jackhammers1 - skilsaw2 - air wrenches2 - welding machines2 - sets: oxy-acetylene equipment(d)Support and Maintenance Equipment1 ~ 18 x 36 sectional barge, 27-ton capacity1 shop trailer'"1 - office/first aid trailer1 - lot: tools, jacks, etc.4 - two-",ay radio outfits1 - 25 kw diesel generator set( eJ Materials.'5,000 lb. misc. structural steel and plate5 MBM misc. lumber and timber1,000 lb. misc. bolts and hardware20 - I-inch x 10 ft. rockbolts(f) Diving Eguiment2 - complete sets for two divers($) Port Snettisham Equipment-I - 10-ton truck crane with 40 ft. boom1 - 5-ton flatbet truck1 - office trailer1 - warehouse trailer
5.1.2 P~oduction Schedule (Clamshell Method)4 cu. yd. bucket holds 2.5 bank cu. yd.Fill facto~ 0.5Difficulty factor 0.5Average load per cycle -0.625 cu. yd •.Average depth - 160 ft.Cycle time:SwingLower 160 ft.CloseHoist @ 200 fpmSwingDumpTotal5 sec.40 sec.8 sec.48 sec.5 sec.3 sec.109 sec. - 27.5 cycles per 50-min. hr.- 17 cu. yd. per hr.Wo~ktwo 12-hr. shifts per day with 10-1/2 hrs. productive work per shift.Produce 357 cu. yd. per day.Require 56 days, allow 2-1/2 months.Haulage - Travel to deep water and dump. Travel time ~ 10 min. Use twosets of 25-ton capacity floats to carry hopper.5.1.3 Mobilization Schedule (Clamshell Method)Crew to unload and pre-ass~blecrew than for slusher method).at Port Snettisham - allow one month (largerFly in equipment - 70 trips @ 1 hr., work 4 hr. per day. Allow 18 days(c~urrent with work at lake) •. ",
Mobilize and assemble at lake:Assemble 3 bargesAssemble 2 hopper bargesInstall anchors and anchoragesSet-up hoists and equipmentSet +.ines, buoys, etc.MiscellaneousTotalDemo bilize :Disassemble and fly to SnettishamLoad outTotalAllow 1-1/2 months.Overall Schedule:1. Plan, design and purchase2. Deliver, off load, and preassemble3. Mobilize at lake4. Perform work5. Demobilize6 days6 days2 days4 days2 days2 days20 dais a 1 month18 days24 daIs42 daysApril 1985May 1985June 19851 July to 15 Sept. 198515 Sept. to 1 Nov. 1985,,',Ff!'5.2 Slusher MethodAs noted above, the slusher method involves pulling the overburden downslope byuse of a hoe-type rake attached to a cable system. The material would be movedto a point below the lake tap which would prevent the debris from interferingwith future operations. The disposal area would be below elevation 790 feet...The excavating equipment associated with the slusher, includes a 72-inchhoe-type scraper, 2 double drum winches, a 72-inch hoe-type rake, wire rope andvarious sheaves. A complete plant and equipment list is included in Section5.2.1.
The scraper is attached to a loadline and backhaul line both of which areattached to a winc'h located on the west shore. The, loadline would be attachedto a sheave located directly opposite the tap. The backhaul anchorage would beto the rock cliff above the lake tap on the east shore. Lateral coverage ofthe clearing area would be provided by a bridle arrangement at the backhaulanchorage. The bridle ropes would be attached to the second double drum winchalso to be located on the east shore (See plate 3).It has been assumed that there is not a site near the backhaul anchorage thatwould be safely accessible by helicopter. Therefore, the load hoist would belocated in the valley just north of the outhaul anchorage. Crew members wouldtravel from that area to the bridle winch by skiff.5.2.1 Plant and Equipment (Slusher Method)(a)Excavating Equipment2 - 72-inch scrappers @ 7,000 lb. (includesone spare)1 - 125 H.P. diesel-driven, double drumhoist. Each drum to have capacityu for800 ft. of I-inch wire rope. 200 fpmline speed.1 - 25 H.P. diesel-driven, double drumhoist. Each drum to have capacity for500 ft. of l/2-inch wire rope.100 fpm line speed.6- swivel-mounted sheaves for 1" wirerope - 36" dia.6 - swivel-mounted sheaves for 1/2" wire6 - double sheave blocks for 1/2" wirerope - 18" dia.10,000 ft. - I-inch wire rope2,000 ft. - l/2-inch wire rope1 - 72-inch hoe-type rake, 6,000 lb.(b)Marine Equi pmen t1 - 12' X 24' sectional barge, 12-ton capacity1 - 24 ft. motor launches2 - l5-ft. jib booms for bargeS-ton capacity, elec. hoist
1 - 25-kw diesel generator set1 - lot: anchors, lines, etc.(c)Installation Equipment1 Caterpillar D-4 tractor-bulldozer1 - 600 cfm air compressor1 - air track drill2 - jackhammers2 - sk1lsaws2 -. air wrenches2 - welding machines4 sets - oxy-acetylene equipment".(d)Support and Maintenance Equipment1 - shop trailer1 - office/first aid trailer1 - lot: tools, jacks, etc.6 - two-way radio outfits2 - 6 x 12 ft. pontoons (for dock)1 - 30 ft. Bailey Bridge (for dock)1 - 25 kw diesel generator set(e) Materials20,000 lb. misc. structural steel and plate'"20 MBM misc. lumber and timber2,000 lb. misc. bolts and hardware50 - I-inch x 20 ft. rockbolts(f) Diving Equipment2 - complete sets for 2 divers
(g)Port Snettisham Equipment1 - 10-ton truck crane with 40 ft. boom1 - 5-ton flatbed truck1 - office trailer1 - warehouse trailer5.2.2 Production Schedule (Slusher Method)Estimated quantity - 20,000 cu. yd.Assumed average haul - 300 ft.Basic production (200 ft. haul) - 66 cu. yd. per hr. (50-min. hr.)Slope factor (30 0 slope) - 1.9Extra haul factor - 0.70Difficulty factor - 0.75Average production - 66 x 1.9 x 0.7 x 0.75 - 65 cu. yd. per hr.Work two 12-hr. shifts with 10-1/2 hr. productive work per shiftProduce 910 cu. yd~per dayRequire 22 days - 1 monthAllow, for checking, diving, and contingency - 1/2 monthTotal time for pe~ormance - 1-1/2 months5.2.3 Mobilization Schedule (Slusher Method)Crew to unload and pre-assemble at Port Snettisham - allow one month.Fly in equipment 32 trips @ 1 hr., work 4 hrs. per day - allow 8 days·(concurrent with mobilize and assemble at lake).Mobilize and assemble at lake:Grading site (including helipa4)Set-up trailersBuild dockAssemble barge5 days2 days2 days1 day
Drill & set anchoragesSet-up hoists & tie down'Thread cableMiscellaneousTOTAL6 days2 days2 days2 days23 days ,. 1 monthDemo bilize:Disassemble and fly to SnettishamLoad outAllow one month8 days16 days24 daysOverall Schedule:1- Plan, design, and purchase May 19852. Deliver to Port Snettisham, off load,and pre-assemble June 19853. Mobilize at lake July 19854. Perform work 1 Aug. to 15 Sept. 19855. Contingency 15 Sept. to 1 Oct. 1985.'6. Demobilize October 19856.06.1PROS AND CONSSlusher Method - Pros(a)Scraping bottom downslope, should clean better.(b) . Any boulders which cannot be dragged down slope probably safe fromsliding onto intake.(c) Requires less plant and equipment and is therefore a relativelysimple operation.II(d) Requires less energy since material won't have to be raised to thelake surface.(e)Requires less time..'
6.2 Slusher Method - Cons(a)(b)(c)~d)Scraper might have difficulty cleaning behind prominent rock outcropor behind large boulder.Some trees may not get satisfactority buried.Requires more development onshore.Requires more site communication.6.3 Clamshell Method - Pros(a)(b)(c)(d)Can excavate around any object.Requires less onshore development.Requires less site communication.Does not leave any excavated trees in the lake.6.4 Clamshell Method - Cons(a)(b)(c)(d)(e)(f)(g)(h)Cannot excavate large boulders.Lesa positive cleaning of the slope.May have trouble puJ.llng out trees.Requires more plant and equipment.Requires more energy.Requires more time.Requires separate disposal of trees.May be a problem with operation of the clam bucket on steep slope.7. 0 BENCH ABOVE TAPSome consideration should be given to constructing a bench in the rock abovethe tap to trap debris from future slides.The nature of the debris in the existing slide, to the north ofsuggests that the origin of the material was from above the lake.have been the result of a landslide or an avalanche. Judging by theof the surrounding slopes, no area of the lake looks to be free fromslides of either source.the tap,This maysteepnesspotential
The bench would most economically be constructed above the shoreline and couldserve as a storage area and 'launch site for the maintenance barge if left atthe lake. It could also act as a staging area and helicopter pad for future'maintenance or construction activity. The bench might eliminate the need forthe adit east of the gate shaft.8.0 CONSTRUCTION DIFFICULTIES AND COSTSThis project presents particularly difficult conditions to perspectivebidders. The combination of a remote location, inaccessibility, a short constructionwindow and the nature of the work involved results in a unique highrisk situation. Contractors which are qualified to perform this work ,willaccordingly provide a significant contingency if they are required to bid thework on a lump sum basis. Our estimate to complete this work based on a fixedamount is $3.5 million for the slusher method and $5.9 million for theclamshell method..'We estimate that a savings of 10-15% or more could be realized if the work werebid on the basis of reimbursable costs rather than a fixed amount. Thecontractors would be asked to bid on hourly rates for a given method of con- ~'struction with a target amount to complete the work.We have made several assumptions with regard to the equipment and manpower thatwould be required to perform this work. We feel that because of siteconditions, time restrictions and remoteness of the project that a wellequipped and manned operation is essential and is reflecte~ in our costestimates. We recommend that minimum requirements for manpower and equipmentbe included in whatever type of construction contract is, ultimately used. Forexample, we have assumed that the movement of material from base camp atSnettisham to Crater Lake will be accomplished with a Sikorski Sky-crane. Wehave also assumed that a fully equipped diving station would be set up at thestart of the construction that would be available for immediate use upon need.The station would also be used for required inspections. A detailed breakdownof our construction cost estimates are included in the appendix.I'One question which needs to be resolved as part of the contract preparation forlake bottom clearing is the definition of what '"clean'" is considered in termsof the clearing effort. For the purposes of this report, we have assumed thata '"clean condition'" will be achieved when all material has been removed towithin approximately 2 feet of bedrock. We assume material contained in a2-foot layer would ~ot pose a problem if it were to enter the power tunnel duringthe lake tap construction or during future operation of the project.However, for the purpose of computing the quantity of material which would behandled, we have included all material down to bedrock assuming that a certainamount of debris will be picked up and redeposited through slumping at thesides of the clearing limit or from settlement of rock flour which is put intosuspension during clearing operations.In preparation of cost estimates for this work--bothmethods--an allowance has been made for land disposalDisposal would consist of stock piling on shore at eitherlake or near the far shore, directly across the lake fromslusher and clamshellof vegetative debris.the west end of thethe tap location.
Such disposal may not be necessary; a determination concerning this requirementwill have to be made. The incremental cost included in the estimates is minor($50-75,000).9.0 MOBILIZATION THROUGH THE TUNNELIt is understood that the Corps believes that its fiscal 1984 and 1985 fundingprecludes driving the tunnel past Sta. 35+00 in fiscal 1985. Nevertheless, itplans to perform the lake tap site clearing in fiscal 1985. It is felt that ifthe funding necessary to perform the clearing were instead allocated to thetunnel, it could be driven to Sta. 14+00 in 1985, and the gate shaft and aditto the lake could be completed as well. This would permit the mobilization ofthe clearing plant to be handled through the tunnel, thus saving the expensivehelicopter cost for mobilization and also for access during performance of thework. In addition, it would appear that the hoist operating station and thedock could be installed at the end of the adit to the lake, thus simplifyingthe operation. It is also noted that the Corps will need such a dock and alsoa barge for servicing the intake trash-rack cleaning mechanism.We foresee no problem in utilizing the gate shaft for mobilizing constructionequipment for either the slusher or clamshell methods. The sectional bargeswould consist of segments 8'-10' wide by 15'-20' in length by 4'-6' in depthwhere the motor launches would be approximately 24' long by 6'-8' wide by approximately3' in depth. Plate 9 of Design Memorandum No. 26 indicates thatthe rock excavation for the gate structure will be approximately 12' by 15' atthe point where the shaft intersects the power tunnel, narrowing to 10' by 12'at a point approximately 18' above the tunnel soffit. These dimensions areadequate to accommodate the equipment even considering that ventilation equipmentwill occupy part of the tunnel space.Upon installation of the concrete lining, air ducts, access ladder and gatestructures, the clear shaft area will be reduced. It would, however, stillprovide a means of demobilizing much of the equipment. If it were assumed thatone of the sectional barges was to remain at Crater Lake for future use as awork platform, the largest materials which would have to be demobilized for theslusher method would include the air-track drill, D-4 cat, motor launch, twowinches and the scrapers. The air-track dri~ would be utilized during theearly stage of construction and-could be demobilized as soon as its work wascompleted. The winches could be disassembled and a major portion of the partsmoved through the finished gate structure; the scrapers could be torch cut tosizes which would pass through the shaft. It is our contention that if theproject equipment were carefully selected, most if not all of it could bedemobilized through the gate structure thus eliminating or greatly reducing thecost of very expensive helicopter assistance. If the same contractor doing thetunnelling was also responsible for clearing, he would be motivated to plan andschedule around such an approach if it were cost effective.The use of the tunnel for personnel access during the clearing operation doesnot seem to be cost effective for several reasons including (1) the requirementfor full-time helicopter service at the site for emergency use, (2) the additionaltime (and cost) required to move personnel to and from the lake, and (3)possible conflicts with other operations (in the tunnel and gate structure)
,.being performed concurrently with the clearing. A more detailed review of personnelaccess, may be warranted once schedules are established for the tunnel,gate shaft and clearing operation.Plate 2 depicts-the changes which would be made in the Corps schedule toaccommodate this change.9.1 Pros - Lake Access Through Tunnel(a)(b)Saves considerable helicopter expenseSaves set-up expense on west shore of lake(c) Simplifies winch and hoisting arrangement by ~ocating all power equipmentnear ther adit.(d)Should show a significant saving on tunnel costs because it eliminatesdemobilizing and remobilizing for 2,100 ft. of tunnel.(e) Provides time to drill exploratory holes ahead and plan for groutingdefective rock zones between Sta. 14+00 and lake tap inlet prior toawarding a construction contract.9.2 Cons - Lake Access Through Tunnel(a)(b)Requires change in program for performing the work.Requires change in contract packaging.(c) Requires helipad to be constructed from other materials. However,this cost is offset by saving in driving helipad adit from inside,thus avoiding an expensive helicopter based operation.10.0 CREW SIZES FOR SLUSHER METHOD10.1 Clearing Crew, Each Shift (2 Shifts)1 - Shift foreman1 - Hoist operator1 - Bridle winch operator2 Oilers1· - Launch operator1 - Shift mechanic1 - Signalman10.2 Clearing Crew, Day Shift Support (1 Shift)1 - Foreman
1 -Launch operator(2 - Deck hands2 - Mechanics2 - Mechanic helpers1 - Timekeeper/Clerk10.3 Mobilization Crew at Lake ( 1 month)1 - Foreman2 - Launch operators1 - Bulldozer operator3 - Mechanics1 - Driller2 - De
2 - Riggers3 - Mechanics2 - Millwright s4 - Laborers10.6 Administration and Supervision (6 months)1 - Supe~ntendent1 - Engineer1 - Office man1 - Secretary10.7 Demobilize"Same as Mobilization Crews.10.8 Diving for Inspection and Emergenciesp.Provide diving crew for two separate weeks.11.0 CREW SIZES FOR CLAMSHELL METHOD11.1 Clearing Crew, Each Shif~ (3 Shifts)1 - Shif~ foreman1 - Clamshell operator1 - Oiler3 - Launch operators4 - Deck hand1 - Shift mechanic*1 - Spot~er* (Added)11.2 Clearing Crew, Day Shift Support (1 Shift)1 - Foreman
1 - Launch operator2 - Deck hands1 - Tractor operator3 - Mechanics3 - Mechanic. helpers1 - Timekeeper/Clerk11.3 Mobilization Crew at Lake - Same as 10.311.4 Mobilization Crew at Snettisham - Same as 10.411.5 Unload and Pre-assemble CrewSame as 10.5? but add:1 - Rigger1 - Mechanic1 - Millwright2 - Laborers11.6 Administration and SupervisionSame as 10.6, but for 7 months11.7 DemobilizeSame as Mobilization Crews.11.8 Diving for Inspection and EmergenciesProvide diving crew for four separate weeks.12.0 ADDITIONAL STUDIESPrior to advertising for construction~ we recommend that additional borings betaken within the clearing limits in order to better define the nature of theunconsolidated material. Submarine borings taken to date in Crater Lake havebeen for the purpose of determining the nature of the bedrock and have providedonly cursory information with regard to the unconsolidated deposits. Drillingtime and difficulty in drilling through the unconsolidated layer would behelpful as well as the retrieval of samples if possible.
Additionally, a detailed inspection dive of the site should be conducted andvideo tapes made of the bottom conditions. During the dive, high resolutionside scan sonar (as manufactured by Mesotech, see Appendix) mapping of the sitewould be accomplished which would also be utilized to direct the diver to specific·objects.It is estimated that the cost of the diving inspection and sidescan sonar survey would be $55-60,000, not including helicopter transportationor subsistence costs. Alternatively, a remote controlled, self-propelled videocamera reconnaissance should be considered.13.0 CONTRACTOR COMMENTS13.1 Underwater Construction, Inc., Anchorage, <strong>Alaska</strong>We had extensive conversations with Mr. Richard Livingston of Underwater constructionregarding the construction aspects of this project, as well as duringsupport for inspection and construction activities. Mr. Livingston was in generalagreement with regard to the technical feasibility of both the clamshelland slusher methods. He did feel that airlift pumping at these water depthswas practical. Mr. Livingston also concurred with our estimates for labor,plant and support facilities to accomplish this work. He consider this to be a"high risk" project./'13.2 S. J. Groves & Sons Company, Bellevue. WashingtonWe spoke with Mr. Fred Walter of S. J. Groves & Sons Co. regarding the proposedmehtods of clearing for the lake tap. He reviewed our estimated productionrates, equipment requirements and costs. He felt that the time. required toperform the clearing by these two methods would be approximately the same, thatis our production rate for the slusher was high. Based on that assumption, thecost for performing this work would be greater than $3.5 million. He did not ~ ..feel hopper barges would be required, but that the material could be dumped onflat barges with some kind of low sid~boards. Mr. Walter did not think diverswould be needed. He suggested that competitive bidding would result in thelowest cost and that bidding the clearing work with the tunneling would bepreferable..-13.3 Parsons - Brinkerhoff tSacramento, CaliforniaWe talked to Mr. Koenig of Parsons-Brinkerhoff. He was under the impressionthat their firm was going to be awarded a contract to prepare a report regardingthe clearing operation and did not provide any additional comment.13.4. J. A. Jones, Charlotte, North CarolinaMr. Woods of J. A. Jones was contacted. He was familiar with the project as aresult of previous discussions with the Corps of Engineers, but due to pressingbusiness matters"'-was unable to provide additional input at this time.14.0 CONCLUSIONSWe estimate that the least cost method of removing approximately 20,000 cubicyards of unconsolidated soil, rock and vegetative debris at the proposed laketap is by using a slusher to rake the material down slope into deeper water.
The slusher is a blade-type device that is attached to cables which in turn areactivated by winches, similar to a slackline drag. This is an older method ofexcavation but suited for this project, because of smaller plant requirementsand associated mobilization and operation costs. There may not be manycontractors experienced with this method.The estimated cost of performing the clearing is $3.5 million, not includingcontingencies.
A P PEN D I X
<strong>LAKE</strong> TAP CLEARING. <strong>CRATER</strong> <strong>LAKE</strong>, SNETTISHAMEQUIPMENT COSTS - CLAMSHELL METHODEquipment EquipmentPurchase . Rental per EquipmentF .O~B. Sea. Month Wt. Lb.1 200 HP Diesel Winch $ 5,000 25,0001 50 KW Diesel Elec. 1,000 3,0001 Power Mooring Winch 1,700 3,0003 500# Anchors $ 1,5002 4 cu.yd. Clam Buck 3,000 16,0001 5 T. Elec. Hoist & Jib 7,5001 24 x 51 Sect. Barge 90,0002 20 cu. yd. Hopper Barge 150,0001 16' x 34' Sect. Barge 40,0001 Grapple 3,0001 300 CFM Compress 2,5001 Stiff Leg @ 15 Ton 5,000 30,0001 D4 Cat 3,9004 24' Launches 48,0002 Jack Hammers 1501 Skil Saw 2002 Air Wrenches 1,0002 Welding Machines 9001 16 x 34 Sect. Barge 27 T. 4,0001 Shop Trailer 4001 Off. Trailer 200 '4 2-Way Radios 11,4801 25 KW Generator 1,3001 10 T. Truck Crane 9,5001 5 T. Flatbed 2,2001 Off. Trailer' 4001 Warehouse Trailer 3003 Chain Saws 1,000$390,680 $13,700
LAX! TAP CLEARING<strong>CRATER</strong> <strong>LAKE</strong>, SNE'IT ISHAMEQUIPMENT COSTS - SLUSHER METHODEquipment EquipmentPurchase·F.O.B. Sea.Rental perMonthEquipmentWt. Lb.2 72-Inch Scrapers $ 15,000 14,0001 125 HP Diesel Winch $ 4,200 10,0001 25 HP Diesel Winch 1,700 3,0001 72-Inch Rake 6,000 6,0001 16' x 34' Sect. Barge 40,000 26,8001 24 Ft. Motor Launch 12,0002 15 Ft. Jib Booms for BA 4,5002 25 KW Diesel Gen. 1,300 2,000ih',1 D-4 Cat 3,9001 600 CFM Compress 3,2501 Air Track Drill 6,250111'.>2 Jackhammers 1502 Air Wrenches 1,0002 Skilsaws 4002 Welding.Machines 9001 Shop Trailer Sm 4001 Office Trailer Sm 2002 8' x 17' Pontoons for Dock 40,000 13,4001 30 Ft. Bailey Bridge 24,000 24,0001 10 T. Truck Crane 4,5001 5 T. Flatbed 2,2001 Office Trailer 2001 Warehouse Trailer 3006 36" Sheaves for 1" 3,5006 18" Sheaves for 1/2" 1,0006 Double Sheave Blocks 2,00010,000 Ft. 1" WR 21,000 16,0002,000 Ft. 1/2" WR 1,500 800Barge Anchors & Lines 3,0003 Chain Saws 1,0006 Two-way Radios 17,220..t193,120 $29,450
~I,<strong>LAKE</strong> TAP CLEARING<strong>CRATER</strong> <strong>LAKE</strong>, SNETTISHAMLABOR RATESStandard TimeIncludingLabor OverheadOvertimeIncludingLabor OverheadPer WeekGeneral FormanLaunch OperatorDeck HandsMechanicsMech. HelperHoist OperatorBridle Winch OpereOilerSigyia1manLaborerTruck DriverCrane OperatorCookCook HelperHousekeeperHousekeeper HelpRiggersMillwrightsDozer OperatorDrillerDriller HelperProject ManagerSuperintendentClerkOff. Engr.47.2537.0019.3037.0033.0039.5039.5033.0030.5030.5032.5033.7531.5030.0027.5027.0035.0037.0039.5037.0030.5063.0049.5026.0049.5044.0052.5052.5044.0040.7540.7543.5045.0042.5040.0036.7536.0046.5049.2552.5049.5040.752,000.001,500.00675.00800.00
<strong>LAKE</strong> TAP CLEARING<strong>CRATER</strong> <strong>LAKE</strong>. SNETTISHAMCOST SUMMARY - CLAMSHELL METHODCOST COST COST·PER PER PER LUMP NUMBER NUMBER NUMBERDAY SHIFT MONTH SUM DAYS SHIFTS MONTHS TOTALUnload & Preassemble $9128 24 $ 219,072Mob & Assemble at Lake 7849 24 188,376Mob Crew at Snettisham 2240 24 53,760Clearing 5019 120 602,280Dayshift Support 4919 60 295,140Demob 7849 18 141,2822240 18 40,320Load Out 7849 24 188,3762240 24 53,760Administration $19,900 7 139,300Diving $144,732 144,732Equipment Rental 40.450 5 202,250Small Tools 49,248 49,248Supplies and Equipment 390,680 390,680Salvage Value (175,340) (175,340)Fuel, Lube, Parts Etc. 1000 90 90,000Materials500011 Steel 1,250 1,2505 MBM Timber 2,500 2,50010001/ Bolts Hardware 2,000 2,00020 I" x 10' Rock Bolts 1,200 1,200Camp Costs 35 5,700 199,500LogisticsBeaver Aircraft 18,000 18,000Hughes 500D 147,150 147,150Skycrane 912,000 912,000Barge/Tug from Seattle 275,'000 275,000I I SUBTOTAL 4.,532,516Contractor Gen OH & Profit 30% .L.l5f) 7355,8 . • 271'l '""~".. ~.,
SUBTOTAL 2,702,980Contractor Gen. OH & Profit 30% 810.894<strong>LAKE</strong> TAP CLEARING<strong>CRATER</strong> <strong>LAKE</strong>, SNETTISHAMCOST SUMMARY - SLU·SHER METHODCOST COST COSTPER . PER PER LUMP NUMBER NUMBER NUMBERDAY SHIFT MONTH SUM DAYS SHIFTS MONTHS TOTALMobilizationUnload & Preassemble $6860 24 $ 164,640Mob & Assemble at Lake· 7849 24 188,376Mob Crew at Snettisham 2240 24 53,760Clearing Crew/Day 4950 33 163,350Clearing Crew/Night 5357 33 176,781DemobilizationDisassemble at Lake 7849 8 62,7922240 8 17,920Load at Snettisham 7849 16 125,5842240 16 35,840Admin. & Supervision $19,900 6 119,400Diving Cost 140,232 140,232Equipment Rental 29,450 4 1~7,800Small Tools 22,000 22,000Supplies & Equipment 193,120 193,120Salvage Supplies & Equip. ( 76,560) 06,560)Fuel, Lube, Parts, Etc. 500 60 30,000Materials20,00011 Steel 5,000 5,00020 MBM Timber 10,000 10,0002000# Bolts/Hardware 4,000 4,00050-1" x 20· Rock Bolts 3,000 3,000Camp Costs 35 3,325 116,375LogisticsBeaver--Aircraft 15,000 15,000Hughes 500D 114,450 114,450Skycrane 450,000 472,000Barge/Tug from Seattle 275,000 275,000
<strong>LAKE</strong> TAP CLEARING<strong>CRATER</strong> <strong>LAKE</strong>, SNETTISHAMTRANSPORTATION AND SUPPORT COSTSC = CLAMSHELL METHODS = SLUSHER METHODCOST COST COST TOTAL TOTAPER PER PER LUMP NUMBER NUMBER NUMBER LUMP CLAMSHELL SLUSHMONTH DAY HOUR SUM MONTHS DAYS HOURS SUM METHOD METHO.IS Beaver Aircraft $300 50 $ 15,0 1C 300 60 $18,000S Hughes 500D $21,000 3.5 73,5 1S Helicopter 195 210 ·40,9C 21,000 4.5 94,5,00·C 195 270 52,650S Sykorski 5,500 64 352,01Sky craneS (Mob-Demob) $60,000 2 120,01C 5,500 144 792,000C 60,000 2 120,000S Barge Service 11,000 25 275,01S From Seattle 11,000 25 275,000(2 R.T. Plus Loading Time)Divins SueeortS&C Mob & Set Up 31,116 31·,116 31,1:S Equip. Standby Charge 150 120 18,01C 150 150 22,500S&C Inspection Dives 15,000 4 60,000 60,01S&C Demob 31,116 31,116 31,1:
'-----BOTTOM CONTOURSOFLANDSLlDE--~TUNNELDeale ....... w.G.C.F.o 20 40 60 80iSCALE IN FEETmI---------l.,. __D,...,'I'\ Dey;of~U.S. ARMY ENGINEER OISTRICTCORPS OF ENGINEERSANOHORAGl,AlASKASNETTISHAM PROJECT, ALASKA<strong>CRATER</strong> <strong>LAKE</strong><strong>LAKE</strong> TAP CLEARINGChecked b.,-PLATE 1 SITE PLAN~--------------i~J~~·~-~---------~
SNETTISHAM-CRA TER <strong>LAKE</strong> <strong>PHASE</strong>FY 84 ~I. FY 85 ~I. FY 86 ~I. FY 87 ~I""" FY 88CY 84 CY 85 ~I. CY 86 CY 87JAN FEB MAR APR MAY JUN JUL AUG SEP OCT NOY DEC JAN FEB MAR APR MAY JUN JUL AUG BEP OCT NOY DEC JAN FEB MAR APR M" Y JUN JUL AUG SEP OCT NOY DEC JAN FEB MAR APR lolA Y JUN JUL AUG 8EP OCT NOY DEC JAN FEB MAR APR~I·CY 88-----:.REVIlEWDM 26 REV -"E...... IOEO ... T£~""'!!'!'"\ "E"AIIE IIPO/O E l~ - I":'"J..- DE_ I- - ,"XC.V.T •• iE '"Ijwr "" T( "A'8E. T£ IMAI"NPO/OCE CONT" rED-PRELIM.;::CWT8.P£"IXq _REVE'>"~_IT' fiE 1 EXCA. ATION NPO COOf"""'''''r:,-=r-TUNI LTDSTAGE 1 EXCAVATION I_~ f.-'" fa. REVE!" ~AD' ~:'~f .. .-. TU~I-T -<strong>LAKE</strong> TAP SITE CLEARIN(~- :!"'-".-1lHAU0W"-1"'-' ~..': ::..~STAGE 2 EXCAVATION EX ""V.'-' f--PENSTOCK DESIGN.n~~-<strong>LAKE</strong> TAP DESIGN-POWERHOUSEL TO aTA l'tOO ITA •.-MIE"!1 ....l'Aun~ "..1LADIT TLAKeOEM .,LlrEIIIIIAleEGA E SHAFT.NDN VICE.oaiLi E........ POUlT> _coo ...~ .I'URC,.... MOO..~ ~...!!-' ~~. ~~ ~.!!. ~ flOIA&.,. teE AND AWAItO AN DELIY RTO ~TT A" OULD DOC'. ETC- -- f-~-........ l-TIWE) -~AT LAIC!,'1000- jEtocv f..D MOKp..... pRM C E .....-~- '--a.e.ECT ~~;- -r"'IITIVE~E8II"!...I..~ ~= -- ...-. lOA ~- - - .- - t--t----...-N •• "EpA"ECOMPLETION "C AGE FO REVIEWPOWER CONDUITporr ..... .........,in"""'\ME .. DE .... ...NpAIN O/OCE II .. CO._~..... I'- Tor ..~-. ~/EXCA-"ACHfLO.ATE NaT CK TU)EJCCA .TE!!.E.H P CON TRue MAC IHE • OPr- IIPUT IIEVEW COAR. ~LA. ,",DC' RA". ~...I ROC TR.1\if~T~L ...."Co' ~FO ~U'Q' TANK IEC. NO F L. EXC 'tATEP"'"IIILI KE 1 !- - r--~P•• 0 REP HE'i""LUD IT"Oft EX ORIN.FOR <strong>LAKE</strong>•• ~'\AND"C ""ORAT POWER ouaE c ~pL!TIO t..~ IMENTI A DOE." 'OR. TEiiiICAT .EN DC. GATE • G. Hora ING INaT LL \iQj o QA ESTAL QATE nR IN. ALL~ E"TlSE E~ ~MEH CON ,",OL. PORT L .11< HEAD .ETC. HOII INO OUI~ NT ~~WER IUPPL PRI ARV EST U IT *3 D~ ~8ILIZZ-V - ~-, NTR L8. Tr NEL 'NIH( R41H ACK., .ND LEAN Piii1\/IN. .LL< HERA 0 .. A 0 /- - t- -V V / V V.... J I !!"UM!! ATIOH ELiV " TUR IHE I 8EO.HIJ " TUR INE ON-Nil EoO fIWJV • I ITCH•• EA" IlofJ..,y, /~GE RAT"IsEE~ 0 IGINA SCHE IULEHl.'V TR. "0 ER JELiV " GO;1E"NO0' PO EIitHOUIST" CTUIitE ONTROl .INITRI ~EHTATI N. III ••• ...COWl'."E' ouT A MACHI E aHOp "IYI •• CO" ... a "I!VIEW CO".,.[)//oaTAIN IE aERY CEO " ELiaUMAI y DE.,. REYIE '1 AL DEli N "EVII!W' CO~ PO ERHO .E C .."LE ION 'N TAll URa'N''''E • IN TALL URB'ft NON IwaE R~ IN IN EQUI WENTANCILLARY - J f-LDELIV " IU~ "V,. RYC NTROI /'~~De .......... ~1G.C.F.Ot-..... " b,1 W H .C ........... ~l1m-<strong>LAKE</strong>..us_"-PLATE 2... w ........" Be ..., _heelref.rMiCeO •• el. 6/B4number.u.s. ARMY ENGINEER DISTRICTCORPS OF ENG~RSANCHORAGE, ALASKASNETTISHAM PROJECT. ALASKA<strong>CRATER</strong> <strong>LAKE</strong>TAP CLEARINGPROPOSED ALTERNATECLEARING SCHEDULEEXCAVATION & <strong>LAKE</strong> TAP~~nlt~ /-g:..~NE-96-0HB-02 Sheel 2 ef 4
" rAPPROX. LOCATION OF HOIST--". /(ANCHOR IN ROCKAPPROX. LOCATION OF HOIST~\ANCHOR IN ROCK·................ LOAD LINESCRAPERIIu _________________IAREA TO BE C LEARED APPROX. 140'-300'<strong>LAKE</strong>TAP\•'--GATE STRUCTUREWEST SHORE LINEAPPROX. 2500'SITE PLAN" .. T .. 8.PLAN<strong>LAKE</strong> SURFACEELEY.l020'EAST SHORE LINEDISPOSAL AR EA ___ ELEY. 7110' _ ~::;,'" =11TiTI.=~-'-'-'-G.C.F ....,~--------, ::I'_0. ........... , mD!" •• " b.2 W.H.PROFILECheck.db.:PlATE 3Se.I.: AS NOTEDAL TERNA T/VE-01-18-03
ANCHOR LlNES-4 REQ,D.(2 AT BOW, 2 AT STERN)HOPPER BARGE<strong>LAKE</strong> SURFACE'VSECTIONAL BARGESECTIONAL BARGESIDE VIEWFRONT VIEW0' 6' 12'":--
EXHIBIT 6SNETTISHAM <strong>CRATER</strong> <strong>LAKE</strong>WES REVIEW OF FINAL <strong>LAKE</strong> TAP BLASTJULY 1984
DISPOSITION FORMFor use of this form, see AR 340-15; the proponent agency is TAGO.REFERENCE OR OFFICE SYMBOLSUBJECTI:I NPAEN-H-HD Snettisham Crater Lake-WES Review of Final Lake Tap BlastITO NPAEN-DB FROM NPAEN-H-HD DATE 2 Aug 84I.~exler/hb/2-23291. Inclosed is the WES review of NPA's analysis of the final lake tap blast. The reviewwas made by Dr. Frank Neilson.2. - A phone call was made to Dr. Nei 1 son to cl arify some of the corrunents. I ncl osure 2is the log of that conversation.~~~2 Incl ENDRICKSONasChief, Hydraulics/Hydrology BranchCF:NPAEN-FMNPAEN-PM-C!...NPAEN~H-I1Q.NPAEN-DB-STDAEN-CW~-D (Munsey)CMT 1
DEPARTMENT OF THE ARMYALASKA DISTRICT CORPS OF ENGINEERSPOUCH 898ANCHORAGE, ALASKA 99506IIItKPI.,.YTOATTKNTION OPtNPAEN-H-HD30 May 1984SUBJECT: Snettisham Project, Crater Lake Phase, Lake Tap BlastCOl11l1anderWater Experiment StationP.O. Box 631Vicksburg, Mississippi 39180,..'."1. The final lake tap blast at Crater Lake will be a critical undertakingand, therefore, it is requested that WES review the analysis of the finalblast that has been developed by the <strong>Alaska</strong> District (NPA). The NPAinvestigation includes:a. Total force acting on the closed service gate at station 14+00.This force includes blast pressure and the combined static and dynamicwater pressures resulting during the surge immediately after the blast.b. Surge height of the water column in the gate shaft.c. Dispersal of the final blast rubble in the primary rock trap andthe section of tunnel between the primary rock trap and the gate structure.2. A package of calculations and drawings was sent to Dr. Frank Neilsonof the Hydraulics lab under separate cover.3. If any further information is required, please contact Joe Wexler orJeff Johns at 907-552-2329.FOR THE COMMANDER:"",-.'"',
WESHI (30 May 84) 1st IndSUBJECT: Snettisham Project, Crater Lake Phase, Lake Tap BlastDA, Waterways Experiment Station, Corps of Engineers, PO Box 631,Vicksburg, MS 39180 2 0 JUL '84TO: Commander, US Army Engineer District, <strong>Alaska</strong>, ATTN: NPAEN-H-HD,Anchorage, <strong>Alaska</strong> 995061. The following review comments, Crater Lake lake tap, as requested in thebasic letter, are of hydraulic calculations for the flow passage upstream ofthe service valve. The boundary conditions are:a. The service valve remains closed during the event.b. The lake bottom in the vicinity of the lake tap is cleared of debris.c. Initial lake water-surface elevation is 1019 ft; initial gate shaftwater-surface elevation is 995 ft; valve elevation is 789 ft.d. A pressurized air mass is contained in the short riser between rocktrap and tap face.e. Dimensions are as shown in DM26, Plates 6 and 7 (received separately;notations dated 25 May 1984).f. The dri11ing-and-detonation plan is as shown in drawing (SnettishamProject No. DACW-68-C-0026; J.D.C. 32; 7/11/68; Rev. February 69).g. The blast sequence is, first, to shatter the core of the tap plug(cavities for initial material expansion are provided) and second, to peelsuccessive layers from the periphery of the core until the trap is fully formed.h. The debris shape will be angular and range in size from small (sandsize) to a maximum dimension of about 1.5 ft.L The volume of material (granite, S.G. = 2.65) will be about 1131 ft 3 ;i.e., a 12-ft-diameter by 10-ft-1ong cylinder.Review comments, referenced by topics listed in paragraph 1 of the basicletter, are as follows.2. Hydraulic Conditions Due to Blast (Topic a., Blast, 30 May 1984). Theblast is within the rock mass (bore holes) and, additionally, separated fromthe water column by air trapped in the riser. The detonation plan (para. 1f.)and sequence (para. 19.) are such that the initial unshattered displacement ofthe rock face towards the flow passage is small. Buffering from the watercolumn is provided by the trapped air and pressure relief is provided by thefree surface in the well. Consequently, although blast energy may be transmittedto the gate structure through the rock mass, essentially no energy from theinitial blast will be transmitted through the water column. The first large2
2WESHISUBJECT:2 a JUL '84Snettisham Project, Crater Lake Phase, Lake Tap Blasthydraulic pressure pulse will be the hydrostatic lake pressure and will arrive atthe gate approximately 1/7 second following detonation. The gate will be subjectto a vertical rapidly-applied hydraulic loading (1019-995 = 26 ft) that decreasesas the valve-well water surface increases. The gate structure will be subjectto a horizontal rapidly-increasing applied loading (995-789 = 206 ft to1019-739 = 230 ft) that varies with surge elevation. The design of the gatehoist mechanism and structure must accommodate these dynamic loads in order tohold the gate closed (para. la.).3. Surge (Topic a., Surge and Topic b., 30 May 1984). The calculation ofhydraulic surge elevation (WHAMO program or by calculator) is straight-forwardand reliable. Uncertainties, due to loss coefficient and area determinations,are small because of the low maximum velocity head (l-ft during the initialsurge between lake and valve well). The surge height (relative to lake level;1039-1019 = 20 ft) calculation should be correct within ±l ft; the additionof blast loading extrapolated from the Ringedalsvatn data is, because of timeof occurrence, a conservative consideration.4. Blast Rubble (Topic c., 30 May 1984). The rubble will be deposited withinthe rock trap with fine materials moving with the flow to a distance less than44· ft, the maximum surge movement, beyond the static-pool trajectory. Therubble mound (as shown in DM 26, Plate 6) immediately following the first surgewill be concentrated between stations 7+48 and 8+12; i.e., to the toe of thetrap. No additional net transport is anticipated although some restructuringof the rubble may occur during subsequent oscillations.5. Studies. The definitions of boundary conditions (para. la.-li. above) aresubject to question for highly dynamic construction procedures. The nonhydraulicfactors (hydrologic, foundations and materials, structures, and mechanical)appear to require a high degree of construction expertise and intense inspectionprocedures. Changing any of these factors obviously will causesome change in hydraulic effects. If such factors are changed, new hydrauliceffects can be evaluated; however, the new boundary conditions must be clearlyidentified.FOR THE COMMANDER AND DIRECTOR:{f/t,~F. R. BROWNEngineerTechnical Director3
TELEPHONE OR VERBAL CONVERSATION RECORDFa. use of this fo.m, see AR 340·15; the p.oponent agency is The Adjutant Gene.'!I'. Office.DATE2 August 1984SUBJECT OF CONVERSATIONWES Review of Lake Tap BlastINCOMING CALLPERSON CALLING ADDRESS PHONE NUMBER AND ExTENSIONFrank Neilson WES 601-634-2615PERSON C:ALLED OFFIC:E PHONE NUMBER AND EXTENSIONJoe Wexler NPAEN-H-HD 907-552-2329OUTGOING CALLPERSON CALLING OFFIC:E PHONE NUMBER ANO EXTENSIONPERSON C:ALLED ADDRESS PHONE NUMBER AND EXTENSIONSUMMARY OF' C:ONVERSATION1. I (JW) had several points to clear up with Frank about his review of thelake tap blast calculations:a. Paragraph 2 - What is the vertical applied hydraulic loading? Frank wasreferring to the fact that a pressure would be applied in all directions includingvertically. This could result in additional vertical forces if there are anyhorizontal flanges on the gate.b. Paragraph 2 - liThe gate structure will be subject to a horizontal rapidlyincreasingapplied loading of 206 to 230 feet that varies with slJrge elevation."This change in load refers to a rapidly occurring transient. The gradual increaseto the final surge height occurs over a longer period of time.c. Paragraph 3 - I asked Frank if the surge height calculations wereacceptable. Frank responded that the step method used was a dependable one (hehad not done any calculations himself) and our answer should be correct within+1 ft.d. Subparagraph l(i) indicates a total volume of 1,131 ft 3 in the orificeplug. This calculation considers only the material in the plug with no considerationgiven to overbreak or bulking that will take place after the plug is blastedout.e. Paragraph 4 refers to a limiting distance of 44 ft. This distance isthe vertical height that the surge will move in the gate shaft. The horizontaldistance moved by small particles in the primary rock trap area will be considerablyless than 44 ft because the cross sectional area of the trap is larger than thecross sectional area of the gate shaft.'Iy~ /lL tJ~JOSEPH WEXLERNPAI='N_I-l_l-lnREPLACES EDITION OF I FEB 58 WHICH WILL BE USED.IMJl-71
EXHIBIT 7JUNEAU AREA POHER ~1ARKETANALYS ISSEPTEMBER 1980ALASKA POHER AD~1HJISTRATION
(.Juneau AreaPower ~1arketAnalysis•.sa pt amber. 1980'r'. ·U·S. Depart ment of <strong>Energy</strong>.' A:I ask a Po w erA d min i st rat ionJuneau, <strong>Alaska</strong> 99802~-.-~
Department Of <strong>Energy</strong><strong>Alaska</strong> Power AdministrationP.O. Box 50Juneau, <strong>Alaska</strong> 99802September 12, 1980Colonel Lee Nunn, District EngineerU.S. Department of the ArmyCorps of EngineersP.O. Box 7002Anchorage, AK 99510.,.Dear Colonel Nunn:This is <strong>Alaska</strong> Power Administration's final report for the Juneau AreaPower Market Analysis.The power market analysis includes a new set of load projections for theJuneau area through year 2000 and a review of alternative sources ofpower. Load/resource and system cost analyses were prepared for differentcases and various growth rates to determine effects on power rates.Based on the results of this study, APA believes the following course ofaction with respect to the Snettisham Project is appropriate:1.2.The Corps of Engineers should proceed with actions to constructthe Crater Lake unit so that power from the unit will beavailable in the 1986-1987 time frame.The decision on construction of the Long Lake Dam should bedeferred at the present time, and then reconsidered in futureyears as conditions may warrant.A draft of this report was circulated to area utilities, State offices,and the general public for informal review and comment. In addition, apublic meeting was held on August 28, 1980, for public review and comment.All comments have been incorporated and letters of comments are appended.Sincerely,-.Robert J. CrossAdministrator':_-,,_.-...
CONTENTSTITLEPAGEPART I INTRODUCTION -------------------------------- 1AUTHORIZATION -------------------------- 1DESCRIPTION ---------------------------- 1SCOPE ----------------;..-------- 2P ART I I SUMMARY ----------------------------------- 3PART III POWER MARKET AREA -------------------------- 7POPULATION --------------------------- 7ECONOMIC BASE ----------------------ECONOMIC OUTLOOK ---------------------- 7PART IV EXISTING AND PLANNED POWER SYSTEMS --------- 11PART V POWER REQUIREMENTS ------------------- 14POWER USE IN THE 1970' s ---:------------ 14FACTORS AFFECTING FUTURE DEMANDS -------- 21ESTrnATES OF FUTURE DEMANDS ------------ 22PART VI ALTERNATIVE POWER SOURCES -------------- 38EXPANSION OF EXISTING HYDRO ------------ 38OTHER POTENTIAL HYDRO ---------------- 38INTERCONNECTION ------------------- 40STEAMPLANTS ----------------------- 41DIESEL ----------------------------- 41MISCELLANEOUS ALTERNATIVES -------------- 41PART VII LOAD/RESOURCE AND SYSTEM COST ANALYSIS ------ 43INTRODUCTION --------------------- 43ASSUMPTIONS --------~----------------- 43METHODOLOGY --------------------------- 44LOAD MANAGEMENT -------------------------- 46RESULTS ------------------------------- 46PART VIII FINANCIAL ANALYSIS ----------------------- 57REPAYMENT CRITERIA ------------------- 57REPAYMENT STUDIES --------------------- 58RESULTS ------------------------------ 59APPENDIXA. SYSTEM COST ANALYSES OUTPUT ------------------B. COST COMPARISON PLOTS OF ALTERNATIVES ---------C. <strong>CRATER</strong> <strong>LAKE</strong> CONSTRUCTION COSTS ---------------D. COMMENTS -----------------------------------BIBLIOGRAPHY
TABLESNUMBERPAGE1.Juneau Area Power Sources-----------------------122.Juneau Area Hydro Units ---------------------133.Juneau Area <strong>Energy</strong> and Peak Demand154.Trends in <strong>Data</strong>165.Juneau Area <strong>Energy</strong> Sales and Percent of Salesby Sector -176.7.Analysis of AEL&P <strong>Data</strong> Use per Customer byClass .Percent of Total <strong>Energy</strong> Consumption. by Sector.in the Juneau-Douglas Area1920..8.Forecast Assumptions239.Juneau Area Power Requirements Summary2510.Juneau Area Load Forecast - Medium Case - NormalUse --2611. Juneau Area Load Forecast - High Case - NormalUse -2712.Juneau Area Load Forecast - Capital Move Case -2813.Juneau Area Load Forecast -LoadsElectric Heat2914.Comparison of Load Estimates3615.16.17.18.19.20.Market for Crater/Long <strong>Energy</strong>Snettisham Project <strong>Data</strong> -----------_.'-----------Annual <strong>Energy</strong> Production Without Crater/LongAdditions - ---,---Annual <strong>Energy</strong> Production With Crater/LongAdditions ------ ---------------System <strong>Energy</strong> Costs, 0 Percent Inflation ------System <strong>Energy</strong> Costs, 5 Percent Inflation ------373949505152
21.22.23.24.System <strong>Energy</strong> Costs, Alternate On-Line Dates --Crater/Long Additions - Displacement of Diese1-Electric GenerationElectric Heat Conversion, Displacement of FuelOil Consumption -----------------------------Investment Cost Summary, Crater/Long LakeAdditions54555660
FIGURESNUMBERPAGE1. Snettisham Project and Juneau Power MarketArea Location Maps ------------------- 82. Juneau Area Population ---------------- 93. Residential kWh Use Per Customer ----------- 184. Estimated Peak Demands ------------ 335. Estimated <strong>Energy</strong> Requirements ------------- 346. Comparison of APA and Utility Estimated PeakDemands ------------------------- 35 ..7. Growth Rate Modifications (Load) ------------ 478. Growth Rate Modifications (<strong>Energy</strong>) ------------ 489. Juneau Loads and Hydro Resources ------------- 50a."4!i"-
PART I.INTRODUCTIONThe Snettisham Project was authorized and designed as a staged projectto meet the long-term loads of the Juneau area. The Corps of Engineersis responsible for design and construction, and the <strong>Alaska</strong> Power Administrationis responsible for operation and maintenance of Federal projectfacilities. The first or Long Lake stage was completed and has beenin commercial operation since October 1975. It is the intent of <strong>Alaska</strong>Power Admjnistration to complete the remainder of the authorized project(Crater Lake and increased reservoir storage at Long and Crater) whenneeded to meet area power demands.To insure a timely and appropriate completion of the authorized project,APA makes periodic evaluation of future markets for project power,appropriate analyses to demonstrate that the additions are feasible, andalternative cost projections.Estimates of future power demands, prepared by APA and local utilitiesin early 1980, provided an indication that construction start on one ormore of the additions may be desirable as early as 1982. The detailedstudies recorded in this report were undertaken to develop specificrecommendations.AuthorizationThe Snettisham Project was authorized by the Flood Control Act of 1962,Public Law 87-874, in accordance with the plan set forth in House DocumentNo. 40, 87th Congress, First Session, dated January 3, 1961, asmodified by the reappraisal report dated November 1961.DescriptionSnettisham is the largest hydroelectric project in <strong>Alaska</strong> and the mainpower source for Juneau, <strong>Alaska</strong>'s capital city. The Snettisham Powerplantis 28 air miles southeast of Juneau.The Long Lake stage, now on-line, includes a low dam at the outlet ofLong Lake, power tunnel and penstock totaling 10,000 feet in length, andan underground powerplant with two generators, each with a rated capacityof 23,580 kilowatts. Power is transmitted to Juneau over a 44-milelong,138,000-volt transmission line, which includes a 3-mile underwatersection. The Juneau Substation, located 4 miles south of Juneau, is thepoint of delivery to the local utility system. Supervisory controlequipment provides for operating the Snettisham Powerplant from theJuneau Substation.The powerplant site is remote, accessible only by air or water. Onsitefacilities include an air strip, barge dock and boat harbor, a localroad system, living quarters, warehouses, and water and sewer systems,all maintained by the APA maintenance staff stationed at the Project.The staff also has capability to operate the project onsite in case ofproblems with the supervisory control system.
Crater Lake stage-is an authorized future addition which would add27,000 kilowatts of capacity and 106 million kWh per year annuai firmenergy. New facilities to develop Crater Lake include a tunnel andpenstock to tap the lake and installation of a new turbine-generatorunit in the existing powerplant.Long Lake dam would add 57 million kWh of firm annual energy to theproject. New facilities would include a dam raising the water surfaceelevation of Long Lake from the present maximum of 818 feet MSL to a newelevation of 885 feet MSL.ScopeThe scope of the present work consists of projections of future loadgrowth in the Juneau area, load/resource and system cost analyses ofvarious alternative system configurations, and a repayment analyses totest project financial feasibility.Environmental considerations are not covered in this report. The existingEnvironmental Impact Statement (EIS) was prepared in 1971 by the Corps ofEngineers and they will be responsible for necessary further environmentalstudies and statements prior to construction. APA will be responsible forcompliance to National Environmental Protection Act (NEPA) with respect toproject operations....2
PART II. SUMMARYJuneau presently obtains hydro generation from the Snettisham Project,Long Lake Stage. Several small hydro units, owned and operated by<strong>Alaska</strong> Electric Light and Power, contribute to the hydro capability inthe area.Area power demands are experiencing significant growth due to expansionof the local economy and a shift in the pattern of electric energy use.This shift to electric space heating and water heating has been causedprimarily by the high cost of fuel oil.Estimates by <strong>Alaska</strong> Power Administration and the local utilities offuture power demands indicate the present surplus of power will beutilized in just a few years. Significant va.riables affecting futuregrowth include: (1) the extent of change in the local economy; (2)effectiveness of local conservation of energy; and (3) the changingpatterns of electric energy use which may include some form of electrictransportation.Juneau has an excellent opportunity to displace a large amount of oiland to become less dependent on this unpredictable commodity through thedevelopment of the· potential hydro in the area. The development ofthese "renewable resource" projects would also allow the continued trendin electric heating in the Juneau area. The continued conversion toelectric heating is desirable only to the extent that power supplies canbe made available from hydro or other renewable sources at reasonablecost. The ideal situation would be the utilization of the renewableresources available in conjunction with careful conservation with anyelectric conversions (e.g., heat pumps, energy efficient homes) toensure most efficient use of the available energy supplies.•Current studies have utilized the most recent data and economic outlookfor the Juneau area in forecasting future load growth. Three growthrates were studied--medium, high, and capital move. Each of thesegrowth rates considered conservation and the trend to electric heating,both in new construction and conversions, in the Juneau area.The medium growth rate is considered the most likely, and received themost detailed study.The range in potential demands is shown below; details are provided inpart V.Juneau Area <strong>Energy</strong> Forecasts(1,000 kWh)High (hydro case)Medium (hydro case)High (diesel case)Medium (diesel case)1980157,000157,000144,000144,0001990468,000351,000258,000183,0002000703,000538,000339,000228,0003
The upper level, or "hydro case" forecasts assume gradual expansion ofelectric heat application be~een now and the year 2000 with electricityaccounting for about two-thirds of the area space heating requirementsin that year. The lower or "diesel case" assumes no additional electricheating applications.. - ~"A review of possible power supply alternatives included local liydroprojects, interconnection with other towns in Southeast <strong>Alaska</strong>, steamplants,tidal power, geothermal power, and diesel generation.The most likely options available for meeting future demands wouldinclude: (1) 'construction of the Crater Lake addition to the SnettishamProject; (2) construction of the Long Lake Dam Addition to the SnettishamProject; (3) adding diesel generation units to the existing systemas needed, and (4) rehabilitation of the Salmon Creek plants of theAEL&P system. This analysis assumed the Salmon Creek rehabilitationwill be completed by 1984.Other attractive hydroelectric projects in the area such as Lake Dorothy,Sweetheart, Tease Creek, and Speel River would be available to meetlonger term needs.A summary of the capabiiities of the existing Snettisham Project and theCrater/Long Additions is shown in the following table:ProjectExistingCrater LakeLong Lake DamTotal ProjectCapacity(kW)47,16027,00074,160FirmAnnual <strong>Energy</strong>(1,000 kWh)168,000106,00057,000331,000Estimated investment costs for the new units based on 1980 price levelsare as follows:Crater Lake UnitLong Lake Dam$44,633,000$35,089,000Incremental operation, maintenance, and replacement costs are estimatedat $62,000 per year, or roughly 10 per~ent of current OM&R for theProject.Load/resource and system cost analyses were performed to examine alternativestrategies for meeting the future requirements for power inJuneau. Three cases were analyzed:".....Case 1. No new hydro projects after completion of the Salmon Creekrehabilitation.Case 2. Construction of Crater Lake addition followed by constructionof Long Lake Dam.'4.. ..
Case 3. Construction of Long Lake Dam followed by construction ofCrater Lake addition.Each study assumed that no new electric heating applications would bepermitted when area demands exceeded the available hydroelectric supply.That limit would be reached in about 1983 for Case 1, and about 1992 forCases 2 and 3, under the medium load assumptions.Indicated average system costs for Case 2 (Crater Lake followed by LongLake Dam) were significantly lower than for Case 1 (no new hydro)throughout the 1980's and 1990's. Comparison of Case 2 and case 3results indicated lower costs for a plan adding Crater Lake first, withslightly higher costs if Long Lake Dam is added first.Significant oil savings would be achieved as a result of (1) use ofelectricity in lieu of oil for space heating, and (2) avoiding use offuel oil for power generation. Case 2 results, with medium load growth,indicated total oil savings of 42 million gallons for the years 1986 to1999, with an estimated value in excess of $50 million.The need for additional hydro projects beyond the 1990's was indicatedin the analysis with Lake Dorothy and Sweetheart projects being the mostdesirable. Since Crater Lake is the most favorable project for constructionat this time, future planning efforts for any additionalprojects should be deferred until load growth beyond the Crater Lakeproject indicates a need. Future power costs, following full utilizationof Snettisham production, will increase regardless of the new hydrounits brought on-line. However, the costs of power fram the Crater/LongAdditions will be lower than any future hydro project. Projects beyondCrater/Long will require full Congressional authorization for any workto proceed toward construction.In the e~ent no new hydro projects are added to the existing system, itis assumed that future growth would have to be held down through measuresof increased conservation and load management. The continuedconversion to electric heating would be discouraged due to the economicsof producing electricity with diesel units. In essence the futuregrowth is directly related to the availability of renewable resourcehydro energy.Snettisham Project repayment criteria are governed by language in theinitial project authorization (Flood Control Act of 1962) as amended bythe Water Resources Development Act of 1976. The present wholesale rateof 15.6 mills per kilowatt-hour reflects deferral of portions of theinterest expense for an initial 10-year period pursuant to the 1976 Act.All costs, including the deferred interest, are to be repaid in a subsequentSO-year period which begins in 1986. APA power repayment studiesat the end of FY 1979 indicate the rate will need to be increased toabout 25.6 mills at the end of the 10-year initial period. These computationsinclude allowance for inflation in operation and maintenancecosts through 1984.5
-Additional power repayment studies were prepared for this report toillustrate impact of Crater Lake and Long Lake Dam on sales and revenuerequirements for the Snettisham Project. Study results are as follows:Repayment Assumptions1. Existing project (without additions ofCrater Lake and Long Lake Dam):(Assumptions are identical to official FY 1979APA power repayment study, except for slightlyhigher sales figures in the early 1980's.)2. Existing project with addition of CraterLake (1986) and Long Lake Dam (1988) (1980 costs).3. Same as item 2, but with 35 percent inflationof construction costs for Crater Lake and LongLake Dam.4. Same as item 2, but with load growthdelayed 10 percent.Indicates averagerate, 1986 to endof repayment period26 mills per kWh23.5 mills per kWh26.5 mills24.0 millsAll of the repayment studies allow for inflation in operation and maintenancecosts through 1984, only. Actual rates will of course reflectany inflation beyond that date.Based on results of the study APA believes the following course of actionwith respect to the Snettisham Project is appropriate:1. The Corps of Engineers should proceed with actions to constructthe Crater Lake unit so that power from the unit will beavailable in the 1986-1987 time frame.2. Decision on construction of the Long Lake Dam should bedeferred at present time, and then re-considered in future years asconditions may warrant.The studies indicate the importance of establishing improved conservationpractices in all electric uses and maintaining a closewatch on impacts of new electric heating loads...'6
-,'PART III. POWER MARKET AREAThe power market area is generally the City and Borough of Juneau.Power is delivered to area customers through two local utilities, <strong>Alaska</strong>Electric Light and Power (AEL&P) and Glacier Highway Electric Association(GHEA). The Snettisham Project location and service areas of thetwo utilities are shown on figure 1.The Juneau area is isolated in that it is not electrically interconnectedto any other power syst em. The rugged terrain in the area hasprevented any feasib le interconnections with other areas up to thepresent time.PopulationThe Juneau area population is shown on figure 2. The trend was steadywith an average increase of 743 persons per year or 3.8 percent annualgrowth based on the 1978 population.Economic OutlookJuneau has had a generally strong economy throughout the 1970' s, evidencedby substantia~ growth in employment, population, constructionprograms, and large increases in personal income and property valuations.The capital move issue remains a serious threat to the localeconomy, but most agree it is expected that growth will continuethroughout the 1980' s • The growth in government emp loytnent is notexpected to be quite as large as in recent years--consequently, it seemsreasonable to assume overall growth in the 1980's somewhat less than the1970's.A fairly strong construction program in 1980 and 1981 is evidenced bybuilding permits and normal development projects. The <strong>Alaska</strong> economywill be stimulated by a $500 million capital budget appropriated by the1980 Legislature. This will tend to insure a strong economy Statewide.The Juneau area received a sizable portion of this appropriation todevelop a convention center, the University of <strong>Alaska</strong> Juneau, and moneyfor home loans.Residential and commercial construction is expected to be approximatelythe same for 1979, 1980, and 1981 according to City and Borough PublicWorks officials based on past, existing, and anticipated building permits.Although there was a slowdown in the first half of 1980, plansare emerging for a block of 20 and SO low income and elderly housingunits to add to the 1980 construction season. Forty-eight units of a·90-unit all-electric condominium complex are proceeding rapidly withoccupancy planned for the first 48 units by December 1980.7
•• "J UIII acFIGURE 1lOCATION MAPSnettisham Proj ect and Juneau Power Market Area.....••1'''If'LOCATIONMAP..8 ~,
JUNEAU AREA POPULATION40,000 HISTORICPOPULATION 1910 13.55635,000 1911 14.4781912 14.9791913 16.59330.000 1914 17 ,1951915 17 ,7141916 18,76025,000 1971 19,1741918 19,50020,00015,00010,0005,00001970 71 12 13 74 15 16 71 78 19 80 81 82 83 84 85 86 87 88SOURCE: ALASKA DEPARTMENT OF LABOR STATISTICAL.QUARTERLIES 1970-78N'j.,1,\
There are several other major construction projects planned for completionbefore 1985· that will tend to stabilize population and electricalgrowth at the past growth trends. They include: two or three. hotels inthe planning and financing stage. the convention center funded during1980. a Southeast <strong>Alaska</strong> resource center library. rebuilding of oneschool. and a new school to be located in the Lemn Creek or Valleyarea.10
PART IV.EXISTING AND PLANNED POWER SYSTEMSThe existing and planned power generating units in the Juneau area areshown on table 1. These units include those owned by the two localutilities and the present Snettisham Project. The capacities and energyavailable from the hydroelectric units, existing and planned, are shownin table 2.The Juneau area originally depended on hydroelectric power, but with theadvent of low cost diesel generation many of the original hydro unitswere abandoned or allowed to deteriorate mechanically. The recentincreases in oil prices has reversed this situation with hydro units nowbeing added or upgraded in the local system.The Snettish~ Project, located 28 miles south of Juneau, has'been inoperation since 1973. The project is operated by <strong>Alaska</strong> Power Administrationand with a capacity of 47,160 kW is the source of power forJuneau. The project is presently capable of producing 168 million kWhof firm annual energy and in 1979 furnished about 60 percent of Juneau'selectric energy.<strong>Alaska</strong> Electric Light and Power (AEL&P) is a private utility with aheritage dating back to the gold mining days. Their transmission anddistribution system serves primarily the Juneau-Douglas downtown areasand the Mendenhall Valley. Full standby generation is provided tohandle any Snettisham interruption by use of diesel generation, localhydropower, and a scheduled combustion turbine. Hydro units provideenergy on a year-round basis as well as reserves. AEL&P is in theprocess of rebuilding and modernizing all their hydro plants. The UpperSalmon Creek powerplant is scheduled for rewinding the generators toincrease the capacity from the present 2,800 kW to 4,500 kW. The LowerSalmon Creek unit is proposed for reconstruction by the mid-1980's andcould provide 1,200 kW of peaking capacity. The combustion turbinescheduled for installation in 1980 would be oil-fired and have a capacityof 20,000 kW.The main distribution line of of AEL&P is being upgraded from 23 KV to69 KV. By 1983 or earlier, the upgrade will be completed and willsupply power from the Thane Substation at the south end of the system tothe Mendenhall River at the north end.Glacier Highway Electric Association (GHEA) is a REA cooperative andservices the area from roughly mile 10 on the Glacier Highway to mile21. GHEA has one standby diesel generator, operated and maintained by~L&P.11
Table 1Juneau Area Power SourcesUTILITYYear Installed Peak AverageOriginal Capacity Capacity AnnualConstruction kW kW kWhExistins GenerationDiesels, Gold Creek *Enterprise 1952 1,250 1,250Enterprise 1954 1,200 1,250Enterprise 1961 3,750 3,750Fairbanks Morse 1963 1,136 1,136Fairbanks Morse 1966 1,136 1,136Diesel, Lemon Creek *GM 1969 2,500 2,750GM 1969 2,500 2,750GM 1974 2,500 2,750GM** 1975 2,500 2,750Hydro, Gold Creek 1904 1,600 1,600 ***Hydro, Annex Creek 1915 3,700 3,700 ***Hydro, Salmon CreekNo. 1 Lower 1914 (proposed reconstruction)No. 2 Upper 1914 2,800 2,800 ***Subtotal 26,572 27,622ProEosed bI 1985Hydro, Salmon CreekNo. 1 (upgrading) 2,800 3,000 ****No. 2 (rebuilding) 1,200 1,200 ****Combustion Turbine 20,000 20,000 *Subtotal 24,000 24,200Utility Total by 1985 50,572 51,822..~,~
Table 2 Juneau Area Hydro UnitsExisting and PlannedNameInstalledCapacitykWFirm<strong>Energy</strong>1,000 kWhAverage<strong>Energy</strong>1,000 k\olhGold CreekAnnex CreekUpper Salmon CreekLower Salmon CreekSnettisham1~600 43~700*2,800*2~800 8,30047,160 168~000******10,000211,000Totals 58,060 213,300261,000• Total firm energy from existing utility hydro approximately 37 millionkilowatt-hours.••Total average energy from existing utility hydro approximately40 million kilowatt-hours.13
P ART V.POWER REQUIREMENTSThis part summarizes the studies of power requirements, including analysesof historic data and estimates of future demand. The studies arepresented in more detail in appendix D.Power Use in the 1970'sJuneau area power requirements increased at an average rate of 10 percentper year- (system net generation) in the years 1970 to 1979, and asimilar increase will be recorded in 1980. Increases in peak demand forthe same period averaged 9.3 percent. The increases are attributedprimarily to economic growth in the area--substantial increases inemployment, earnings, and population. Table 3 has statistics on systemnet generation and peak demand in the 1970's, and table 4 summarizeschanges in th~ period.As of 1979, utility sales to consumers totaled 119.6 million kilowatthours,with 43 percent in residential sales, 31 percent commercial andindustrial, and 26 percent to 'government customers. Table 5 summarizesthe sales data' from 1970 to 1979. The sales increased by 110 percent inthe period, but there waS little change in distribution between thethree main customer classes.Further analysis of residential sales indicated numbers of customersincreased at an average of 6.0 percent per year while per-customer useincreased at 2 percent. The data further indicates that per-customeruse increased quite rapidly up through 1975, declined slightly in 1976and 1977, and then showed significant increases in 1978 and 1979 (seeFigure 3). The trends since 1975 probably reflect significant conservationpractices as well as a more recent increase in use of electricityfor water and space heating.Table 6 provides a fur~her analysis of residen~ial use in 1979 for theAEL&P sys~em. At ~he end of the year, 75 percent of the AEL&P reSidential.customers were in the "general" class; 24 percent had electric hotwater systems, and slightly less than 1 percent were all-electric.Table 6 also shows per-customer use under the three residential rateschedules-5,887 kWh per year for "general", 11,140 kWh per year forgeneral with hot water, and 21,315 kWh per year for all-electric., Thesenumbers are based on the customers for the first half of the year andthe actual figure will probably be higher. The "general with hot water"customers are for the most part single-family dwellings, while the "general"class includes almost all apartments in the AEL&P service area.Table 7 summarizes the estimated Juneau area energy balance for 1977.Electricity accounted for 11.1 percent of to'tal use, with fuel oilestimated at 45.9 percent of total use. Largest categories of use arefuel oil for residential use (33.4 percent) and gasoline in surfacetransportation (24 percent).'14,
Table 3Juneau Area <strong>Energy</strong> and Peak DemandSystem MWh PeakGeneration Percent DemandFiscal Year MWh Increase MW1970 58,266 12.41971 63,786 13.81972 70,255 14.91973 75,753 15.51974 83,059 10.0% 16.21975 94,609 17.81976 106,296 19.81977 112,197 20.41978 122,218 23.41979 137,522 27.5-.-15•
Table 4Juneau Area Load StudyTrends in Da ta1970 1979PercentChange Annual1970-1979 ChangePopulation13,55619,500 (1978)44 743Peak Demand, MW12.427.5122 9.3%*<strong>Energy</strong>, Net Generation,Million kWh**58.3137.6136 10.0%*<strong>Energy</strong>, Sales, Million kWh57.0119.6110 8.6%*Residential Sales, Million kWh(44% total)25.351.2102 8.1%*kWh per Customer5,8887,03519 2%*No. CustomersCommercial Sales, Million kWh(30% of total)4,30517.02,9687,27337.169 6.0%***329/year83 6.9%*Government Sales, Million kWh(26% of total)14.731.3113 8.8%** Compounded annually** Net generation includes system losses and company use*** 1975-1979 residential customers increased from 5,495 to 7,273 or 7.2% per year compounded, , oil •
, ,. '''t,•%00' "' 6l6'-Ol6t' 1tI;>:>.1"d ,,11".1"11,~'lO~'6'I l'[O('~O' O"Z09'ZOIl'~I" '961'011'1 'If)O"Hr.'09I" '''.I,%9Z ~I6l61-0l6' lU9:>.1"d "lIu.1nllV9l 9Z lZ.1:10("L .I'lH'll .!.:.."JlULliZ.l'l(O'lZ9l2'til~'tlfi'''ti6HL:J.!.(!!ti""Ol"Z6'til9'U11''169.;ZZ ''1'!!i '91~"fHqZ 'U~~.'"JL!!L','d. I" '''.1,t; " 7.11 l ",IIlln9"H9l'Ol9'Or:9'ltti~'H,,'9ZlI'llllO"ZfZ'lZ"'611lIt'tH'Hti '~IIIII '''OO'Zl1i'~9';l""i('919"r.g"I'll('';1I 'n'1I'lZIi'tizot II, 6l61-0l6' 1119:1.1",1'( I(Z'ltl'l[ t'9?t'UII'ZlI'1'Z ('090'Z"'''~9'''t ,'90""(9RUl'l\,I(6'[Os'lt"'!!;6"~'Z!;~'6lOtcn",l~ 'lilli"l'lIIO'lll(t'9u'Lz('ll9' I""'9'!;"til5'Z55'~Zl'nl 'III' 99( , I"I("(llt'tzFmrr-It' filO'ZZtil6'6till'619"T9PI('11';'111ItrOIl"I('!lII( "I'Zlt'liR;:t't~f; lU;'tI"UJ~"f'~_,Ol('''96'91~mr,-li"lll't;I''':1:1J:1(, ...l'ql!,I.-'V::III:',,,'!::tvZ,," II, 6l6'-Ol6, lu":>.111d(" (.,U~ 1: 6lO;l'1I'H{~ ("9{6"6""'"'~" ,,'('I"Z"9Ru ;III Vl.,!.:ll!'Ul"6Z l "9'lOl'lI(litD2~~~'9l1 "lI'ltll'9(9"t'ou'Ul'c;o,~' t,,'c;LII'1(!iltUP.J1, '!illl tI '''liZ'Of9"9.:~1I'9lO tr.' 600 'II lc;o,2'0' 'l~ti"6g'll"Z9';''1l111,,:1·):'01" .. n.1.V:!I!:I,,,'!::IV~ I"IJU"!'!"~II
FIGURE 3RESIDENTIAL KWH USE PER. CUSTOMER8,000CI::t:J::;::0E-4til::::ltJ..J. 7,000
'fable 6Analysis of AEL&P <strong>Data</strong> Use Per Custumer by ClassCustomer Class Number CustoliJers % kWh Sales % kWh/CustomerGeneral (11 ) Dec 79 4,849 15Dec 18 4,151Average 4,803 28,216,103 62 5,881General with Hot Dec 79 1,540 24l-later (12) Dec 78 1,440Average 1,490 16,599,325 36 11,140All Electric (13) Dec 79 56* 1Dec 78 29Average 42 895,243 2 21,315Total Residential Dec 79 6,445...... 11+12+13 Dec 78 6,226\0(excluding Outside Average 6,335 45,111,211Light ing--46R)1,225Total Residential Dec 79 6~483 10011 + 12 + 12 + 46R Dec 78 6,265Average 6,374 45,814,861 100 1,188Significant Changes in 1919:100 new hot water customers--46 pe rcent of all new ellS tome rs .21 newall-electric heat customers--~3 ~erc\nt i~crease over 1918.* June 1980 figures indicate about 13 a 1-e ectr c customersSummarlGlass Use/Customer 1919General 5.8871I0t Water 11,140All-Electric 21.315Total Residences 7,225 (excludes outside lighting)
Table 7·Percent 9f Total <strong>Energy</strong> Consumption, by Sector,in the Juneau-Douglas Area (1977, percent)AviationSector Electric1 ty Gasoline Diesel Fuel Oil Fuel Jet Fuel Propa~e Total(1) (2) (3) (4 ) (5) (6) (7) (8) (9)Residential 4.34 33.42 .80 . 38.56Conunercial andIndus trial 3.18 .65 5.16 .27 9.26Goverrunent 2.84 7.35 10.19TransportationN Surface 23.95 4.13 28.080Harine 1. 37 1. 30 2.67Air 2.83 7.65 10.49Other* .75 .75TOTAL 11.11 25.32 6.08 45.93 2.83 7.66 1.07 10.00* Represents line losses.Percentage totals may not add to 100 percent due to rounding.See footnotes in table 13.SOURCE:Applied Economics Associates, Inc., . ~ ,
Factors Affecting Future DemandsFuture area power requirements will reflect changes in the area economy,continuing pressures to increase efficiency of energy use for all purposes,and any changes in patterns of energy use.Area EconomyThe capital move issue is of course a major uncertainty for the futureof the Juneau area economy. There are several recent studies estimatingimpacts of the move including those completed by Homan-McDowell Associatesand Rivkin Associates. It was felt that the report prepared byRivkin Associates best represented the effects of a capital move, thereforethat report provides the basis for the long range estimates offuture power demands presented in this report. The issue is not a newone--having been around in one for,m or another for at least 50 years.For utility plans, the move needs to be considered as a contingencycase. In other respects, the outlook for the Juneau area economy is forcontinued modest growth.Strong areas in the economy include construction (public works, commercial,residential), tourism, and expansion of retail trade. Renewedinterest in gold mining is also expected to affect the local community.However, for this analysis no new major industrial loads are expected.ConservationThere are certainly many evidences that <strong>Alaska</strong>ns are placing a highpriority on actions to increase efficiency of energy use and reduce oiluse where possible. Definitive statistics on the potential aren'tavailable and probably won't be for a long time to come.Visible items in the Juneau area include a substantial upgrade of buildingpractices with respect to energy efficiency, conservation investmentsby many homeowners (including some very interesting experiments inpassive solar design), a proliferation of small, fuel-efficient vehi~cles, and a large, but as yet unquantified, move towards use of wood inspace heating. .Major new conservation incentives will be available in both State andFederal programs. Of particular interest are the State's new programsusing energy audits and grants and loans for conservation and renewableresources (1980 legislative action, the impacts of which won't be fullyevident for a while). New Federal conservation initiatives (1978-1980legislation) will also provide substantial resources for improvingenergy efficiency--but these programs are for the most part not yetreflected in local energy use statistics.Substitution of Electricity for Petroleum ProductsOil prices are now at levels which make electric water and space heatingattractive to many people in Juneau. With a general outlook that oilprices will continue to rise more rapidly than other energy costs, the21
incentive to consider electric heat is very strong. The actual economicsare of course a function of the individual application. Obviously,a shift to electric heat in the Juneau area, makes sense only ifthe electricity comes from renewable resources. APA would be opposed toany shift to electric heating when the source of electricity is oil orgas generation.Statistics at the end of 1979 showed 24 percent of residential customersusing electricity for water heat and another 1 percent in the all-electricclass (AEL&P system only). The number of oil-electric homes inthe entire system increased from a total of 59 in December 1979 to a. total of about 165 in June 1980. Sales of electric water heaters havebeen strong, and a large share of new residential construction in 1980incorporates electric heat.Studies by APA and others have indicated that electric heat pumps holdgreat promise. for the Juneau area. AEL&P, GHEA, and APA initiatedfurther investigations of heat pumps in late 1979--the program includeseight air-to-air heat pumps in individual residences and monitoring ofperformance over a two-year period. Initial results are quite satisfactory.The heat pumps are of interest since their efficiency should beat least twice as high as alternative electric heat applic~tion (electricboilers or direct resistance heating).APA estimates that approximately 30 heat pumps are now in operation inthe Juneau area.There is also likelihood that electricity will eventually satisfy asignificant portion of surface transportation requirements for theJuneau area. The current generation of electric vehicles is very efficient(most passenger and light truck EV's have "fuel" economy on theorder of 0.3 to 0.5 kWh per mile). However, operation characteristics-particularly for winter driving conditions----leave much to be desired.Electric bus or light-rail transportation may also be of interest in thefuture.Estimate of Future Demands .A detailed estimate of the Juneau area power needs was based on the mostrecent data and the economic outlook for the Juneau area. Variousassumptions concerning the main factors affecting power demands weremade in this study.AssumptionsThe economic outlook for the Juneau area is a continuation of the pasttrends of the 1970's through 1985 with a possible slow-down for the1979-1980 period. The population increase during the 1970's averaged5 percent and most current studies and planners are looking for a 3-percentto 6-percent population increase through 1985. Population growthassumptions for the years beyond 1985 are shown on table 8 for themedium, high, and capital move cases. Additional assumptions on electricuse and sales are also included in this table.Conservation is expected to play a large role in the future powerdemands of Juneau. This trend is evident in all parts of the countryand even more pronounced in <strong>Alaska</strong> where hi~h fuel costs have alwaysencouraged conservation measures. It is assumed that conservation22
0TableFOR E CAS T8A.S SUM P T ION S197Q1979198o198~199o199!22oooPopulation Increa58 (i.lyr) .People per Residential CustomerkWh per Customer Increase (i.lyr)MEDIUM LOAD GRpWTH. . . . . .. ."'
measures such as smaller, energy efficient homes, as well as new andinnovative methods for home heating Will continue in future'yearsrThese methods include, but are not limited to, passive solar, woodstoves, multi-fuel boiler systems, and heat pumps. Previous studies byAPA concerning the role of electric power in Southeast <strong>Alaska</strong> and thefeasibility of heat pumps for space heating point out the tremendouspotential for conservation.•The amount of energy use for electric heating is based on criteriaoutlined in the Potential for Residential Heating <strong>Energy</strong> Conservation,and Renewable Resource Utilization in Southeast <strong>Alaska</strong>, APA, January1980. The percentage of existing homes using electric heat was expectedto increase gradually to the year 2000 at which time 66 percent would beelectrically heated. New home construction would have electric heatingin 50 percent of the new units in 1980. This would increase to 66percent by 1985 and continue at that level to the year 2000. -Each electricallyheated residence represents 23,800 kWh of energy annually whichresults in a total energy consumption of 200 million kWh in the year -2000. This figure is greater than the firm energy available from theexisting Snettisham Project which can produce 168 million kWh of firmannual energy. Adding the expected commercial and government electricheat growth, the energy sales for electric heating in 2000 will be 282million kWh.The remaining homes not heated electrically in the year 2000 wereassumed to continue on oil heat or use other forms of heat such aspropane or wood for fuel. The distribution of electric heat was assumedto be divided equally between heat pumps, electric boilers, and resistancebaseboard heating.DemandsA summary of the Juneau area power requirements is shown on table 9 forthe three cases examined. This summary indicates the future demands dueto electric heating as well as normal growth. Additional detailed dataon future sales and generation can be found in tables 10 through 13.Figures 4 and 5 show plots of the energy requirements and peak demandsfor the three cases studied.Comparison with Other ForecastsFigure 6 compares APA's estimate of peak demand with an independentlyestimated combined peak of GHEA and AEL&P. GHEA estimates were preparedusing REA methods while the AEL&P estimates were prepar~d using a consultantand in-house engineers. The results show similar results withless than 2 percent variation in the 1980 to 1985 period and less than5 percent variation in the 1985 to 1990 period. Additional comparisonsof forecasted energy requirements are shown on table 14.Market for Additional HydropowerA summary of the estimated market for hydro energy is shown in table 15for the period 1986 through 1999. Additional comparisons of total areaenergy requirements are also shown on this table for the same period.24
Jummu AI"e8 Load StudyT8blq 9 Junuau A~"ii rowel" RC'Iu'l"c,,,,,nts Su,o""'I"YHed" ... Case IlIlIh Csse Cae'ta) tlova CastsHUrlAa) U8ct~lc lIuat ~ lIo(1llal Klectl"lc IIeat Tutal NorlAal 'UOlcU Lc lie II t ~1919 (:I.... 111.~ 111.5till 27.5 Zl.5198U IOlIh 144 11 151 144 11 151 144 11 151II~ 21.4 5 II 28 5 11 21.4 ~ 11N 1'1115 (;111, 168 8l 251 194 109 )0) 169 11 242lJI11\1 12 12 64 11 41 18 12.2 21.11 601990 1:1111 18) 168 151 258 210 468 122 11 1')51-11/ ]') 64 99 49 80 129 21.2 21.8 511995 (:III, 201 241 450 )01 290 591 142 104 246till ')') ')2 III 58 110 168 26.9 19.8 66.1:.wuo (;11" 228 )10 518 119 )64 10) 161 116 297till 41 118 161 65 119 204 )0.6 51.8 82.4
Tab Ie 10 JUIlUItU Ar~a Load forecaatHedlulA Caao - Normal lIaeill! 1919 1980 ill1 1990 199~ 20001'01''' lilt I Ull" 19,~00 20,41~ 21,~OO 21, 7~0 26,210 28,940 11, 9~0'P~ople per CuatollMlr 2.8 2.8 2.8 2.8 2.7 2.~ 2.~Ru.lldtllltl a I Cust 0II1II ra 6,868 1,271 7,680 8,480 9,710 ll,~80 12,180"Wh/I!ualomer"" 6,8~~ 1,01S 7,180 7,920 l,S10 1,110 1,110Reuldenlla& Sales (441)kllh X 10 41,080 51,168 55. I 67.2 11.1 82.6 91.1e,lIuulCrc I a 16Sa lea (101)kWh X 10 11.$ 11.111 17.6 45.8 49.8 ~6.1 62.1CUVUtlllQUllt 6 Sa lea (261)....a- kllh It 1021.8 11,1 12.6 19.1 41.2 48.9 ~1.8l'ollli Salca, kllh X 10 6 (l001) I2S.1 1~2.1 166. I 181.8 201Nct Gellurat I.)n, kllh I an 6 ..... 111.5 144.0 168.0 182.7 206.6 221.1till I'eak •• ..,. 27. ~ 27.4 12.0 14.1 19.1 41. )rUI'"latlnn aa61luwd to Increalle ~I tbrollah 1980, thlln 21 throuSh 2000•• kllh/cu"lUllM!r BaIiUlAc.1 tn Increase 21 through 1985, thcn decreaao to 901 of that Icvel b~ 199~ •••• Nul gCllurat 1011 rllt 10 tu allies was IISI 111 1919 IIlId lIallll ..... !!1 the sallie 'Ill" 1980, bllt .ltUJUDlc
T .. ble 11 Juneau Arca Load forecilat111811 Caae - No rlla 1 Ua8ill! !ill 1980 ~ ~ ~ 2000I'0l,ulat 1un" 19,5OIl 20,41S 2l,SOO 27,440 '11,810 H,120 18,780People per Cuat .... er 2.8 2.1 2.8 2.1 2.7 2.S 2.SRlltlldllllt lui CustOlll8rs 6,868 l,27l 7,680 9,800 11,780 14,OSO IS, SIO"Uh lells tome r .... 6,85S l,OH 7,180 7,920 8,740 8,140 8,740Rcs'dllllttal Sales (441)kllh X 10 41.080 SI.168 SS. I 71.6 101.0 122.8 IlS.6G.,IIIIUllrcllll Sale» (101)." ...kllh X 10 6 Sale» 11.2 11.6 S2.9 70.2 81.1 92.SGUlier 0100 lit Sa Ill» (261)X 11)6 Sa leskUh ]1. 1 12.6 4S.9 60.9 72.6 80. I'I'utlll SalllK, kWh X 10 6 (1001) 119.6 12S.] 176.4 214.1 279.1 108.2Het Generat10u ...... 111. S 144.1 194 258 107.0 ]]9.0t1W I' .. ",k· ••• 21.S 28 ]7 49 Sit 6S• I'ul'ulat lOll assullM!.1 to tncrease 5% throullh 1980, tlliln 2% through 2000•• 1tl-ll,fCllstollwr assulDed til tucrll8sc 21 annulIlly throush 1990, thlln relua1n cOllstant.Het gen.:rattoll rutlo tn s'1ll:s waa liS! tn 1979, lIssulQe.1 the alliac for 1980, alld thcn assualc.1 til decrll811.e to 110% by 1985.uu bOX auuual clIl,aclty factor assUI.od. 1980 IIlId after.
Table 12Juneau Arell Load forecaet - Capltul Hove Cllee.!.!!! .ill!! ill! .!ill. ill.! .!!!!! :lOOO.1'''11111 at 1011 20,4U 21,500 22,110 2],040 2],040 16,000 19,500Peop 11$ pur Custo188r 2.8 2.8 2.8 2.8 2.1 2.1 2.5Res Ide lit hi CUlltll/lI8rll 1,2l] 7,680 1,990 8,5]0 8,510 5,925 1,800kWh/Cllstomer 1.015 1.180 7.470 1,920 8.240 8.240 8.240RUlllduntlal Sale. (441)kllh X III 51.2 55.1 59.1 61.6 70.] 48.8 64.]COhllllCrclll1 6Sa les (l01)kUb X 10 11.1 1l.6 40.6 46.0 41.8 ll. ] 4].8I:ovu r nlllent 6Sa les (261)kWh I 10 11.] 12.6 12. ] ]9.9 41.5 28.8 ]8.0NgoTotal Salea. kllb I 10 6 125.] 1l2.6 15].5 159.6 llO.9 146.1Ne t Generation. kllh I 10 61l1.5 144 152 169 116 122 161till I'u Ilk 21.5 21.4 28.9 ]2.2 ll.5 2].2 ' ]0.6'j , oil '.,;",
Table 13Juneau Area Load ForecastElectric Heat Loads - Mediwn Case1979 1980 1985 1990 1995 2000.Population 20.475 21.500 23.750 26.210 28.940 31.950Peop Ie /Cus tomer 2.8 2.8 2.8 2.7 2.5 2.5Residential Customers 7.273 7.680 8.480 9.710 11.580 12.780Res ide nt ia I Electric Heat SalesExistin~ Customers 7.273% Using Electric Heat 1 2 15 33 50 66No. of Customers 70 145 1.090 2.400 3.640Use/Customer - 23.800 kWh.4.800Million ~\fu 3 26 57 82 114New Customers 407 1.207 2.437 4.307 5.507% Using Electric Heat 50 66 66 66 66No. of Customers 200 800N Use/Customer - 23.800 kWh.1.610 2.840 3.630\0Million kWh 5 19 38 68 85Subtotal ResidentialTotal Electric Customers 70 345 1.890 4.010 6.480 8.430% of Total Customers 1 4 22 41 56 66Total Million k\fu 9 45 95 150 200Commercial Electric Heat SalesMillion k\fu •• 1 7 14 23 30Government Electric Heat SalesMillion kWh ••• 2 23 44 48 52Total Electric Heat Sales.Million kWhTotal Net Generation.12 75 153 221 282Hillion kWh 13 83 168 243 310Peak Demand. MW**** 5 32 64 92 118dO,
. . .. . ,.; "Juneau Area Load ForecastTable 13 (cant. ) Electric Heat Loads - High Case1979 1980 1985 1990 1995 2000Population 20,475 21,500 27,440 31,810 35,120 38,780People/Customer 2.8 2.8 2.8 2.7 2.5 2.5Residential Customers 7,273 7,680 9,800 11,780 14,050 15,510Residential Electric Heat SalesExisting Customers 7,273% Using Electric Heat 1 2 15 33 50 66No. of Customers 70 145 1,090 2,400 3,640 4,800Use /Cus tome r - 23,800 kWh*Uillion kWh 3 26 57 82 114New Cus tome rs 407 2,527 4,507 6,777 8,237% Using Electric Heat 50 66 66 66 66No. of Customers 200 1,670 2,970 4,470 5,440w Use/Customer - 23,800 kWh *0Million kWh 5 40 71 106 129Subtotal ResidentialTotal Electric Customers 70 345 2,760 5,370 8,110 10,240% of Total Customers 1 4 28 "46 58 66Total Million kWh 9 66 128 188 243Commercial Electric Heat SalesMillion k\fu** 1 "10 19 28 36Government Electric Heat SalesMillion k\fu*** 2 23 44 48 52Total Electric Heat Sales,M illi on kUhTotal Net Generation,12 99 191 264 331Hillion kWh 13 109 210 290 364Peak Demand, MW**** 5 41 80 110 139
Table 13 (cont)Juneau Area Load ForecastThe use per customer is based on an average of 1,415 gallons of fuel oU used per customer in 1971.Assuming 20% energy conservation and 60% furnace efficiency, the equivalent electric use is:1,415 gal X 80% X 60% X 138,000 BTU/gal ~ 3,412 BTU/kWh - 28,635 kWhThe electric heat customers were assumed to have the following distribution:ResistanceBoilerslIeat PwnpsAverage electric33.3 X 28,635 -33.3 X 28,635 -33.3 X 14,311 -heat use/customer -9,5359,5354,16123,811 Round to 23,800'Ii* Commercial customers used 15% as ouch fuel oil aa total residential customers in 1911.in the future, 20% conservation, and similar rate of conversion to electric heat •Assume same rate•• * <strong>Energy</strong> used by governments is based on conserving 20% and converting major facilities to electricheat by 1990.**** Peak demand based on 30% plant factor.., ~ ·1.
'l'ul>111 11 (cullt)J::lllclrlc lI"u l IAlad .. - Cllpltal tluvu Call IIill2. ~ .!2.!! .!!.!.! 1987 ~ 2000I::I"ctric lIullt UI>"E~lstln8 CuStONIiCS 7,273I U~lllg "1~ctrJc IIlIut I 2 5 U U 14 )0Nil. ot Custollleu 70 145 240 1,090 1,090 1,050 2,110Ulle pur ~ulltu"'lIr - 2),800kUh II 10 ) 5 26 26· 25 ~ONe" Cust ullle rs 407 717 1,2~7 0 0 0I Usl1l8 EluctrJc IIl1l1t 50 66 66Nu. uf Cuutulllt!rll 200 473 810Uiil! p"r ~ulltUIIIUC - 21,800kllb II 10 5 11 20SuLtullil lCulild~ntlll1Nu. uf Eluct ric CIIS tOIiIiU. 70 345 711 1,920 1,090 I,O~O 2,110I uf Tot81 CustolQars 4kUIi X 10 9 16 46 26 25 ~OCOWQ" cct U 16 .. JIICt ric 1I~lIl Ii 111 II.kllh X 10 2 7 4 4 8Goverllllll!IIt 6ElectrJc lIalil SIIIII.klill X 10 2 7 11 19 12 16'I'ol u I UecAric Ileal 5111e.kllil X 10 U 41 66 n 66 124'I'otul lI"t (i"llucutlun, 1-1/11 X 10 II 41 73 81 73 1)6Pellk 1)"111Jn.,,1Hct (;ullucutlullI-I/h X 10 151 199 242 259 12) 202I'cak I) "IQ
JUNEAU AREA LOAD STUDY... :ESTUtATED·PEAK'· DEMAND ..20010050a19701915.> . 1980- ...,.., .--- ...1985•"...... ....../ ""- ~. .....1990,- -- - - - ... - --- - - ....... - .1995 2000,
•'""/'•,'" '" '400·300200100o1970---.--JUN£AU AREA LOAD STUDYESTIMATED ENERGY REQUIREMENTS.,////./ ,..'"/ "", .//•./'" ....." ...-./ " .........., ,.."- ~--- ,,...- ..... ~\_--. -.,.'" • ..- • - - - . •&c-""""\, , ."... ..... _. - ,,~:;.- -.~ \.~ \.~ \...-- .,..."... \.-.--" \\/./\\.\--:1975 1980 1985 . 1990.'\.- .-.....CAPITAL MOVE CAS~-- --- --1995--- _.- -_.»jHC)2000 ~Yl
~10099FIGURE 6"COMPARISON OF APA & UTILITYESTnfATED JUNEAU PEAK DEMANDS ////?//•~ "-08070- $ 60-'~;\50:)40~t:J...,0a::~30AEL&P ONLY(MAY 1980 ESTIMATE)TOTAL AEL&P AND GHEA SYSTEM~-----------2010o1979NOTE:A2A ESTIMATES INCLUDE GLACIER HIGIDolAY ELECTRICASSOCIATION LOADS -- ROUGHLY 10% of AEL&P.
. ..Table 14Comparison of Load EstimatesUtility EstimatesPercent Annual GrowthAEL&P (CH2M Study 5/20/80) 12. 7%GIIEA (Study for REA 12/31/79 15.0%APA Estimate (5/1/80) 1980-1985 1985-1990 1990-1995Hedium CaseNormal Use 3 2 2.5Normal plus Electric Heat 10 7 5High CaseNormal Use 6 6 4Normal plus Electric Heat 14 9 71995-200_023.623Utility EstimatesEstimated Net Generation -Including Electric Heat198019851989MW27.763.393.3AEL&PMillion kWh120.7265.9-349.8GHEAMW Million2.9* 12.56.2* 27.39.8* 43.0kWhMW30.6. 64.697.4TotalMillion kWh133.2280.8399.4APA EstiJnate198019851989326492(Medium)157 33251 78331 119(High)157303435* System load factor assumed 50 percent by APA for this summary.
Table 15MARKET FOR <strong>CRATER</strong>/LONG ENERGYJUNEAU AREAYea,.Estimated ,JuneauEne,.glj Demand1000 kWhMa'rket rO" Ne..,H~d,.oelect"ic Ene,.g~1000 kWhEne,.glj Suppliedblj C,.ate,./Long1000kWh1986 271,0001987 291,0001988 311,0001989 331,0001990 351,0001991 370,8001992 390,6001993 410,4001994 430,~00199'450,0001996 467,6001997 485,2001999 502,9001999 520,40065,000(24)85,000(29)105,000(34)125,000(38)145,000(41 )164,800(44)184,600(47)204,400(50)224,200(52)244,000(54)261,600(56)279,200(58)296,800(59)314,400(60)65,00085,000105,000125,000145,000163,000....II..II......( ) indicates pe,.cent or total a,.ea ,.e~ui,.ementsMedium Q,.o..,th RateAPA 6/8037
PART VI.ALTERNATIVE POWER SOURCESThis part examines alternative power sources in the Juneau area. Analysesand costs are presented for the most likely alternatives, (1) theauthorized Crater Lake and Long Lake dam portions of the SnettishamProject and (2) diesel electric generation.Alternatives considered include local hydro projects, interconnectionwi th other towns in Southeast <strong>Alaska</strong>, s'teamp lants, tidal power, windpower, geothermal power, and diesel generation.Expansion of Existing HydroSalmon CreekThe proposed rebuild of the Lower Salm:m Creek Unit would add about2,500 kW to the capacity and about 10 million kWh of average energy toarea supplies. While these are significant additions they are a smallpart of the expected area needs (1980 demands expected to be about27,200 kW and 144 million kWh). This study assumes that the SalroonCreek rehabilitation will be completed by 1984.SnettishamThe Snettisham Project was authorized by Congress in 1962. The Corps ofEngineers constructed the Long Lake stage of the project with initialoperation occuring in December 1973. Two stages remain to complete theproject. The Crater Lake stage involves completing the tunnel to CraterLake and adding a third unit in the existing powerhouse. The Long LakeDam stage involves a laO-foot concrete gravity dam at the outlet of LongLake to increase the storage capacity. The transmission line, powerhouse,and substations were initially constructed to handle the fulldevelopment. Initial design and drilling of both sites has been completed.The rock at the Long Lake damsite has been scaled to receivethe dam.Table 16 gives the energy, capacity, and costs for the various stages ofthe Snettisham Project. The earliest on-line date for the Crater Lakestage is May 1986 while the earliest on-line date for the Long Lake damstage is October 19~5. The Crater Lake stage is the most economicalincrement and the logical next addition. The advantage of the Long Lakedam addition is that it would firm up a larger block of energy forwinter use...Other Potential HydroHydropower proj ects in the Juneau area have been studied extensivelysince 1900. The best undeveloped sites that have emerged through theyears of study include Lake Dorothy, Sweetheart, Speel River, and TeaseLake. All sites are within 2 to 6 miles of the existing Snenisham38,
Table 16Snettisham Project <strong>Data</strong>StageInstalledCapacitykWIncremental<strong>Energy</strong> ConstructionMillion kWhCostFirm Average $ MillionAnnualO&MCost$ ThousandLong Lake 47,160Crater Lake 27,000Long Lakewith Dam 47,160Total Long andCrater withDam 74,160168 211106 118 39.5*225 236 33.6*331 354 73.1*60050650* January 1980 prices. Inflation could increase these costs 35 percentbetween 1980 and the mid construction period. Interest duringconstruction will be added to determine final investment cost.39
40transmission line and considered among the more economical sites in<strong>Alaska</strong>, roughly in the order listed above. A summary of project featuresis shown below.Lake DorothySweetheart LakeSpeel RiverTease CreekInstalledCapacitykW34,00029,00063,00016,000Firm<strong>Energy</strong>Million k\fu15012527570Lake Dorothy is 3 miles north of the Snettisham transmission line underwatercable terminal on Taku Inlet, 15 miles southeast of Juneau.Project studies between 1949 and 1955 included initial design, costs,geology, and a status report.The project would need to have Congressional authorization, an environmentalassessment, and final feasibility studies before constructioncould begin.The Sweetheart Fall site is 36 miles southeast of Juneau at the southend of Gilbert Bay in Port Snettisham. Development would involve apowerplant at tidewater, a 9,OaO-foot tunnel, and a 200-foot-high concretedam. Preliminary studies have been done by several companiesproposing Feder~l li~ensing and several Federal agencies. The projectwould need Congressional authorization, environmental assessment, drillingat the damsite, and preliminary and final feasibilities beforeconstruction could begin.Speel River powerplant would be roughly 6 miles north of the existingSnettisham Project. A concrete dam 220 feet high and 3,200 feeot oftunnel would be required. Studies similar to those made for the Sweetheartproject have been made and similar future studies would also berequired.Tease Creek is a mile across Pore Sneeeisham from the existing SnettishamPowerplant and was originally developed in 1913 with a small hydrounit supplying power to a pulp mill. The unit operated until 1923. Thesite has since been abandoned. Development would require a 140-foothighdam and 6,000 feet of tunnel and penstock. The full group ofauthorizations and studies would be required.InterconnectionA detailed study is being done by APA to determine the technical andeconomic feasibility of interconnecting the Snettisham-Juneau area withPetersburg~frangell and Ketchikan. The interconnection idea is attractivebecause the entire region would then have access to the most economicalnew power sources, and the ability to shift surplus from onepart of the region to another. Underwater d.c. transmission technologyappears to offer the best chance for such interconnections. Studies todate indicate possible need and justification for the interconnection inthe late 1980's, following completion of Ketchikan's Swan Lake Projectand the Tyee Project for service to Petersburg and Wrangell.
Such interconnection would enhance feasibility of, the Snettisham expansiorito the extent that power surplus to Juneau area needs couldbe u i'i1ized in the other communi ties.APA has examined the possibility of interconnection with Hoonah tomake Snettisham pm.er available to that city. Because of the relativelysmall power demands at Hoonah, we have not yet found a feasibleinterconnection plan. Also, because of the small loads, service toHoonah 'would not affect materially the feasibility of the Snettishamexpansion.Interconnection with neighboring areas of Canada is considered as along-term possibility. The Canadians are investigating new powerproduction facilities on the Stikine River and Yukon River for possibleconstruction during the 1990's, and it is quite possible that Juneauand Southeast <strong>Alaska</strong> will be interconnected with the Canadian systemsin the long-term.Steamp1antsWood wastes at the major mill sites are essentially fully utilized.Wastes at logging operation sites are not utilized now due to the costsof collecting and preparing the wastes for use as fuel. Utilization oflarge areas of Southeast commercial units are restricted by wildernessand monument set asides, thus limiting the potential for expanding theSoutheast timber industry. The best area for utilization of wood asfuel would be those smaller communities lacking good access to hydro.Wood is not considered a reasonable alternative for Juneau at this time.Solid waste, or garbage fuel, for steamp1ants could supply only a smallfraction of the areas's needs and is not considered a major power source.Solid wastes as fuel would probably be best suited for direct heatingsystems, rather than production of electric power. Steamp1ants are notconsidered to be competetive with Snettisham incremental costs.Miscellaneous AlternativesSeveral other alternatives, such as tidal power, geothermal power, andwind power, were considered. However, due to state-of-the-art technology,cost. and proximity to the Juneau area, they are not realisticplanning alternatives at this time.DieselDiese1-e1ectric powerp1ants are expected 'to remain the main alternativeto hydropower for most Southeast <strong>Alaska</strong> communities. It is of interestto Juneau for two primary reasons: (1) it is the best accepted technologyfor standby reserves in which anticipated actual use is in theorder of 1 percent of the time and (2) it is the most practical alternativefor firm power supply if hydro and other alternatives don't proveout.-.-41..
There are two basic ~ypes of diesel generation considered to this study.Internal combustion diesel units, being more efficient, would be utilizedfor firm power while conbustion turbine units, being cheaper to install,would be considered for standby to handle peak load. A summary of unitcharacteristics is shown below.Fuel Capital O&MEfficiency Cost* CostInternal Combustion 13 kWh/gal $955/kW l¢/kW... 'Combustion Turbines 9 kWh/gal $200/kW $5/kW/yr.* January 1980 c-ostsThe following tabulation presents the estimated cost of diesel generationfor an internal combustion unit. Since combust±on turbines wouldnot be utilized for firm energy~ costs were not prepared for that typeunit.Fixed Annual CostsOperation ~nd MaintenanceFuel Cost-8l¢/gal at 13 kl-lh/galDiesel Generation Cost17.5% of $995======$167.13/year3.2¢/kWh*$52.56/kW/yearl¢/kWh6.23¢/kWh10. 43¢/kWh* Assuming 60 percent plant capacity factor.The fixed annual cost of 17.5 percent is based on 10 percent financingassumed for the private utility which markets 90 percent of the area'senergy. The capital cost is based on APA estimates for heavy duty baseload generation plants.The cost of diesel fuel and its availability is called into question byseveral recent events. They include the Administration's policy minimizingthe use of fuel oil, emphasis on increased use of renewableresources, the 1973 oil embargo, the recent shortages, and increasingcosts. Costs for this analysis were assumed at 8l¢ per gallon beginningin 1980. The following tabulat~on shows the effect of escalating fuelprices at 3 percent and 5 percent annually and the resulting cost ofenergy from the fuel alone.~'"3 PercentFuel Cost¢/gallonEscalation<strong>Energy</strong> Cost¢/kWh**5 PercentFuel Cost¢/gallonEscalation<strong>Energy</strong> Cost¢/kWh**~198019851990200081941091466.23 817.23 1038.38 16811.23 2156.237.9212.9216.54ft'!** Assumed efficiency of 13 kWh per gallon of fuel.The above costs with the modest rates of annual increase serve to showthe high effect fuel costs have on the energy cost for the diesel generationalternative.42.. ...
PART VII.LOAD/RESOURCE AND SYSTEM COST ANALYSESIntroductionA series of load/resource and system cost analyses was made to examinethe probable timing of major hydro generation investments and the consequencesof utilizing diesel generation instead of new hydro to meetfuture demands in Juneau. The impact of these hydro inves tments onpower system costs versus the impact of diesel generation was the endresult of these analyses.The analyses were completed for the folloWing basic power supp lystrategies :1. No new major hydro projects. All future demand to be met withdiesel generation.2. Meet future 4emand with Crater Lake Addition followed by LongLake Addition.3., Meet future demand with Long Lake Addition followed by CraterLake Addition.The system cost analyses processed output data from the load/resourceanalyses computer runs. System costs were determined by year to amortizeinvestments and pay all annual costs (fuel, O&M, etc.). Inflationrates of 0 and 5 percent and a fuel escalation rate of 3 percent wereutilized in the studies.The system cost analyses include generation costs and c,osts of transmittingpower to Juneau--basically the costs to the system for its powersupply, reserve generation capacity, and main transmission system. Theanalysis does not include costs for the distribution system, customerservice, billing, and utility administration.This section summarizes assumptions, methodology, and results.AssumptionsBasic assumptions used in the load/resource and system cost analysesinclude:1. Analyses Will be on a mnthly basis for Fiscal Years 1980through 1999.2. Cost base is January 1980.3. Inflation rates of 0 and 5 percent, with construction costsincreasing at inflation rate and fuel costs increasing at 3 percentabove inflation rate.43
4. Two growth rates were analyzed: medium 7 and high.5. Local capacity of 100 percent of demand is required in eventof tranmission line failure between Juneau and Snettisham.6. Transmission losses of 1.5 percent for energy and 5 percentfor capacity.7. Max~um plant factor for fossil-fuel generation units is50 percent.8. Fossil-fuel generation will be minimized as much as possible.9. Hydro plants designed for 115 percent o~'nameplate capacityfor limited reserve requirements.10.· Lower Salmon Creek hydro will come on-line in 1984.11. Earliest on-line dates and capacities of potential hydro sitesare:Capacity Firm <strong>Energy</strong>Project Date (kW) (kW)Jt!'Crater Lake 1986 27,000 106 millionLong Lake 1986 -- 57 millionLake Dorothy 1992 34,000 150 millionSweetheart 1992 29,000 125 million12. New hydro projects must be utilized 25 percent of rated outputbefore allowed to come on-line.13. Repayment criteria for the Snettisham addition would be asspecified in the authorizing legislation (50 years and 3 percentinterest).14. The cases involving the development of additional hydro willallow for additional growth from electric heating conversions untilthe projects are fully utilized.15. The case with no new hydro projects will limit electric heatconversion upon full utilization of the present Snettisham Project.16. Internal combustion diesel units would be utilized to meetfirm energy demands while combustion turbine units would be addedto meet increases in res~rve requirements.17. Load/resource analyses are based on ~ritical year energy whilethe financial analyses is based on average year energy.Methodology..As stated in the introduction, three cases were analyzed to determinetiming of new generation investments and their impact on total powersystem costs. In addition to the analyses of the effects of addingCrater and Long Lake projects to the system, the need for and timing foradding Dorothy and Sweetheart projects was also examined.44.... ..
The first step was to perform a series of load/resource analyses. Theseanalyses determined the schedule of major investments based on assumptionsof load growth. and cons traints as to when the facilities couldcome on-line. The load/resource analyses a1so determined the annualenergy production of the individual hydro plants and by type for fossil- -fuel plants.~Once the annual energy production from each type of generating plant isknown. the annual cost of energy production for each facility is calculated.Summing the annual cost for each of the facilities gives a totalcost for the system being analyzed. Since total cost and total energyare then known. the average annual energy cost for the entire system canbe found.By comparing the average energy costs over the period of analyses. thealternative configurations can be ranked based on the cost of energy.All other things being equal. the system configuration producing energyat the lowest cost should be selected as the most desirable.The load/resource model attempts to match forecasted electric energyrequirements with appropriate generating capability additions. Themodel schedules new plant additions. keeps track of older plant retirements.and computes the loading of installed capacity on a month-bymonthbasis over the period of study. New additions are scheduled toassure that both peak loads and energy requiremen~s. including reserves.are met with the least amount of installed capacity.Generating plants are loaded in the order of lowest to highest marginalenergy cost.The general approach for the load/resource analyses is to summarizeexisting and planned gross resources for each month. adj ust them downwardfor a reliability margin and for system transmission losses toarrive at net resources. If the case being analyzed allows new hydroprojects and the net resources include non-hydro generation equal to25 percent of any available hydro project which can be brought on-line.the new hydro is added to the system thereby minimizing diesel generation.At some point the net resources will not meet the forecasted peak loadsor energy demands and additional generation must be added. If no newhydro projects can be brought on-line then new diesel combustion turbinegeneration is forced on-line to meet shortages.The system cost analyses were computed utilizing output data from theload/resource analyses in conjunction with cost· data for present andfuture generation facilities. Load/resource output data included onlineand retirement dates for planned and existing facilities. outputfrom each type generation plant and individual hydro plants. plantfactors for all plants. and shortages of capacity and energy.All costs are based on January 1980 price levels and are escalated at arate equal to the rate of general inflation (0 and 5 percent in thisstudy). Fuel prices are inflated at the general inflation rate plus 3.3-percent escalat10n rate.45 -.-
Load ManagementThe load/resources studies incorporate a further assumption that newelectric heating applications would be curtailed or prohibited if demandsexceed the available hydro supply. Such action can be accomplishedthrough inverted rate structures which penalize users of electric heat,and through strict building standards relating to electric heat installations.The purpose is to avoid use of oil to produce power for electricspace heating and is a relatively common "form of load management.A second form of load management is through the use of interruptivesales. Both local'utilities are considering this type of load management,mainly for larger government installations. This could be extended tothe residential sector at the time appropriate technology is availableto enable this sector to utilize interruptible sales.Interrruptible sales decrease the reserve requirements of a system andwill limit the use of diesel generation when the Snettisham Project isfully utilized. This aspect of load management is not reflected in thepresent studies, thus the future cost of reserves is expected to besomewhat less than shown in the studies.ResultsCase 1 (no new hydro projects after completion of the Salmon Creekrehabilitation).After full utilization of available Snettisham capacity, increases indemands would have to be met by adding diesel generation. Under eitherthe medium or high load assumptions, curtailment of new electric heatapplications would be needed by about 1983. Table 17 indicates sourceof energy production under this case. The study indicated small portionsof requirements would be met by diesel generation starting in about 1982and increasing to about 14 percent of the total by 1990. (note that thestudy assumes hydro capability limited to critical year firm energy. Inmost years, significant additional usable hydro supply would be available,so actual production from the diesel generation would be somewhat smaller).Case 2 (assumes addition of Crater Lake followed by Long Lake Dam).Table 18 indicates the source of energy production in this case while.figure 9 compares the load and hydro resources in the Juneau area. Fullutilization of the two Snettisham additions would occur in the early1990's. Curtailment of new electric heating applications would be neededby 1992, unless additional hydro projects such as Lake .Dorothy or SweetheartLake were developed.Table 19 shows a comparison of average system generation and transmissioncosts for Cases 1 and 2 assuming 1980 price levels; table 20 presents asimilar comparison with a 5 percent inflation assumption. Case 2 appearssignificantly more attractive in both comparisons.Case 2 also is supplying a substantially higher portion of total areaenergy requirements. (Case 1 assumes no new electric heating applicationafter 1982; Case 2 meets requirements for new electric heatingthrough 1992.)r46
',.. .. '.. ; ........................................ " ... " .......................................................G ROW T H RAT E M 0 Q I E I C A T I a N 8thousand160-120-80 -MEDIUM GROWTH RATE WITH:o - Unrestrained Electric Heat Growth* - Growth with ProJ8ct5+ - Growth with Diesels000000oo0 ... ...... ... ... it '*ooookw0000 + ++ + + + +++ + + + ++ + +40 -Il001110 -I180II85 90II95 00YEARALASKA POWER ADMINISTRATIONJUNEAU AREA POWER MARKET ANALYSISJUNE-1980• : .' • .' . i l .... ' •• • • • • • • • • • • .. • • • • • • • • • • • • • • • • • • • • • • • • • • • • .. • • .. • • • • • • • • .. • • • • • .. • • • • • • • • • • • • • • • • • • '. " • , , • , • • • I • • • • • • • • • •: .....
..........................................................................................................................G B g ~ T l:I B ~ I Ii . t1 0 D I E I c 6 I I g ~ S520-1IIIIIII1390-MEDIUM GROWTIi RATE WITH:o - Unrestrained Electric Heat Growth* - Growth with ProJects+ - Growth with Dieselo0000 itit- it-0*0*0*00million00kWh260-0000+0+0+0++ ++++ i-++++ + +o130-o -80I85I90. II95I00. .. ~ .YEARALASKA POWER ADMINISTRATIONJUNEAU AREA POWER MAR~ET ANALYSISJUNE-1980. . . .. . . . . . . . . . . . . . . . . . . . . . . . . . . . . . . . . . . , .. . .. .. . . . . . . . . . . . . . . . . . . . . . . . . . . . . . . , . , . .. . . .. .. . . . .. .. .. . . .. . . ." .... 't
Table 17CASE 1 - ANNUAL ENERGY PRODUCTIONWITHOUT <strong>CRATER</strong>/LONG <strong>LAKE</strong> ADDITIONS******~************************************************** * UTILITV UTILITY : ** YEAR * HYDRO DIESEL :SNETT!SHAM TOTALS ********************************************************** ** 1980 ** ** 1981 ** ** 1982 ** ** 1983 *** 1984 ** 1985 ** 1986 ** ** 1987 ** ** 1988 ** ** 1989 ** ** 1990** 1991 ** ** 1992 *.** 1993 ** 1994 ** 1995 ** 1996 ** 1997 ** 1998 ** 1999 ** *37.00037.00037.00037.000122,200141.3003,300 157. 10011,900 167.400159.000 *178,300 *197.400 *216,300 **No ~urther electric heat growth 42,400 11.900 166,900 221.200 *45,300..........IIII......II"""13.500 167.30016,000 167.90018,700 168,20021. 500 168,40024,500 168,50027,600II32,400II37,300 ..42,200II47,000II51,900 ..56,200 "60,400II64,700 "68,900 "*226, 100 **229.200lt*232,200 *235.200 *238,300 *241,400 *246,200 *251, 100 *256,000 *260.800 *265.700 *270.000 *274.200 *278,500 *282,700 *********************************************************Medium Growth Rate 49All numbers rounded
Table 18CASE 2 - ANNUAL ENERGY PRODUCTIONWITH <strong>CRATER</strong>/LONG <strong>LAKE</strong> ADDITIONS(1000 kWh)*********************************************************************UTILITY : UTILITY : * YEAR * HYDRO : DIESEL :SNETTISHAM: <strong>CRATER</strong> LONG: TOTALS *********************************************************************** * ** 1980 37,000 122,200 159,200 ** * ** 1981 * 37,000 141,300 178,300 * * ** 198~ * 37,000 3,300 157, 100 197,400 * * •* 1983 * 37,000 11,900 167,400 216,300 ** * .. ** 1984 * 42,400 ~4, 500 168, 500 235.400 ** * *II* 1985 * 43,300 40,700 254, 500 ** * *.* 1986 *.. II61,000 274,800 ** * ** 1987 *... 1, 100 .. 80,200 295, 100 *.. II* * ** 1988 93,300 6,300 315,400 ** *II II* 1989 * 104,700 17,200 335,700 ** .. ** 1990 *.. .. 2,700II106,300 33, 100 355,900 ** *1991 II II II 8,300 47,300 375.900 ** * * 1992 *.. II10,500 " 50,300 380,900 I"~* * **AA,...,.,.AAAAAAAAAAAAAAAAAAAAAAAAAAAAAAAAA"""".,'''''',...."•.,'''''""""'~"""'''·'.'''''A'''6''''''''''''''''''''*** No further electric heat growth * .,.* * ** 1993 * " 13, 100 " " 52,200 385,400 ** * *II II II* 1994 *16,300 54,200 390,600 ** * *1995 '120,200 .. .. 55,200 395,500 ** * * ".1996 II*2.3,900 .. .. 55,700 399.700 ** *II II II * 1997 *27,800 56.000 403,900 ** * '"II II* 1998 31,700 .. 56,400 408,200 ,. -.'"* * * 1999 * " 35,600 " " 56,800 412, 500 *,..* * **********************************************************************Medium Growth Rate~All numbers rounded SO ..APA 6/80.,.,..
.. " ; ~••••••••••••••••••••••••••••••••••••••••••••••••••••••••••••••••••••••••••••••••••••••••••••••••••••••••••••••••••••••••••••••••••••JUNEAU LOA D 6 H Y D B 0 H E 6 0 U H C E 6•600-MEDIUM GROWTH RATE LOAD-11--- HYDRO RE60URCEa••4~0-......... ---- ADDITlONAL FUTURE IIYIlRO•/'"PROJECTS COULD MEET TIIISPORTlON OF LOAD GROW'f1l.........MILUON{,LONG UKE IIAM(+57)/~/'"./'"./'"300- <strong>CRATER</strong> <strong>LAKE</strong>--(H06) /•./'"kWh./' ,/•./'"II::Xlti'l'lNGI"I (206) ~-"I SALMON CREEKI ".-(+7.5)•IitI /1~0-w".. •o -II .-II80 85 9095 00Y E A RALASKA POWER ADMINISTRATION.JUNEAU AREA POl·IER HARI(ET ANAL va I aJUNE-19BD••. .•••• * •••••••••••••••••••••••••••••••••••••••••••••••••••••••••••••••••••••••••••••••••••••••••••••••••••••••••••••••••••••••••••••••
Table 19SYSTEM ENERGY COSTS (c/kWh) - .-0WITH AND WITHOUT<strong>CRATER</strong>/LONG <strong>LAKE</strong> ADDITIONS01- INFLATION***************************************** * MEDIUM GROWTH RATE ** * (CASE 2) (CASE 1)** WITH WITHOUT * YEAR * PRO~ECTS PRO~ECTS ****************************************** * (1983) ** :AAAAAAAAAAAAAAA** 198:5 * 3. 5 2. 7 ** * ** 1986 * 3. 3 3. 5 Ii>** *1987 * 3.2 3. 6 **1988 * 3. 4 3. 7 **1989 * 3. 4 3.8 *• * * ** 1990 * 3.3 3. 9 ** * ** 1991 * 3. 4 4. 1 ."'A."' A.", ......."'."' ...... ,,~*.'* No -Purthe,.* 1992 * 3_4 4_3 * elect,.ic heat**AAAAAAAAAAAAAAA:* growth ..* 1993 * 3. :; 4. :; ** * ** 1994 * 3. 5 4.6 ** * *..* 1995 * 3.6 4. 8 ** * ** 1996 * 3. 7 5. 0 *It"* * ** 1997 * 3. 8 5. 2 ** * ** 1998 * 3.9 5.4 ** ** 1999 * 4. 0 5. 7 * * *****************************************......<strong>CRATER</strong> <strong>LAKE</strong> ON-LINE 1986LONG <strong>LAKE</strong> ON-LINE -- 19883 pe1"cent annual -Pl.el cost escalation·APA 6/80 '" ..51$}'
Table 20SYSTEM ENERGY COSTS (c/kWh)WITH AND WITHOUT<strong>CRATER</strong>/LONG LA~E57. INFLATIONADDITIONS****************************************MEDIUM GROWTH RATE (CASE 2) (CASE 1) WITH WITHOUT * YEAR * PRO~ECTS PRO~ECTS ****************************************** * (1983) *:~AAAAAAAAAAAAAA** ** 1985 * 4. 0 2.9 ** * ** 1986 * 3.7 3.9 ** * ** 1987 * 3. 7 4.0 ** 1988 4.0 4.3 ** * ** 1989 *4. 1 4. 0 **1990 4. 1 4.9 * * *1991 * 4.4 5. 3 *1992 4.4 5. 8* **AAAAAAAAAAAAAAA:*1993 4. 6 6. 3 ** 1994 * 4.8 6. 9 ** 1995 5. 1 7. 0* ** * *1996 * 5.4 8.3 *** 1997 * 5. 8 9. 0 *"* *1998 * o. 2 9.9 ** * ** 1999 "* o. 6 10. 9 *****************************************"A " ,""_",, .. ,.",r .. ·, "No rUl'thel'electl'ic heatgl'owth<strong>CRATER</strong> <strong>LAKE</strong> ON-LINE -- 1986LONG <strong>LAKE</strong> ON-LINE -- 19883 pel'cent annual ~uel cost escalationAPA 6/8052
Case 3 (assume adcling Long Lake Dam first followed by Crater Lake Unit).This case tests the question whether Crater Lake or Long Lake Dam shouldbe constructed first. - As inclicated. on table 21, average system generationand transmi~sion costs are lo~r if Crater Lake is constructedfirst, and somewhat higher if Long Lake Dam is constructed first.Effects of High Growth Rate AssumptionIn Case 1 (no new hydro) the high growth rate load assumption wouldresult in increased use of oil for power and a further increase insystem costs.For case 2 and 3, (Crater and Long Lake Addition) the full capability ofSnettisham Project would be utilized by about 1988 under the high loadassumption.Effects of Capital Move AssumptionSpecific option cost analyses were not made for this load assumption.Oil Savings•Significant amounts of fuel oil would be saved through (1) avoidance ofoil consumption in cliese1-e1ectric generators, and (2) displacement offuel oil through the electric heat app lication. Table 22 summarizes ..estimated oil savings for the period 1986 to 1999--a total of 42 milliongallons in 14 years due to the clisplacement of cliese1 generation by theprojects while table 23 inclicates the oil savings attributable to conversionto electric heating.S3.-
Table 21SYSTEM ENERGY COSTS (c/kWh)ALTERNATE ON-LINE DATES<strong>CRATER</strong>/LONG <strong>LAKE</strong> ADDITIONS****************************************MEDIUM GROWTH RATE ..(CASE 2) (CASE 3) ..<strong>CRATER</strong>- / 86 LONG- / 86 * YEAR * LONG-'88 <strong>CRATER</strong>-'88 ****************************************** 1985 * 3. 5 3. 5 ** * * 1986 * 3.3 3.4 * * ** 1987 * 3.2 3.8 ..* ... ** 1988 * 3. 4 3. 5 *.* * ** 1989 * 3.4 3. 4 ** * ** 1990 * 3. 3 3.3 ..* * ** 1991 * 3.4 3.4 ** * ..* 1992 * 3.4 3.4 **""""""AAAAAAAA....... AAAA: AAAAA ..'AAA....... AAAA,'*** 1993 * 3. 5 3. 5** * ..* 1994 * 3. 5 3. 5 ** * *1995 3.6 3.6 * * ** 1996 * 3. 7 3. 7** * ** 1997 * 3.8 3. 8 ** * ** 1998 * 3. 9 3.9** * ** 1999 * 4. 0 4. 0 *****************************************"""AAA.-'AA.-' .......No fUT'the'l"elect'l"ic heatgT'owtho peT'cent geneT'al inflation3 peT'cent annual fuel cost escalationAPA 6/8054
Table 22.."<strong>CRATER</strong>/LONG <strong>LAKE</strong> ADDITIONSDISPLACEMENT OF DIESEL-ELECTRIC GENERATION**************************************** * MEDIUM GROWTH RATE'** * ENERGY OIL COST'** * (1000) (1000) (1000) ** YEAR * kWh gallons $ ***************************************** * ** 1986 * 15,977 1,775 1,717 ** * ** 1987'*17,669 1,963 1,955 ** * ** 1988 * 21,515 2.391 2.453 ** * ** 1989 * 24,518 2.724 2.879 ** * '** 1990 * 24,872 2,764 3,008 ** * ** 1991 * 23,881 2.653 2,975 ** * ** 1992 * 26,842 2.982 3,444 ** * ** 1993 * 29,088 3,232 3,844 ** * ** 1994 * 30,705 3,412 4, 180 ** * ** 199~ * 31,712 3,524 4,446 ** * '** 19q6 * 32,230 3.581 4.655 ** * '** 1997 * 32.588 3.621 4,848 *,fI"* * ** 1998 * 32,946 3,661 5,048 ** * * t" ..* 1999 * 33,304 3,700 5,256 ** * ***************************************** * **TOTALS* 377,847 : 41.983 : 50.710 ** * ****************************************~,~<strong>CRATER</strong> <strong>LAKE</strong> ON-LINE -- 1986LONG <strong>LAKE</strong> ON-LINE -- 1988o pe~cent gene~al inflation3 pe~cent annual fuel cost escalationAll numbe~s a~e roundedAPA 6/8055~'...
Table ~3ELECTRIC HEAT CONVERSIONDISPLACEMENT OF FUEL-OIL CONSUMPTION,--0**************************************** * MEDIUM GROW~ RATE ** * ENERGV OIL COST *-* * (1000) (1000) (1000) ** * kWh gallons .. ************************.**************** 1986 * 45,000 2,231 2, 158 ** * ** 1987 * 62,000 3,074 3,074 ** * ** 1988 * 79,000 3,917 - .4,019 ** * ** 1990 * 96,000 4,760 5,031 ** * ** 1991 * 11:3,000 5,602 6,098 ** * ** 1992 * 128,000 6,:346 7, 11:5 ** * ** 1993 * 128,000 6,:346 7,:329 ** * ** 1994 * 128.000 6,346 7,:548 ** * ** 199' * 128.000 6,:346 7,775 ** * ** 1996 * 128.000 6,:346 8,008 ** * ** 1997 * 128.000 6,:346 8,249** * ** 1998 * 128,000 6,:346 8,7'1 ** * ** 1999 *128,000 6,:346 9,013 ** * ***************************************** **TOTALS*1,4:36,000 : 70,:352 : 84, 168 ** * ****************************************° pe~c.nt gene~al in~lation:3 p.~c.nt annual Tuel cost escalationAll numbe~s a~e ~oundedAPA 6/9056
PART VIII.FINANCIAL ANALYSESThis section presents data on revenue requirements and wholesale powercosts, for the Snettisham Project, with and without Crater Lake stageand Long Lake Dam.The method used is a standard power repayment study (computerized)developed by the Water and Power Resources Service. The power repaymentstudy shows expected revenues and costs for each year of the projectrepayment period. The study is used to estimate average rates sufficientto repay reimbursable costs.This analyses uses average sales in the computation of repayment costswhich differ from the critical year generation figures in the load/resourceanalyses. Critical year energy was utilized in the previoussection to insure that adequate generation is available during criticalwater years. Average energy sales are utilized in this section as thesemore closely approximate the actual conditions.Repayment CriteriaRepayment criteria for Snettisham were initially established in theproject authorization (Section 204 of the Flood Control Act of 1962,Public Law 87-874):SEC. 204. (1) For the purpose of developing hydroelectric powerand to encourage and promote the economic development of and tofoster the establishment of essential industries in the State of<strong>Alaska</strong>, and for other purposes, the Secretary of the Army, actingthrough the Chief of Engineers, is authorized to construct and theSecrtary of the Interior is authoirzed to operate and maintain theCrater-Long Lakes division of the Snettisham project near Juneau,<strong>Alaska</strong>. The works of the division shall consist of pressure tunnels,surge tanks, penstocks, a powerplant, transmission facilities, andrelated facilities, all at an estimated cost of $41,634,000.(b) Electric power and energy generated at the division exceptthat portion required in the operation of the diviSion, shall bedisposed of by the Secretary of the Interior in stich a manner as toencourage the most widespread use thereof at the lowest possiblerates to consumers consistent with sound business principles. Rateschedules shall be drawn having regard to the recovery of the costsof producing and transmitting the power and energy, including theamortization of the capital investment over a reasonable period ofyears, with interest at the average rate (which rate shall becertified by the Secretary of the Treasury) paid by the UnitedStates on its ',arketable long-term securities outstanding on thedate of this Act and adjusted to the nearest one-eighth of 1 percentum.In the sale of such power and energy, preference shall begiven to Federal agencies, public bodies, and cooperatives. Itshall be a condition of every contract made under this Act for thesale of power and energy that the purchaser, if it be a purchaserfor resale, will deliver power and energy to Federal agencies orfacilities thereof within its transmission area at a reasonablecharge for the use of its transmission facilities. All receiptsfrom the transmission and sale of electric power and energy generatedat said division shall be covered into the Treasury of theUnited States to the credit of miscellaneous receipts.t··...'
The Secretary of Treasury certified 3 percent as the project interestrate pursuant to the formula in Section 204(b) of PL 87-874.Project repayment criteris were amended by ~ection 201 of the WaterResources Development Act of 1976; Public Law 94-587:Section 201. (a) Section 204(b) of the Act of October 23, 1962(76 Stat. 1173, 1174), is amended by striking the period at the endof the second sentence and insert the following: ": Provided,'That the Secretary of the Interior, in determining reimbursablecosts, shall not include the cost of replacing and relocating theoriginal Salisbury Ridge section of the 138-kilovolt transmissionline: Provided further, that the Secretary of the Army, actingthrough the Chief of Engineers, shall relocate such transmissionlines, at an estimated cost of $5,641,000.".(b) 'The Crater-Long Lakes division of the Snettisham Project nearJuneau, <strong>Alaska</strong>, as authorized by Section 204 of the Flood ControlAct of 1962, is modified with respect to the reimbursement paymentsto the United States on such proj ect in order to provide (1) thatthe repayment period shall be sixty years, (2) that the firstannual payment shall be 0.1 per centum of the total principalamount to be repaid, (3) thereafter annual payments shall be increasedby 0.1 percentum of such total each year until the tenthyear at which time the payment shall be 1 percentum of such total,and (4) subsequent annual payments for the remaining fifty years ofthe sixty-year-repayment period shall be one-fiftieth of the balanceremaining after the tenth annual payment (including interestover such sixty-year period).The Interior Department Responsibilities for the Snettisham Project wereassigned ·to the Secretary of <strong>Energy</strong> in the DOE Enabling Act, PublicLaw 95-91.In accordance with the 1976 Act, portions of the project interest rateare being deferred during' an initial 10-year period which ends onOc~ober 1, 1985. All projec~ cos~s, including the deferral 1n~erest,are to be repaid in a subsequent 50-year period ending in 2035. Thepresent wholesale power rate of 15.6 mills per kilowatt-hour reflectsthe interest deferral. 'The rates will need. to be increased at the endof the 10-year period, with or without the Crater and Long Lake Damadditions •Repayment StudiesA set of repayment studies was prepared to illustrate the followingcases:1. Existing project, 1980 costs;2. Existing project plus the Crater Lake and Long Lake additions,1980 costs;58,
• f"-3. Case 2 modified to reflect an inflation assumption of theCorps that costs would be inflated 35 percent at the midpoint ofconstruction;4. Case 2 modified to reflect a lower total growth assumption of10 percent lower .load growth until project are fully utilized.Each of the cases assumes the present rate of 15.6 mills per kilowatthourwould be maintained throughout the initial 10-year period, andestimates an average rate to meet repayment requirements over the balanceof the repayment period.Table 24 is a summary of investment costs for the Crater and Long LakeAdditions.Additional assumptions used in the repayment studies include the follow;ing:..1. Repayment period - 50 years.2. Interest rate - 3 percent.3. Medium growth rate.4. Crater Lakea. Investment cost - $44,633,000b. Annual O&M cost - $50,000.,..c. Annual replacement cost - $12,000 .d. On-line date - 19865. Long Lake Dama~ Investment cost - $35,089,000b. On-line date - 1988Results6. All costs associated with existing project are an extension ofrepayment studies camp leted by APA in March 1980.f-*The results of the repayment analysis are summarized in the followingtable. The figures indicate the wholesale power rate which would berequired in 1986 to repay all project costs.Mills1. Existing Project (1980 Costs)26.02. Existing project plus Crater and LongAdditions (1980 Costs)23.559
Table 24INVESTMENT COST SUMMARY($/million)<strong>CRATER</strong>/LONG <strong>LAKE</strong> ADDITIONS<strong>CRATER</strong>LONGLAIo
3. Exis~ing Project plus Cra~er and LongAddi~ions (35% Cost Increase)4. Existing Project plus Crater and LongAddi~ions (10% Reduction in Growth)Mills26.524.0.61•
APPENDIX ASystem Cost Analyses Output
System Cost Analyses OutputAn example of the output from the system cost analyses is shown on thefollowing pages. As indicated, this output is from a case utilizing amedium plus electric heat growth rate, 0 percent general inflation, and3 percent fuel escalation. All numbers in this output were roundedduring computer processing.A-l
~I'vGROWTH RATE: MEDIUM + ELECTRIC HEATFUEL ESCALATION RATE: 3XGENERAL INFLATION RATE: OXALASKA POWER ADMINISTRATIONJUNEAU AREA LOAD STUDYJUNE-1980*****************************************************************************.Ia- !~§'Q * 1 981 ** INST. ANNUAL ANNUAL ENERGY * INST. ANNUAL ANNUAL ENERGY ** CAP. COST ENERGY COST * CAP. COST ENERGY COST ** (kW) (!Ii)
:s--IwGROWTH RATE: MEDIUM + ELECTRIC HEATFUEL ESCALATION RATE: 3'l.GENERAL INFLATION RATE: O'l.ALASKA POWER ADMINISTRATIONJUNEAU AREA LOAD STUDYJUNE-1980*********************************************~,******************************** L~82 * 1.983 'II-* INST. ANNUAL ANNUAL ENERGY * INST. ANNUAL ANNUAL ENERGY ** CAP. COST ENERGY COST * CAP. COST ENERGY COST II-* ( kW) ($) (MWh) ($/kWh)* ( kW) ($ ) (MWh) ($/kWh)*********************************************************************************************RESOURCES II-* ***************** * ** * *HYDRO * *II-,II-* *UTILITIES * 8,450 630,000 37,000 .017 * 8,450 630,000 37,000 .017 * *SNETTISHAM * 47, 160 2,450,000 157, 100 .016 * 47, 160 2,612,000 167,400 .016 *,~,* *<strong>CRATER</strong> <strong>LAKE</strong> * 0 0 0 .000 * 0 0 0 .000 ** *LONG <strong>LAKE</strong> * 0 0 0 .000 * 0 0 .000 ** * °*DOROTHY * 00 .000 * 0 0 0 .000 ** °* *mJEETHEART * 0 0 0 .000 * 0 0 0 .000 *COMB. TURBINE* *II-* 20,400 490,000 0 .000 * 27,900 790,000 0 .000 *DIESELii'* ** 18,222 430,000 3,300 . 130 * 18,222 1,144,000 11. 900 .096 ** * *ENEHGY LOSS* *II-,-* < 2,900)- *'- 3,200:'- *iI' *II-* *K********************************************************************************************* *II-TOTAL * 94,232 4,000,000 194,500 .021 * 101,732 5,176,000 213, 100 .024 It* *It********************************************************************************************
!I--I.t--GRm.JTH RATE: I"IELHUI"I ... ELECTRIC HEATFUEL. ESCALATION RATE: ::nGENERAL INFLATIUN RATE: 0%ALASKA POWER ADMINISTRATIONJUNEAU AREA LOAD STUDYJUNE-1980••••••••••• *.***.***.********************************************************-II- l_«tfl.i * 12.§.2 ** INST. ANNUAL ANNUAL ENERGY * INST. ANNUAL ANNUAL ENERGY •* CAP. COST ENERGY COST * CAP. COST ENERGY COST •* (to/kWh>*••• ** •• **.*.*.*** ••••••• **.* ••••• ****.**.******.*.********* •• ***.**** •• ********************.HES()Uf~CES• * **-11-*.**** .... *.* •• * * ** •IItlynRIJ * •!tit•II-UTILITIES * 10, :350 968,000 42,400 .023 * 10,350 1,210,000 45,300 .027 !t-• * ..SNETTISHAM • 47, 160 2,628.000 168,500 .016 •47. 160 2, 62B.000 168,500 .016 II-• * II-CRATB'l LAI(E * 0 0 0 .000 • 0 0 0 .000 ..* * *LONG L.AKE * 0 0 0 .000 * 0 0 0 .000 II--I.* *OOROTHY * 0 a 0 .000 * 0 0 0 . 000 **-It•Sl-JEETHEAHT ... 0 0 0 .000 * 0 0 0 .000 *~.* •cOI-m. TUR B I NE n 32.'J00 990,000 0 .000 * 37.900 L 198.000 100 11. 980 *it*II-DIESEL * 18,222 2,222,000 24,500 .091 * 18,222 3,659,000 40,700 .090 ** *II-'j}*II-ENERGY LOSS ·It .'" 3,500>-"* < 3,800) ** * *-It* ********** •• ******.********.***************.******************************************n******* * ..rUrAL. * lOB, 632 6.808,000 2:31.900 . 029 * 113.632 8. 695.000 250,800 .035 *k* •• ~~~U**~ •• U~ •• *************************************************************************_*
~IVIALASKA POWER ADMINISTRATIONJUNEAU AREA LOAD STUDYGROWTH RATE: MEDIUM + ELECTRIC HEATJUNE-1980FUEL ESCALATION RATE: 3XGENERAL INFLATION RATE: OX****************************************************************************** 1986 * 1.987 ** INST. ANNUAL ANNUAL ENERGY * INST. ANNUAL ANNUAL ENERGY ** CAP. COST ENERGY COST * CAP. COST ENERGY COST ** (kW) ($) (MWh) ($/kWh)* (kW) ($) (MWh) ($/kWh)*********************************************************************************************f~ES[)URCES * * ******************HYDRO *UTILITIES * 10,350 1, 210, 000 45,300*SNETTISHAM * 47, 160 4,380,000 168,500*<strong>CRATER</strong> <strong>LAKE</strong> * 27,000 1, 673, 000 61.000*LONG <strong>LAKE</strong> * 0 0 0.j(-DDROTHY * 0 0 0*SWEETHEART * 0 0 0*COMB. TURBINE * 45,400 1, 491, 000 0*DIESEL * 18,222 171,000 0**ENERGY LOSS**i~.~'"4,100>*.027 * 10,350 1,210,000.026 * 47,160 4,380,000.027 * 27,000 1,673,000*.000 **.000 **.000 **.000 **.000 ******oooooo52,900 1, 791,00018,222 267,000**Il-*45,300 .027 **168,500 .026 .Il-Il-80,200 .021 **0 .000 **0 .000 **0 .000 **0 .000 **1, 100 .243 ***4,400)- **k******************************************************************************************* * *TOTAL. * 148,132 8,925,000 270,700 .033 * 155,632 9,321,000 290,700 .032 ** *********************************************************************************************"'Il-
:>.-I1)\GROWTH RATE: MEDIUM + ELECTRIC HEATALASKA POWER ADMINISTRATIONJUNEAU AREA LOAD STUDYJUNE-1980FUEL ESCALATION RATE: 3%GENERAL INFLATION RATE: 0%****************************************************************************** l'l§!:1 * 1989 *it INST. ANNUAL ANNUAL ENERGY * INST. ANNUAL ANNUAL ENERGY ** CAP. COST ENERGY COST * CAP. COST ENERGY COST ** ( kW) ( $ ) (MWh) ($/kWh)* ( kW) ( $) (MWh) ($/kWh)*U"~~***.***~*******************************it************************************************HESnURCES )I-* *****k**k******** * *)I-* *HYDRU * * ** * *UTILITIES * 10,350 1,210,000 45,300 .027 * 10,350 1,210,000 45,300 .027 ** * *SNETTISHAM * 47, 160 4,380,000 168,500 .026 * 47, 160 4,380,000 168,500 .026 *·It )I-*<strong>CRATER</strong> <strong>LAKE</strong> * 27,000 1,673,000 95.300 .018 * 27,000 1,673,000 104,700 .016 ** * *LONG <strong>LAKE</strong> * 991,000 6,300 . 157 * 0 1,322,000 17,200 .077 *it °* *DOt1[)THY * 0 0° .000 * 0 0 0 .000 *.* * *SHEETHEART * 0 0 0 .000 * 0 0 0 .000 *·It* *COMU. TURUINE * 60,400 2,091. 000° .000 * 67,900 2,392,000 0 .000 *it· )I-*DIESEL * 18,222 171. 000 0 .000 * 18,222 171,000 0 .000 .11-.* * *It·* *ENEflGY LOSS it *II·* *it)I-************************************************************************Hitll-******************TOTAL * 163,132 10,516.000 310,700 .034 * 170,632 11, J48,000 330,700 .034 ** * ***~****.************************************************************************************
~I-lGROWTH RATE: MEDIUM + ELECTRIC HEATFUEL ESCALATION RATE: 3XGENERAL INFLATION RATE: OXALASKA POWER ADMINISTRATIONJUNEAU AREA LOAD STUDYJUNE-1980****************************************************************************** 1990 * l~ ** INST. ANNUAL ANNUAL ENERGY * INST. ANNUAL ANNUAL ENERGY ** CAP. COST ENERGY COST * CAP. COST ENERGY COST ** (kW) ($ ) (MWh) ($1 kWh) *
~IcoALASKA POl-JER ADMINISTRATIONJUNEAU AREA LO,AD STUDYJUNE-1980GHOWTH RATE: MEDIUM + ELECTRIC HEATFUEL ESCALATION RATE: 3%OENEHAL INFLATION RATE: 01.****************************************************************************** 1.'2'/2 * 1.993 ,It* INST. ANNUAL ANNUAL ENERGY * INST. ANNUAL ANNUAL ENERGY ** CAP. COST ENERGY COST * CAP. COST· ENERGY COST ** ( kW) ($) (I'1Wh ) ($/kWh)* ( kW) ($) (HWh) ($/kWh)*It.******************************************************************************************HESOURCES ,* * *.~************** * •* * *HYDRO it* *II* •UTILITIES -It 10.3tiO 1.210.000 45.300 .027 * 10,350 1. 210. 000 45.300 .027 *·It* •SNETTISHAH * 47. 160 4.380.000 168.500 .026 * 47. 160 4,380.000 168.500 .026 ** * *<strong>CRATER</strong> <strong>LAKE</strong> * 27.000 1. 673. 000 106.300 .016 * 27.000 1.673.000 106.300 .016 It* *·ItLONG <strong>LAKE</strong> * 0 1. 322,000 50.300 .026 * 0 1,322.000 52.500 .025 ** * *DOROTHY * 0 0 0 .000 * 0 0 0 . 000 ** * *Sl-JEE.THEART i ..0 0 .000 * 0 0 0 .000 *It °* *CON \J, T umn NE * EK!. 900 2.992.000 0 ,000 * 82.900 2. 9'J2. 000 0 ,000 *it*ItDIESEL * 18. ;;~22 1.249.000 10.500 . 119 * 18.222 1.556.000 13. 100 .119 ** * ** * *~ENEfWY LOSS *
P>I\0AL.ASKA POWER ADMINISTRATIONJUNEAU AREA LOAD STUDYGROWTH RATE: NEDHJM + ~LECTRIC HEATJUNE-1980FUEL ESCALATION RATE: 3%GENERAL INFLATION RATE: OX****************************************************************************** 1994 * 1.995 ** INST. ANNUAL ANNUAL ENERGY * INST. ANNUAL ANNUAL ENERGY ** CAP. COST ENERGY COST * CAP. COST ENERGY COST ** (kW) ($) (MWh) ($/kWh)* (kW) ($) (ML-Jh) ($/kWh)**~******************************************************************************************RESOURCES * * ***************** *.~* * *HYDRO * * ** * *UTILITIES * 10,350 1,210,000 45,300 .027 * 10,350 1. 210, 000 45,300 .027 ** *ItSNETTISHAM * 47, 160 4,380,000 168,500 .026 * 47, 160 4,380,000 168, 500 .026 ** * *<strong>CRATER</strong> <strong>LAKE</strong> * 27,000 1,673,000 106,300 .016 * 27,000 1,673,000 106,300 .016 ** * *LONG <strong>LAKE</strong> * 0 1,322,000 54,200 .024 * 0 1,322,000 55,200 .024 *.11-*II-DOROTHY * 0 0 0 .000 * 0 0 0 .000 ** *II-SWEETHEART * 0 0 0 .000 * 0 0 0 .000 ** * *COMB. TURBINE * 85,400 3,092,000 0 .000 * 85,400 3,092,000 0 .000 ** *II-DIESEL * 18,222 1. 948, 000 16,300 .120 * 18,222 2,428,000 20,200 .120 *.. * ** * *ENEHGY LOSS * < 5,800)- *.( 5,800> ** * It* * It********************************************************************************************II * IIfOTAL.. 188,132 13,625,000 384,800 .035 * 188,132 14,105,000 389,700 .036 ** * *II*II*~.**************************************************************************************
~I......0GROWTH RATE: I'IEDIUM + ELECTRIC HEATFUEL ESCALATION RATE: 3%GENERAL INFLATION RATE: OXALASli.A POWER ADMINISTRATIONJUNEAU AREA LOAD STUDY.. JUNE-1980****************************************************************************** !.~.'t~ * 1~27 ** INST. ANNUAL ANNUAL ENERGY * INST. ANNUAL ANNUAL ENERGY ** CAP. COST ENERGY COST * CAP. COST ENERGY COST ** (HI) ($) (11Wh) ($/kWh)* (kW) ($) (/"IWh) ($/I(Wh)***.*~.***k*~~kll-.******k~"*******************************************************************f
~I..........GROWTH RATE: I'IED I UI'1 + ELECTR I r, I-IEA TALASKA POWER ADMINISTRATIONJUNEAU AREA LOAD STUDYJUNE-1980FUEL ESCALATION RATE: 3%GENEHAL INFLATION RATE: OX*_*_••********************************************************M**~************ ~ * 1,999 ** INST. ANNUAL ANNUAL ENERGY * INST. ANNUAL ANNUAL ENERGY ** CAP. COST ENERGY COST * CAP. COST ENERGY COST ** (kW) ($) (MWh) ($/kWh)* (kW) ($) (MWh) ($/kWh>**********n~Uk**********************************************************************~********~ESOU~CES * * *ft~~~*.********** * **I}*HYDRO * *'I}* *<strong>CRATER</strong> <strong>LAKE</strong> * 27,000 1,673.000 106.300 .016 * 27,000 1,673,000 106,300 .016 ** * *LDNG LAI.t..E * 0 1. 322, 000 56,400 .023 * 0 1. 322, 000 56,800 .023 ** * *DDfWTHY * 0 0 0 .000 * 0 0 0 .000 ** * *Bl.JEETI-lEART * 0 0 0 .000 ii, 0 0 0 .000 *it* *cm·lB. TURB INE * 87,900 3.196,000 0 .000 * 87.900 3,264.000 400 8. 160 ** * *DIESEL * 18.222 4.015,000 31.700 . 12-' * 18.222 4.556,000 35,200 .129 It-* * ** * *ENEHGY LOSS *.( 6,000> * ** * ** * **-******************************** •• ********************************************************* * *T01'Al_ * 190,632 15.796.000 402,200 .039 * 190,632 16,405.000 406,400 ,040 ** *****~U*********************************R****************************************************'Ii" Ii"*,IT ILl T I E:tl * 10,350 1,210,000 45,300 .027 * 10,350 1,210,000 45,300 .027 *'Ii" II-*SNETTISHAM * 47, 160 4.380.000 168. 500 .026 * 47, 160 4,380,000 168, 500 .026 *,It-
APPENDIX BCost Comparison Plots of Alternatives
ENERGY~L.L_tLJ_E _.tL __ LH_ E-B G Y6 - 0 - NO NEW FEDEHAL HYDRO (Case 1 )4, --*C 0 c.'~I- WITH NEW F'EDEHAL HYDfW (Cas~ 2)'86 - Crater Lake CI'88 - Lung Lakec·~a00uC[)tiTa003 -. 00:1It-'cent5pe .....kWh1. --a~.aaa *'I~ a ·It *~. **,IIil'* .~ *II'I
· . . . . . . . . . . . . . . . . . . . . . . . . . . . . . . . . . . . . . . . . . . . . . . . . . . . . . . . . . . . . . . . . . . . . . . . . . . . . . . . . . . . . . . ~ .12-1 0 - N() NEJJ FEOEfML HYDRO (Cust: 1)li __ Y Ei _T E .t1__ ~_~ G Y __ G-.!l S _L-B.* - WITH NEW FEDERAL HYDRO (Case 2)186 - Crater Lake188 - Long Lake. . . . . . . .D'1 -00ENERGY0COST06 --00iI'ittJ;jINcentsHIH'kWh;j_.i!-0 0ii·00D*0* ·It00D*elit-i!-i!-i!-i!-i!-i!-iI'0 0IoII10 -I180I85I90I95I00MEDIUM GROWTH RATE5% Gener~l Inflation3% Fuel EscalationYEARALASKA POWER ADMINISTRATIONJUNEAU AREA POWER MARKET ANALYSISJUNE-19BO
ENE R G Y6 - a - LONG <strong>LAKE</strong>('B6); <strong>CRATER</strong> <strong>LAKE</strong>( 'B6) (Case 3)* - <strong>CRATER</strong> <strong>LAKE</strong>('B6); LONG <strong>LAKE</strong>('BB) (Case 2)COS T S4. -ENERGYCOSTo;lIwcentsperkWh3 -L-i~ aaaa .11- £) a.,~0 a a a0 aaa(,aoo -80-,---------------------,,0-------------------- ,I85 90II95---,I00MEDIUM GROWTH RATE0% General Inflation3% Fuel EscalationYEARALASKA POWER ADMINISTRATIONJUNEAU AREA POWER HARKET ANALYSISJUNE-1980
APPENDIX CCrater Lake Construction Costs
CONSTRUCTION COSTS<strong>CRATER</strong> <strong>LAKE</strong> PROJECTCOSTACCT.NO.FEATURECOST($1000)04..407.. 1.2.3.808.19.DAMPower Intake WorksPOWERPLANTPowerhouseTurbines & GeneratorsAccessory Electrical EquipmentTransmission PlantROADSBUILDINGS, GROUNDS, UTILITIES(26,789)26,789(4,783)4453,9164931999092230.~NGINEERING& DESIGN2,68631.SUPERVISION & ADMINISTRATION3, 24039, SeQSource: Corps Or Engineers,January, 1980C-l
APPENDIX DComments
ALASKA ELECTRIC LIGHT AND POWER CO.13. N. FRANKLIN STREET t:·JUNEAU. ALASKA ••• 01(907) !588·2222August 29, 1980-Mr. Robert J. CrossAdministrator<strong>Alaska</strong> Power Administrationp.o. Box 50Juneau, <strong>Alaska</strong> 99802Dear Bob:Reference is made to the <strong>Alaska</strong> Power Administration'sdraft "Juneau Area Power Market Analysis" dated July, 1980.The <strong>Alaska</strong> Electric Light and Power Company (AELP) concludesfrom the Analysis (and its own studies) that immediate stepsshould be taken to initiate the construction of the CraterLake addition to the Snettisham Hydroelectric Project. Aswas pointed out in the Load/Resource and System Cost AnalysisSection (Part VII), it will be necessary to rely on dieselsto a minor extent in 1982 and a much greater extent startingin 1983. Thus, if Snettisham is not expanded the Juneau areamay find itself with diesel electric energy requirementwhich it has successfully eliminated for the last severalyears.The Analysis indicates for the earlie.st Crater Lakewill be on line by 1986. There are many factors whichcould cause delay in completion of any Snettisham additionincluding the lack of Federal funds as a result of governmentfiscal constraints or the nuances of the appropriationprocess as well as construction or environmental problems.Thus, AELP urges that steps be taken now to proceed with theCrater Lake addition.Please telephone me if I can answer further questions.Very truly yours,tJA~.·L.,.y a . ~William A. CorbusHanagerWAC/ak
Glacier HighwayElectric Association Inc.
(Bibliography
Bib liography1. Juneau Area Load Estimate, H:ay 1980, <strong>Alaska</strong> Power Administration.2. State and Federal Employment in Juneau, Sixth Annual Report, December1979, Homan-McDowe11 Associates.3. Socio-Economic Impact Analysis for Juneau and the Matanuska-SusitnaBorough, March 1978, Rivkin Associates.4. Role of Electric Power in the Southeast <strong>Alaska</strong> Economy, March 1979,<strong>Alaska</strong> Power Administration.Other <strong>Data</strong> Sources<strong>Alaska</strong> Electric Light and Power Load Estimate.Glacier Highway Electric Association Load Estimate Prepared for REA.
EXHIBIT 8JUNEAU AREA POWER MARKET ANALYSISADDENDur~OCTOBER 1980ALASKA POWER ADMINISTRATION
@ .. .,,; .r~# , :'•Department Of <strong>Energy</strong><strong>Alaska</strong> Power AdministrationP.O. Box 50Juneau. <strong>Alaska</strong> 99802 October 3, 1980Colonel Lee R. Nunn, District EngineerU.S. Department of the ArmyCorps of EngineersP.O. Box 7002Anchorage, AK 99510Dear Colonel Nunn:We received additional comments on our draft Juneau Area Power Marketreport from the <strong>Alaska</strong> Power Authority and the State's Division of<strong>Energy</strong> and Power Development after we had finalized the report.The comments and our responses are enclosed as an addendum to ourreport, and we'll distribute the addendum along with this report.We're pleased to note the <strong>Alaska</strong> Power Authority and the Division of<strong>Energy</strong> and Power Development concur in our recommendations with respectto the Crater Lake unit of the Snettisham Project.EnclosuresSincerely,., .I .,.,~.~. /--::1 -/ /. t-~c... / !" . C· /t'-"/_ ''''{..,.! ",''V,. .,V' . .;. ,~ r~obert J. CrossY Administrator1
ADDENDUMJuneau Area Power Market ReportOctober 1, 1980
.,\\ rTF I~\ II r r~ \i0f11 u?'JAY 5 HAMMOND(GOVI!:RNO"ll.. v / iI I ., \ I I :!......., U ,,\ I In \ "--') ,(\.\ I f7i.\ t, I"mi\ r L1M (~rr. ;/~j~.\::: i :'.'.~.:£"~ u U \...! .J '--' J u L:J L! ..J '-=-: .. Ir' ?:\lJ ; ":1 .. j 'J i.DEPART~IENT OF CO~IMfERC~'·~&.. /,ECO:\"OMIC DEVELOp~alENT'\' ~ -;:,',; ,I :,".~DIVISION OF ENERGY & POYVER DEVELOPMENT,7TH FLOOR MACKA Y BLDG.338 DENALI STREETANCHORAGE, ALASKA 99501PHONE: (90l! 27S'{)SORSeptember 16, 1980Mr. Robert J. CrossAdministratorDepartment of <strong>Energy</strong><strong>Alaska</strong> Power AdministrationP. O. Box 50Juneau, <strong>Alaska</strong> 99802Dear Mr. Cross:The draft "Juneau Area Power Market Analysis" was forwarded to theDivision of <strong>Energy</strong> and Power Development 'for review. This lettersummarize~ the gist of the comments telephoned by them to your Mr. FloydSumners on September 8, 1980.In general we are in agreement with the conclusions reached by thestudy. It would seem prudent to proceed with the acquisit;on of fundingfor the already authorized Crater Lake project is so that the additionalcapacity can be brought on line in an orderly as needed manner.Although you have probably already caught them, the follo\>Jing typo'swere noted duri.ng the revi ew of the study:Page 11, line 2, first paragraph - Table! should be Table 1.~age 14, second paragraph - Table # should be Table 3.. - Table $ should be Table 4.third paragraph - Table % should be Table 5.Page 22, fifth paragraph - The word 'particula~' should be. 'particularly'.Page 36 - The decimal point is misplaced under theTotalM~~column 13.60' should be '30.6'. Page 46 in thelnext toPage 46 in the next to the last paragraph - There is a transpositionin the wor'd 'compa ri son' ..
Mr. R. CrossSept" 16, 1980Page Two1. On page 22 the first paragraph contains the sentence "Obviously, ashift to electric heat makes sense only if the electricity comes fromrenewable resources. II While this is true within the context of thisnalysis'we think the statement too general. Under some scenarios coal,wood or even petroleum produced electricity might make electric heatpractical.2. We think the derivation of the 30% load factor for electrical heatmerits further explanation. In our opinion it seems low. This wouldimply a load whose demand would normally be covered with peaking generation;a function not normally supplied by hydroelectric generation.3.l~e fel t that the estimated peak demand curves on page 33 mi ght be 1 abel eda little more clearly.On page 41 the fuel efficiency assumption of 9 ki110watt hours pergallon of fuel turbines is applic~ble only to a simple cycle gas combustionturbine. The overall efficiency of combined cycle or regenative cyclecombustion turbines rivals that of a diesel engine. While these optionsare generally only practical on a larger sizes it is not beyond therealm of possibility that even firm energy could be produced by acombustion turbine. Although we don't disagree with your assumptions,clarification might be helpful.4. On page 42 we think it might be helpful of the lifetime of the dieselengine was established. According to our interest tables 17.5% at10% compound interest corresponds to a lifetime of approximately 9years. This seems short for the large, slow-speed, properly maintainedunit that would probably be used for this type operation.5. On page 46 the first paragraph asserts that state regulatory actioncould pr~hibit electric heating applications. We question whether thisis fact under existing statutes including PURPA. We further question ifit were fact if it could be practically enforced. We f"rther questionin view of Juneau's limited industrial development how significantinterruptable loads really are.Oa page 59 at the bottom of the page under IIResults ll the final units arenot identified. We presume you meant mills but it would be helpful toadd that.We hope these cOl11T1ents will be helpful and feel that none will alter theconclusions reached in the study. As stated previously we agree withthose conclusions. If we can be of further help or if you would likemore clarification please let us know.S"incere1y,Clarissa QuinlanDi rectorcc:John Farnan
Response to Division of <strong>Energy</strong> and Pm-1er Development1. We agree in part. A \-1ood or coal-based generating system couldmake electric heating practical from both an energy conservationand economic vie\-1point. Hm-1ever, APA remains opposed to anyelectric heating using petroleum produced electricity.2. The 30 percent figure is an estimated annual load factor for theelectric heat portion of the load. On a daily or weekly basis,heating loads create a very high load factor during colder periodsof the year, in effect, increasing the base load in the wintermonths. Actually, hydro generation is very \-1ell suited to servingthis kind of load if reservoir storage is adequate to produce theenergy in the winter months when needed.3. We agree on the fuel consumption figure. For this study simplecycle combustion turbines were utilized to satisfy reserve requirementsonly with the internal combustion diesel being used for firmenergy production. We agree that combined cycle combustion turbinescould have been used, but.we did not do so for this study.4. We used an estimated life of 35 years for the diesel engines.Our fixed costs of 17.5 percent include interest costs of 10 percentwith the additional 7.5 percent composed of costs for insurance,replacements, taxes. and depreciation.5. We deleted the statement that regulatory action could be usedto prohibit ne\v electric heating applications. The largest immediatearea for interruptible sales is for larger government andcommercial buildings. Both Juneau area utilities have tarifffilings for interruptible rates before the <strong>Alaska</strong> Public UtilitiesCommission for this purpose. The Juneau Federal Building will soonbe using this rate, and there appears to be significant potentialfor increased utilization of this type rate.
Phone: (907) 277: )l(907) 276-_""... ::;. :.'. _ Ii. : "" ~'. _.' .. , ,;' -:r, ; ~ '" >; "', S~ptember 11, 1980Mr. Robert Cross<strong>Alaska</strong> Power AdministrationPost Office Box SOJuneau, <strong>Alaska</strong> 99802Dear Bob:. /We have reviewed your draft Juneau Area Power Market Analysis and canoffer just comments.. . .. .. . .1.' On p,age 40 in the section titled lIinterconnection", you state that"expansion of Snettisham is the most economical regional source of newpower" •. While this may be true, we note on page '37 that there is verylittle firm energy from Snettisham additions available after 1991 fortransmission to any major load centers outside of Juneau. Perhaps thatclarification should be added on page 40 •.. 2~' In, our attempts toi denti fy reaso~ab 1 ecost'powera lternati ves for the';community of Hoonah,. we find there is a, great deal of local interest inan· interconnection to. Snettisham'.· This alternative begins to look very.. attractive in lightof-th~ anticipated loads;both at ~oonah and Hawk. Inlet, much of 'which would result from planned. timber and miningactivity •. A letter from SealaskaCorporation on thesubjec.t ;'S attached ..' , Mr. Bob-Martin of THREA, Mr. Bob. Loescher of Sealaska Corporation, andofficials from Noranda' Mining Company can all provide ins.ights intolikely future power requirements. .. " ...... ... ~-. ': ", In sum~ary~ it seems to u~that a Hawk Irilet/Hoonah interco~nection,,.because of distances involved and load requirements, may make atleast as much sense in the near term as an interconnection to Petersburg!Wrangell and Ketchikan~You may want to address the possibility in yourreport and consider this load centerasapossible,marketforSnettisham •. .."i..•.• : power~, ,
Mr. Robert CrossSeptember 11, 1980Page TwoOn the basis of the information presented in your report, \,ie concur inyour recommendation to construct the Crater Lake unit. We recommend your considerationof an interconnection to Hawk Inlet and Hoonah in light of much largerloads than anticipated when you addressed the concepts' viability at the requestof Hoonah's mayor last year.Attachment:as notedSincerely,'L. y ""\ v-V-Eric P. YouldExecutive Director
RECEIYEQSeptember 2, 1980Eric Yould<strong>Alaska</strong> Power Authority333 W. 4th Avenue, Suite 31Anchorage, <strong>Alaska</strong> 9~SOlRe:Hoonah <strong>Energy</strong> StudyDear Mr. Yould:Thank you very much for your letter of August 7, 1980 andalso for the meeting that was held here at Sealaska Corporationto review a draft report of the Hoonah Wood Generation FeasibilityStudy. After a thorough discussion and review by our staff andwith other corporations affected by this report, we have drawnthe conclusion that document is incomplete and does not representthe probable impact that Native corporations will have dueto their activity in the timber industry in the Hoonah area.With regard to the future of the wood generation feasibilitystudy, I would like to draw your attention to previous."correspondence that I have previously submitted to you withregard to the initiation of this study.Of primary concern to Sealaska Corporation, in consultation with "Hoonah Totem Corporation and the Tlingit-Haida Regional Electrica~Authority, is the focus by the <strong>Alaska</strong> Power Authority and governmeniagencies on the types of alternate energy sources possible forthe Hoonah area. We continue to be of the opinion that a smallhydroelectric facility on Gartina Creek would provide a goodsource of energy production which could be relied upon to replace,existing diesel fuel requirements at the existing generationplants.Additionally, recent discussions with Noranda Mining Company,who has holdings on northern Admiralty Island which is locatedbetween Outer Point, North Douglas Island, and Hoonah, <strong>Alaska</strong>,may provide the best long term solution to energy supply forthe community of Hoonah. The Noranda Mining Company attendedour meeting the other day and indicated a constant requirementfor 5.5 megawatts of energy to operate its mill site and camp ~facilities at Hawk Inlet, <strong>Alaska</strong> on line on or about 1983 or 1984.
Eric YouldSeptember 2, 1980Page 2Coupled with a potential need of 2 to 3 megawatts of industrialpower requirements at Hoonah by the Native corporations, apossibility exists that the economics for an underwater transmissioline utilizing excess Snettisham hydroelectric dam power mightbecome feasible.It is our opinion that if any work is to be done to analyze energysupply alternatives for the Hoonah area, that both hydroelectricpotential at Gartina Creek and the underwater transmissionfeasibility study should be priority among those agencies, potentiaindustrial, and residential users and the municipality concernedwith energy for Hoonah. We urge your consideration of these viewsand are available for further discussion.Thanking you for this consideration.Sincerely, tSEALASKA) CORPORATION!j. \)L. l· /Robert W( 'loescher,Natural ResourcesDirectorcc:Frank Roppel, STCRobert Martin, Jr. THREACity of Hoonah Mayor Miles MurphyJohn Hinchman, Huna Totem CorporationFrank See
Response to <strong>Alaska</strong> Power Authority Comments1. We agree with this comment and wording in the final report isconsistent with that vietV'.2. He agree that development of a netV' m~n~ng load at HatV'k Inlet couldimprove the feasibility for delivery of Snettisham power to Hoonahand we are making arrangements to evaluate this option. Our reportdoes not recognize the possibility of this mining load. If.serviceto Hoonah and Hawk Inlet proves feasible, the total demands onSnettisham pmV'er in 1990 would be approximately 8 percent largerthan indicated in our reports.3. We agree that the system·costs could have been more prominentlydisplayed. These costs are fully detailed in Chapter VII, "LoadResource and System Cost Analyses."4. An additional analyses was completed which examined wholesaleenergy costs for the Snettisham Project in the event of a capitalmove in conjunction \V'ith the construction of the Crater Lakeaddition. This analyses indicates that a wholesale energy cost ofabout 53 mills would be required to repay all project costs. Thisis six mills higher than the projected rate in 1986 with no netV'project additions. We have not estimated total impacts on powersystem costs. Increases would be relatively small since systemreserve requirements would be made smaller and the surplus hydroenergy would minimize requirements for diesel generation. Overall,this would be a relatively small risk when compared to the consequencesof energy shortage and high cost diesel generation in theevent the project is delayed and no capital move occurs.
EXHIBIT 9JUNEAU AREA POWER r'lARKET ANALYSISUPDATE OF LOAD FORECASTAUGUST 1981ALAS KA POWER Am~ I N I STRAT ION
JUNEAU AREA feWER MARKEl' ANALYSISUPDATE OF LOAD FOREX:ASTAUGUST 1981INTRODucrIONIn September 1980 <strong>Alaska</strong> Power Administration (APA) completed a J\IDeau·Area Paver Market Analysis which supported a recarmendation to the Corpsof Engineers to proceed with actions to construct the Crater Lake unit ofSnettisham. Power fran the Crater Lake addition was detennined to beneeded in the 1986-1987 tine frane. The purpose of this update of theload forecast portion of the 1980 FOWer market report is to detennine ifthe previous estimates of power needs are still reasonable and conditionsstill support seeking fundS' for Crater Lake.BASIC DATAElectric use and other data is collected annually to detect changes inhistoric trends that rcay affect future energy use. <strong>Data</strong> examplesinclude: electric use data fran the utilities, State and localgovernmant building plans, building permits and hare construction trends,contractors workload, Borough capitalIIOVe impact studies, and in"tel:viewswith State officials.These trends are then carpared" to past trends and used in part inestimating future uses.<strong>Energy</strong>, Net Generation, M'mFiscal YearPeak Demand, M'l1979 1980133,457 143,12823.1 26.21979-1980% Change7.213.41981(9 rronths)121,00032.2Detailed historic data is shown on Table 1.Nl.lIIber of Residential CUstarersCalendar Year Average 7 ,197 7,490 +4.1%*Use Per Residential CUstarrer, kWh. 7 ,110 7,770 +9.3%*Primari1y due to increased electricheat and hot water use.o Ristoric data shows 1970-1979 increases of:<strong>Energy</strong> Sales+8.6%Peak Demand+7.1%Number of Residential CUstarers +6.0%Use Per Residential Custarer+2%1
oThere is a strong trend toward increased electric hot water heatingand all electric hOItes due to the increase in oil prices.Number of AEL&P CUSTI:MERS *Class of Residential-CUSi:OIrEr Dec. 31, 1979 Dec. 31, 1980 June 30, 1981General4,8494,8294,680General with hot waterAll electric1,540561,7533581,834559Total 6,445 6,940 7,073*AEL&P serves 90% of the area custarrers.ooooooIn early 1:979 there were roughly 2 residential heat purrp systems.By December 1980 there were 45 to SO, and by mid 1981 there were120 • Several net{ ccrmercial establishrrents also use heatpumps, and a f€!N older businesses are insta J 1 ing them.The Federal Building was converted to electric heat in 1980, butnot used. New State and local governm:nt building plans arecurrently for using electric heat. Partial conversion toelectric heat by all levels of governm:nt i13 likely.The number of State fQsitions increased 205 (5.5%) in.l980 whichis near the past six year average. The outlook for 1981 issimilar.Federal Govenment fQsitions remained stable and the outlook isthe sane.Local gOVeJ:J'lIIeI1t increased rrore than average in 1980, and theoutlook is for nearer the nonn.The payroll and economic indicators are increasing scrrewhatfaster than the previous years. OUtlook is for a continuationpast the mid 1980's.o The :t:Otential Juneau to Hoonah intertie could increase the 1986energy use by 15%.ooThe start up of the Noranda mine in 1985 or 1986 could addroughly 300 errp10yees at Hawk Inlet, 200 of which w"'Ould live inJtmeau.Heating oil costs increased 20% annually between 1978 and mid1981.2
o<strong>Energy</strong> sales for AEL&P (90% of area load) were near the pastaverage trend for 1980, and for the first six rronths of CY 1981the overall trend is higher with a 10.6 percent increase overlast year. Historic sales data is" shown on attached Table 2.ResidentialCormercialGovernmentTotalCY 197945.835.530.5111.1Million KWH - Sales% ofCY 1980 197951.8 11337.4 10529.8 102119.7 107.76 rronths198130.918.616.165:"5% of 1st6 rro. 1980124102100110.6o<strong>Energy</strong> sales for GHEA (10% of area load) during the first sixrronths of CY 1981 are up 22 percent for residential, 9 percentfor all other uses, and an overall increase of 18%.EVALUATION OF BASIC DATAThe Juneau area has shown very strong econanic conditions in 1980 and1981, with a similar outlook through at least the mid 1980 1 5. The primefactors appear to be State expenditures and State arid local governrrentincreases in personnel and budgets. Residential construction" hasincreased and is IPaintaining a" steady pace primarily due to theavailability of State financing. Ca:mercial building has lagged, butshopping centers and office buildings are under construction now. TheUniversity of <strong>Alaska</strong> has an aggressive construction plan with buildingsbecan:ing operational in 1981, 1982, and one per year planned over thenext decade. The proposed Noranda mine and Sealaska Corporation planswill add to the local economy. rvnst new- construction plans includeelectric heat with several using the rrore efficient heat purrps.Except for the capital nove situation, the ronstruction plan and economicsituation of the State support an outlook for the next several years ofrontinued strength and growth as strong as has been experienced since1975.ESTIMATE OF EUl'URE DEMANDSAssumptionsTwo cases were re-analyzed; the medium load growth case and a capitalIIDVe case. Both cases reflect significant uses of electric heat. Thehigh growth case was not re-analyzed after it was detennined that therewere no significant changes fran previous studies.3
M::diurn Load G.rcwt.h caseo Population will grow at two percent annually. People perresidential cust.cner will rerrain at 2.6 until 1985 then declineto 2.5. Kilowatt hours per residential custc:::mer will increase 2%per year until 1985, decline 2% per year until 1995, then remainstable. -oooThe ratio of sales l::etween residential, ccrmercial, andgove.nlIIEIlt will continue the past 10 year trend of 44%, 30%, and26% re~vely.The existing residential custarers will convert to electric heatfor a total of 15% by 1985, 33% by 1~90, 50% by 1995, and 66% bythe year 2000. .Ninety percent of new residences will be all electric instead of66 percent as asS1..1IIEd in last year I s study. This is asignificant increase. Other assumptions on use of heat pumpsand continued conservation are the sarre.o t-lost planned govemrcent buildings ~NOuld l::e electricallyheated. Half of the City and Borough schooLS would convert toelectric heat over the next decade. Part of the ma.jor. Stateoffice buildings would ·routinely convert to electric heat in thelate 1980 I s. This conversion was previously estinlated to occurin -the early 1980 I S as part of the State-wide conservation plan.However, the State has postponed these plans. For the purt:Osesof this study, it is now as~ that conversions will occur inthe late 1980 I S as part of routine building upgrading.oThe Federal Building, which converted to an interruptibleelectric heat system in 1980, will start using electric heat inthe fall of 1981.o Distribution system losses will rem:U.n at about 10%.Capital MJve caseooThe population would continue increasing 2% annually through1982, and after the vote increase only 1% per year through 1985,remain stable through 1987, and then decrease 30% by 1990. Fromthe low level in 1990 it would increase 2% annually through w.eyear 2000.Assurrptions on electric heat are at the sarre pace, except halfgove.nlIIEIlt use was asSl.lIIEd after tbe rrove.4
RESULTS<strong>Data</strong> for the first half of 1981 indicates continuation of strong pasttrends. (Utility sales are up 12% overall, and Snettisharn sales are up19%.) Utility data shews electric heat is increasing rapidly and hascompensated for the lag in COItll'ercial use and strong conservation ingovernrrent use. The updated estimate based on 1980 data is shewn in theattached Table 3 and graph.Lower census figures for 1980 resulted in a 10 p:rcent reduction in theestirtE.ted nurrber of custarers for the year 2000, and required revision ofthe estirnate rrade last. year. Hewever, the revised census figuresaffected only a 2 percent change in 1985 which is the critical near tennperiod of this study.The est.irnated peak use for the 1980-1981 winter was lower than theforecasted value due pr.irnarily to the unusually wann winter and theFederal Building using oil heat instead of electric heat rrDst of thewinter.The results of the updated est.irnate of energy use, and the first ninerronths data for Fiscal Year 1981, indicate less than 2 p:rcent changefran the previous load estimates. We, therefore, conclude thatrecamendations for the need for Crater Lake in the 1986-1987 tine frarreare still valid.APA will continue to make· annual assessments of energy uses and changedconditions in the Juneau area to verify the decision to proceed withSnettisham additions.Detailed supp:>rting data and analysis are available in APA' s office.5
..Table 1. Juneau Area <strong>Energy</strong> and Peak DerrandSystem Mvll % Peak HI'l %Generation Annual Dem3nd AnnualFiscal Year wm: * Increase m Increase1970 58,266 12.41971 63,786 13.81972 70,255 10.2 14.91973 75,753 15.51974 83,059 16.2 7.11975 94,609 17.81976 106,296 19.81977 112,197 7.7 20.40"1978 U2,218 23.4~1979 133,457 (R) 23.1 (R)13 .41980 °143,128 26.2U.8** 22.11981 (161,000) ** 32.2 (Dec. 80)...* Includes AEL&P and GHEA sales and losses.** Estimate based on nine rronths data.(R) Revised fran previously published data.6
abl •. 2 Jun.au An. Enerl' 5al .. and PorCODt of 5Alo. b, Socto~ (1000. KllII)
Juneau Area Load StudyTable 3. Juneau Area Power Requiranents Summary l/Fiscal Year Medium case capi tal Move Case1979 mIl 1980 Study 1981 Study 1980 Study 1981 StudyM-J 133.5 133.523.1 23.11980 GVH 157 143.1 143.1 . -~--'M-J 33 26.2 26.21981 GlH 1/ 161 1/M-J 32.2 32.21985 Glli 251 244 242 229ttW 64 62 60 571990 GlII 351 347 195 19200 MW 99 98 51 487'~_,.~_r1995 mIl -150·-- 442 246 218M-J 131 132.0 67 562000 GlII 538 529 297 244MW 161 161 84 65 \./1/ Based on data up through June 1981.
600500400JUNEAU AREA LOAD STUDYESTIMATED ENERGY REQUIREMENTS1981 Update•zaH~~ 300:J~200100 - .,/ .-"_f~~. --0. .--./'./'.--•e CaseCap t eal Mo"")(o1970 1975 1980I1985 1990 1995 200
EXHIBIT 10JUNEAU AREA POWER r~ARKET .l\NALYS I SUPDATE OF LOAD FORECASTJULY 1982ALASKA POWER ADrHN ISTRATION
JUNEAU AREA POWER fl\ARKET ANALYSISUPDATE OF LOAD FORECASTJuly 1982<strong>Alaska</strong> Power AdministrationU.S. Department of <strong>Energy</strong>
CONTENTSINTRODUCTION 1BASIC DATA .•............•••...... ~....................... 1EVALUATION OF BAS IC DATA ..............•..........•....... 8Residential Sector .................................. 8Commercial and Government Sector .••..•...••......... 9Residential <strong>Energy</strong> Use per Customer •••..•••.•••..... 9Weather Influence on <strong>Energy</strong> and Capacity .••.•....... 10ESTIMATES OF FUTURE DEMANDS ...........•.....•.•.•••.....• 13~lethods ••••••••••••.••••••••••••.••••••••••••••••••• 13Assumptions ••..••••.....••.••.••.•••.••••••••.•...•. 13Basic Load Growth Case ......•••••••••• ~ ••....•. 14Capital Move Case .............................. 15RESULTS AND CONCLUSIONS .............•.•••...•.•.......... 17TABLES1 Juneau Area <strong>Energy</strong> and Peak Demand .••••.•..•...... 22 Juneau cArea <strong>Energy</strong> Sales and Percent of Salesby Sector ....................................... 33 Juneau Airport Heating Degree Days •••••••••••••••• 54 Basic Case Estimate of Future Demands •••••••..•••. 165 Juneau Area Power Requirements Net Generation •.... 186 Comparison of Juneau Area Hydro Resources andEstimated Loads ••••....•••••••.••.••••••••••.•.• 20FIGURES1 October-April Net Generation Adjusted for Weather. 122 Estimated <strong>Energy</strong> Requirements •••••••••••••.••••••• 19
1JUNEAU AREA POHER r·1ARKET ANALYSISUPDATE OF LOAD FORECASTr~AY 1982INTRODUCTION<strong>Alaska</strong> Power Administration (APA) estimated Juneau area powerrequirements through the year 2000 for this study, which updates similarstudies dated September 1980 and August 1981. The area has experienced asignificant increase in peak demand and energy IJse since 1980. Theseincreases, especially those for the winters of 1981 and 1982, wereexamined in detail.Both the 1980 and 1981 studies indicated area power use would exceedcritical year firm energy from existing hydroelectric plant duringFY 1983. This new study indicates this \'1i11 indeed happen.BASIC DATAIn order to better define conditions that contributed to the largeincrease in energy use this past year, data was gathered on energy use,economic, and climatic conditions. <strong>Energy</strong> and capacity use data camefrom monthly and annual reports prepared by APA and the two localutilities, climatic data from the National' Oceanic and AtmosphericAdministration (NOAA), and economic data from State and local sources.ooTable 1 presents annual system net generation and peak demand forfiscal years 1970 through April 1982 along with annual percentincreases.Table 1 indicates:--1981 net generation was 16.5 percent above 1980--1982 October though April net generation was 26.7 percent abovesimilar period for 1981--1981 peak demand of 32.2 MW was 22.9 percent over 1980--1982 peak demand (Jan 82) of 42 MW was 30.4 percent above 1981Table 2 presents sales by residential, commercial, and governmentsector for the 1970-1981 period. Tabulated below is sales by sectorand percent changes for 1980,1981, and 1982. Residential customeruse increased the most dramatically. Part of the commercialbuildings were out of service for remodeling in 1981.Sales GWh. Change Sales GWH Change% ofOct-Apr Oct-Apr Oct-AprCY 1980 CY 1981 % of 1980 FY 1981* FY 1982 1981*Residential 52.2 72.3 139 42.2 60.2 143Commercial 37.9 40.4 107 22.8 27.5 121Government 33.3 35.5 107 21.3 22.4 105129.4 148.2 114.5 86.3 110.1 128* AEL&P sales increased proportionately to account for GHEA sales.
2TABLE l. Juneau Area <strong>Energy</strong> and Peak DemandSystemNet MWH % Peak M\~ %. Generati an Annual Demand AnnualFiscal Year r~WH* Increase MW Increase1970 58,266 12.41971 63,786 13.81972 70,255 14.91973 75,753 15.510.1 7.41974 83,059 16.21975 94,609 17.81976 106,296 19.81977 112,197 20.48.9 14.71978 122,218 23.49.2 -1.31979 133,457 (R) 23.1 (R)7.21980 ::".·143,128 26.216.5 22.91981 166,700 32.230.41982 (Oct-May)(144,200) 42.0(actual) 23.01982** 205,000** 42.0* Includes AEL&P and GHEA sales and losses.** Estimate based on 7 months data.(R)Revised fram previously published data.APA 6/82
Table Z.Juneau Are. Eneray Saleo and Percent of Sale. by Sector(1000 IMI)Calendar Year.!!LQ.Res ident lnl Sale..!ll!..!21!!ill. 1974 .!ill. !illill! .ill! .!21.! .!lli .!illAF.L&P 23,034.1 24,562.7GIIE ... 2.315.3 2.579.9TotAL 25.349.4 27,142.6Percent 44 452S,009.23.026.831.036.04630,298.1 31,875.2 33,865.8 36,174.83,185. r 3,545.2 3, 794.1 4.126.533,483.2 35,420.4 37,659.9 40,301.345 46 43 4238,701.6 42,143.4 45,814.9 51,939.3 64,387.04.291.7 4.936.3 5,353.1 6,375.6 2 , ~O' 042,993.3 47,079.7 51,168.0 58,214.9 72,289.042 43 43 45 48.8Average Percent 1970-1981 18 44%Commercial SIlle8At:L&P 15.712.9 17,322.1GIIE ... 1.251.4 1,388.3Tot,,1 16.964.3 18,710.1Percent 30 31Government Solie.18,511.31. 388. 619,89Y.92922,039.4 21,366.8 25,614.1 27,018.21,339.4 1,185.7 1,622.3 1,828.523,378.83122,552.52927,236.43128,846.73029,552.5 31,406.1 34,654.4 36,548.5 38,H8.01.951. 4 2,060.3 2,482.8 1,319.0 I S13 331,503.9 33,466.4 37,137.2 37,867.5 40,371.331 31 31 27.2Average Percent 1970-1981 18 30%AEL&P 13,541.9_ 13,927.1GHEA 395.3 417.1OutdoorLight. 782.5 741.0Total 14,719.7 15,085.2Percent 26 2515,327.1483.6733.516,544.22516,398.7 17,545.5 22,008.8 25,253.4565.9 621.4 815.9 789.4694.8 704.9 994.917,679.9 18,861. 7 ·23,529.6 27,037.7*24 25 26 2827,232.0 26,825.5 30,670.7 31,328.6 32,531.0872.8 931.6 631.6 1,988.5 1,364.50.7 I 010.128,104.8* 27,757.1* 31,302.3* 33,317.8 35,566.2'"27 26 26 26 24.0Averege Percent 1970-1981 18 26%Total .57,033.4 60,937.067,480.174,541.9 76,834.6 88,425.9 96,185.7102,602.0 108,303.2 119,607.5 129,400.2 148,226.5* Lighting Included •.....,-CON
4oResidential sales continued increasing into 1982 with most of thegrowth in the all-electric customer class as' shown by AEL&P data.Class of ResidentialCustomerGenera 1General w/Hot waterAll electricTotal AEL&P ResidentialoAEL&P October though April Sales GWH198018.611.01.330.91981 .18.112.96.537.5198218.515.719.1'5"3:3The strong trend toward all e 1 ectri c homes is further illustrated bythe shift in number of AEL&P customers from the general class to thehot water and all electric classes.Class of ResidentialCustomerGenera 1 .General w/ hot waterAll electricTotal AEL&P ResidentialNumber of AEL&P CUSTOMERS*12/31/794,8491,540566,44512/31/804,8291,7533486,94012/31/814,2371,8868727,08504/30/824,4341,9441,0217,399* AEL&P serves 90% of the area customers, and is consideredrepresentative of GHEA customers. GHEA does not report data inexactly this form.The above data also indicates a strong steady increase in the number oftotal customers.oThis was the energy use per residential customer including bothAEL&P and GHEA for previous calendar years:Number of Residential CustomersUse per Residential Customer, KWH<strong>Energy</strong> Use and Residential CustomersCY 1979 CY 1980 CY 19817,1977,1107,4907,770*7,8019,270** Increase due primarily to new electric heat and hot water use.ooHeat pump installations are continuing for both residences andcommercial applications ..Heat Pump Installations1979 - 21980 - 45 to 501981 - 150Table 3 presents heating degree days for July 1958 though April1982.
5( "I,TABLE 3.JUNEAU AIRPORT HEATING DEGREE DAYSSeason July Aug Sept Oct Nov Dec Jan Feb Mar Apr May June Total1958-59 230 316 521 736 928 1076 1449 1022 959 781 582 285 88851959-60 328 378 498 757 911 926 1146 911 1019 713 470 409 84661960-61 321 355 466 660 915 956 1062 932 938 746 538 371 82601961-62 262 339 511 760 1027 1246 1182 1097 1095 756 627 447 93491962-63 250 305 486 645 810 1132 1147 885 1023 B46 500 431 84601963-64 288 244 375 625 1093 993 1098 835 1118 785 610 336 84001964-65 324 347 453 614 980 1496 1291 1154 923 813 693 487 95751965-66 292 297 435 654 1045 1182 1746 1090 1071 805 667 355 96391966-67 ,265 382 466 812 ' 1191 1188 1291 963 1261 824 592 300 95351967-68 340 303 444 671 973 1162 1432 1043 984 808 508 374 90421968-69 248 . 281 516 802 920 1405 1801 1219 1054 727 464 218 96551969-70 343 448 521 724 975 921 1329 830 876 770 601 422 87601970-71 387 405 553 783 1110 1343 1607 1029 1112 784 658 346 101171971-72 227 290 504 811 1001 1360 1519 1315 1186 906 618 432 101691972-73 207 293 535 810 907 1275 1423 1126 986 752 585 404 93021973-74 343 404 505 732 1253 1143 1550 1006 1242 765 556 437 99361974-75 349 315 437 690 851 957 1296 1129 1063 791 541 402 88211975-76 281 337 402 712 1088 1244 1132 1131 1006 706 597 384 90201976-77 280 275 427 679 717 938 918 690 893 673 531 320 73411977-78 243 196 428 695 1062 1423 1233 922 954 683 525 317 86811978-79 298 262 427 612 1037 1134 1370 1505 904 712 528 378 91671979-80 251 205 415 609 ,830 1187 1404 895 949 678 477 278 81781980-81 283 308 472 628 783 1333 843 899 786 772 392 316 7815Avg 23 yrs = 89811981-82 257 275 ' 469 682 841 1175 1584 1213 1017 816Source:Climatalogical. <strong>Data</strong>, National Oceanic and Atmospheric AdministrationAPA 7/82
6The policy of conservation and conversion to electric heat by the Stateand Borough has changed significantly, and these subjects are receivingless emphasis or have been completely eliminated from the planningprocess in some cases. Last year the University of <strong>Alaska</strong> had plans forconstructing a large new building each year for the next 10 years, butnow plans are for about half or less of tRat activity due to budgetconstraints. Although, University buildings under construction andplanned for the next year or two will have electric heat. The dataindicates a lessening of large building electric heat new demandsstarting about the mid 1980's.State government comprising two-thirds of the area economy added over 200jobs to the area in 1981 for an increase 0.6 percent above the 5.7percent average growth over the past seven years. This growth hasmaintained'demand for new homes and more State office space. Commercialloads which lagged in 1980 and early 1981 started increasing the latterhalf of 1981 and now a six to seven million KWh load is foreseen for FY1983. This amounts to a 16 percent increase in commercial sales for FY1983 and is based on data concerning buildings under construction orscheduled for completion by mid 1982.Economic and construction information was obtained from contractors,utilities, and interviews with Borough and State officials.,aaaaaResidential Sector Plans: Essentially all new housing was allelectric in 1981 with similar plans for 1982, according to thecontractors with firm starts in 1982. Roughly 800 housing unitswere identified for electric he~t durin[ 1982 and 1983 calendaryears. They include new construction, conversion to electric heat,or sale of condominiums with electric heat.Commercial Sector Plans: Commercial developments under constructionand planned for FY 1983 will use electric heat for 80 to 90 percentof the total floor space. Buildings include private offices rentalsfor the State offices, condominium offices, and shopping centeradditions. Over 6 million KWh of new requirement ~'Jere identifiedfor FY 1983--rough1y three times the increase of CY 1981.Government Sector Plans: City and Borough near term construction inFY 1982-83 will use electric heat except for the High School.Several Borough buildings are planned for conversion from oil heatto heat pumps, but plans were not specific enough for inclusion inthis study. Two new buildings developed commercially and rented tothe State will be in operation in FY 1982 and two more for FY 83.The Federal Building was to start using electric heat June 1982.The University of <strong>Alaska</strong> buildings unde~ construction and plannedfor the near future, are scheduled to be all electric heat.Over the long term, City and Borough and State no longer areconsidering converting most of their existing facilities to electricheat. This is a sharp contrast to 1980 plans and proposed bondingfor conversion and increased conservation through remodeling.......'
7oooState goyernment increased above the seven year average rate during1981. Funding appears adequate for FY 1983 at last years level withsimilar growth in numbers of employees forecast for the next twoyears, according to State officials.Federal government employment declined three percent in 1981 with asimilar outlook for 1982.Total government employment, including local government, was up4.9 percent December 21, 1981, over a year earlier.o With a favorable vote on the capital move t outlook is good forprivate hotels, and shopping centers, and Native Corporation landdevelopment, according to several sources with firm plans.oThe potential Juneau to Hoonah intertie could increase 1986 energyuse by 13 percent.o Noranda Mining Corporation indicates operation will begin in 1985with the first full year of production in 1986. Present plans callfor 300 employees with approximately 150 imported to Juneau with theother 150 hired and trained locally--almost all would live in Juneauand commute to the mine.
8EVALUATION OF BASIC DATAThis section evaluates the basic historic data with a view towardexplaining recent high growth and looks for trends that could affectfuture growth. All data shO\'/s very large growth in terms of percentageincrease and amount of use in FY 1982. Changes are substantially greaterthan previous years, and two factors were identified. First, and mostnotable, was residential electric heat increase. Second was steadyeconomic growth in both State government and commercial areas.Residential SectorA brief examination of October though April AEL&P residential energysales and number of customers for the past three seasons data presentedin the previous section illustrates part of these trends.Residential Sales increase by Class of customerOct-AprOct-AprClass of Customer 1981/1980 1982/19811981 as 1982 asGWH % of 1980 GWH % of 1981General -0.5 -97.3 --0:4 102.2General w/hot water 1.2 117.3 2.8 121.7All· e 1 ectri c 5.2 400.0 12.6 293.4Total 0:6 121.4 15.8 142.9,",Genera 1 Cl ass 7"--Sales remained fairly stable the past three years.--Number of customers declined nine percent between December 1979 andApril 1982, primarily by converting to other classes of service.--Use per customer has increased.General with Hot Water Class--December 1979 through April 1982, 404 customers (26 percent increase)were added to AEL&P system.--Hot water customers use about twice as much energy as generalcustomers.--Forty percent of AEL&P customers are in the hot water and all electricclasses.All Electric Class--Almost all new homes built since 1979 are in the all electric orwater class with an estimated 90 percent or more being all electric.--For FY 1981 and 1982, eighty percent of the increase in October toApril AEL&P residential energy use occurred in the all electricc1ass--12.6 GWh of 15.8 GWh.--October-April winter energy use during the past three years increasedfrom 1.3 GWh (four percent of the residential use) to 19.1 GWh(36 percent of the residential use).
9--Number of AEL&P all electric customers used more energy than the 4,334general class customers October 1981 through April 1982--19.1 GWhcompared to 18.5 GWh.--Roughly 150 or 15 percent of all electric customers use heat pumps.Commercial and Government Sectors--Commercial and Government sales increased slower than residential sales(Table 2) until January 1982.--January through April 1982 commercial sales were up 3.5 GHh--more thanany annual increase in the past decade (Table 2). Only 10 percent ofthe increase was due to all electric customers.--Remodeling older commercial buildings during 1980-81 and more intenseenergy use in these completed buildings during January throughApril 1982 accounts for part of the increase.--Government customers in AEL&P area used 1.4 GWh more in January throughApril 1982 period than for a similar period in 1980 or 1981. This is60 percent of the amount used in the full calendar year 1980.GHEA data, although only 10 percent of the size of AEL&P, also showssimilar trends of large increases for fiscal year 1982 and the earlymonths of calendar year 1982.Residential <strong>Energy</strong> Use per CustomerResidential c~stomer use increased 2,160 KWh per customer between 1979and 1981, fora total of 30 percent, due primarily to the trend ofshifting away from oil and toward electric hot water and all electricheat. The following tabulation gives a more detailed breakdown of K~~hper customer by c1 ass of customer for 1980, 1981, and a K~vh use adjustedfor weather.Class of CustomerGeneralGeneral w/hot waterAll electricKWHCY 1980 CY 19815,98011 ,52023 2 900per Customer6,08012,12023,780May 1981 thruApril 19826,50012,90027,500The 1980 and 1981 data was calendar year data and include warmer thannormal winters. The May 1981 to April 1982 twelve months of data was themost recent data reflecting the highest electric heat use. This was alsoa period containing the normal number of degree days and could becons i dered an average year for weather. The May 1981 through April 1982data was assumed reasonable for estimating future demands. Use percustomer for each class \Alas calculated from AEL&P data and totaled for 12months. By calculating the use per customer each month, influence of thevarying number of customers was eliminated. Difference between 1980-81and 1982 data was significant, and quite ~vident from examination ofdegree days shown on Table 3.
10...l~eatherInfl uence on <strong>Energy</strong> and CapacityJuneau area power demands have always been sensitive to weather--highestpeaks and energy use during the coldest times. We expect addition ofspace heating to increase this sensitivity since energy requirements forheating are almost directly proportional to outside temperatures.Heating Degree DaysOctober-A~ri 1 October-AprilNet Generation Annual IncreaseFiscal Year degree days % of avg GWH GWH %1978 6,970 100 77.51979 7,279 105 86.61980 6,552 94 89.31981 6,044 87 102.01982 7,328 105 129.3Average 6,955On a monthly basis weather variations are much more pronounced.+9.1 +11+2.7 +3+12.7 +17.2+27.3 +26.8Fiscal19781979198019811982AvgHeating degree days/monthsNet Generation, GWHYear Dec Jan Feb Dec-Feb Total Dec Jan Feb Dec-Feb Total'"1,423 1,233 922 3,578 12.217 12.238 10.3981,134 1,370 1,505 4,009 12.178 15.244 14.6431,187 1,404 895 3,486 13.332 14.279 12.4691,333 843 899 3,075 17.072 15.681 14.2281,175 1,584 1,213 3,972 19.745 23.952 18.7581,167 1,334 1,040 3,62434.85342.065 "40.08046.98162.455.'On an annual basis, growth is high when a cold year follows a warm year,while growth is lower when a warm year follows a cold one. Similarrelationships are apparent on a monthly and ~easonal basis. For example,February 1979 was an unusually cold month with net generation 36 percenthigher than February 1978 which was much warmer. The next twoFebruari es--1980 and 1981--\'Iere also quite warm and had power demandsbelow the 1979 amount.On a seasonal basis, FY 1980 and 1981 loads reflected warmer than averageweather, particularly in the winter seasons. The winter of 1981-1982 wasmuch colder than the prior year (20 percent colder measured by degreedays). Power use for October 1981 to April 1982 was 26.7 percent abovethe prior year. This was by far the largest seasonal growth of record.
11There are similar relationship in area peak demands. The January 1982peak of 42 MW was 30 percent above the prior winter (December 198D peakof 32.2 r~W). Measured in degree days, January 1982 was 19 percent colder·than December 1980. This relationship would probably be more clear onthe basis of daily records.Figure 1 presents an estimate of the impa~t of weather on seasonal loads.The data represents October to April periods for the fiscal years 1978 to1982. A "weather adjustment" was added to actual load when the seasonwas warmer than normal, or subtracted if the season was cooler. Theresults were estimated loads which would have occurred if averagetemperatures prevailed in each of the five years.These data suggest that the 1980 and 1981 loads would have been3.2 percent and 6.6 percent higher, respectively, if "normal" weather hadoccurred -in those years. They also suggest that growth rates in the 16to 18 percent range would have occurred in 1981 and 1982 if normalweather had occurred--up from growth rates of around nine percent for theprevious two years.
12FIGURE 1.October-April Net Generation Adjusted for Weather1301"~~ 110-~1-0 120-t::l 100co..-I~ 901-0QJCQJt::l 80~.uZo Actua1~ With Temperature Adjustment70 ~------------------~--------~--------~--1978 1979 1980 1981 . 1982Fiscal YearCalculationsNet generation adjusted based on degree days.Adjustment = i(Average degree-da~sAverageminus actua 1 )Oct-AprDegree Da~s Net Generation-GWH AnnualFY Act Avg Avg-Act Adj Act Adj Adj load GWH1978 6,970 6,955 - 15 -.001 77.5 77.51979 7,279 -324 -.0233 86.6 -2.0 84.61980 6,552 +443 +.0319 89.3 +2.8 92.11981 6,044 +911 +.0656 102.0 +6.7 108.71982 7,328 -373 -.0267 129.3 -3.5 125.8+7.1+7.5+16.6+17.1Increase%+9.2+8.8+18.0+15.8These evaluation of data become the basis for verifying the forecast inthe next section.
13ESTIMATE OF FUTURE DEMANDSEstimates of future demands were made for a basic case and a capital movecase. T ...,o variations of the basic case were examined. First, the loadsof the Juneau to Hoonah transmission intertie were added to show theeffect of this increased load. Second, electric heat loads wererestricted after FY 1983 to reduce the anticipated deficit fromhydropower. Emphasis was placed on near future trends. All cases assumecontinued use of significant electric heat for residential consumers(except for the restricted electric heat analysis), conservation, and adecrease in longer term conversion of government buildings te electricheat. The same methods of calculation and assumptions on use percustomer were used in all cases.The data for this 1982 Juneau area load forecast update has twosignificant items affecting the forecast.1. A dramatic incr~ase in residential electric heat for a- normalFY 1982 winter which followed two warmer winters, and a generalincrease in the area economy.2. A de-emphasis by the Borough and State on converting existingbuildings to electric heat.MethodMethod of estimating future use was changed this year. Previousestimates for-residential use were based on number of customers and theaverage use per customer. Commercial and government loads were estimatedas a percent of residential use, which historically was consistent. Withthe higher proportion of residential customers using electric heat in1981 and 1982, the previous method needed refining. This year estimateswere separated by class of residential service into general, general withhot water, and all electric. The total use was calculated by multiplyingthe average use per customer for each class by the number of estimatedcustomers in each class. A check indicates the results weresatisfactory.For commercial and government loads, electric heat was estimatedseparately. This may become a tool to refine the estimate of the overallsystem plant factor for determining near-term peak demand moreaccurately. Commercial and government increases could not be estimatedas a percent of residential due to the increased disproportionately highresidential electric heat use in 1981. Continuation of trends based onpast percentages was used with additions of specific large projects andspecific electric heat loads. Table 2 shows the percent change in theresidential sector.AssumptionsThe FY 1982 estimated loads for the basic case were based on sales andnet generation data for seven months extended to 12 months, assuming thatOctober-April constitutes 61.6 percent of 12 months use based on thethree-year average distribution of energy use for 1979-81.
14For 1983 and after 7 estimates were based on these assumption outlined inthe following paragraphs.Basic Load Growth CasePopulation and Customers Growth:1982-19861986-2000Population per residentialSystem Load FactorThis is lower thanelectric heat.Residential SectorAnnua 1 Growthcontinue at 4%2%customer' 2.655%previous years due to increase inGeneral Class: Number of customers decrease at two percent per yearthrough 1995, then remain constant. Use per clJstomer increases attwo percent per year through 1986 7 then decreases two percent peryear to 1995, remaining constant after 1995. 'The compensatingincrease in use and decrease in customers would show no significantchange in the 1982 level of use through 1986.General 'with Hot Water Class: Continued increased amounts to 10percent of new homes and two-thirds of the general class customersconverting. Use per customer to remain at 12,900 KWh annually basedon AEL&Pdata adjusted for 1982 experience and the weather.All Electric Class: Ninety percent of all new customers andone-third of general customers converting would use the all electricclass would be all electric. Use per customer would be 27,500 KWhbased on AEL&P data adjusted for 1982 experience and \'leather.Commercial SectorFY 1983 loads would increase 16 percent over FY 1982 based onidentified loads of 6.7 million KWh. For 1984 and beyond, 1 millionKWh for lights and 2 million KWh for heat was estimated based onlong term trends. This annual increase is similar to the increaseestimated in previous years when commercial use was a consistentpercent of residential use.Government SectorPast· estimated increases of 1.9 million KWh per year would continue'the same as when use was based on a percent of residential use.Specific additional electric heat use is noted where it isidentifiable. Specific Borough, school, University and Stateelectric heat conversion plans not actively being considered in 1982were eliminated from estimates of future years loads. The Federalbuilding is scheduled to being use of electric heat the latter partof FY 1982.,>t,~'..
15Calculations and results of the basic case future demand estimateare presented in Table 4.Basic Load Growth Case with Restricted Electric HeatoooElectric heat would be restricted by eliminating any newhookups after September 30, 1983. This includes all-electricand electric hot-water hookups.All new residential customers would be placed in the generalclass after September 30, 1983.Other assumptions on number of new residential customers,commercial use, government use and continued conservation werethe same as for the basic case.Basic Load Growth Case with Juneau-Hoonah IntertieoCapital Move CaseThe Juneau-Hoonah intertie would be completed in 1986 adding9.8 MW and about 36 million KWh additional load.The projected move was estimated in this study to start in 1988 insteadof 1985, as set out in the previous 1980 and 1981 Juneau area electricload estimates. Information is based on background study ofsocia-economic impacts on the Juneau area prepared by Rivkin Associates,Ma rch 1978.;~'o Population would increase only one percent per year through 1985,remain stable through 1988, and then decrease 30 percent by 1990.From the low level in 1990 it would increase two percent annuallythrough the year 2000. (These assumptions are similar to the 1980and 1981 study based on the Rivkin capital move study).aAssumptions on electric heat use was at the same pace as the basiccase, except half of the use by government was assumed after themove.
Table 4.Basic Case Estimate of future DemandsFiscal Year ~ 1982 -12!!L ~ ~ 1986 ~ 1988 1989 1990 ~ 20007 010 12 010Popu 1 a t ion 20,085 21,125 22,170 23,060 24,000 24,930 25,430 25,950 26,470 26,990 29,800 32 ,890People per Customer 2.6 2.6 2.6 2.6 2.6 2.6 2.6 2.6 2.6 2.6 2.6 2.6Residential Customers 7,725(fY) +400(e) 8,125 8,525 8,870 9,230 9,590 9,780 9,980 10,180 10,380 11 ,460 12,650(Average)Residential SalesGeneral Class, No. Customers 5,165 4,900(~) 4,800 4,700 ;;4,600 4,500 4,410 4,320 4,230 4,140 3,750 3,750KWH/Customer 6,074 6,920 ~6,890 6,750 6,620 6,480 5,870 5,870KIm, .111li on 31.4 20.9 33.9 34.0 ~ 34.0 jJ 34.0 jJ 34.0 ~ 30.4 29.2 28.0 26.8 22.0 22.0Hot Water Class, No.Customers 2,040 2,125 ~ 2,235 2,340 2,445 2,550 2,630 2,710 2,790 ~,870 3,020 3,140KWH/Customer 12,000 13,600 /12,900 12,900 12,900 12,900 12,900 12,900KWH, Nfll i on 24.5 17 .8 28.9 - . 30.3 §j 31.7 Y 33.1 §j 34.5 §.J 33.9 35.0 36.0 37.0 39.0 . 40.5All Electric Class, No.Customers 520 1,100 1,490 1,830 2,185 2,540 2,740 2,750 3,160 3,370 4,690 5,760KWH/Customer 23,800 27,800 Y 27,500 27.500 27,500 27,590 27,500 27,500 27,500 27,500 ' 27,500 27,500KWH, Hillion 12.4 21.5 30.5 4 •• 0 50.3 60.0 69.9 75.4 75.6 86.9 92.7 129.0 158.4Subtotal Residential,K~IH, MOli on 68.4 60.2 93.3 y 105.3 !Hi.O 127.1 138.4 139.7 139.8 150.9 156.5 190.0 220.9Commercial Sales (historic 30%)Subtotal CommerCial,KWH, Million 39.7 27.5 44.6 y 51.6 56.6 62.0 65.0 68.0 71.0 74.0 77.0 92.0. 107.0Government Sales (historic 26%)Subtotal Government, GWH 34.9 22.4 36.4 Y 44.6 47.0 48.9 58.9 60.8 62.7 64.6 72.9 82.4 102.0Street Lighting, Residential& Goverment, GWH 1.1 1.2 1.2 1.2 1.2 1.3 1.3 1.3 1.4 1.5Total Sales, GWH 142.5 110.4 174.31/ 202.6 220.8 239.2 263.5 269.7 274.8 290.8 307.7 365.8 431.4Net Generation, GWH(115% of Sales) 166.7 128.8 205.0 11 233.0 254.0 275.0 303.0 310.0 316.0 334.0 354.0 420.0 496.0System Capacity Factor % 59.0 55.7 55.0 55.0 55.0 55.0 55.0 55.0 55.0 55.0 55.0 55.0Peak Demand, ~n~ 32.2 42.0 42.0 48.0 53.0 57.0 63.0 64.0 66.0 69.0 73.0 87.0 103.011 Based on October to April sales being 61.6 % of annual. Electric Heat reduced 4.4 GWH forother 5 month summer sales.y Based on 7 month AEl&P sales plus 80% of spring use for 5 months(2.05 GWH) plus times 10percent for GHEA. G~IH=21.5+(5x2.05) 80Xx1.1=30.5.11 Based on 7 month generation being 61.6% of annual generation less 4.4 GWH for decreasedsummer electric heat use.1/ General class customers total use assumed to remain the same through 1986 by increase in uscper customer and decreased customers.5/ Hot ~/ater customers estimated to increase 105 customers and 1.4 GWH per year through 1986.:[/ Approximate use per customer.I-'0\,~'¥:,~ 1• , ,~I:..,'tA 7/B2"~
17,/RESULTS AND CONCLUSIONS\ The Juneau area experienced very rapid increases in electric power use inthe past 2 years (since 1980). The January 1982 peak demand of 42 t·1W \'/as30.4 percent above the previous winter. Estimated FY 1982 net generationof 205 million kWh would be 23 percent over FY 1981 amounts. Increasesfor the FY 1981 over FY 1980 amounts were 22.9 percent for peak capacityand 16.5 percent for net generation.The power use data reflect continued strong area economic growth as wellas significant shifts towards use of electricity for water and spaceheating. Part of the increases in 1982 were due to normal weatherconditions. Power demands during the previous two winters wererelatively low due to milder than normal weather conditions.A base case forecast ;s presented in Table 5 and Figure 2. It isestimated that growth rates in energy demand will be 13.7 percent in1983, nine percent in 1984, and 8.3 percent in 1985. The period 1986 to2000 will average 3.6 percent. If electric heat was restricted for allnew construction in FY 1984, the loads would be 15 percent less than thebasic case by 1986 and 23 percent by 1990. If the loads associated witha Juneau/Hoonah intertie are added, an overall increase in energy demandof 13 percent would result in 1986.A separate forecast was made for the capital move case, based onparameters similar to the 1980 and 1981 .estimates except that themove date was revised from 1985 to 1988. Results are that Juneau loadswould increase:;, to a higher level before they drop .. (See Figure 2.)A comparison of Juneau area hydropower resources and forecasted demandsshows that under critical year water supply conditions a hydropowergeneration deficit could occu~ as early as FY 1983 (Table 6). Underaverage conditions the deficit may not occur until FY 1984. Weatherconditions could aggravate or modify the timing of the deficit possiblyone year, however, FY 1985 load estimates appear more certain to be shortof hydropower. The firm energy deficit rises to 93 GWh in 1986, or about30 percent of the area load. In 1987 100 GWh of the Crater Lake 105 GWhfirm energy would be used the first year of full operation. If theJuneau to Hoonah transmission intertie were constructed in 1986,hydropower deficits would increase by roughly 31 GWh.For the basic case with restricted electric heat, critical year watersupply conditions would still produce a deficit in 1983. Under. averageconditions the deficit would be delayed until 1986.The conc·lusions that the Crater Lake addition will be needed by or beforemid-1986, are still valid.Analysis of trends in Juneau load growths for 1981 and 1982 as presentedpreviously, would indicate 16 to 18 percent annual growth. If this trend
18Jli~'TABLE 5.Juneau Area Power RequirementsBasic CaseBasic w/RestrictedFiscal Year Case Electric HeatBasic Case w/Juneau/Hoonah 2/ CapitalIntertie - Move Case1981 GWH 166.7MW 32.21982 GWH 11 205 205MW 42 421983 GWH 233 233MW 48 481984 GWH 254 244~lW 53 511985 GWH 275 249MW 57 521986 G~m 303 259r~w 63 54".1990 GWH 354 274MW 73 571995 GWH 420 294MW 87 612000 GWH 496 318MW 103 66i0542233482354924250343 24470 51390 17780 37452 19494 40528 212110 44II'"'"f·..1/ Based on 7 months data.2/ Intertie assumed in 1986.APA 7/82
600·FIGURE 2. Juneau Area Lond StudyEstimated <strong>Energy</strong> Requirements1982 Update500I,400200-- .---.- ...- .--10 .."..,."..Growth at 17% per year~~'Base Case 1982.-. ~./...-- /~I~..~,~~Medium Case 1981 Estimate ••.•. .. . .•/ .....••••• • •• '~Basic Case 1982.. '-:')(->
20TABLE 6.Comparison of Junea Area Hydro Resourcesand Estimated LoadsSnettisham Long LakeAEL&P HydroResourceAnnualFirm168422IIT<strong>Energy</strong> GWHAverage21148259.'Estimated Loads & DeficitFY19831984198519861987BasicEstimatedLoads-GWH233254275303310CaseDeficit-GWHFirm Average-23 +26-44 + 5-65 -16-93 -44-100 -51RestrictedEstimatedLoads-GWH233244249259263Basic Case withElectric HeatOeficit-GWHFirm Average-23 +26-34 +15-39 +10-49 O'-53 - 4.'APA 7/82
21were to continue at 17 percent rather than the conservative componentmethod of analysis presented in the above cases, system generation needsfor the next few years could be:~hMW198220542198324049. 198428057198532066These figures may be compared to those in Table 5.1986APA will continue assessing energy use and changing economic and heatingconditions in support of the decision to proceed with Crater LakeConstruction. Reservoir operation and load management studies incooperation with local utilities appear essential to minimize costs tothe consumer in the interim before Crater Lake comes on line.Detailed supporting data and analysis are available in APA'soffice.37076
EXHIBIT 11JUNEAU AREA POviER r'1ARKET ANAL YS I SPARTIAL UPDATE OF LOAD FORECASTNOVEMBER 1982ALASKA pm~ERADMINISTRATION
<strong>Alaska</strong> Power AdministrationPartial Update of July_1982 Juneau Load ForecastNovember 1982Introduction<strong>Alaska</strong> Power Administration (APA) has compared the actual Juneau areapower requirements through the end of fiscal year 1982 (September 30, 1982)with projections made in July 1982. The earlier projections were basedon data through April 1982 and this comparison reflects any changes dueto a differing growth pattern than originally forecast for the remainderof the fiscal year.Basic <strong>Data</strong>The basic data and assumptions used previously were essentia1ly the samefor this study with minor changes in the distribution among user c1assesmade to reflect actual conditions.The projections for the base case and the case with electric heat-restrictionsat the end of FY 1983 were updated and new projections were alsomade for a case involving electric heat restrictions at the end ofcalendar year 1982.Results and ConclusionsTable 1 presents annual system net generation and peak demand forfiscal years 1970 through 1982 along with annual percent increases. Theonly elements differing from the July 1982 study are the net generationand percent increase for 1982. The actual net generation for 1982 was202,900 MWh for an increase of 21.7 percent. The earlier study hadforecast only slightly higher figures--205,000 MWh and a 23 percentincrease.Table 2 presents the estimates of future demand for the base case.Compared to the earlier projections the actual totals for FY82 were:o higher for total residential customers (2%)o higher for general class (8%)o lower for hot water class (9%)o lower for all electric class (5%)o total residential use slightly lower (3%)o commercial use slightly higher (5%)The residential sector was expected to have fewer general class customersthan the previous year due to customers switching from general class tohot water class. This apparently did not happen as there were actuallymore general class customers than the previous year. Slight adjustmentswere thus made to reflect this in future years. The total sales and netgeneration were also adjusted for future years to reflect slightly lowerfigures for FY82 than expected. This resulted in somewhat lower totalloads in the forecast.
Ill"Table 1. ~uneau Area <strong>Energy</strong> and Peak DemandI"SystemNet MWH i. Peak MW :~ '"Generation Annual Demand AnnualFiscal Year MWH* IncT'ease Mw IncT'ease----------- ---------- ---------- ------- ---------- '",1970 58,266 12.49. 5 ,11. 31971 63,786 13.810. 1 8. 01972 70,255 14.97. 8 4. 01973 75,753 15.59.6 4. 5I!"1974 83,059 16.213.9 9.91975 94,609 17.8.'12.4 11. 2 fII"1976 106,296 19.81977 112,1975. 6 3. 020.413.0 14. 7...1978 126,800 23.49. 5 -1. 31979 138,900 23. 1 (R) '"4. 5 13. 4 ~,1980 145,200 26.214.8 22.9 ..1981 166,700 32.221. 7 30. 41982 202,900 42.0 f''",*Includes AEL8cP and GHEA sales and losses.!ft.(R) Revised -From previously published data.APA 11/82 ..
Table 2. Estimate of Futu~e DemandsBase CalieFiscal Veal' 1981 1982 1983 1984 1985 1986 1987 1988 1989 1990 1995 2000C::;=8c:_=c:;:;=n:=_ _;:c:=... c:c===a U'c:a==G. #:ICIIUI;C:===- C ..::II::;:. ==u;;a;;:; •• cz=_= •• r:t=ls;;: •• *;U:&:1:1" =_ ..._==== a:====a ===;a;c:_Population 20.085 21. 49~ 22.35' 23.250 24.180 25.146 25.650 26.160 26.685 27.220 30.050 33. 180People per Customer 2.6 2.6 2.6 2.6 2.6 2.6 2.6 2.6 2.6 2.6 2.6 2.6Residential Customers 7.725 8.267 8.600 8.940 : ~9.300 9.670 9.865 10.060 10.260 10.470 11.560 12.160(Average)Residential Sale.General Class. Customers 5.165 5.289 5.160 4.980 4.880 4.860 4.730 4.790 4.545 4.505 4.055 4.065KWH/Customer 6.074 7.052 7.083 6.890 6.890 6.890 6.890 6.750 6.620 6.480 5:870 5.870KWH. Mill ion 31. 4 37.3 36.6 34.3 33.6 33. 5 32.6 32.3 30. 1 29.2 23.8 23.9Hot Water Clasli.Customers 2.040 1.935 1.980 2.085 2, 190 2.295 2.375 2.455 2.535 2.615 2.765 2.885KWH/Customer 12.000 13.100 12,900 12.900 12,900 12.900 12.900 12.900 12.900 12.900 12,900 12.900KWH. Mil lion 24.5 25.3 25.5 26.9 28.3 29.6 30.6 31. 7 32.7 33.7 35. 7 37.2All Electric Class.Customers 520 1.043 1.460 1.875 2.230 2.515 2.760 2.815 3, 180 3.350 4,740 5.810KWH/Culitomer 23.800 26.700 27.500 27, 500 27,500 27.500 27.500 27.500 27.500 27.500 27.500 27. 500KWH, Million 12.4 27.8 40.2 51'.6 61. 3 69.2 75.9 77.4 87.5 92. 1 130.4 159.8Subtotal Residential.KWH. Mi 11 ion 68.4 90.5 102.2 112.8 123.2 132.3 139. 1 141. 4 150.2 155.,1 189.8 220.9Commercial Sale. Chhtoric (307.)Subtotal C ommerc ia I.KWH. Million 39.7 46. 7 53. 7 59.0 64.0 69.0 71. 0 74.0 77.0 80.0 95.0 110.0Government Sales (hhto~ic (267.)Subtotal Govt .• GWH 34.9 37. 1 44.6 47.0 48.9 58.9 60.8 62.7 64.6 72.9 82.4 102.0Street Lighting.Residential8c GoveT'nment. GWH 1.1 1.2 1.2 1.2 1.2 1.3 1.'3 1.3 1.4 1.5Total Sal eSt GWH 142. 5 174.2 201. 6 220.0 237.3 261. 4 272. 1 279.4 293. 1 309.3 368.6 434.4Ne t Genera ti on. GWH(1157. of Saleli) 166. 7 202.9 231. 9 253.0 272.9 300.6 312.9 321. 3 337. 1 355.6 423.-9 499.5SI/stem Cap. Factor 7. 59.0 55.0 55.0 55.0 55.0 55.0 55.0 55.0 55.0 55.0 55.0 55.0Peak Demand. MW 32.2 42.0 48. 1 52.5 56.6 62.4 65.0 66.7 70.0 73.8 88.0 103. 7(Revised) APA 11/82
•Table 3 and 4 present the estimates of future demand if electric heat-including hot water--is restricted at the start of calendar year 1983and fiscal year 1984 respectively. Restricting'electric heat at theearlier date would result in about 8 percent lower net generation in1985 and 16 percent lower in 1990. Restrictions at the later-date wouldresult in 5 percent lower in 1985 and 14 percent lower in 1990 comparedto the base case. Table 5 summarizes the net generation and peak demandfor the three cases.Table 6 compares the hydro resources and estimated loads for the Juneauarea under the three cases. The firm energy figure for Snettisham ishigher than used in previous studies. Original power studies by theCorps had indicated 168 GWh of firm energy while the latest studiesassociated with the design of Crater Lake show 179 GWh of firm energy_Both these figures are theoretical and actual firm energy will have tobe proven through operation of the project. All cases indicate anenergy def·icit of firm energy while only the base case experiencesdeficits of average energy in a few years. Restricting electric spaceand hot water heating in January versus October of 1983 would result inslightly lower deficits of firm energy.
Table 4. estimate of Future DemandsElec tric Heat Rutricted 10/83Fiscal Veal' 1981 1982 1983 1984 1985 1986 1987 1988 1989 1990 1995 2000===-==_=a=::;:;a=_ ':===1;= a:a==aul' a===== ===:a;aa a:; &;:n:::;;;c:= ~=;;::u:;r;;;c J;;Qa:::::;iiu:::aa:==:===_c:;;:;;u.:o:ag A=C=_= =====curol a==;:;;:;:.;n::lIPopulation 20.085 21.495 22.355 23.250 24. 180 25. 146 25.650 26.160 26.685 27.220 30.050 33,180People per Customer 2.6 2.6 2.6 2.6 2.6 2.6 2.6 2.6 2.6 2.6 2. 6 2.6Residential Customers 7,725 8,267 8,600 8.940 '. 9,300 9.670 9,865 10,060 10,260 10.470 11,560 12.760(Aver.age)Residential SalellGeneral Class.Culltomers 5.165 5.289 5, 160 5, 185 5,545 5.915 6.110 6,305 6.505 6.715 7.805 9.005KWH/Cu5tomer 6.074 7.052 7.083 6.760 6.900 7.040 6.900 6,760 6,630 6.500 5,890 5.890KWH. Million 31.4 37.3 36.6 35.1 38.3 41. 6 42.2 42.6 43. 1 43.6 46.0 53. 0Hot Water Class. 11Customers 2.040 1.935 1.980 2.055 2,055 2.055 2.055 2,055 2.055 2.055 2.055 2.055Kl-lH/Customer 12.000 13. 100 12,900 12.900 12.900 12.900 12.900 12.900 12.900 12.900 12,900 12.900Kl-lH. Mi 11 ion 24.5 25.3 25.5 26.5 26.5 26. 5 26.5 26.5 26.5 26.5 26.5 26. 5All Electric Class.Customers 520 1.043 1.460 1.700 1.700 1.700 1.700 1,700 1,700 1,700 1,700 1.700KWH/Customer 23.800 26.700 27,500 27.:;00 27,500 27,500 27.500 27,500 27,500 27.500 27.500 27,500KWH. Million 12.4 27.8 40.2 46:8 46.8 46.8 46.8 46.8 46.8 46.8 46.8 46.8Subtotal Residential.Kl-lH,Million 68.4 90.5 102.2 108.3 111.5 114.9 115.4 115.9 116.4 116.9 119.2 126.3Commerc hI Saleli (historic (301.)Subtotal Commercial.KWH,Million 39.7 46.7 51. 6 53.6 56.2 57.0 58.0 59.0 60.0 61. 0 66.0 71.0Government Sales (h htoric (261.)Subtotal Govt. , GWH 34.9 37. 1 44.6 46. 5 46.4 51. 1 53.0 54.9 55.8 57.8 67.3 76.8Street Lighting.ResidentlalIt Government. GWH 1.1 1.2 1.2 1.2 1.2 1.3 1.3 1.3 1.4 1.5Total Sale5, GWH 142.5 174.2 199.5 209.6 215.3 224.2 227.6 231. 1 233.5 237.0 253.9 275.6Net Generation. GWH(1151. of Sales) 166.7 202.9 229.5 241. 1 247.6 257.8 261.8 265.7 268. 5 272.6 292.0 316.9SI/stem Cap. Factor X 59.0 55.0 55.0 55.0 55.0 55.0 55.0 55.0 55.0 55.0 55.0 55.0Peak Demand. MW 32.2 42.0 47.6 50.0 51. 4 53.5 54.3 55.2 55. 7 56.6 60.6 65.8.,', . ..... '1/ Hot Water Cla51i included in restriction.APA 11/82
Table 3.Estimate 0' Future DemandsElectric Heat Restricted 1/83Fiscal Veal' 1981 1982 1983 1984 1985 1986 1987 1988 1989 1990 1995 2000_==._=:r:==:::::a =::: • .:::;: •• ua:::u:=uiiI c=====- -=====!=8 =sa:c:n::UII c:c:r===z; a:;=;&Aa:a:a =&:::.a:r •• ==ccrag =_U::I:=:_====== =====aPopulation 20,085 21. 495 22,355 23,250 24,180 25, 146 25,650 26, 160 26,685 27,220 30,050 33, 180People per Customer 2.6 2.6 2.6 2.6 2.6 2.6 2.6 2.6 2.6 2.6 2.6 2.6Residential Customers 7,725 8,267 8.600 8.940 9.300 9.670 9.865 10.060 10.260 10.470 11.560 12,760(Average)Residential SalesGeneral Clas'i.Customers 5,165 5,289 5.220 5,560 5.920 6.290 6,485 6,680 6,880 7.090 8. 180 9,380KWH/Customer 6,074 7.052 7,083 6,760 6.900 7,040 6,900 6.760 6.630 6.500 5.890 5.890KWH. Mi 11 ion 31. 4 37.3 37.0 37.6 40.8 44.3 44.7 45.2 45.6 46. 1 48.2 55.2Hot Water Class, 1/Customers 2,040 1,935 1,980 1.980 1,980 1,980 1.980 1.980 1.980 1.980 1.980 1.980KWH/Customer 12.000 13.100 12.900 12.900 12.900 12.900 12.900 12,900 12,900 12.900 12,900 12.900KWH. Million 24.5 20.3 25.5 25.5 25.5 25.5 25.5 25.5 25. 5 25.5 25. 5 25.5All Ehc tric Class.Customers 520 1.043 1.400 21 1,400 1.400 1. 400 1.400 1,400 1,400 1.400 1,400 1.400KWH/Customer 23.800 26.700 27.500 27.500 27,500 27.500 27.500 27,500 27,500 27,500 27,500 27,500KWH. Million 12.4 27.8 38.5 • 38. 5 38.5 38.5 38.5 38.5 38.5 38. 5 38.5 38.5Subtotal Residential.KWH,Million 68.4 90.5 101. 0 101. 6 104.9 108.3 108.8 109.2 109. 7 110. 1 112.2 119.3Commercial Salel (historic (307.)Subtotal Commercial.KWH, MUH on 39.7 46.7 51.6 53.6 56.2 57.0 58.0 59.0 60.0 61. 0 66.0 71. 0Government Sales (hhtoric (267.)Subtotal Govt .• GWH 34.9 37. 1 44.6 46.5 46.4 51. 1 53.0 54.9 55.8 57.8 67.3 76.8.\" .....Street Lighting.Residential" Government. GWH 1.1 1.2 1.2 1.2 1.2 1.3 1.3 1.3 1.4 1.5Total Sales. GWH 142. 5 174.2 198.3 202.9 208. 7 217.6 221. 0 224.4 226.8 230.2 246.9 268.6Net Generation. GWH(1157. of Sales) 166.7 202.9 228. 1 233.4 240.0 250.3 254. 1 258. 1 260.8 264.8 284.0 308.9System Cap. Factor 7. 59.0 55.0 55.0 55.0 55.0 55.0 55.0 55.0 55.0 55.0 55.0 55.0Peak Demand. MW 32.2 42.0 47.3 48.4 '49.8 51. 9 52. 7 53.6 54. 1 55.0 58.9 64. 11/ Hot Water Clas. included in restriction.2/ Total all electric customers on 9/30/82 ",as 1.303. APA 11/82"
Table 5. ~uneau Area Power RequirementsElectric HeatElectric HeatBasic Restricted RestrictedFiscal Year Case 1/83 10/83----------- ------- -------------- --------------1981 GWH 166. 7MW 32.21982 GWH 202.9 202.9 202. 9MW 42.0 42.0 42.01983 GWH 232 228 230MW 48 47 481984 GWH 253 233 241MW 52 48 501985 GWH 273 240 248MW 57 50 511986 GWH 301 250 258MW 62 52 54'1990 GWH 356 265 273. MW 74 55 571995 GWH 424 284 292MW 88 59 612000 GWH 500 309 317MW 104 64 66(Revised) APA 11/82
Table 6.Comparison of Juneau Area Hydro Resourcesand Estimated LoadsResourceAnnual <strong>Energy</strong> GWHFirm AverageSnettisham Long LakeAEL8
EXHIBIT 12JUNEAU AREA POWER MARKET ANALYSISUPDATE OF LOAD FORECASTSEPTEMBER 1983-ALASKA POWER ADMINISTRATION
..,~-" ;... .~"\:~~.;}( September 16, 1983Colonel Neil Saling<strong>Alaska</strong> District EngineerCorps of EngineersP.O. Box 7002Anchorage, <strong>Alaska</strong> 99510Dear Colonel Saling:We are enclosing our latest update of load forecasts for the Juneauarea. This study incorporates actual power use data through June 1983and projects requirements through the year 2000.We are estimating FY 1983 net generation of 228 million kwh, or12.4% above the previous year. A relatively mild winter plus curtailmentof interruptable customers both helped to hold down the sizeof the increase.We estimate the 1983 growth would have been approximately 15 percentif "normal" weather had occurred.Our future estimates include both "low" and "high" ranges, plus a"moratorium" case which assumes no new users of electricity forspace and water heating after January 1, 1984. The results showprojected requirements of from 274 to 395 million kilowatt hoursper year by 1990 and 317 to 492 million kwh/year by 2000.The estimates of future demands incorporate much smaller rates ofincrease than the area has experienced in recent years. For example,our high case shows a 1984 increase of 10.5% followed by 7.9% in1985 and 6.4% in 1986. For the 1983-2000 period, the "high" casehas average growths of 4.6%, the low case 3.2%, and the "moratorium"case 2%. Given the current and projected strength of the area economy,our estimates of future requirements may be too low.The area experienced a hydro deficit in the 1982-1983 winter, as hadbeen predicted in previous studies, requiring use of the oil-firedgenerators to supplement the hydro supply. The deficit is expectedto increase each year until the Crater Lake unit of Snettisham Projectis completed. If Crater Lake is available in early 1987, we estimatean immediate market of from 40 to 75 percent of the Crater Lake firmenergy.
2We believe the new studies reaffirm the need to proceed as quickly aspossible with completion of the Crater Lake Unit.EnclosureSincerely,Q ,/J/~/~s/C0/~~Robert J. CrossAdministrator
JUNEAU AREA POWER MARKET ANALYSISUPDATE OF LOAD FORECASTSEPTEMBER 1983<strong>Alaska</strong> Power AdministrationU.S. Department of <strong>Energy</strong>
CONTENTSINTRODUCTION. . . . . . . . . . . . . . . . . . . . . . . . . . . . . . . . . . . . . . . . . . . . . . . . . . . . . 1BASIC DATA....................................................... 1EVALUATION OF BASIC DATA....... . . . . . . . . . . . . . . . . . . . . . . . . . . . . . . . . . . 7Residential Sector................................... . . . . . . . . 7Commercial and Gov~rnment Sector......... ........ .... .... .... 7Residential <strong>Energy</strong> Use pel" Customer.... ... ..... ...... ........ 8Weather Influence on <strong>Energy</strong> Use...................... . . . . . . . . 8ESTIMATE OF FUTURE DEMANDS ....................................... 13RESULTS AND CONCLUSIONS .......................................... 18PageTABLES1. Juneau Area Net Gene~ation and Peak Demand........ ... ........ 22. Juneau Area <strong>Energy</strong> Sales and Percent Or Sales by Sector.. .... 33. ,Juneau Airport Heating' Degree Days................... . . . . . . . . 54. Juneau Area Recent Electric Trends .. _. . . . . . . .. . . . . . . . . . . . . . . . . 95. Juneau Net Generation AdJusted ror .We;'ather............ '" . . . .116. Estimat~ of Future Demands, Electric Heat Moratorium 1/84 .... 157. Estimate Or Future Demands,_ No Moratorium - Low Growth..... . . 168. Estimate of Future Demands, No 'Moratorium - High Growth ...... 179. Comparison of Juneau Area Power Requirements ................. 1910. Comparison of Juneau Area Hydro Resourcesand Estimated Loads........................................ 21FIGURES1. Weather AdJusted Net Generation.... . . . . . . . . . . . . . . . . . . . . . . . . . . 122. Estimated <strong>Energy</strong> Requirements ................................ 20
INTRODUCTION<strong>Alaska</strong> Power Administration (APA) estimated Juneau area power requirementsthrough the year 2000 for this study, which updates similar studiescompleted annually for the past several years. The area has experienced asignificant increase in peak demand and energy use since 1980 and theprevious studies indicated area power use would exceed critical yearfirm energy from existing hydroelectric plants during fiscal year 1983.This past spring local utilities were required to furnish over 5 millionkwh of diesel generated electricity to supplement that available fromthe hydro plants. The need for this diesel generation will generallyincrease each spring as area reservoirs are drawn down until additionalhydro energy is available from Crater Lake.BASIC DATAThe basic data and assumptions used previously were essentially the samefor this study and included data on energy use, economic, and climaticconditions. <strong>Energy</strong> and capacity use data came from monthly and annualreports prepared by APA and the two local utilities, climatic data fromthe National Oceanic and Atmosphere Administration (NOAA), and economicdata from State and local sources.Table 1 presents annual system net generation and peak demand for fiscalyear 1970 through June 1983 along with annual percent increase. A fewsignificant points can be made about this table. (1) The dramaticincrease in 1982 is partially attributable to the cold weather duringthat winter; (2) the lower annual increase in 1983 is due to a combinationof the cold winter in 1982 and the mild \'/irrter in 1983; (3) the lowerpeak in 1983 occurred for the same re~sons; (4) the 1983 energy use wouldhave been about 3 million kwh higher if the interruptible class customershad not been shut off in the spring.Table 2 presents sales by residential, commercial, and government sectorfor the 1970-1982 calendar year period. Residential customer use continuesto increase the most with 1982 sales accounting for 52 percent of thetotal sales compared with the 13-year av~rage of 45 percent for thatsector. Commercial and government sectors have both decreased in thepercent of overall sales since 1979. Part of the reason for this stronggrowth in the residential sector is the trend to all-electric homes inthe area. An examination of recent residential sales in the AEL&Pservice area is shown below.AEL&P October through Aeril Sales (million K\'/h)Class Residential Customer 1980 1981 1982 1983General 18.6 18.1 18.5 17.8General w/hot water 11. 0 12.9 15.7 15.7All Electric 1.3 6.5 19.1 24.0TOTAL 30.9 37.5 53.3 57.5This trend towards all-electric homes is further shown by the shift inthe number of AEL&P customers from the general class to the hot waterand all-electric classes.1
Table 1. ~UNEAUAREA NET GENERATION AND PEAK DEMAND'"StjstemNet MWH i. Peak MW i.Fiscal Year===========Generation Annual Demand AnnualMWH* Increase MW Increase========== ========== ========= ==========1970 58,2661971 63,7861972 70,2551973 75,7531974 83,0591975 94,6091976 106,2961977 112,1971978 122,2181979eo_133,4571980 143,1281981 166,7001982 202,9001993 (Oct-June) 174,7549.510. 17.89.613.912.45.68.99.2--e:7.216.521. 710.3**12.413.814.915.516.217.819.820.423.423. 126.232.241. 640. 111. 38.04.04. 59.911. 23.014.7-1. 313.422.929.2....."elI"e1993 228,000 ***12~440. 1-3.6,,>* Includes AEL&P and GHEA sales and losses.*'* Increase over same period in 1982.*** Estimate based on 9 months data.APA 8/83Junldl2
Tabh 2. ~UNEAU AREA ENERGY SALES AND PERCENT-OF 8ALE8 BY 8ECTOR (1,000 KWH)CALENDAR VEAR1970 1971 1972 1973 1974 1975 1976 1977 1978 1979 1980 1981 1982aa.a._ • .. _---- .... --- ._=8."' • •• ca:cc. _=Cn=aaaa -=._.-=- .. m._.=- _.a_=_. ••••R ... aClc=a._ •••• ==- .&1I:la=_=-Residential Sale.AELS.P 23.034 24,563 28.009 30,298 31,875 33,866 36, 175 38,702 42,143 45.815 51,939 64.387 83.813GHEA 2,315 2,580 3,027 3.18:5 3.545 3.794 4, 126 4.292 4.936 5,353 6.376 7.902 10.477""''''--~~'''''- "V""~"""""".... -."""''''''''''-..'V f\r"",,..,,,,,,,,,,,,,,,,Total 25.349 27.143 31.036 33.483 35.420 37,660 ·40.301 42.994 47.079 !S1, 168 58.315 72.289 94,290Percent 44 45 46 45 46 42 42 42 43 43 45 49 52~~.... "''''''''''''''''' "'fIV""fIV""~ "''''''V''''''''''''' "" ... "' ... ...,""..,. ""'''''''''''''''''''.,. """'''''''''''''I\t ",,,,"'''''''fiV''' "''''''''#V~'''4V ....... "'...,"'''W'''''''"'Average Percent 1970-82:45 XCommercial SalesAEL&'P 15.713 17.322 18, 511 22.039 21,367 25,614 27,018' 29.552 :]1,406 34,654 36,548 38.798 46,925GHEA 1.251 1.388 1,389 1,339 1.186 1,622 1.828 1,951 2.060 2,483 1,319 1,573 1.840"'''''''''''''''''''' ","'''''''''WI\;"", ""4\1"''''''''''''' "'v"\J"'''''''''''''' "'''''''~''''''Total 16.964 18,710 19,900 -23.378 22.553 27,236 28.846 31,503 33,466 37, 137 37,867 40,371 48.76~w Percent 30 31 :i!9 31 29 31 30 31 3i 31 29 27 27"""'''''''''''''''' "''''''''''''''''''V 4IV"''W'''''''''''' "'''''''f\t...,,,,,,, "'''''''''''''''''''' "'''''''''''''''''''''' "'''''''''''''''''4\1 "'''''''-.,'''''''''Average Pet-cent 1970-82:30 XQovernment 8ale.AELS.P 13.542 13,927 1:5,327 16,399 17,546 22,009 ,2~, 253 27,232 26,826 30,671 31,329 32,531 36,884GHEA 395 . 417 484 566 621 816 '.. •...'789 873 932 632 1,988 1,964 2,161OutdoorLights 782 741 734 695 705 995 1 1,071 965"'''''''''''',..,''' ... "''''lIV'''''''''''' "''''''''''''''''''''' """'''''''IiV''''''' "'''''''~'''''' "'''''''''' .... '''''''' "''''''''''''''''''' 'V"'~"'''''''' "'4IV""""~"''''' """'''''''''''''''''' "''''''''''4\t''''''4\t "'W4\t"''''''''''''''' .... "WIIIWfIWfIWfIWfIWTotal 14.719 1~,085 16,545 17,660 18.872 23.820 26,042 28,105 27,758 31,303 33,318 35,566 40,010Percent 26 25 25 24 25 27 27 27 26 26 26 24 22Average Percent 1970-82:25 X======.::1 c:=c:c=== ;:;::;::a:asza ...... am. a=_=::::;:tl;l _'-:_.;&:1. _ _ 'EI:'I==:xa ••• ==== _:a:====_ -======_==:::==a _.=====.. a:::n:t:&:1:l1IITOTAL 57,032 60,938 67,481 74.521 76,845 88,716 95, 189 102,602 108,303 119.608 129,500 148,226 183.065APA 8/83Junld2
.,Number of AEL&P CustomersClass of Residential Customer Dec'79 Dec'80 Dec'81 Dec'82 ~1ay 183General 4,849 4,829 4,327 4,470 4,207General w/hot water 1,540 1,753 1,886 2,008 1,954All El ectri c 56 348 872 1,344 1,573TOTAL 6,445 6,940 7,085 7,822 7,734AEL&P data was presented above since GHEA does not report residentialclasses in this form. AEL&P serves 90% of the area customers and isconsidered representative of GHEA customers.The shift in the residential sector to the hot water and all-electricclasses caused the use per customer in the sector to increase. Trackingthis energy use for both AEL&P and GHEA for the last several calendaryears shows:Residential Customer Energ~UseCYl979 CY1980 CY1981 CY1982Average No. of Cust. 7,197 7,490 7,801 8,493Residential <strong>Energy</strong> Sales 51.2 58.2 72.3 94.3(l11ill i on kwh)Use per Customer 7,11.0 7,770 9,270 11,100.... .:;..The increases in use per customer can bt; attt{buted primarily to newelectric heat and hot water use, however, part of the 1982 increase isdue to the cold weather encountered during that year's season. A summaryof heating degree days for the past 25 years is shown on Table 3.Economic and construction information was obtained from contractors,utilities, and Borough officials. A summary of the major points revealed:o Residential Sector Plans: Essentially all new housing in 1982 wasall-electric, however, the 1983 building shows a trend to installationof fuel oil heating systems.. About 10 percent of new constructionappears to be installing the fuel-oil units.o Commercial Sector Plans: The favorable vote to retain the capital inJuneau has resulted in a period of catch up following eight years ofdoubt about the capitals location. Major expansion of the area's twolargest shopping malls, construction of a new Fred t4eyer store, newvalley motels and new shopping malls are examples of some of theactivities occurring in this sector. The Gold Creek Developmentshould contribute significantly to growth in the downtown area.o Government Sector Plans: The vote to retain the capital in Juneaushould result in a moderate growth to meet new programs and maintainingof most state positions currently in Juneau. Federal employmentshould continue at its present level. Retaining the capital willresult in construction of additional needed office space and a secondaddition to the State Office Building is being planned. Nearly300,000 square feet of additional space requirements at a minimumhave been identified by 1991 and an additional 300 000 square feetof optional office space.'4..'"
Table 3. 0UNEAU AIRPORT HEATING DEGREE DAYSFY Oct Nov Dec 0an Feb Ma-r Ap-r May 0un 0ul Aug Sep Total==== =================================================================1959 736 928 1076 1449 1022 959 781 582 285 328 378 498 9022 .1960 757 911 926 1146 911 1019 713 470 409 321 355 466 84041961 660 915 956 1062 932 938 746 538 371 262 339 511 823().1962 760 1027 1246 1182 1097 1095 756 627 447 250 305 486 92781963 645 810 1132 1147 885 1023 846 500 431 288 244 375 83261964 625 1093 993 1098 835 1118 785 610 336 324 347 453 86171965 614 980 1496 1291 1154 923 813 693 487 292 297 435 94751966 654 1045 1182 1746 1090 1071 805 667 355 265 382 466 97281967 812 1191 1188 1291 963 1261 824 592 300 340 303 444 95091968 671 973 1162 1432 1043 984 808 508 374 248 281 516 90001969· 802 920 1405 1801 1219 1054 727 464 218 343 448 521 99221970 724 975 921 1329 830 876 770 601 422 387 405 553 87931971 783 1110 1343 1607 1029 1112 784 658 346 227 290 504 97931972 811 1001 1360 1519 1315 1186 906 618 432 207 293 535 101831973 810 907 1275 1423 1126 986 752 584 404 343 404 505 95191974 732 1253 1143 1550 ~006 1242 765 556 437 349 315 437 97851975 690 851 957 1296 1129 1063 791 541 402 281 337 402 87401976 712 1088 1244 1132 1131 1006 706-·:· 597 384 280 275 427 89821977 679 717 938 918 690 893- 673 531 320 243 196 428 72261978 695 1062 1423· 1233 922 954 683 525 317 298 262 427 88011979 612 1037 1134 1370 1505 904 712 528 378 251 205 415 90511980 609 830 1187 1404 895 949 678 477 278 283 308 472 83701981 628 783 1333 843 899 786 772 392 316 257 275 469 77531982 682 841 1175 1584 1213 1017 816 627 257 220 310 435 91771983 699 1027 1029 1073 924 931 663 470 272 287 315 466 815625-Vea ...Ave-rage 704 971 1169 1317 1031 1014 763 558 359 287 315 466 8954Source: Climatological <strong>Data</strong>, National Oceanic and Atmospheric Admin.Note - Last 3 months of 1983 assumed as ave ... age.APA 8/83heatdays5
o State government positions increased 5.5 percent during 1982 which isabout the same as the eight-year average of 5.7 percent per year.o Federal government employment remained essentially stable with lessthan a one percent increase to 1,219.o Local government employment increased 2.4 percent during 1982.o Private sector employment increased 6.8 percent in 1982.o Noranda Mining Corporation is continuing plans for operation of itssite on Admiralty Island by about 1986. Approximately 300 employeeswould be involved with most living in Juneau.6
EVALUATION OF BASIC DATAThis section evaluates the basic historic data and explains the recentgrowth and looks for trends that could affect furture growth.Residential SectorA summary of October through April AEL&P residential energy sales andnumber of customers for the past four seasons was presented in theprevious section. Examination of this data shows the following trends:Residential Sales by Class of CustomerOct-Apr Oct-Apr Oct-AprFY1981 FY1982 FY1983ncrease Increase IncreaseClass Gwh % Gwh % Gwh %General -0.5 -2.7 0.4 2.2 -0.7 -3.8General withhot water 1.9 17.3 2.8 21. 7 0.0 0All Electric 5.2 400.0 12.6 193.8 4.9 25.6TOTAL 6.6 21~4 15.8 42.1 4.2 7.9General Class ......Sales decreased slightly the past three years.Number of customers declined 13 percent between December 1979 andMay 1983.Use per customer has increased.All Electric ClassAlmost all homes built since 1979 are in the all-electric or hotwater class.For FY 1981, 1982, and 1983, 85 percent of the increase in Octoberto April AEL&P residential energy use occurred in the all-electricclass.October to April energy use during the past four years increasedfrom 1.3Gwh (4 percent of the residential use) to 24.0Gwh (42 percentof the residential use).Commercial and Government Sectors .Commercial and Government sales increased at less than half theannual rate of residential sales since 1979 (9 percent versus22 percent).,.7
Comnlercial customers increased only 2 percent from 1979 to 1982while sales increased by 31 percent during this same period.Part of this increase is due to all-electric costomers and partto weather.Government sales increased by 25 percent during the 1979 to 1982period. The reasons given for the commercial sector would applyhere also.Residential <strong>Energy</strong> Use Per CustomerResidential customer use increased 3~990 kwh per customer (56 percent)between 1979 and 1982 primarily because of the trend to electric hotwater and all-electric heat and secondarily because of colder weather in1982. A breakdown of energy use in the various classes for the past fouryears shows:GeneralGeneral w/Hot WaterAll ElectricCY19795,85011,07023~560Kwh per Customer ClassCY19805,97011~52024~530CY19816,07012~12023~760CY19826~46013~06026,590The 1980 and 1981 calendar years include warmer than normal winters(based on a '25-year average) while 1982.weatner was colder than normal.The 1983 heating season is again warmer than average.A summary of recent trends in electrical use in the Juneau area isshown on Table 4.Weather Influence on <strong>Energy</strong> and CapacityJuneau power demands have always been sensitive to weather and this isclearly shown by Table 1 where the 1981~ 1982, and 1983~ generation andpeak figures are shown. The cold 1982 season resulted in increases inenergy and peak of 21.7 percent and 29.2 percent respectively while thewarm 1983 season following the cold 1982 season resulted in an energyincrease of only 12.4 percent and a decrease in the peak of 3.6 percent.8
Table 4.,",UNEAU AREA RECENT ELECTRIC TRENDSChangeFY79 ======= =======Population 19, 174 2ChangeChangeFY80 (--Y.--> FY81 (--Y.--> FY82======= ======= =.:===== ======= =======19,500 3 20,085 7 21,495Change(--'Y.--:>=======6FY83 *=======22,720Residential Customers 7, 197 47,490 3 7,725 7 8,26768,738All-Electric Customers 69 110145 259 520 101 1,043551,618Residential Sales (MWH) 51, 168 1458,315 24 72,289 30 94,290296,6001..0Commercial Sales (MWH) 37, 137 237,867 7 40,371 21 48,7651354,900Government Sales (MWH) 31,303 633,318 7 35,566 12 40,010-737, 100Residential Sales 43 5Y. aT TotalCommercial Sales 31 -6'l. OT Total45 9 49 5229 -7 27°27-644928Government Sales 26 0'Y. of Total26 -8 24 -13 211023it -EstimatedAPA 8/83Junld6
The increase in the use of electric space heating should increase thissensitivity to weather since energy requirements are directly proportionalto outside temperatures. Analysis of recent weather data and netgeneration figures shows the following:October-Apri 1Heat Degree Da,lsOctober-Apri 1Net Generation Annual IncreaseFiscalYear Degree Days % of Avg. Gwh Gwh %1978 6,970 103 77.51979 7,279 108 86.6 +9.1 +11'.71980 6,552 97 89.3 +2.7 +3.11981 6,044 90 102.0 +12.7 +14.21982 7,328 109 129.3 +27.3 +26.81983 6,346 94 143.0 +13.7 +10.6Average 6,753Examination of weather on a monthly basis shows variations to be morepronounced.Heating Degree Da,lsNet Generation, GwhFiscal ... .",Year Dec Jan Feb Dec-Feb Total Dec Jan Feb Dec-Feb Total~.'1978 1,423 1,233 922 3,578 12.2 12.2 10.4 34.81979 1,134 1,370 1,505 4,009 12.2 15.2 14.6 42.01980 1,187 1,404 899 3,486 13.3 14.3 12.5 40.181981 1,333 843 1,213 3,075 17.1 15.7 14.2 47.01982 1,175 1,584 1,040 3,972 19.7 24.0 18.8 62.51983 1,029 1.073 924 3,026 22.4 23.7 4.5 65.6Avg. 1,213 1,251 1,084 3,524Since growth is high when a cold year follows a warm year and low when awarm year follows a cold year, the large increase in fiscal year 1982energy use and peak should be adjusted down to reflect the cold weatheroccurring then wh-ile 1983 should be adjusted upward. By adjusting theloads by adding a IIwea ther adjustment ll to the actual load when theseason was warmer than normal and subtracting if the season was colde~loads which would have occurred if average temperatures had prevailedwere estimated.'Tabl e 5 presents a surrmary of adjusted net generation figures for thepast six years and F~gure 1. graphically shows a comparison of actualand adjusted figures show the annual growth to be in the 15 to 18 percentrange if Ilnormalll weather had occurred the past three years. There isalso a slight decrease in annual growth since the peak in 1981 as shownon Table 5.10
Table5. JUNEAU NET GENERATION ADJUSTED FOR WEATHERDegree DaysFVActual-------======= -------DegreesVal'iationTramAverage========(X)========NetGenerationGWH=======1TemperatureAdJustmentAdjustedNet~~~~~~~~~~~~~~~~~~GenerationX*GWH GWH======= ;::s====== =====;::;=Annual Increase~~~~~~~~~~~~~~~~~~GWH======='Y.=======I-'I-'1978 8,8011979 9,0511980 8,3701981 7,7531982 9,1771983 8,15625-VearAverage 8,954-15397-584-1,2P1223-798-1. 71. 1-7.0-15.52.4-9.8122.2133.5143. 1166.7202:9228.0"~0.3 0.4 122.6, -0.2 -0.3 133.21.4 2.0 145.13. 1 5.2 171. 9-0.5 -1. 0 201.9~2.0 4. 5 232.510.611. 926.830.030. 58.68.918.417.515. 1* - Degree Days pel'cent variation times 0.2APA 8/83adJtemp
.EGENDFiQure ~. WEATHER ADJUSTED- . NET GENERATION ""250.0+--.. ----------------------------------------------------------------------- iIIIII ~IIIIII':
ESTIMATE ON FUTURE DEMANDS(r- Estimates for future demands were made for three cases. These include 1)\, With electric hear moratorium on January 1, 1984; 2) No electric heatmoratorium with low growth; and 3) No electric heat moratorium with highgrowth. The case with a moratorium assumes that an area-wide moratoriumwould occur and all cases use the same methods of calculations andassumptions on use per residential customer.AssumptionsThe FY 1983 estimated loads were based on net generation data for thefirst nine months of the year and extended to a 12 month period byassuming that October-May generation accounts for 76.8 percent of theannual generatiQn. This is based on the six year distribution of energyuse for fiscal years 1977-82.For 1984 and after, estimates were based on the assumptions below:All CasesPopulation Growth (based on estimates in the April 1983 "Juneau EconomicStudy" by Homan-McDowe 11 and forecasts for AEL&P prepared by CH2r·1 Hi 1 n .1983 - 19901990 - 2000'"Population per residential customer..Resi~entialUse per Customer:1983 - 19861986 - 19951995 - 2000System Load FactorElectric Heat MoratoriumResidential Sector_, "," ~2.63% annually2%2% annual increase2% annual decreaseconstant55%General Class: The number of customers would increase eachyear as all new customers would fall in this class followingthe moratorium.Genera 1 wi th Hot t~a ter Cl ass: The number of customers woul dremain constant after fiscal year 1984.All Electric Class: The number of customers would remainconstant after fiscal year 1984.Commercial SectorLoads in this sector were assumed to increase at a rate of 3 percentannua lly.Government Sector:This sector will grow at a rate of 2 percent annually.
No Electric Moratorium with Low GrowthResidential SectorGeneral Class: Approximately 10 percent 'of new customers inthe residential sector in 1983 are going into this class.This percentage was assumed to increase to 60 percent of thenew residential customers by 1990.General with Hot Water Class: About 15 percent of new customersin the residential sector in 1983 are going into this class.This percentage was assumed to increase to 30 percent of newresi dentia 1 custol
Table 6. ESTIMATE OF FUTURE DEMANDSELECTRIC HEAT MORATORIUM 1/84ActualFV FV FV FV FV FV FV FV FV FV FV1982 1983 1984 1985 1986 1987 1988 1989 1990 1995 2000:a__ eaga=_z:;=:a a:n:==;:::1 lD:aa:::a.a.a • =QICI_. a=;:za;u:::u: •_.=a;::,;;r .... =:c:r.,;=- a:;ll:Q:===- a = c::u==_ &:a:=:_Population 21,495 22,720 23.910 24,980', 25,710 26.230 27.090 27.560 2B.050 30.970 34.190People per Customer 2.6 2.6 2.6 2.6 2.6 2.6 2.6 2.6 2.6 2.6 2.6Residential Customers S.267 S.738 9. 196 9. 60S 9.SS8 10,088 10,419 10,600 10,788 11.912 13.150(Average)Residential Sales (Historic: 45X)General ClassCUlOtomerlO 5,289 5,176 5,311 5,723 6,00.3 6,203 6.534 6.715 6,903 8.027 9,265KWH/CulOtomer 7.052 6.500 6.760 6.895 7.033 6.895 6.760 . 6.627 6.498 5.885 5.885Hi 11 i on KWH 37.3 33.6 35.9 39. 5 42.2 42.8 44.2 44.5 44.9 47.2 54. 5Hot Water .Class 11CUlOtomerlO 1.935 1.944 1,965 1.965 1.965 1,965 1,965 1.965 1.965 1,965 1,965KWHICustomer 13.100 12,000 12.700 12.954 IG.213 12.954 12.700 12.451 12.207 11.056 11. 056Million KWH 25.3 23.3 25.0 25. 5 26.0 25. 5 25.0 24. 5 24.0 21. 7 21. 7.....All Electric: ClasliUl,CUlOtomers 1.043 'J, 618 1.920 1.920 1.920 1.920 1.920 1.920 1,920 1.920 1.920KWH/CulOtomer 26.700 24.500 26.000 26,520 27.050 26.520 26,000 25,490 24,990 22.635 22,635Mi 11 ion KWH 27.8 39.6 49.9 50.9 51. 9 50.9 49.9 4B.9 4B.O 43. 5 43. 5Subtotal Residential.MiBion KWH 90.5 96.6 110. B 115.8 ';120. 1 119. 1 119.0 117.9 116.8 112.4 119.7Commercial Sales (Historic: 30X)SUbtotal Commer!! 1al.Million KWH 46. 7 54.9 56.5 58.2 60.0 61. 8 63.6 65.6 67.5 78.3 90. 7Government Sales (Historic: 25X)Subtotal Government.Hi 11 i on KWH 37. 1 45.7 46.6 47. 5 48. 5 49. 5 50. 5 51.5 52. 5 58.0 64.0Street Lighting.Residential& Government. Mi 11 ion KWH 1. 1 1.2 1.2 1.2 1.2 1.3 1.3 1.3 1.4 1.5.Total Sales. Million KWH 174.2 198.3 215. 1 222.8 229.8 .231. 6 234.4 236.2 238. 1 250. 1 275.9Net Generation. Million KWH(liS,. of Sales) 202.9 228.0 247.4 256.2 264.3 266.3 269.6 271. 7 273.9 287.6 317.3System Cap, Factor X 21 55. 0 65.0 55.0 55.0 55.0 55.0 55.0 55.0 55.0 55.0 55.0Peak Demand. HW 42.0 40. 1 51,,4 53.2 54,9 55.3 56.0 56.4 56.8 59.7 65.9.11 Hot Water ClaSIi inc:luded in restriction.21 Mild winter cause~ 1983 to d Hofer. APA 8/83Junldfl.'
-en,AllTab le 7. ESTIMATE OF FUTURE DEMANDNO ELECTRIC HEAT MORATORIUM - LOW GROWTHActualFY FY FY FY FY FY FY FY FY FY FY1982 1983 1984 1985 1986 1987 1988 1989 1990 1995 2000:a=:a::;a:s::.a _::::I=a-=a=====::a a==-==_ DJ:::U:::a==:a a=a:: .. ==- •• ::a==iII .. CIIIZ.==_ ======- ==_===- _==11=:;:1:1Population 21. 495 22,720 23,910 24,980 :25,710 26,230 27,090 ';27,560 28,050 30,970 34, 190People per Customer 2.6 2.6 2.6 2.6 2.0 2.0 2.6 2.6 2.6 2.6 2.6Residential CU5tomers 8,267 8,738 9, 196 9,608 9,888 10,088 10,419 10,600 10,788 11,912 13, 150(Average)Residential Sales (Historic 45'1.)General Class,ICustomers 5,289 5,176 5,222 5,284 5,354 5,424 5,573 5,672 5,786 6,459 7,202KWH/Customer 7,052 6,500 6,760 6,895 7,033 6,895 6,760 6,627 .6,498 5,885 5,885Mi llion KWH 37.3 33.6 35.3 36.4 37. 7 37.4 37.7 37.6 37.6 38.0 42.4Hot Water Class,Customers 1,935 1; 944 2,013 2,095 2, 151 2, 191 2,257 ';2,302 2,359 2,696 3,067KWH/Customer 13, 100 12,000 12,700 12,954 13,213 12;954 12,700 12,451 12,207 11,056 11,056Million KWH 25. 3 23.3 25.6 ' 27.1 28.4 28.4 28.7 28. 7 2B.8 29.8 33.9Electric Class,Customers 1,043 1,618 1,961 2,229 2,383 2,473 2,589 2,625 2,644 2,756 2,880KWH/Customer 26,700 24,500 26,000 26,520 27.,050 26, 520 26,000 25,490 24,990 27,500 27,500Mi llion KWH 27.8 39.6 51.0 59. 1 64.5 65.6 67.3 66.9 66. 1 75.8 79. 2ISubtotal Residential,Million KWH 90.5 96.0 111.9 122. 7 ~30.5 131. 4 133.7 133.';2 132. 5 143.6 155. 5Commercial Sales (Historic 307.)Subtotal Commercial.Mi 11 ion KWH 46.7 54.9 57. 1 59.4 61.8 64.2 66.8 69.5 72.2 87.9 106.9Government Sales (Historic 257.)SUbtotal Governme,nt,Million KWH 37. 1 45.7 47. 1 48.5 49.9 51.4 53.0 54.0 56.2 65.2 75. 5Street Lighting,Residential8< Government, Million KWH , 1. 1 1. ';2 1.2 1.2 1. ';2 1.3 1.3 1.3 1.4 1.5"Total Sales, Million KWH 174.2 198.3 217.2 231. 7 243.4 248.2 254. 7 258. 5 262.2 298. 1 339. 5Net Generation, Million KWH
Table 8. ESTIMATE OF FUTURE DEMANDSNO ELECTRIC MORATORIUM - HIGH GROWTHAc:tualFY FY FY FY FY FY FY FY FY FY FY1982 1983 1984 1985 1986 1987 1988 1989 1990 1995 2000a::===== ====;;;:.a ==:a:-=:_8 =J;:a;;I===_ _a==-=_ .101.== .. •• ===-- _====cz a;;===== 11:====::1 .1::====Population 21.495 22.720 23.910 24.980 25.710 26.230 27.090 27,560 28.050 30.970 34. 190People per Customer 2.6 2.6 2.6 2.6 2.6 2.6 2.6 2.6 ·2.6 2.6 2.6Residential Customers 8.267 8.736 9. 196 9.608 9.8BB 10.0B8 10.419 10,600 10,7BB 11,912 13, l~O(Average)Residential Sales (Hhtoric: 45%)General Clas ••Customers ',289 5, 176 5,222 5,263 5,291 5,311 5,345 5.363 5,381 5.494 5.618"WH/Customer 7.052 6. 500 6.760 6,895 7,033 6,895 6,760 6,627 6.498 5,885 5.885Mi Ilion "WH 37.3 33.6 35.3 36.3 37.2 36.6 36. 1 35. 5 35.0 32.3 33. 1Hot Water Clas~.Customers 1,935 1.944 2,013 2.074 2, 117 2. 147 2.196 2.223 2.252 2,420' 2.606"WH/Customer 13. 100 12.000 12.700 12.954 13.213 12.954 12.700 12.451 12.207 11.056 11.056Million "WH 25. 3 23.3 25.6 26.9 ·28.0 27.8 27.9 27.7 27.5 26.8 28.8...J.All Electric Clas ••Customer!> 1.043 '1.618 1.961 2.270 2,491 2,631 2.979 3.014 3. 136 3.998 4.927"WH/Customer 26.700 24.500 26.000 26,520 • 27.050 26.520 26,000 25.490 24.990 22.635 22.635Million "WH 27.8 39.6 51. 0 60.2 67. 1 69.8 74.8 76.8 78.9 90.5 111. 5Subtotal Residential.Mill ion "WH 90.5 96.6 111.9 123.4 :132.3.';134.2 138.9 140. 1 141. 3 149.6 173.4Commercial Sales (Historic: 30%)Subtotal Commercial.Mi 11 ion "WH 46.7 54.9 58.2 61. 7 65. 4 69.3 73.5 77.9 82.5 110.5 147.8,Government Sales (Historic: 25%)Subtotal Government.Million KWH 37.1 45.7 48.0 50.4 52.9 55. 5 58.3 61.2 64.3 82. 1 104.7Street Lighting.Residential& Government. Million KWH 1 .. 1 1.2 1.2 1.2 1.2 1.3 1.3 1.3 1.4 1.5Totai Sales, Million KWH 174.2 198.3 219.2 236.6 251. 8 260.2 272.0 280. 5 289.5 343. 5 427.5Net Generation. Million KWH(liS,. of Sales) 202.9 228.0 252. 1 272. 1 289. 5 299.3 312.8 322.5 332.9 395.0 491.6System Cap. Factor,.II 55.0 65.0 55.0 55.0 55.0 55.0 55.0 55.0 55.0 55.0 55.0Peak Demand. MW 42.0 40. 1 52.,3 56. 5 60.1 62. 1 64.9 66.9 69. 1 82.0 102.0II Mild winter caused 1983 to d iffl!r. APA 8/83Junld,f2,
18RESULTS AND CONCLUSIONSConsiderable increases in electric power use have been experienced inJuneau in the past few years. These increases reflect substantialgrowth in the area's economy and the shift from oil to electricity for asignificant part of space heating. Weather related factors have alsoplayed a role in creating large increases during certain years. Thisis shown by the incre{ises in energy use in 1981, 1982, and 1983 (estimated)of 16 percent, 22 percent, and 12 percent, respectively. These threeyears consisted of a warm weather year followed by a colder year, followedby a warm year again. Adjusting those years for weather would result inincreases of about: 1981-18 percent; 1982-17 percent; and 1983-15 percent(if the interruptible customers were not shut off, 1983 would have beenabout 1.7 percent a 1 so. )The three forecasts prepared for this study included on involving anelectric heat moratorium at the beginning of the calendar year 1984 andtwo forecasts--a low and a high--which do not have the moratorium goinginto effect .. Table 9 summarizes the forecasts made at this time and alsocompares them with forecasts previously completed by APA and the localutilities. The following general statements relating to annual electricgrowth under the latest estimates can be made:El ectric Heat t·'oratorium - future annual growth decrease from the 5.9 percentprojected for 1984 to about 1 percent by 1990. Annual growth from 1983to 1990 is about 2.7 percent and about 1.5 percent from 1990 to 2000.Ann~al growth from 1983 to 2000 is about 2 percent ..,'No t10ratorium/Low Growth - future annual "growth:. decreases from 8 percentprojected for, 1984 to about 1. 7 percent by 1990. Annual growth from1983 to 1990 is about 4.1 percent and about 2.6 percent from 1990 to 2000.Annual growth from 1983 to 2000 is about 3.2 percent.No Moratorium/High Growth - future annual growth decreases from 10.5percent projected for 1984 to about 3.4 percent by 1990. Annual growthfrom 1983 to 1990 is about 7 percent and about 4 percent from 1990 to 2000.A"nnua 1 growth from 1983 to 2000 is about 4.6 percent."Figure 2 graphically compares this year's forecast and those completedpreviously.A comparison of Juneau area hydro power resources and forecasted demandsis shown on Table 10. The firm energy deficit beginning in 1983 increaseseach year and by 1987 amounts to a shortage of 45 million kwh in the casewith an electric moratorium, 65 million kwh for the no moratorium/lowgrowth case and 78 million kwh for the no moratorium/high growth case.Deficits would also occur under average conditions since the Juneau area loadis not large enough to utilize the large portion of this average energyoccurring in the fall.The rapid growth in area power requirements will probably persist next yeardue to the strong increases in the commercial sector and the extensiveconstruction activity which hasn't shown up as electric use yet. It ispossible that next year's actual increase will be higher than projecteddue to this activity, however, the 15 to 18 percent annual growth rateshould decrease as Juneau would be facing a deficit of firm hydro energyof 200 million kwh by 1987.
Table 9. COMPARISON OF JUNEAU AREA POWER REQUIREMENTSI IAPA 1982 ForecastsI II I~~~~~~~~~~~~~~~~~~~~~~~~~~~~IIElectric HeatI INo No Electric Heat I IMoratoriumI I I IMoratorium Moratorium Basic RestrictedFiscal Year 1/84I I I ILOlli Growth High Gl'olilth Casa 10/83~=:a:======_=:;:;:;:-==;;;===::::;== ====:::s:.:====c= c:====c====;==~__ I II Ia:l;.=~a=::::=_===. ••;I1\::===a==.::=== 1983 GWH 11 22B 228 228I I232 230I IMW 40 40 40I I4B 48I I1984 GWH 247 250 252I I253 241I IMW 51 52 52I I52 50I I1985 GWH 256 266 272I I273 248I IHW 53 55 56I I57 51I I1986I I I IGWH 264 280 ·289 301 258I I I I-OMW 55 58 60 62 54.DI I I II I I I1987 GWH 266 286 299 313 262Ht-I ,55I I' I I59 62 65 54I II II II II I I I198BI I I IGWH ,270 293 313 321 266I I I IHW 56 61 65 67 55I I I I",1989I I I IGWH 272 297 322 337 " 268I ,- I IMW 56 62 67 70 561990 GWH 274 302 333 ' I 356 273 ' IHW 57 63 69I I74 57I I1995 GWH 288 343 395I I424 292I IMW 60 71 82I I88 61I II ,I II , I I2000I I I ,GWH 317 390 492 500 317I IHt-I 66 81 ,102 104 66 ' II II II II II II ILatest Utility Forecasts~~~~~~~~~~~~~~~~~~~~~~~~~~~~~~~~~~~~~~~~~Electric Heat NoMoratorium Moratorium1184 LOlli Gl'olilthc::a._a:_aa •• === 1j;:=:;_=~==:5C:====223 22348 48234 24351 54246 26354 59256, 27756 62264 28759 65275 30261 68284 31263 70293 32165 72NoMoratoriumHigh Growthaca:;;;:::==o=:===223482465527061291663077033076'348803678511 Based on 9 months records.APA 8/83Jlt5
GEND500;---------------------------------------------------------------------------------------ilI@IIIIIIIIIIIIJIIII400+ I'Ix II " II' IIII :f. fI /' x II +/ @ II .~./ II +./@./ :), I300+ +./ / x ~"I/ @ x-x/ _~
Table 10. COMPARISON OF ~UNEAU AREA HYDRO RESOURCESAND ESTIMATED LOADSResources=========FiT"mAnnualEneT"gyGWHSnettisham Long Lake 179AEL&P Hydro 42=====221Estimated Loads and DeTicits (GWH)============================Electric HeatMOT"atoT"ium.,No MOT"atoT"iumLow Growth~~~~~~~~~~~~~~~~~~ ~",.,..,..,..,._.,..,..,."It.~"'~~~~. - .EstimatedEstimatedFY Loads DeTicit Loads DeTicit-------- ------- ------- --------1983 228 -7 228 -71984 247 -26 250 -291985 256 -35 266 -451986 264 -43 280 -591987 266 -45 286 -65"No MOT"atoT"iumHigh GT"owth~.,.~.,..,..,.~.,.~.,..,.~~.,.~~~~EstimatedLoads--------228252272290299Deficit---------7-31-51-69-78* Includes electT"ic hot wateT" heating.APA 8/83Jlt6a21
The overall conclusion of this study is that the Crater lake addition toSnettisham is needed regardless of which forecast is chosen as from 40to 70 percent of the project's output could be utlized the first year on-linein 1987. APA will continue to monitor and assess energy use and changingeconomic conditions in order to determine the appropriate generationfacilities beyond Crater lake and the optimum timing for these facilitiesas firm energy from Crater lake would be fully utilized by 1990 under thehigher growth case and by 1993 under the low growth case. Potential hydrosites beyond Crater lake would include long lake Dam, lake Dorothy, SweetheartCreek, and Speel River. AEl&P has proposed a cooperative study to look intofuture development of generation facilities in the Juneau area to ensurethe best utilization of the area's hydro resources.",• .- 'l.22
EXHIBIT 13J U,iEAU AREA POWER MARKET ANAL YS ISUPDATE OF LOAD FORECASTMAY 1984ALASKA POWER ADMINISTRATION
JUNEAU AREA POWER MARKET ANALYSISUPDATE OF LOAD FORECASTMAY 1994ALASKA POWER ADMINISTRAfIQNU.S. DEPARTMENT OF ENERGY
• Department Of <strong>Energy</strong><strong>Alaska</strong> Power AdministrationP.O. Box 50Juneau, <strong>Alaska</strong> 99802May 8, 1984Colonel Neil Saling<strong>Alaska</strong> District Engineer- Corps of EngineersP.O. Box 7002Anchorage, AK 99510Dear Colonel Saling:We are enclosing our latest update of load forecasts for the Juneau area. Thisstudy incorporates actual power use data through March 1984 and projected requirementsthrough the year 2000.We are estimating FY 1984 net generation of 247 million kWh -- 10.3 percentabove the previous year. A very mild winter plus curtailment of interruptiblecustomers have helped to hold down the size of the increase.Our future estimates include low, medium, and high projections. The resultsshow projected requirements of from 300 to 345 million kWh per year by 1990and 364 to 507 million kWh per year by 2000. The estimate indicates fullmarketability of Crater Lake power by 1990, or shortly thereafter.The estimate of future demands incorporate much smaller rates of increase thanthe area experienced in recent years. Given the current strength of the areaeconomy, our estimates may be too conservative.The area has experienced a hydro deficit the past two winters, as had beenpredicted in previous studies, requiring use of oil-fired generation to supplementthe hydro supply. The deficit will increase each year until the CraterLake unit of Snettisham Project is completed.We believe the new studies reaffirm the need to proceed as quickly as possiblewith completion of the Crater Lake Unit.Sincerely,Enclosure/~4a~+-Robert J. CrossAdministrator
CONTENTS·INTRODUCTION ••••••••••••.••••..••••.•.••••..•••••.••..•.••••...•.•. ~ . 1BASIC DATA............................................................. 1EVALUATION OF BASIC DATA............................................. 8Residential Sector ................................................................... ~.. 8Corrmercial and Government Sector................................. 9Weather Infl uence on <strong>Energy</strong> Use ..•...... " . . • . . . . . . . . . . . . . . . . . . . . . 9ESTIMATE OF FUTURE DEMANDS............................................ 12RESULTS AND CONCLUSIONS.................................. .•..•...•... 18TABLES1. Juneau Area Net Generation and Peak Demand ................... ..2. Juneau Area <strong>Energy</strong> Sales and Percent of Sales by Sector ....... .2a. End of Calendar Year Statistics •...... ~ .•......................3. Juneau Airport Heating Degree Days •...........•................4. Juneau Area Recent E1 ectric Trends ........................... ..5. Juneau Net Generation Adjusted for Weather ...•......•..........6. Estimate of Future Demands, Low Projection ••..•....•...........7. Estimate of Future Demands, Medium Projection ...............•.•8. Estimate of Future Demands, High Projection ••......•...........9. Comparison of Juneau Area Hydro Resourcesand Estimated Loads .............................................................. ..FIGURES1. Estimated <strong>Energy</strong> Requirements.................................. 20Page2346101115161721
INTRODUCTION<strong>Alaska</strong> Power Administration (APA) estimated Juneau area power requirementsthrough the year 2000 for this study. This estimate updates similar studiescompleted annually for the past several years. The area has experienced asignificant increase in peak demand and energy use since 1980 and theprevious studies indicated area power use would exceed critical year firmenergy from existing hydroelectric plants during fiscal year 1983. Thisactually occurred during the spring of 1983 as local utilities were requiredto furnish over 5 million kWh of diesel-generated electricity to supplementthat available from the hydro plants. The hydro shortage during the pastwi nter woul d have been .. much hi gher than the 13.0 mi 11 i on kWh actua 11 y generatedby diesel if the weather had not been so mild. The need fo.r diesel generationwill generally increase each spring as area reservoirs are drawn downuntil additional hydro energy is available from Crater Lake.BASIC DATAThe basic data and assumptions used for this study are essentially the sameas those used in previous studies and includes data on energy use, economic,and climatic conditions. <strong>Energy</strong> and capacity use data came from monthly-and annual reports by APA and the two local utilities, weather data fromthe National Oceanic and Atmospheric Administration (NOAA), and economicdata from State and local sources.Table 1. presents annual system net generation and peak demand for fiscalyears 1970 through 1984 along with annual percent increases. The dramaticincrease in 1982 is partially attributable to the cold weather during. thatwinter while the lower annual increase in 1983 is due to a combination ofthe cold winter in 1982 and the mild w·inter in 1983. The winter in 1984was also mild which kept the energy growth rate and system peaks down.<strong>Energy</strong> use in 1983 and 1984 would19ave been about 3 million kWh higher ifthe interruptible class customers- had not been shut off in the winter.Table 2. presents sales by residential, commercial, and government sectorsfor the 1970-83 calendar year period while Table 2a. examines the 1982and 1983 years in more detail. Residential customer use continues to bethe largest sector with 1983 sales accounting for 51 percent of the totalsales compared with a 13-year average of 45 percent for that sector. Commercialand government sectors have both decreased in the percent of overallsales since 1979. Part of the reason for this strong growth in theresidential sector had been the trend to all-electric homes in the area.An examination of recent residential sales in the AEL&P service area ;sshown below.Jj BuildingFederal Bldg.Bill Ray CenterHarborv;ew SchoolGold Belt Bldg.Peak Demand2,000 KW300 KW1,000 KW500 KW
,,,T.ble.1. ~NEAU AREA ENERQV AND PEAK DEMANDa"stemNet MWH X PeakQeneration Annu.l DemandFiscal Year MWH 11 Incr •• se MW____ ____C==---------- ----_._--- =:======---=-1970 58.266 12. 49. 51971 63.786 13. 810.11972 70,255 14. 97.81973 75,753 15. 59.61974 83,059 16.213.91975 94,609 17.812.41976 106,296 19.85.61977 112, 197 20.48.91978 122,218 23. 49.21979 133,457 23. 17.21980 143, 128 26.216. 51981 166,700 32.221.71982 202,900 41.610.41983 224,000 40. 110.41984 247,400 12 41. 3MW %AnnualIncrease-----=----11. 38.04.04. 59.911.23.014. 7-1. 313.422.929.2-3.63.0•",.11 Includ.s AELLP .nd QHEA sales .nd losses.12 Estim.t. based on 6 months data.2APA 4/84Jlt1
T.Ue 2. .JUNEAU AREA ENERGY BALES AND PERCENT OF 8ALES BY BECTOR (1.000 t(WH)CALENDAR YEAR-_._ .. -1970 1971 1972 1973 1974 197' 1976••••••• • •••••• ••••••• ••••••• .. _---- •••••••R •• ad.n".l B.l ••AELIoP 23.034 24.'63 28.00'9 30.2'98 31.87:S 33,866 36. 17'OHEA 2.3Ut 2.'80 3.027 3. 18:S 3.:54:S 3.7'4 4.126... ~ ...""....,... "".................. ....."'... /IIw"" ..... .................. "'... ""~ ... f\t ...... "" ...... "" ...... "" ........Tohl 2'.349 27.143 31.036 33.483 3:S.420 37,660 40.301P.rcen' 44 4' 46 4' 46 42 421'77 1978 197'9 1990.-_.... ••••••• ...-... .-._---38.702 42. 143 4:s.81' :S1,9394.292 4,936 ,.3:S3 6.376"""'''' .. ''' .... "" ............ "' .. .. ..."'''' ...... ........ ~-""' ... ""42.'94 47.07' '1.168 :S9.31'42 43 43 4:SAv.r •• e Percent 1970-83: 4'Yo19 •••••••••64.3877.902"" .... """"' .....72.28949.982 1983...-... •••••••B3.B1310.47793.8'812,316............ 41\10"" .. tIiIrIr ......"''''..94.290 106. 174'2"CO_Irchl B ....AEL .... 1'.713 17.322 18. :SllOHEA 1.2'1 1.398 1.38922.03' 21.3671.33'9 1.1962'.614 27.0191.622 1. B29........ ""' .......... ........... "' .. .. ..
+++++++++++++++A E L 1& P+++++++++++++++Re-sidentialQeneralHot WaterAll ElectricTable 2a. END OF CALENDAR YEAR STATISTICS--~--~-~--------------- -------------------------.198:24,470:2,0081,34419834,:2211,9591,967X Chg.-5.6-2.446.41982:28,439:25,647:29,7271983:28,258:25,74339,857X Chg.-0.6. "0.434. l'------- ------- ~------ ------- ------- -------Subtotal 7,822 8, 147 4.2 83,81312. C"Comm.rci.l 1, 186 1,250 5.4 46,925 54,03715.2Qovernment :237 264 11.4 36,884 42,571Outside Lighting 79 74 -6.3 187 145Str •• t Lighting 120 121 0.8 778 1,021AEL&P Total -=-==== 9,444 -=----= 9,856 ----=== 4.4 ---=--- 168,587 --====- 191,632+++++++++++++++o H E A+++++++++++++++Residential1,018 1, 14412.410,47712,31631. 217.6Commercial4725. 51,8401,9003.3Government50 524.02, 1612.536Street LightingQHEA Total3 30.0738617.8----=-- ------- ------- _.-=--- ----=_. ____ a_a.1, 1181,25812. 514,551 16,83815.7+++++++++++++++CO'" BIN E D+++++++++++++++R •• idential8,8409,2915. 194,290 106,17412.61,2331,3096.25~,93714.7Oo"e..,.n.ent28731610. 139,04~45, 10715. 51!"Out.ide Lighting7974-6.3187145-22.5.JUNEAU Total1231240.88511, 10730. 1-----=- ------- -----_. ---=--- --=-=-= --_ ..10,562 11, 114 5.:2 183,138 :208,470 13.t1!1f'APA 4/84'Jl4"
-...AEL&P Octbber through Aeril Sales {million kWh}Class Residential Customer 1980 1981 1982 1983 1984*General 18.6 18.1 18.5 17.8 18.2Hot Water 11.0 12.9 15.7 15.7 16.2All Electric 1.3 6.5 19.1 24.0 32.7TOTAL 30.9- 37.5 53.3 57.5 67.1*Apri 1 sales estimated.The trend toward all-electric homes through 1983 is further shown by the shiftin the number of AEL&P customers from the general class to the hot waterand all-electric class .Number of AEL&P CustomersClass of Residential Customer Dec l 80 Dec l 81 Oec'82 Dec l 83Genera 1 4,829 4,327Hot Water 1,753 1,886All Electric 348 8724,4702,0081,3444,2211,9591,9674,256*1,9982,130TOTAL 6,940 7,085 7,822 8,147 8,384*As of March 1984, approximately 800 customers are boat slips with 150 liveaboard. -This results in less than 50% of the total customers now in theGeneral class.AEL&P data was presented above since GHEA does not report residential classesin this form. AEL&P serves 90 percent of the area customers and ;s consideredrepresentative of GHEA customers. .The shift in the residential sector to the hot water and all-electric classescaused the use per customer in the sector to increase. Tracking this energyuse for both AEL&P and GHEA for the last several calendar years shows:Residential Customer <strong>Energy</strong> UseCYl979 CY1980 CY1981 CY1982 CY1983Average No. of Customers 7,197 7,490 7,801 8,493 9,074Residential <strong>Energy</strong> Sales 51.2 58.2 72.3 - 94.3 106.2( m i 11 ion kWh)Use per Customer (kWh) 7,110 7,770 9,270 11,100 11,700The increases in use per customer can be attributed primarily to new electricheat and hot water use, however, part of the 1982 increase is due to the coldweather during that year's heating season. A summary of heating degree daysfor the past 25 years is shown in Table 3.~ Economic and construction information was obtained from contractors, utilities,and Borough officials. A summary of the major points revealed:....5
Tabl. 3. ,JUNEAU AIRPORT HEATING DEQR'EE DAYS~ .FY Oct Nov Dec "'an F.b Ma,. Ap,. I'IAV "'un "'ul Aug Sep -: .. 1••••19~9 .-~-----=----.-== 736 928 1076 1449 .. =.=--.-----.. 1022 959 781 -======-.-=--=---======.-------.-:.92 285 328 378 498 90 21960 7~7 911 926 1146 911 1019 713 470 409 321 3'5 466 84'V41961 660 915 956 1062 932 938 746 S38 371 262 339 '11 82" C1962 760 1027 1246 1182 1097 1095 756 627 447 250 305 486 92tE1963 645 810 1132 1147 885 1023 846 SOO 431 288 244 375 832~1964 625 1093 993 1098 835 1118 ·785 610 336 324 341 453 8/:l~71965 614 980 1496 1291 1154 923 813 693 481 292 291 435 94. ~.1966 654 1045 1182 1146 1090 1011 805 661 355 265 382 466 91 11f e1961 812 1191 1188 1291 963 1261 824 592 300 340 303 444 95. C;1968 671 973 1162 1432 1043 984 808 S08 374 248 281 516 900C1969 802 920 1405 1801 1219 1054 727 464 218 343 448 521 99;:~1970 724 975 921 1329 830 876 770 601 422 387 405 553 87 ::::•1971 783 1110 1343 1607 1029 1112 784 658 346 227 290 504 97~'::.1972 811 1001 1360 1519 1315 1186 906 618 432 207 293 535 101 ::::1973 810 907 1275 1423 1126 986 752 584 404 343 404 505 951C;1974 732 1253 1143 1550 1006 1242 765 556 437 349 315 437 918~1975 690 851 957 1296 1129 1063 791 541 402 281 337 402 87C1976 712 '1088 1244 1132 1131 1006 706 597 384 280 215 427 8
o Residential Sector Plans: Essentially all new housing in 1982 was allelectric. The 1983 constructi on showed a trend back to fuel oil heati ngsystems with about 50 percent of homes being built at the start of the1984 season being all-electric. Basically, most single-family residencesbeing built were oil-heated while multi-family units were all-electric.About 75 percent of new residential units are multi-family and 25 percentsingle-family. A number of re-conversions back to oil systems were alsonoted by heating contractors.o Commercial Sector Plans: Growth in this sector should continue strong thisyear with completion of the Fred Meyer store, Jordan Creek Mall, expansionof Nugget and Mendenhall Malls, and construction of numerous office andother buildings throughout"the city. The Gold Creek Development shouldcontribute significantly to, growth in the downtown area.o Government Sector Plans: Moderate growth should continue in this sectorto meet new programs and maintain existing state positions in Juneau.Federal employment should continue at its present level. Nearly 300,000square feet of additional space requirements, at a minimum, have beenidentified by 1991, and an additional 300,000 square feet of optionaloffice space according to load forecasts by AlE&P.o Noranda Mining Corporation is continuing plans for operation of its' GreensCreek site on Admiralty Island by about 1987. Approximately 300 employeeswould be involved, with most living in Juneau.o Evaluation of future mining at the AJ and Treadwell Mines is continuing.It is estimated that AJ could process 10,000 to 20,000 tons of ore perday and Treadwell about 1,000 to 2,500 tons a day. This would requirean electrical supply of about 22.5 mw. These loads are not included inthe forecasts.7
8EVALUATION OF BASIC DATAThis section evaluates the basic historic data, explains the recent growth,and looks for trends that could affect future growth.Residential SectorA summary of October through April AEL&P residential sales and number ofcustomers for the past five seasons was presented in the previous section.Examination of this data shows the following trends:Residential Sa 1 es bl Cl ass of Customer.Oct-Apr Oct-Apr Oct-Apr Oct-Apr*FY 1981 FY 1982 FY 1983 FY 1984Increase Increase Increase IncreaseClass Gwh % Gwh .% Gwh % Gwh %Genera 1 -0.5 -2.7 0.4 2.2 -0.7 -3.8 0.4 2.2Hot Water 1.9 17.3 2.8 21.7 0.0 0.0 0.5 3.2All Electric 5.2 400.0 12.6 193.8 4.9 25.6 8.7 36.2TOTAL 6.6 21.4 15.8 42.1 4.2 7.9 9.6 16.7*April sales estimated.General ClassSales have decreased slightly the past few years to users withoutelectric hot water heating and have increased to those with electrichot water heaters. Overall, the net increase has been about 3.8 percentannua 11y.Number of customers has declined 5 percent between December 1980 andMarch 1984.Use per customer has increased about 3 percent annually the past fewyears.All Electric ClassAlmost all homes built from 1979-1983 were in the all-electric class.This trend is diminishing with about 50 percent of new residencespresently being all-electric.For FY 1981 through FY 1984, 87 percent of the increase in Octoberto April AEL&P residential energy use occurred in the all-electricclass.October to April energy use during the past five years increased from1.3 million kWh (4 percent of total residential use) to 32.7 millionkWh (49 percent of total residential use)......
Commercial and Government SectorsCommercialSales have increased about 11 percent,annually since 1979, however,the increase for 1983 alone was 15 percent.GovernmentThis sector accounts for 27 percent of energy sales.Sales have increased about 10 percent annually since 1979, however,the 1983 increase amounted to 16 percen.t.This sector accounts for about 22 percent of energy sales.Residential <strong>Energy</strong> Use Per CustomerResidential customer use increased 4,590 kWh per customer (65 percent)between 1979 and 1983, primarily because of the trend to all-electric heating.A breakdown in energy use in the various classes for the past five years show:GeneralHot WaterAll ElectricCY19795,.85011,07023,560Kwh per Customer ClassCY19805,97011,52024,530CY19816,07012,12023,760CY1982.6,46013,06026,590CY19836,50012,98024,075A summary of recent trends in electrical use in the Juneau area is shownin Table 4.Weather Influence on <strong>Energy</strong> and CapacityJuneau power demands have always been sensitive to weather and this isclearly shown on Table 1. where the 1981, 1982, and 1983 generation andpeak figures are shown. The cold 1982 season resulted in increases in energyand peak demand of 21.7 percent and 29.2 percent respectively while the' warm1983 season following the cold 1982 season resulted in an energy increase ofonly 12.4 percent and a decrease in the peak of 3.6 percent.It is then possible to adjust the ~nergy usage during cold and mild wintersto annual heating degree days to determine what that usuage would have beenduring an "average" winter.Table 5. presents a surrmary of adjusted, net generation figures for the pastwinter. It shows that an tlaverage" winter would have required about 4 millionmore kWh of energy than was actually generated. If the past winter hadbeen colder than normal, calculations show that about 12-15 million kWh ofadditional energy would have been required.
T.ble 4. JUNEAU AREA. RECENT ELECTRIC TRENDS...--_.FV79Ch.nge Change Ch.nge..-...-. -_....- ---==-- ....... =-- ........... :a=c(--x--) FVBO
T.ble :So~NEAU NET GENERATION ADJUSTEDFOR WEATHERDEGREEDAY S~~~~~~~~~~~~~~~~~~~~~~~~~~~~~~~~~~~~Va"i.tion'"omAve"age2S-Vea"~~~~~~~~~~~~~~~~~Month Actual Ave"age Deg"ees ( OX)------- ------- ------- ------- -_ ....... -Oct 701 704 -3 -0.4NetOene"ationOWH-----..20.4Tempe".tu"eAdJustment~~~~~~~~~~~~~~~~~~-------OX [1] OWH [2],...._----0.2 0.0AdJustedNetGene"ationGWH-------20.4Nov 989 971 18 1.922.4-0.9 -0.222.2Dec 1,425 1,169 256 21. 927.3-10.9 -3.024.3..............J.n 1,015 1,317 -302 -22.924. 111. 5 2.&26.9Feb &39 1,031 -192 -18.6M." 794 1. 014 -220 -21.7.21. 8-------21.5137.59.3 2.010.8 2.323.&-------23.&141. 5[1] Deg"ee Dav. pe"cent va"i.tion time. 0.5[2] AdJu.tment pe"cent time. net gene".tion.APA 4/84Jlt5.
ESTIMATE OF FUTURE DEMANDSEstimates for future loads were made for three cases which are identifiedas low, medium, and high projections.AssumptionsThe FY 1984 estimated loads were based on net generation data for the firstsix months of the fiscal year and were extended to a 12 month period byassuming that the growth rate for the second half of the year would beessentially the same as the rate for the first half.'Additiona1 assumptions include:All casesPopulation Growth (based on estimates in the April 1983 !lJuneau Economicstudy" by Homan-McDowell and forecasts. for AEL&P prepared by CH2M Hi 11 ) .1983-19901990-2000Population per residential customerResidential Use per Customer~Single FamilyGeneral ClassHot WaterAll ElectricMulti -Fami 1yGeneral ClassHot WaterAll ElectricLow Projection CaseResidential Sector2.63% annually2%7,500 kWh annually12,900 kWh annuallY1/26,000 kWh annually-6,000 kWh annually12,900 kWh annual1Y2/22,000 kWh annua1ly-General Class: About 40 percent of new customers are going intothis class in 1984. This is assumed to increase to 80 percent by1990 and hold constant thereafter.Hot Water Class: About 10 percent of new customers in 1984 aregoing into this class and this percentage is assumed to remainunchanged for future years.All Electric Class: About 50 percent of new customers are goinginto this class in 1984. This is assumed to decrease to 10 percentby 1990 and hold constant thereafter.1/ From a sample of individual residential use in the Lakewood area. (AEL&P)g; From a sample of users in the Parkshore Condominiums. (AEL&P)12,...
New residential construction is about 75 percent multi-family in1984. This is assumed to increase to 90 percent by 1990 and holdconstant.Annual increases in use per customer are assumed to decrease too percent by 1986. Use per customer will then decrease startingin 1988. This decrease is assumed to reach 2 percent annually by1995 and remain at that figure thereafter.Commercial SectorLoads in this sector were assumed to increase by 12 percent in1984; 8 percent in 1985; and 4 percent annually for all followingyears.Government SectorLoads in this sector were assumed.to increase by 10 percent in1984; 6 percent in 1985; and 3 percent annually for all followingyears.Medium Projection CaseResidential SectorGeneral Class: About 40 percent of new customers are going intothis class in 1984. This;s assumed to increase to 70 percent by1990 and hold constant thereafter.Hot Water Class: About 10 percent of new customers in 1984 aregoing into this class and this percentage is assumed to remainunchanged for future years.All Electric Class: About 50 percent of new customers are goinginto this class in 1984. ThiS is assumed to decrease to 20 percentby 1990 and hold constant thereafter.New residential construction is about 75 percent multi-family in1984. This figure is assumed to remain unchanged for future years.Annual increases in use per customer are assumed to decrease too percent by 1988. Use per customer will then begin to decrease.This decrease is assumed to reach 2 percent annually by the year 2000.Commercial SectorLoads in this sector were assumed to increase by 12 percent in 1984;10 percent in 1985; and 5 percent annually for all following years.Government SectorLoads in this sector were assumed to increase by 10 percent in1984; 8 percent in 1985; and 4 percent annually for all followingyears.13
High Projection CaseResidential SectorGeneral Class: About 40 percent of new customers are going intothis class in 1984. This is assumed to increase to 50 percent by1990 and hold constant thereafter.Hot Water Class: About 10 percent of new customers in 1984 aregoing into this class and this percentage is assumed to remainunchanged for future years.All Electric Class: About 50 percent of new customers in 1984 aregoing into this class. This is assumed to decrease to 40 percentby 1990 and hold constant thereafter.New residential construction is about 75 percent multi-family in1984. This figure is assumed to decrease to 60 percent by 1990and hold constant thereafter.Annual increases in use per customer are assumed to decrease too percent by 1990. Use per customer w'j 11 then begi n to decrease.This decrease is assumed to reach 1 percent annually by the year2000.Commercial SectorLoads in this sector were assumed to increase by' 12 percent in-1984 and 1985; and 6 percent annually all following years.Government SectorLoads in this sector were assumed to increase by 10 percent in1984 and 1985; and 5 percent annually for all following years.Tables 6. through 8. present the load forecasts for the three cases throughthe year 2000./I
t-'
Tab .. 7. ESTIMATE OF FUTURE DEMANDttEDIut1 PRO..JECTJONAt'u.l Attu"FV FY FV FV FV FV FV FY FV FV FY198iI 1983 1984 1985 1986 1987 1988 1989 19'90 1995 gooo____ e. - .... • ••••• '!fII ••• -. • ••••• •••••• • ••••• .... -. • ••••• •••••• --....Popul.Uon 21 •• 'D 22.880 ·23.566 :'!l4.273 25.002 25.752 26.524 27,320 27.866 30.767 33,'6'P.o,l. ,.~ Cu.'o •• ~ 2.6 2.6 2.6 2.6 2.6 2.6 2.6 2.6 2.6 2.6 2.6R •• '~.nt'.1 Cu.to •• ~. 8.267 8.800 ,.064 9.336 9.616 9.904 to. 202 . 10.508 10.718 11.833 13.065'Av.~ ••• JR ••".n,•• 1 a.a •• CHhh~ic 45'1'Q.n.~.a Cl ••••Cu.to •• ~. S.aet 5. 169 D.27:1 5.397 5.537 5,696 5.874 6.073 6.220 7.001 7.863KWH/Cu.to •• ~ 7.052 6.:100 6.627 6.724 6.788 6.819 6.815 6.7-77 6.707 6.207 '.602Million KWH 37.3 33.6 35.0 36.3 37.6 38.B 40.0 41.2 41.7 43.' 44. IHot ....... ca ••••Cu.'o •• ~. 1.935 1.96& 1,987 2.015 2.043 2.071 2. 101 2. 132 2.1'3 2.264 2.387KWH/Cu.h •• ~ 13. 100 12.900 13. 15S 13.355 13.4B9 13.556 13.556 13.4S9 13.354 12.3IY.Z II. 192Million KWH 25.3 25.3 26.2 26.9 27.6 28. I 2S. 5 29.S :ilB. 7 :ilB.0 26.7......All EI.c'~'c ca ••••O"!Cu.'o •• ~. 1.043 1.670 1.802 1.924 2.036 2.137 2.227 2.303 2,345 2.&68 2.814KWH/Cu.h •• ~ 26.700 24.:100 24.S79 25. &60 25.336 25.402 25.353 2:5. &97 24.915 :l3.012 20.727M'lilan KWH 27.B 40.9 44.B 4B. 4 :51.6 54.3 :56. 4 :5S.0 :J8. 4 '9. I sa. 3Subtot.1 R •• I~.n'I.I.HUlion KWH 90. 5 99.B 105.9 111.6 116.7 121. 2 125.0 liil7. 9 H!8. 9 130.6 129. ICo ... ~el.1 Bal •• CHhh~ic 3OX'Subtot.l Co ... ~c'.I.Million KWH 46.7 :53.S 59.9 65.9 69.2 72.7 76.3 80.1 84. I 107 .• 137.0Oov.~n •• nt a.l •• CHhh~lc 2S'USubto'.1 Qov.~n •• nt.HUUon KWH 37. I 43. 7 48. 1 :51.9 5S.3 :57.5 59.S 6ii1.2 64.7 81. 2 98.8Btr •• ' LI""n.,R •• I'.ntl.1.. Oov.rn •• nt. MUllan KWH 1.0 1.2 I. 2 1.2 l.2 1.3 1.3 1.3 1.4 I. STohl a.h •. MUUon KWH 174.2 198.0 ~IS. I 230.6 24ii1.4 252.6 262.4 271.5 279.0 320.6 366. 4N.' O.n.~.Uon. MUllon KWHC 115'1 0' B.I ..' 202.9 224.0 247.4 26:5.2 27B.B 290.' 301.7 312. 3 320.B 368.6 421.4SV.' •• C.p. Facto~ '1 II 5:1.0 63.0 68.0 55.0 55.0 55.0 5:1.0 55.0 55.0 55.0 55.0P ••• D._n'. HW 42.0 40. I 41. 3 5:5. & 57. 9 60.3 62. 6 64.S 66.6 76.5 B7.S11 HI U wlnhr. eau ••' 1983 .nd 1984 to 'iffer. APA 4/84"U7..
T.U. 8. E8TlKATE OF FUTURE D£KANDHIOH PRO..JECTlOHActu.l Actuel_ ••••••FV FY FV FV FY FV FV FY FV,.., ,..,..-. .._.-. •••••• •••••• •••••• • ••••• • ••••• ..--.. •••••• • •••••1982 1983 1984 198' 1986 19B7 1988 1989 1990I"' aoooPopul.Uon al.49' ZI.880 23.866 a4.a73 a5.ooa a'.7,a a6.'Ol4 a7.320 Ol7.86. 30.767 33 •• '.P.op •• p.r Cu.t ••• r a.6 2.6 2.6 a.6 2.6 2.6 2.6 a. 6 Ol.6 2.6 2.6R •• ld.nt, •• Cu.to •• r. 8.a67 8.800 9,064 9.336 9.616 9.904 10.20a 10.508 10.718 It. 833 13.065CAv.r ••• 'H •• ld.n.l.l B.l •• CHhtoric 451.'G.n.r.l Cl ••••Cu.to •• r. '.289 5. 169 '.27' ,.389 5.509 5.639 ,.779 '.9a6 6.031 6"ea 7.204KWH/Cu.to •• r 7.0'2 6.,00 6.627 6.7'8 6.B9Ol 6.996 7.061 7. 104 7. 106 6.939 '.607"&111on KWH 37.3 33.6 3'.0 36.4 38.0 39.4 40.8 42. 1 4Ol.9 4'.7 47.6Ho' W.t.r Cl ••••Cu.to •• r. 1,93' 1.96l 1.9B7 2,01' Ol.043 a.071 Ol.IOI Ol.132 a.153 2,264 Ol,381KWH/Cu.to •• r 13. 100 12.900 13. I'S 13.4OlI .3.690 13."5 14.034 14.104 14. 104 13.1" 13.09."tliion KWH a,. 3 a,. 3 26. a a7.0 2B.0 OlB.B a9.' 30.1 30.4 31. I 31.2...... All El.ctrlc Cl ••••-.....,jCu.to ..... 1.043 1.610 I. Boa 1.933 2.064 Ol. 194 Ol.3Ola a.450 2.'34 2,981 3.473KWH/Cu •• o .... a6.700 a4.,00 24,878 a,. 286 Ol'.717 26.04' 26.a,B 26,354 26.336 Ol',606 Ol4,292"UUon KWH a7.B 40.9 44.8 4B.'( '3. I '7. I 61. 0 64,6 66.7 76.3 B4. 4Bubtot.l R •• I'.ntl.l."'l1lon KWH 90. , 99.B 10'.9 Ita. 3 119.0 la,. 4 131.3 136. 7 140.0 1'3.Ol 163. aCo ..... cA •• B.l •• CHhto .. lc 301.,Sub'ot •• Co ..... cl.l."Ullon KWH 46.7 53. 5 89.9 67. I 71. I 75.4 79.9 B4. 7 89.8 lOlO.Ol 160.1Gov ... n •• nt 8 •••• (Hhh .. lc Ol5X'8ubtot •• ~v ... n •• nt."'ilion KWH 37. I 43. 1 48.1 52. 9 56.B '9. 7 6Ol.6 6'.B 69. I 90.6 115.78t .... t Li.,t'n,.R •• id.nt, ••.. Gov ... n •• nt, "illion KWH 1.0 I. Ol I. a 1.2 l.Ol 1.3 1.3 1.3 1.4 1.5Tot •• 8 ..... "'Ilion KWH 174.2 19B.0 21'. I Ol33. , Ol4B.Ol Ol61.6 27'.2 aOB. \') 300. I 365.4 441. OlN.t G.n .... tlon. "' .. Ion KWH"151. ., e.l .. , Ol02.9 aOl4.0 247.4 26B. , 2B'.4 300.9 316.4 331.0 345.2 4OlO.Ol S07.4BII.t •• C.p. F.ctor X 'I ". 0 63.0 6B.0 55.0 ".0 5'.0 55.0 550 ".0 55.0 55.0P ••• D ••• nill • ..... 42.0 40. I 41.3 '5. 7 59.2 6a. , 65. 7 68. q 71.6 B7.Ol 10'.3II Mtld wlnhr. c.u ••• 19B3 .nd 1984 to d""r. APA 4/B4JUB
RESULTS AND CONCLUSIONSConsiderable increases in electric power use have been experienced in Juneauin the past few years. These increases reflect substantial growth in thearea's economy and the shift from oil to electricity for a significant partof space heating. Weather related factors have also played a role in creatinglarge increases during certain years. This is shown by the increases inenergy use in 1981; 1982, and 1983 of 16 percent, 22 percent, and 10 percent,respectively. These three years consisted of a warm weather year followedby a colder year, followed by a warm year again. Adjusting those years forweather would result in increases of about: 1981-18 percent; 1982-17 percent;and 1983-15 percent (if the interruptible customers were not shut off, 1983would have been about 17 percent).The first six months of fiscal year 1984 indicate that this high growth hasstarted to decrease as energy use was only about 10 percent higher than thesame period in 1983. This can be attributed to a number of things; the firstbeing the stabilization of oil prices and hydro shortages during wintermonths have made oil heating systems attractive again. Also, the tremendousspurt in construction activity following the capital move vote has startedto subside. Home building permits numbered over 900 in 1983 whi.le 1984 isexpected to see fewer than 500.The three forecasts prepared for this study included low, medium, and highprojections. The following general statements relating to annual electricgrowth under the latest estimates can be made:Low Projection - Future annual growth decreases from the 9.9 percent projectedfor 1984 to about 1.8 percent by 1990. Annual growth from 1984 to 1990 isabout 3.4 percent and about 1. 9 percent from 1990 to 2000. Annual growth from1984 to 2000 is about 2.5 percent.Medium Projection - Future annual growth decreases from the 10.4 percent projectedfor 1984 to about 2.7 percent by 1990. Annual growth from 1984 to1990 is about 4.4 percent and ab04t 2.8 percent from 1990 to 2000. Annualgrowth from 1984 to 2000 is about 3.4 percent.High Projection - Future annual growth decreases from the 10.4 percent projectedfor 1984 to about 4.0 percent by 1990. Annual growth form 1984 to1990 is about 5.7 percent and about 3.9 percent from 1990 to 2000. Annualgrowth from 1984 to 2000 is about 4.6 percent.Figure 1. graphically compares this year's forecast and those completedpreviousl y.A comparison of Juneau area hydro power resources and forecasted demandsis shown on Table 9. The firm energy deficit which began in 1983 increaseseach year and by 1988 amounts to a shortage of 67 million kWh for the lowprojection case, 81 million kWh for the medium projection case, and 95 millionkWh for the high projection case. Deficits would also occur under averageenergy conditions since the Juneau area load is not large enough to utilizethe large portion of this average energy occurring in the fall. Colder thannormal winters will also have a serious effect on energy deficits.""...18
APA presently has plans to temporarily increase the storage capacity at LongLake by installing a small timber dam structure at the outlet. Modificationsare scheduled for the summer of 1984 and could result in an increase inaverage annual generation of about 4-6 GWH.AEL&P is presently underway with the rehabilitation of the lower SalmonCreek Power Plant._ This work could result in an increased average annualgeneration capahility of 15-19 GWH. However, due to timing of the runoff,this total amount may not be available each year.Although increased costs of energy (rate increases) were not evaluated forthis study, it is obvious that consumers are more conscious of their energyusage and try to conserve where possible. As rates continue to increase,price elasticity will become an important factor in future load forecasts.The overall conclusion of this study is that the Crater Lake addition toSnettisham is needed regardless of which forecast is chosen as from 60 to90 percent of the project's output could be utilized in 1988. APA willcontinue to monitor and assess energy use and changing economic conditionsin order to determine the appropriate generation facilities beyond CraterLake and the optimum timing for these facilities. Potential hydro sitesbeyond Crater Lake would include Long Lake Dam, Lake Dorothy, SweetheartLake, and Speel River. The two local utilities (AEL&P and GHEA) , APA, andthe <strong>Alaska</strong> Power Authority are jointly sponsoring a contract study withEbasco Services, Inc. to look into the future development of generationfacilities in the Juneau area. This reconnaissance level study will assistin defining the best utilization of the area's hydro resources and isexpected to be completed this summer .•
Comparison of1'1i11iGor.KWH~III IIIII4~o.III.IIIIII40()"IIIIIIIII:3~0+IIIIIIIII:300"IIIIIIIII2~IIIIIIFi !tv.,.. 1.. ESTV'tATED EI£RGY REQUl:REr1EHTS--------------------------_.--._-------------------21 JI/(.... Il.~ot ~I-./I /I /-I ......-l.oo! /-I I-I ,./-1 _/1/I I~IIIIIII0++----... -------------...-------+-+---------+--------_.-n ~ ~ ~ ~ ~ 0YEA R20
TABLE 9.COMPARISON OF JLNEAU AREA HYDRO RESOURCESAND ESTIMATED LOADS========Fir-mArlnualEner-,!!,,!GWH5nettisham Lonq Lake 179AEL&P 1-1'1' dr'o 42======22.1.stimat.~ Loads and De+icits (GWH===========================LowPr'o Ject ionME:'~iumPr-o ject ic'nHighProjectionFYEstimate~LoadsDe+icitEstimate~LoadsDe+icitEstimatedLoadsDe+icit.1.98519.'3G19871SS.S2602702792S8-39-49-58-07265279290302-44,-5.S-69-81268285301316-47-64-80-95APA 4/84jlt9
EXHIBIT 14UPDATED POWER VALUES<strong>CRATER</strong> <strong>LAKE</strong> <strong>PHASE</strong>SNETTISHAM PROJECT} ALASKAJULY 1982FEDERAL ENERGY REGULATORY COM~1ISSION
-.- :-;',. .... .-.-::- ::: .... =Ap ri 1 15, 1982Mr. Harlan E. MooreChief, Engineering Division<strong>Alaska</strong> District, Corps of EngineersP. O. Box 7002Anchorage, <strong>Alaska</strong> 99510Dear Mr. Moore:Please refer to your letter (NPAEN-H-HY) of March 10, 1982, in which you requestedupdated power values for the Crater Lake phase of the SnettishamProject, and my letter to you of March 24, 1982.The at-market values of hydroelectric power delivered in the Juneau area arebased on the estimated costs of power from an alternative source describedas foll ows:A diesel engine-driven generating plant of 7,500 kW total capacityconsisting of three 2,500 kW units, heat rate of 10,550 Btu/kWh,operating at a 40% plant factor; capital cost of $530 per kilowatt,service life of 35 years, and fuel and lubricating cost at $1.0795and $5.00 per gallon, respectively.The following values are based on January 1982 price levels for federalfinancing at 3-1/3% and 7-5/8% interest rates. Real fuel cost escalationassuming a project-on-1ine date of 1986 is also provided.FederalFinancingAt Market Value ofDependable Hydroelectric PowerPrice Level - January 1982$/kW3-1/3% 40.177-5/8% 61.76Without FuelCost Escalationmill s/kWh95.0495.04With FuelCost Escalationmills/kWh162.28141. 53These values include both hydro-thermal energy and capacity adjustments. Thecapacity value adjustments reflect only the relative reliability factors ofthe diesel plants. The hydrologic availability factor must be applied toarrive at the total adjusted capacity value.
As mentioned in my letter of March 24, 1982, we have not performed a studyto determine the usability and timing of the output from Crater Lake. Assuch, the above values are only applicable to the load-carrying capabilityof the project for power benefit evaluation purposes.Sincerely,Copy to North Pacific Div.Corps of EngineersPortland, Oregon.Attn: Mr. Nolan Folden?h~/.A~~: F. Kopf~~~ ,Regional Engineer"-2-