Electrical Power for Valdez and the Copper River Basin-1981
Electrical Power for Valdez and the Copper River Basin-1981
Electrical Power for Valdez and the Copper River Basin-1981
- No tags were found...

You also want an ePaper? Increase the reach of your titles
YUMPU automatically turns print PDFs into web optimized ePapers that Google loves.
E---~<strong>for</strong>-~-~<strong>and</strong> <strong>the</strong> <strong>Copper</strong> <strong>River</strong> B-~~~-fAI3 . a Po ver Aut ority3:r W. 5th A I •Anchorage, Alaska 99501~~~------------------~J8t8R111 FEASIBILITY REPORT AND FINAL ENVIRONMENTAL IMPACT STATEMENT(W]~~.r"'l.nUnited States ArmyCorps of Engineers~ ... Mrvlng dwArmv... SrFlJlng til#' Nat/onAlaska District
SOUTHCENTRAL RAILBELT AREA, ALASKAINTERIM FEASIBILITY REPORTAND FINAL ENVIRONMENTAL IMPACT STATEMENTELECTRICAL POWERFOR VALDEZAND THE COPPER RIVER BASINMARCH <strong>1981</strong>
SYLLABUSThe geographic area considered in this study encompasses <strong>the</strong> coastalcommunity of <strong>Valdez</strong> <strong>and</strong> tne interior communities of <strong>the</strong> <strong>Copper</strong> <strong>River</strong><strong>Basin</strong> (Glennallen being <strong>the</strong> largest). In past years this area has beenimpacted by various economic "booms" <strong>and</strong> "busts." The latest boom was<strong>the</strong> construction of <strong>the</strong> Trans-Alaska Oil Pipeline, followed by <strong>the</strong>post-pipeline construction slump, <strong>the</strong> latest DuSt. During <strong>the</strong>se periods<strong>the</strong>re have been corresponding increases <strong>and</strong> decreases in electrical usage.Although <strong>the</strong> econm~ is currently in a "slump," <strong>the</strong> outlooK <strong>for</strong> <strong>the</strong>future is <strong>for</strong> a large increase in <strong>the</strong> construction industry as <strong>the</strong> AlaskaPetrochemical Company (ALPETCO) begins worK on <strong>the</strong>ir complex in <strong>Valdez</strong>.This, in combination with <strong>the</strong> current expansion of <strong>the</strong> port facilities,will greatly increase electrical dem<strong>and</strong>. Fur<strong>the</strong>rmore, ALPETCOanticipates approximately 720 permanent employees to remain <strong>for</strong> plantoperation. Additional population increases would be associated with <strong>the</strong>employees' families <strong>and</strong> support facilities such as housing, stores, etc.The proposed plan consists of two elements to meet <strong>the</strong> future needs of<strong>the</strong> study area. The elements include <strong>the</strong> installation of a pressurereducing turbine (PRT) in <strong>the</strong> oil pipeline by 1984 followed by hydropowerdevelopment at Allison LaKe approximately 6 years later.The PRT would produce approximately 7.4 megawatts of power based on anoil flow rate of 1.5 million barrels per day. Tnis project has <strong>the</strong>advantage of providing a relatively continuous amount of power year-roundallowing <strong>for</strong> more flexibility in <strong>the</strong> utilization of <strong>the</strong> Solomon Gulch <strong>and</strong>ultimately <strong>the</strong> Allison Lake hydropower systems. Implementation of thisproject would be <strong>the</strong> responsibility of <strong>the</strong> local utility <strong>and</strong> AlyeskaPipeline Service Company.Tne second part of <strong>the</strong> plan, a lake tap at Allison Lake, would produceap~rox;mately 32,200 megawatt hours (MWH) of firm annual energy withS,050 MWH of secondary energy from an installed capacity of 8 megawatts.The estimated first cost is $34,301,000. Associated annual operation,lfIaintenance, <strong>and</strong> replacement costs are estimated at $200,000.
PERTINENT DATAALLISON LAKE HYDROPOWERRESERVOIRWater Surface Elevation, feet mean sea levelr~ax imulllAverager1inimumSurface Area at Maximum Elevation, acresUsable storage, acre-feetHYDROLOGYDra i nage Area, squa're mi 1 esAnnual Runoff, cubic feet per secondAverager1aximumMinimumPOWER AND ENERGYDependable Capacity, kilowattsFirm Annual Energy, megawatt hoursAverage Annual Energy, megawatt hoursFIRST COSTS (October 1980)Federalr'lon-Federa1TotalCOSTS100-year life @ 7-3/8 percent interest rateOperation, Maintenance & ReplacementTotal Annual CostANI~UALANNUAL !3ENEFITSTotal Annual Benefits (Assumes Pressure ReducingTurbine in oil pipeline)Net Annual BenefitsBenefit - Cost Ratio1,3671,3351 ,26725819,9805.74968368,00032,20037,250$30,871 ,0003,430,000$34,301,000$3,034,000200,000$3,234,000$4,985,000$1,751,0001.5 to 1iii
SOUTHCENTRAL RAILBELT AREA. ALASKAINTERIM FEASIBILITY REPORTAND FINAL ENVIRONMENTAL IMPACT STATEMENTTABLE OF CONTENTSItemINTRODUCTIONSTUDY AUTHORITYSCOPE OF THE STUDYSTUDY PARTICIPANTS AND COORDINATIONSTUDIES OF OTHERSTHE STUDY AND REPORTPROBLEM IDENTIFICATIONNATIONAL OBJECTIVESENVIRONMENTAL SETTING AND NATURAL RESOURCESECONOMY AND POPULATIONEXISTING SYSTEM AND FUTURE NEEDSCONDITION IF NO FEDERAL ACTION TAKENPROBLEMS. NEEDS AND OPPORTUNITIESPLANNING CONSTRAINTSPLANNING OBJECTIVESFORMULATION OF PRELIMINARY PLANSALTERNATIVES WORTHY OF FURTHER CONSIDERATIONASSESSMENT AND EVALUATION OF ALTERNATIVESDIESELCONSERVATIONT~ANSMISSIONINTERTIEPRESSURE REDUCING TURBINEALLISON LAKE HYDROCOMPARISON OF DETAILED PLANSSYSTEM OF ACCOUNTSRATIONALE FOR DESIGNATION OF NED PLANRATIONALE FOR DESIGNATION OF EQ PLANRATIONALE FOR SELECTED PLANPUBLIC INVOLVEMENT AND COORDINATIONCONCLUSIONSRECOMMENDATIONFINAL ENVIRONMENTAL IMPACT STATEMENT (YELLOW)Page1112234448181820202022272828293132344045494950505151iv
APPENDIXESA HYDROLOGYB EXISTING SYSTEM AND FUTURE NEEDSC ECONOMIC EVALUATIOND PROJECT DESCRIPTION AND COST ESTIMATEE ENVIRONMENTAL DATAF CULTURAL RESOURCESG FOUNDATIONS AND MATERIALSH FISH AND WILDLIFE COORDINATION ACT REPORTAND CORPS OF ENGINEERS RESPONSEI MARKETABILITY ANALYSISJ PUBLIC VIEWS AND RESPONSESv
INTRODUCTIONDue to continued growth <strong>and</strong> incre~sing electrical energy costs in <strong>the</strong><strong>Valdez</strong>-Glennallen area, <strong>the</strong> need <strong>for</strong> development of renewable electricalresources is oecoming imperative. The current dependence on diesel-firedgeneration <strong>and</strong> its associated cost escalation is taking a larger proportionof personal income each year.Increased dem<strong>and</strong> due to an exp<strong>and</strong>ing population associated with <strong>the</strong>planned petrochemical plant in <strong>Valdez</strong> (ALPETCO), <strong>the</strong> port facilities in<strong>Valdez</strong>, <strong>and</strong> exploratory oil drilling in <strong>the</strong> Glennallen area, dictate <strong>the</strong>need <strong>for</strong> exp<strong>and</strong>ed energy production. The need to obtain this energy fromei<strong>the</strong>r renewable or less expensive resources is critical to <strong>the</strong> economic<strong>and</strong> social well-being of <strong>the</strong> area. Expansion of diesel-fired generation,which currently accounts <strong>for</strong> all commercial electricity produced in <strong>the</strong>study area, Inay prove questionable at a time when future availability <strong>and</strong>price are doubtful.)TUDY AUTHORITYOn 18 January 1972 <strong>the</strong> Committee on Puolic Works of <strong>the</strong> United StatesSenate adopted a resolution requesting a review of <strong>the</strong> feasibility ofproviding hydropower to <strong>the</strong> southcentral railbelt area. The resolutionis quoted as follows:That <strong>the</strong> Board of Engineers <strong>for</strong> <strong>River</strong>s <strong>and</strong> Haroors created under<strong>the</strong> provisions of Section 3 of <strong>the</strong> <strong>River</strong> <strong>and</strong> Harbor Act approvedJune 13, 1902, be, <strong>and</strong> is hereoy requested to review <strong>the</strong> reportsof <strong>the</strong> Chief of Engineers on: Cook Inlet <strong>and</strong> Tributaries,Alaska, puolished as House Document Number 34, Eighty-fifthCongress; <strong>Copper</strong> <strong>River</strong> <strong>and</strong> Gulf Coast, Alaska, published as HouseDocument Number 182, Eighty-third Congress; Tanana <strong>River</strong> <strong>Basin</strong>,Alaska, pUblished as House Document Number 137, Eighty-fourthCongress; Yukon <strong>and</strong> Kuskokwim <strong>River</strong> <strong>Basin</strong>s, Alaska, pUblished asHouse Document Number 218, Eighty-eighth Congress; <strong>and</strong> o<strong>the</strong>r pertinentreports with a view to determining whe<strong>the</strong>r any modificationsof <strong>the</strong> recommendations contained <strong>the</strong>rein are advisable at<strong>the</strong> present time, with particular reference to <strong>the</strong> Susitna <strong>River</strong>hydroelectric power development system, including <strong>the</strong> DevilCanyon Project <strong>and</strong> any competitive alternatives <strong>the</strong>reto, <strong>for</strong> <strong>the</strong>provision of power to <strong>the</strong> Southcentral Railbelt area of Alaska.This interim feasibility report is in partial response to <strong>the</strong>above resolution.SCOPE OFTHE STUDYThis study was originally intended to determine <strong>the</strong> energy needs, <strong>and</strong><strong>the</strong> alternatives available to meet those needs <strong>for</strong> <strong>the</strong> <strong>Valdez</strong> area.However, since <strong>the</strong> completion of <strong>the</strong> initial evaluation of alternativesin April 1978, which identified Solomon Gulch <strong>and</strong> Allison Lake as <strong>the</strong> twoDest alternatives, a number of changes have taken place.
<strong>Copper</strong> Valley Electric Association (CVEA) has undertaken <strong>the</strong>construction of Solomon Gulch. This 12 megawatt (MW) installation willproduce approximately 55,600 megawatt hours (MWH) of average annualenergy with 38,600 MWH oeing firm. The estimated date <strong>for</strong> completion isNovemoer <strong>1981</strong>. In conjunction with <strong>the</strong> Solomon Gulch project, CVEA isconstructing a transmission line from <strong>Valdez</strong> to Glennallen. This willsignificantly increase <strong>the</strong> early utilization of <strong>the</strong> Solomon Gulch plant<strong>and</strong> set <strong>the</strong> need <strong>for</strong> additional capacity <strong>and</strong> energy at an earlier datethan previously assumed.Due to transmission line construction, <strong>the</strong> scope of <strong>the</strong> study has beenincreased to include any o<strong>the</strong>r potential hydropower sites which are in<strong>the</strong> area. With <strong>the</strong> <strong>Valdez</strong>-Glennallen intertie, sites which had beenpreviously considered uneconolnical <strong>for</strong> development have Decome worthy offur<strong>the</strong>r evaluation.STUDY PARTIClPANTS AND COORDINATIONDuring this study contact has been maintained with interested Federal,State, <strong>and</strong> local entities. PUblic meetings were held in <strong>Valdez</strong> on26 April 1977, 24 July 1978, <strong>and</strong> 18 November 1980. The earlier meetingswere primarily designed to ga<strong>the</strong>r puolic comments <strong>and</strong> in<strong>for</strong>mation to helpguide our study process. The last meeting included a report on <strong>the</strong> studyfindings, <strong>and</strong> an opportunity <strong>for</strong> puolic comment on <strong>the</strong> study.Sesides input from public meetings, close contact <strong>and</strong> cooperation wasmaintained throughout <strong>the</strong> study with Fish <strong>and</strong> Wildlife Service <strong>and</strong> <strong>the</strong>State Department of Fish <strong>and</strong> Game. The Department of Fish <strong>and</strong> Game wasinstrumental throughout <strong>the</strong> study in ga<strong>the</strong>ring lake <strong>and</strong> streamtemperature data. The Federal Energy Regulatory Commission wasresponsiole <strong>for</strong> providing <strong>the</strong> power values which represent <strong>the</strong> cost of<strong>the</strong> most likely alternative. The Alaska <strong>Power</strong> Administration providedload <strong>for</strong>ecasts as well as <strong>the</strong> marketao"ility analysis <strong>for</strong> <strong>the</strong> study.<strong>Copper</strong> Valley Electric Association assisted with <strong>the</strong> study by supplyingupdated generation costs <strong>and</strong> load requirements. R.W. Re<strong>the</strong>r<strong>for</strong>d <strong>and</strong>Associates provided in<strong>for</strong>mation on <strong>the</strong> pressure reducing turoine. Thecooperation that Alyeska Pipeline Service Company provided, particularlywith field investigations, was essential to <strong>the</strong> successful completion ofthis study.STUDIES OF OTHERSA number of investigations have been conducted in <strong>the</strong> study region,particularly in <strong>the</strong> <strong>Valdez</strong> area, since it is <strong>the</strong> far<strong>the</strong>st north ice-freeport in Alaska. Following is a brief summary of reports done <strong>for</strong> <strong>the</strong>study area. Much of <strong>the</strong> in<strong>for</strong>mation utilized <strong>for</strong> this report wasootained from <strong>the</strong>se sources.<strong>Copper</strong> Valley Electric Association conducted a 15-year power coststudy in 1976 <strong>and</strong> updated it in 1980 <strong>for</strong> <strong>the</strong> <strong>Valdez</strong>-Glennallen area. Thestudy conside~ed diesel generation, oil pipeline turbine generation, <strong>and</strong>hyuropower development. The study concluded with <strong>the</strong> construction of <strong>the</strong>Solonlon Gulch hydroelectric project.2
The city of <strong>Valdez</strong> conducted environmental, social, <strong>and</strong> economicstudies of <strong>the</strong> <strong>Valdez</strong> area as a part of <strong>the</strong>ir proposed port facilityenvironmental assessment. The study was completed in September 1979.Alyeska Pipeline Company conducted many studies in <strong>the</strong> <strong>Valdez</strong>Glennallen area prior to <strong>the</strong> construction of <strong>the</strong> oil pipeline <strong>and</strong> <strong>the</strong> oilterminal located near <strong>the</strong> city of <strong>Valdez</strong>. Their studies included <strong>the</strong>impacts on <strong>the</strong> environment as well as socio-economic impacts from <strong>the</strong>construction, operation, <strong>and</strong> maintenance of <strong>the</strong> oil pipeline <strong>and</strong> relatedport facility.Alaska Petrochemical Company is now studying <strong>the</strong> effects of <strong>the</strong>irproposed refining <strong>and</strong> petrochemical facility to be located near <strong>the</strong> cityof <strong>Valdez</strong>. Tne draft environmental impact statement was released <strong>for</strong>public review in December 1979 <strong>and</strong> <strong>the</strong> final document was made availablein March 1980.The city of <strong>Valdez</strong> completed an Inventory Report in June 1979 which isa progress report on work accomplished by <strong>the</strong> Planning Department towarddevelopment of <strong>the</strong> City's Coastal Management Program. Tne reportcontains an inventory of natural <strong>and</strong> cultural resources in <strong>the</strong> <strong>Valdez</strong>coastal area, analyzes potential changes in management, use, <strong>and</strong>ownership of major coastal l<strong>and</strong> <strong>and</strong> water resources.THE STUDY AND REPORTThis report is organized into a main report <strong>and</strong> accompanyingappendixes. The main report gives an overview of <strong>the</strong> study, <strong>the</strong> findings(including <strong>the</strong> environmental impact statement), <strong>and</strong> <strong>the</strong> recommendations.The appendixes provide oackup <strong>and</strong> a data source <strong>for</strong> <strong>the</strong> findings in <strong>the</strong>main report.3
PROBLEM IDENTIFICATIONThe followinq section of <strong>the</strong> report gives an overview of nationalobjectives, a profile of <strong>the</strong> area's environmental setting <strong>and</strong> naturalresources~ a summary of <strong>the</strong> existing electrical system~ <strong>and</strong> an explanationof <strong>the</strong> problems <strong>and</strong> needs of <strong>the</strong> study area. In addition~planning constraints <strong>and</strong> objectives <strong>for</strong> <strong>the</strong> study are addressed.NATIONAL OBJECTIVESFederal water <strong>and</strong> related l<strong>and</strong> resource planning is directed towardachieving National Economic Development (NED) <strong>and</strong> Environmental Quality(EO) as equal national objectives. NED is achieved by increasing <strong>the</strong>value of <strong>the</strong> nation's output of goods <strong>and</strong> services <strong>and</strong> by improvingnational economic efficiency. Tne EO oDjective is achieved by <strong>the</strong>management, conservation, preservation, creation, restoration, orimprovement of <strong>the</strong> quality of certain natural <strong>and</strong> cultural resources <strong>and</strong>ecological systems.Tnose resource management needs specific to <strong>the</strong> stUdy area, that canbe addressed to enhance <strong>the</strong> national objectives, become <strong>the</strong> planningoDJectives <strong>for</strong> <strong>the</strong> study. These, in turn, serve as <strong>the</strong> yardstick againstwhich <strong>the</strong> various alternatives are evaluated.ENVIRONMENTAL SETTING AND NATURAL RESOURCESThe study area is separated into three distinct regions; <strong>the</strong> coastalarea south of <strong>the</strong> Cnugach Mountains, tne Chugach Mountains, <strong>and</strong> <strong>the</strong><strong>Copper</strong> <strong>River</strong> <strong>Basin</strong>.Climate:Inl<strong>and</strong> of <strong>the</strong> Chugach Mountains is an area characterized by a semiaridclimate with relatively clear skies <strong>and</strong> extreme temperatures. South of<strong>the</strong> mountains <strong>the</strong> temperature is moderate, with cool, rainy summers <strong>and</strong>high winter snowfall.Topography:Tne coastal area is a glacially created fjord, composed of a fairlyflat outwash plain with some moraine deposits leading rapidly to steepsided mountains. The remainder of <strong>the</strong> study area includes parts of <strong>the</strong>Alaska Range, <strong>the</strong> Wrangell <strong>and</strong> Chugach Mountains, <strong>and</strong> <strong>the</strong> <strong>Copper</strong> <strong>River</strong>lowl<strong>and</strong>.Hydrology:Hydrologic ddta is scarce in <strong>the</strong> <strong>Valdez</strong> basin. The Lowe <strong>River</strong>, withits 3l0-square mile drainage basin, is <strong>the</strong> largest contributor offreshwater to Port <strong>Valdez</strong>. Moderate to heavy rain, snow, <strong>and</strong> glacialmelt generally provide a plentiful water supply. Streams at <strong>the</strong> studyarea are mostly short <strong>and</strong> steep <strong>and</strong> in many cases, glacial fed. The4
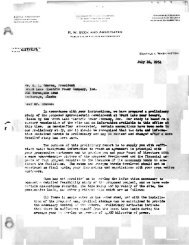
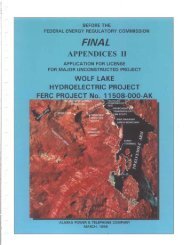
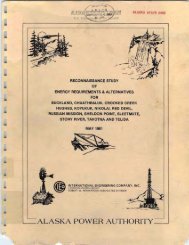
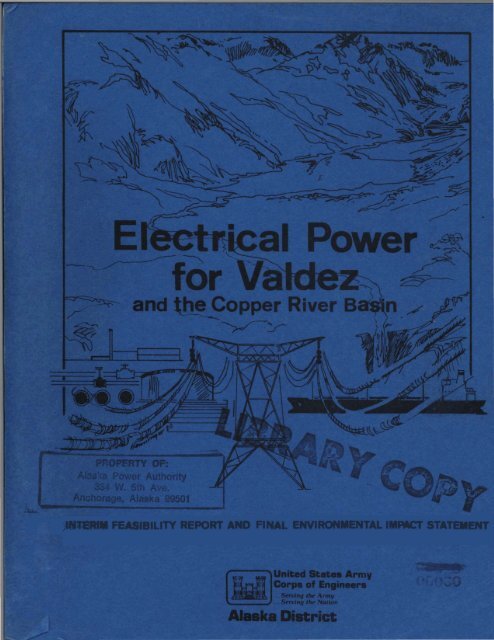
FIGURE I:HYDROPOWER STUDY AREAFOR VALDEZ ANDCOPPER RIVER BASIN~-- '" ~ r .' ~ '. ',',~,~, -' - CHITINAPORTVAL
average annual runoff is approximately 10 cubic feet per second (cfs) persquare mile in coastal regions, with peak runoff sometimes exceeding 150cfs per square mile. These peaks usually result from rainstorms in <strong>the</strong>fall. High runoff can also occur with winter rain combined with snowmelt.The principal watershed of <strong>the</strong> study area is <strong>the</strong> <strong>Copper</strong> <strong>River</strong> systemwith a 24,400-square mile drainage basin. It drains <strong>the</strong> south slopes of<strong>the</strong> Alaska Range, south <strong>and</strong> west slopes of <strong>the</strong> Wrangell Mountains, mostof <strong>the</strong> Chugach Mountains, <strong>the</strong> <strong>Copper</strong> <strong>River</strong> <strong>Basin</strong>, <strong>and</strong> a small section of<strong>the</strong> Talkeetna Mountains.Geology:The Chugach Mountains within <strong>the</strong> study area are composed mainly of athick section of alternating dark shales <strong>and</strong> graywackes known as <strong>the</strong><strong>Valdez</strong> Group.Outwash planes of <strong>the</strong> Robe <strong>and</strong> Lowe <strong>River</strong>s <strong>and</strong> Valaez Glacier Streamcoalesce to <strong>for</strong>m a delta on <strong>the</strong> east end of <strong>the</strong> port. Although boringsin <strong>the</strong> area have not contacted bedrock, inference from geophysical datawithin Port <strong>Valdez</strong> indicates that sediment thickness is probably inexcess of 600 feet. For <strong>the</strong> interior portion, no <strong>for</strong>mation or bed has adistinctive enough character to be recognized over any large area,however, much of <strong>the</strong> area shows signs of folds <strong>and</strong> faults with <strong>the</strong> bedsst<strong>and</strong>ing at steep angles <strong>and</strong> striking parallel to <strong>the</strong> axis of <strong>the</strong> range.Bed dip angles range from 45 to 85 degrees over long distances. Studieshave assigned local rock to <strong>the</strong> upper cretaceous age.Geophysical Hazards:The study area is one of <strong>the</strong> most seiSmically active areas in <strong>the</strong>world. Although l<strong>and</strong> shaking can be destructive, most past damage hasbeen caused by <strong>the</strong> accompanying tsunami. Tne sediments within <strong>the</strong> Port<strong>Valdez</strong> basin are porous gravels which experience ground failure orslumping.Agriculture ana Range:Potential agriculture <strong>and</strong> range resources of <strong>the</strong> stUdy area are mainlyalong <strong>the</strong> <strong>Copper</strong> <strong>and</strong> Chitina <strong>River</strong> Valleys. Narrow coastal strips <strong>and</strong>stream deltas might be grazed during <strong>the</strong> summers, with removal of <strong>the</strong>animals imperative <strong>for</strong> <strong>the</strong> balance of <strong>the</strong> year due to snow conditions.Forestry:Most of tne timDer in <strong>the</strong> stUdy area is noncommercial oecause of itsslow growth due to poor site conditions. The lowl<strong>and</strong> spruce-hardwoodecosystem covers 2,484,000 acres <strong>and</strong> is noncolllmercial tnroughout.The total st<strong>and</strong>ing volume in <strong>the</strong> interior <strong>for</strong>est is 1.5 billion boardfeet consisting of 1.4 Dillion board feet of spruce <strong>and</strong> 52.5 million6
oard feet of hardwoods, half of which is birch. The total volume ofcoastal <strong>for</strong>ests is about 19.8 billion board feet, 67 percent of which isSitka spruce <strong>and</strong> 28 percent Western hemlock.Minerals:Metallic minerals occur in several areas. Lodes in many parts of <strong>the</strong><strong>Copper</strong> <strong>River</strong> region contain copper, gold, silver, molybdenum, antimony,nickel, iron, lead <strong>and</strong> zinc, but only gold, copper <strong>and</strong> by-product silverwere mined commercially.Fisheries:Since mucnof <strong>the</strong> area is mountainous, <strong>the</strong> fisheries habitat ischaracterized by many short, steep, coastal streams which are utilized bypink <strong>and</strong> chum salmon. Cono salmon are also abundant in <strong>the</strong> study area,however <strong>the</strong>y require somewhat larger streams where <strong>the</strong> young can survivein <strong>the</strong> stream <strong>for</strong> at least 1 year. Sockeye salmon are found primarily indrainages that contain a lake which is necessary to part of <strong>the</strong>ir lifecycle. Dolly Varden are present throughout <strong>the</strong> coastal streams withrainbow <strong>and</strong> cutthroat trout present to a lesser extent.Important marine fish <strong>and</strong> shellfish include salmon, herring, halibut,rockfish, black cod, king, tanner <strong>and</strong> dungeness crab, shrimp, scallops,<strong>and</strong> razor clams.Birds:The study area is an important migration route <strong>for</strong> many species ofwaterfowl <strong>and</strong> o<strong>the</strong>r water related birds. The <strong>Copper</strong> <strong>River</strong> Delta is oneof <strong>the</strong> most important waterfowl nesting areas in Alaska. Along with itsunique nesting population, <strong>the</strong> delta is probably most important as astaging <strong>and</strong> feeding area <strong>for</strong> migratory waterfowl bound to <strong>and</strong> from <strong>the</strong>arctic <strong>and</strong> subarctic nesting areas to <strong>the</strong> north. The entire coastal areais habitat <strong>for</strong> seabirds of various species. At least 48 major seabiracolonies have been identified in <strong>the</strong> study area, <strong>and</strong> undoubtedly manymore exist. Resident game birds of <strong>for</strong>est, treeless, <strong>and</strong> o<strong>the</strong>r habitatsare spruce, ruffed <strong>and</strong> sharp-tailed grouse; willow, rock <strong>and</strong> white-tailedptarmigan.Wildlife:The three geographical regions of <strong>the</strong> study area, coastal, mountain,<strong>and</strong> interior dictate <strong>the</strong> wildlife distribution <strong>and</strong> abundance. Severalwildlife species may be found in more than one area, however, <strong>the</strong>y aregenerally more numerous within a specific area.Sea otters, fur seals, nor<strong>the</strong>rn sea lions, harbor seals, harborporpoise, Dall's porpoise, killer <strong>and</strong> hump-backed whales are ei<strong>the</strong>rresidents or regular visitors to <strong>the</strong> coastal waters of <strong>the</strong> stUdy area.Terrestrial animals associated with <strong>the</strong> coastal region in~lude <strong>the</strong> Sitkablack-tailed deer, which are primarily confined to tne is1<strong>and</strong>s of PrinceWilliam Sound (although some occur on <strong>the</strong> mainl<strong>and</strong> near Cordova), <strong>and</strong> <strong>the</strong>blaCk bear.7
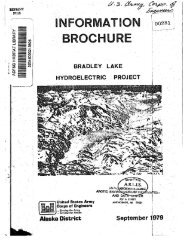
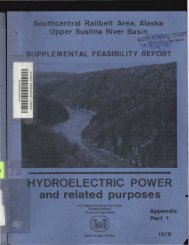
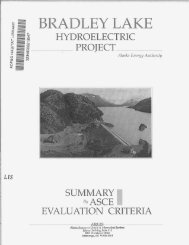
The mountainous region of <strong>the</strong> study area contains some of <strong>the</strong> mostimportant Dall sheep range in tne State. Mountain goats are alsoabundant in <strong>the</strong> mountains of Prince William Sound, but are present in lownumoers in <strong>the</strong> Wrangell Mountains <strong>and</strong> <strong>the</strong> interior portion of <strong>the</strong> ChugachRange.Tne interior portion of tne study area supports several species oflarge mammals. Moose are relatively abundant throughout <strong>the</strong> interiorregion <strong>and</strong> concentrate in <strong>the</strong> river basins during <strong>the</strong> winter months.Brown/grizzly bears are present in <strong>the</strong> area <strong>and</strong> become most visible aboutstreambanks during <strong>the</strong> salmon runs. O<strong>the</strong>r large mammals include <strong>the</strong>Barren ground caribou which utilize <strong>the</strong> interior portion of <strong>the</strong> studyarea as a winter range. Two distinct bison herds, <strong>the</strong> Cnitina <strong>and</strong> <strong>Copper</strong><strong>River</strong> herds, have been established <strong>and</strong> appear to be sustaining healthypopulations.Wolves, wolverines, lynx, red fox, l<strong>and</strong> otter, mink, marten,short-tailed weasel, beaver, muskrat, <strong>and</strong> snowshoe hare are presentthroughout <strong>the</strong> study area to varying degrees.ECONOMY AND POPULATIONTne physical differences between tne coastal portion of tne study area(<strong>Valdez</strong>) <strong>and</strong> interior portion (Glennallen-<strong>Copper</strong> Center) are stronglyreflected in tneir nistory, economy, <strong>and</strong> population.<strong>Valdez</strong>:<strong>Valdez</strong> ;s tne largest population center in <strong>the</strong> region. Tne city is ;na setting of natural beauty situated in mountainous terrain at <strong>the</strong> headof Port <strong>Valdez</strong>. It is <strong>the</strong> far<strong>the</strong>st north ice-free seaport ;n Alaska <strong>and</strong>serves as <strong>the</strong> sou<strong>the</strong>rn terminus of both <strong>the</strong> Trans-Alaska Oil Pipeline <strong>and</strong><strong>the</strong> Ricnardson Highway.Hi story:<strong>Valdez</strong> was estaulished in 1890 as a debarkation point <strong>for</strong> men seekinga route to Interior Alaska <strong>and</strong> <strong>the</strong> Klondike gold fields. A post officewas established in <strong>the</strong> community in 1899, <strong>and</strong> Va1aez soon became a supplycenter <strong>for</strong> gold <strong>and</strong> copper mining in <strong>the</strong> immediate area. Until <strong>the</strong>Alaska Railroad was completed in 1923, <strong>Valdez</strong> was <strong>the</strong> only all-seasonport of entry to <strong>the</strong> interior. In <strong>the</strong> winter months freight <strong>and</strong>passengers were hauled weekly to Fairoanks in horse-drawn sleds over <strong>the</strong>"<strong>Valdez</strong> Trai1." Construction of <strong>the</strong> Alaska Railroad from Seward toFairuanks <strong>and</strong> emergence of Anchorage as <strong>the</strong> largest city in Alaska,combined to eliminate <strong>the</strong> vital role of <strong>Valdez</strong> as a port of entry to <strong>the</strong>interior.Old <strong>Valdez</strong> was destroyed by tne 1964 Alaska Earthquake <strong>and</strong> <strong>the</strong>resultant seismic wave. The new relocated townsite near Mineral Creekhas been growing rapidly, especially witn <strong>the</strong> Trans-Alaska PipelineTerminal located in Port <strong>Valdez</strong>. The construction of <strong>the</strong> Trans-AlaskaPipeline has had notable permanent effects on tne populations anaeconomies of <strong>Valdez</strong> <strong>and</strong> <strong>the</strong> <strong>Copper</strong> Valley basin.8
VALDEZ
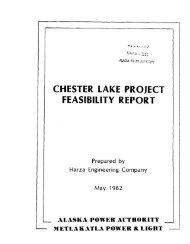
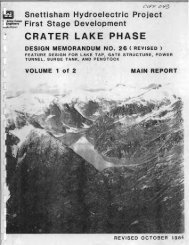
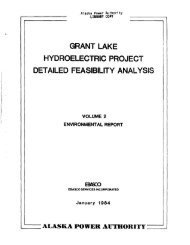
Transportation:Although served by air, road, <strong>and</strong> sea, <strong>Valdez</strong> is relatively isolatedfrom o<strong>the</strong>r population centers in southcentra1 Alaska. Anchorage islocated 115 miles to <strong>the</strong> west, but physical barriers increase <strong>the</strong>distance by highway to 306 miles.The airport layout comprises a single 5,000-foot runway in aneast-west orientation. <strong>Valdez</strong> is currently served by two air carriers ona regular basis. The principal carrier is <strong>Valdez</strong> Airlines. The vastmajority of air passenger traffic originates in or is destined <strong>for</strong>Anchorage. <strong>Valdez</strong> is one of eight cities served oy <strong>the</strong> SouthwesternMarine Highway System. This system provides ferry service to Whittier,<strong>Valdez</strong>, Cordova, <strong>and</strong> Seward, within <strong>the</strong> Prince William Sound area.Passenger traffic totaled approximately 44,000 riders in 1976. The<strong>Valdez</strong> to Whittier route, which passes <strong>the</strong> scenic Columbia Glacier,accounts <strong>for</strong> nearly 20 percent of this total traffic. Thus <strong>the</strong> ferrysystem nourishes a sfllall but growing tourist industry in <strong>Valdez</strong>.Solomon Gulch Hydroelectric Project:Tne ongoing construction of <strong>the</strong> Solomon Gulch hydroelectric project oy<strong>the</strong> <strong>Copper</strong> Valley Electric Association (CVEA), is due to be completed inlate <strong>1981</strong>. Tnis 12 MW plant (including transmission line) is expected tocost in excess of $61,000,000 upon completion. The project has helped todecrease unemployment resulting from <strong>the</strong> post-pipeline wind-down.Approximately 35 percent of <strong>the</strong> project's total cost has gone to labor,generating aoout 100 full-time jobs over <strong>the</strong> construction period. Inaddition, two permanent positions will be created.£:.~~h i ~l~ :The <strong>Valdez</strong> fishing fleet is haroored in a 10-acre boat harborconstructed by <strong>the</strong> Corps of Engineers in 1965. The fleet consists of 25vessels averaging 40 feet in length. Primary target species includesalmon, herring, shrimp, <strong>and</strong> crab. In recent years <strong>the</strong> <strong>Valdez</strong> fishingindustry has provided an average of 77 seasonal joos to <strong>the</strong> community.Until recently <strong>the</strong> town had no processing capacity of its own.Historically, fishermen SOld <strong>the</strong>ir catch to canneries in Cordova <strong>and</strong>Seward. This practice changed in February of 1979 when Farm <strong>and</strong> Sea ofAlaska established a processing plant at <strong>Valdez</strong>. Tne facility h<strong>and</strong>lesfish as well as shrimp <strong>and</strong> crab. All products are frozen ra<strong>the</strong>r thancanned. Statistics concerning capacity or annual output are not readilyavailable. However, it is known that <strong>the</strong> plant cannot process <strong>the</strong> localcatch single-h<strong>and</strong>edly <strong>and</strong> sales to Seward <strong>and</strong> Cordova continue. Farm <strong>and</strong>Sea of Alaska employed about 100 people in <strong>Valdez</strong> during <strong>the</strong> peak of <strong>the</strong>1979 salmon season.Port of <strong>Valdez</strong>:By Alaskan stanaards, <strong>Valdez</strong> continues to be a significant port (evenexclusive of pipeline activity). The volume of waterborne commerce, bothpreceding <strong>and</strong> following <strong>the</strong> pipeline boom, is depicted in tne followingtable. Petroleum based products are shown separately <strong>for</strong> clarification.10
ALYESKA PIPELINE TERMINAL
Tao1e 1Port of <strong>Valdez</strong> Waterborne Commerce (Tons)*Year Petroleum Based Oth~r Freight Total1972 247,801 5,704 253,5051973 293,885 7,191 301,0761974 273,516 84,451 356,9671975 412,420 242,094 654,5141976 403,029 104,643 507,6721977 10,653,755 13,217 10,666,972* Waterborne Commerce of <strong>the</strong> U.S.As can be seen, petroleum based products represent <strong>the</strong> bulk of porttraffic. This is a pattern dating back to <strong>the</strong> early 1960's. Fur<strong>the</strong>rexamination reveals that this is primarily <strong>the</strong> result of <strong>the</strong> region'selectricity dem<strong>and</strong> which is met by diesel-fired generation. Postpipelinedata indicates that <strong>the</strong> level of nonpetro1eum related commercehas been permanently increased. This finding cannot be positivelyverified <strong>for</strong> <strong>the</strong> lack of more recent data. However, populationstatistics offer strong supporting evidence.Citizens of <strong>Valdez</strong> have long expressed interest in reviving <strong>the</strong> city'srole as a major deep water port. To some extent this goal will berealized given <strong>the</strong> export of seafood products by Farnl <strong>and</strong> Sea of Alaska<strong>and</strong> refined petroleum from <strong>the</strong> soon to be installed ALPETCO plant.(ALPETCO's capacity will oe far in excess of local needs.) In anticipationof <strong>the</strong>se <strong>and</strong> o<strong>the</strong>r events, <strong>Valdez</strong> voters approved in April 1979,by a margin of almost 5 to 1, <strong>the</strong> sale of $48 million in generalooligation bonds to improve <strong>the</strong> Port of <strong>Valdez</strong>. The groundbreakingceremonies <strong>for</strong> this undertaking were held on 16 August 1980. Portexpansion will generate an average of 33 jobs over a period of 2 years.In addition, 20 permanent positions will oe created.ALPETCO:On 9 September 1980, groundbreaking ceremonies were held in <strong>Valdez</strong> <strong>for</strong><strong>the</strong> Alaska Petrochemical Company (ALPETCO) refinery. Originally thisrefinery was to have a daily capacity of 150,000 barrels <strong>and</strong> includepetrochemical as well as refining capaoi1ity. Under this plan, <strong>the</strong> plantwould have employed a construction work <strong>for</strong>ce averaging 1,127 persons permonth <strong>for</strong> 42 months <strong>and</strong> direct permanent employment <strong>for</strong> 1,180 persons.The plant currently under construction has been revised downward somewhat<strong>and</strong> is planned strictly as a 100,000 barrel per day refinery. Theconstruction work <strong>for</strong>ce is expected to average 940 persons per month <strong>for</strong>42 months. Permanent employees are expected to number 720 with anincremental population growth of 1,290. That figure does not include <strong>the</strong>additional population growth associated with support facilities <strong>for</strong> thiswork <strong>for</strong>ce. This undertaking is by far <strong>the</strong> largest economic event tooccur since <strong>the</strong> pipeline. The total cost is expected to exceed $1.25billion. Labor costs <strong>for</strong> <strong>the</strong> construction work <strong>for</strong>ce alone will totalapproximately $220,000,000. The payroll <strong>for</strong> <strong>the</strong> operations personnelwill approach $11,600,000 per year.12
O<strong>the</strong>r Activities:Nonseasonal stable sources of employment in <strong>Valdez</strong> include, but arenot 1 imited to:1. A State Highways District Headquarters employs approximately 160people.2. Harborview De~elopment Center, which cares <strong>for</strong> <strong>the</strong> State'smentally retarded, employs about 130 people.3. Alyeska Marine Terminal employs an estimated 280 full-timeemployees.4. Tne new U.S. Coast Guard Station located in <strong>Valdez</strong> is manned byapproximately 25 personnel.smploxment_Overview:Table 2 shows employment in <strong>Valdez</strong> by industry <strong>for</strong> <strong>the</strong> years 1968 <strong>and</strong>1978. It should be noted that <strong>the</strong> increased employment from <strong>the</strong> ALPETCOproject alone (not considering support facilities) will nearly double <strong>the</strong>total employment figure <strong>for</strong> 1978. A declining relative role <strong>for</strong>government is also apparent.13
Table 2Employment EstimatesCity of <strong>Valdez</strong> 1968 <strong>and</strong> 19781968 1978 1978 (Part-time)Industry Number Percent Number Percent NumberMining 0 0 0Construction 15 4.7 209 15.8 15Manufacturing 10 3. 1 0 0Transportation* 35 2 715 4.7 283 21.4 17Communication &Utilities 35 2.7 8I\Iholesale Trade 8 2.5 6 .5 2Reta il Trade 23 7.2 218 16.5 77Finance, Insurance,Real Estate 3 .9 28 2. 1 6Services 26 8. 1 102 7.7 69Government 220 68.8 404 30.6 34TOTAL 320 100.0 1,320 100.0 228*Transportation, communications <strong>and</strong> ut il it ies combined in 1968 data.1968 data source: Alaska Department of Economic Development (nowCommerce <strong>and</strong> Economic Development), St<strong>and</strong>ard Industrial Survey of <strong>Valdez</strong>,1969.1978 data source: City of <strong>Valdez</strong>, Overall Economic Dev~lopm~nt Plan,June 1978.Population:- --- -----Tne population <strong>and</strong> employment mix of <strong>Valdez</strong> has grown in accordancewith <strong>the</strong>se developments. Table 3 indicates <strong>the</strong> population of <strong>Valdez</strong> at<strong>the</strong> close of each decade since 1900 with selected years <strong>for</strong> <strong>the</strong> early tolate 1970's. The influence of pipeline construction over <strong>the</strong> last decadeis quite apparent. From a town of just over 1,000 people in 1970, <strong>Valdez</strong>grew to a peak of some 8,000 inhabitants in 1976. By 1978 constructionactivity had receded <strong>and</strong> <strong>the</strong> population stabilized at 4,481 as certifiedby <strong>the</strong> Alaska Department of Community <strong>and</strong> Regional Affairs. There isSOllie evidence (oased on school enrollment, occupied dwellings, etc.) that<strong>the</strong> population has declined somewhat since. In keeping with o<strong>the</strong>r recentstudies concerning <strong>Valdez</strong>, a 1979 base population of 3,500 has beenadopted <strong>for</strong> this document.14
Table 3Historical Population of <strong>Valdez</strong>1900 3511920 4661930 4421940 529 ( 1 )1950 5541960 5551970 1,0081972 1,1061973 1,7601974 2,2711975 6,670 (2 )1976 8,2531977 7,4831978 4,4811979 3,500-------(1) Source - U.S. Census(2) Source - City of <strong>Valdez</strong> <strong>and</strong> U.S. Census aata utilizea <strong>for</strong> RevenueSharing.The <strong>Copper</strong> <strong>River</strong> <strong>Basin</strong>:Approximately 110 miles from <strong>Valdez</strong>, near <strong>the</strong> intersection of <strong>the</strong>Glenn <strong>and</strong> Richardson Highways, lies Glennallen, <strong>the</strong> next largestpopulation center in this region of <strong>the</strong> study area. Numerous villagesdot <strong>the</strong> highway leading from <strong>Valdez</strong> to Glennallen <strong>and</strong> radiating to <strong>the</strong>north <strong>and</strong> west of Glennallen. The largest of <strong>the</strong>se conrnunities is <strong>Copper</strong>Center. <strong>Copper</strong> Center is located south of Glennallen on Mile 103 of <strong>the</strong>Richardson Highway. O<strong>the</strong>r villages include (but are not limited to)<strong>Copper</strong>vi11e. Gu1kana. Gakona. Chistochina. Paxson. Taz1ina. To1sona.Ne1china, Eureka. Tonsina, Ernestine, Kenny Lake, Old Edgerton Cutoff,<strong>and</strong> Chitina. Like <strong>Copper</strong> Center, <strong>the</strong>se settlements are unincorporatedvillages within an unorganized borough.History:Historically. <strong>Copper</strong> Center <strong>and</strong> Chitina are <strong>the</strong> more significantsettlements of <strong>Copper</strong> <strong>River</strong> region. Unlike <strong>Valdez</strong>, Native Alaskans havebeen known to occupy tne area <strong>for</strong> at least 5,000 years. Rich copperdeposits were discovered at <strong>the</strong> turn of <strong>the</strong> century along <strong>the</strong> nor<strong>the</strong>rnflanKs of <strong>the</strong> Chitina <strong>River</strong> Valley, bringing an onrush of prospectors <strong>and</strong>settlers to <strong>the</strong> region. The <strong>Copper</strong> <strong>River</strong> <strong>and</strong> Northwestern Railroad wasbuilt in 1908 to accommodate <strong>the</strong> growing traffic of are, supplies, <strong>and</strong>15
passengers. But Chitina·s prominence was short-lived. By 1939 <strong>the</strong>principal mines ana <strong>the</strong> railroad were closed, <strong>and</strong> virtually all sourcesof support moved to <strong>Copper</strong> Center <strong>and</strong> emerging Glennallen.The present settlement of <strong>Copper</strong> Center developed from a trading postestablished in 1896. Hundreds of gold rushers passed through <strong>the</strong> area in1898--1899 on <strong>the</strong>ir way to <strong>the</strong> Klonaike fields; many stayed on to prospectin <strong>the</strong> <strong>Copper</strong> <strong>River</strong> <strong>Basin</strong>. A telegraph station was set up in <strong>Copper</strong>Center by tne U.S. Army in 1901.More recent activities in tne basin include construction of <strong>the</strong> Glenn<strong>and</strong> Richardson Highways, <strong>and</strong> <strong>the</strong> Trans-Alaska Pipeline. Highwayconstruction intne late 1930·s <strong>and</strong> early 1940·s made <strong>the</strong> region moreaccessible to o<strong>the</strong>r more populated parts of <strong>the</strong> State. Settlement anaexpansion since <strong>the</strong>n has paralleled <strong>the</strong> road. Tne Trans-Alaska Pipelinehad massive but predominately temporary impacts in <strong>the</strong> <strong>Copper</strong> <strong>River</strong><strong>Basin</strong>. However, like <strong>Valdez</strong> this project tended to leave <strong>the</strong> area on ahigher plateau of population <strong>and</strong> economic activity.Iransportatio.!!:Glennallen: By most st<strong>and</strong>ards Glennallen is a very remote ruralcommunity, linked to o<strong>the</strong>r communities only by air <strong>and</strong> road. Like<strong>Valdez</strong>,Glennallen is not endowed with a rail connection. Althoughphysically more distant, Glennallen is only 187 highway miles fromAncnorage, considerably closer than <strong>Valdez</strong>.Otiler communities: In most cases <strong>the</strong> highway <strong>and</strong> small bush airstripsare tne only link to <strong>the</strong> outside <strong>for</strong> minor communities.Highway <strong>and</strong> Pipeline Maintenance:Tne malntenance of tne Glenn <strong>and</strong> Richardson Highways is a basicactivity in <strong>the</strong> region. In addition to <strong>the</strong> work <strong>for</strong>ce originating fromtne State Highway District Headquarters in <strong>Valdez</strong>, 65 persons areemployed in highway maintenance within <strong>the</strong> area. This is also a majorsource of employment <strong>for</strong> tne area's youtn as activity peaks in <strong>the</strong> summer.Pipeline maintenance is one of <strong>the</strong> few permanent occupations left intne aftermath of <strong>the</strong> construction boom. Forty people are engaged in <strong>the</strong>maintenance duties associated with mainline Refrigeration Sites 1, 2, <strong>and</strong>7, Pump Station 11, <strong>and</strong> several remote gate valve locations.Government Services:The <strong>Copper</strong> <strong>River</strong> Bdsin has a variety of government services whichcorrespond to <strong>the</strong> needs <strong>and</strong> population of <strong>the</strong> region. Government <strong>and</strong>municipal occupations inclUde fire fighting, law en<strong>for</strong>cement, education<strong>and</strong> o<strong>the</strong>r social services, <strong>and</strong> natural resource management. There isalso a Federal Aviation Aaministration facility located at GulkanaAirport.16
Transportation <strong>and</strong> Tourism:Detailed in<strong>for</strong>mation concerning tne work <strong>for</strong>ce of <strong>the</strong> <strong>Copper</strong> Valley isnot obtainable. But it is known that <strong>the</strong> non-Native population isengaged primarily in transportation <strong>and</strong> tourism. Tne scenic beauty of<strong>the</strong> area coupled witn hunting, fishing, <strong>and</strong> boating opportunities makethis region a favorite <strong>for</strong> recreation. These activities generate jobs ingas stations, stores, bars, lodges, local trucking firms, wholesale oildistribution, <strong>and</strong> finance. Should <strong>the</strong> city of <strong>Valdez</strong> develop asanticipated, <strong>the</strong> dem<strong>and</strong> <strong>for</strong> <strong>the</strong>se services will undoubtedly be enhanced.This is particularly true in <strong>the</strong> case of transportation.Minjng ~~d_ResourceExtraction:As mentioned, <strong>the</strong> study area is highly mineralized <strong>and</strong> hashistorically been <strong>the</strong> center of extensive mining activity. Currently<strong>the</strong>re are no significant local mining operations. Early in 1980 reportsby State geoloqists sparked interest in <strong>the</strong> region about 60 miles west ofGlennallen. These findings triggered a flurry of gold mining claims.Although that region has yet to yield any significant finds, this episodeis highly illustrative. The <strong>Copper</strong> <strong>River</strong> <strong>Basin</strong> is always a primaryc<strong>and</strong>idate <strong>for</strong> mineral extraction <strong>and</strong> interest in <strong>the</strong> basin rises <strong>and</strong>recedes witn <strong>the</strong> price of gold, silver, <strong>and</strong> copper.The Glennallen vicinity has recently been subject to oil <strong>and</strong> gasexp I or at ion. The AI'~OCO Company in conj unct i on witn AHTNA Inc. has beenconducting test drills since 1979. As yet, no commercial quantities ofoil or gas have been aiscovered. A commercial strike would beparticularly advantageous given Glennallen's proximity to <strong>the</strong>Trans-Alaska Pipeline.Native Corporations:The Native population participates less extensively in <strong>the</strong> area's casheconomy but does enjoy employment opportunities created by three Nativecorporations. Tnese are AHTNA Inc., tne <strong>Copper</strong> <strong>River</strong> Native Association,<strong>and</strong> <strong>the</strong> <strong>Copper</strong> Valley-Tanana Development Corporation. Many villagers(including non-Natives) still rely on hunting, trapping, <strong>and</strong> fishing tosupplement <strong>the</strong>ir cash incomes.Population:The hignly volatile nature of economic development in this area isreflected by its population. Un<strong>for</strong>tunately, population data <strong>for</strong> <strong>the</strong>rlurllerous unincorporated villages of <strong>the</strong> area is limited. Satisfactorydata is expected to be available in <strong>the</strong> 1980 census. However, Table 4depicts <strong>the</strong> populations of Glennallen, <strong>Copper</strong> Center, <strong>and</strong> <strong>the</strong> total <strong>for</strong><strong>the</strong> service region <strong>for</strong> which in<strong>for</strong>mation is available. <strong>Copper</strong> ValleyElectric Association, <strong>the</strong> area's electrical utility, estimates apopulation of 2,500 within <strong>the</strong> Glennallen service area (March 1979).17
Table 4Historical Population ofGlennallen, <strong>Copper</strong> Center, <strong>and</strong> <strong>the</strong> Glennallen Service RegionYear Glennallen <strong>Copper</strong> Center Glennallen Service Region1950 142 901960 169 1511970 363 206 2,090 4/1971 1,8751972 2,3581973 1,8081974 260 3/ 1,5621975 1,070 433 2,9691976 5,5171977 433 2,4221978 2,384197~ 363 2/ 143 2,5001/ Population figures <strong>for</strong> Glennallen <strong>and</strong> <strong>Copper</strong> Center <strong>for</strong> <strong>the</strong> years 1950,T960, 1970, <strong>and</strong> 1975 are taKen from <strong>the</strong> Solomon Gulch Final EIS March 1978.2/ Population data <strong>for</strong> Glennallen <strong>and</strong> <strong>Copper</strong> Center <strong>for</strong> <strong>the</strong> year 1979 isYaken from an October 1979 issue of <strong>the</strong> Tundra Times Energy Special.3/ <strong>Copper</strong> Center data <strong>for</strong> <strong>the</strong> years 1974 <strong>and</strong> 1977 are from <strong>Copper</strong> CentertOlTlrTlunity Profile, July 1977, prepared by <strong>the</strong> University of AlasKa ArcticEnvironmental In<strong>for</strong>mation <strong>and</strong> Data Center.4/ Population Datd <strong>for</strong> <strong>the</strong> Glennallen Service Region derived from UpperSusitna <strong>River</strong> Project <strong>Power</strong> Market Analyses, March 1979, Alaska <strong>Power</strong>Administration.EXISTING SYSTEM AND FUTURE NEEDS<strong>Copper</strong> Valley Electric Association (CVEA) is <strong>the</strong> sole electric utility in<strong>the</strong> study area. Currently CVEA relies entirely on diesel-fired generators toserve <strong>the</strong> stuay area Dependence on diesel generation will De noticeablyreduced upon completion of <strong>the</strong> Solomon Gulch hydroelectric project. ThisproJect also includes a transmission line intertie between <strong>Valdez</strong> <strong>and</strong>Glennallen which will allow <strong>the</strong> utility to operate more efficiently under asingle system. Tne area's nistorical, current, <strong>and</strong> projected power dem<strong>and</strong> ispresented in detail in Appendix B of this document.CONDITION IF NOFEDERAL ACTION TAKENWithout Federal action, diesel generation will be required to meet systemdem<strong>and</strong>s above <strong>the</strong> output of Solomon Gulch. Even if <strong>the</strong> proposed pressurereducing turbine (PRT) is installed, CVEA will be <strong>for</strong>ced to return to dieselgeneration in <strong>the</strong> late 1980's. A more detailed explanation of <strong>the</strong> PRT isincluded under <strong>the</strong> section "Assessment <strong>and</strong> Evaluation of Alternative PlanElements."18
The following tables show <strong>the</strong> future use of diesel generation which wouldoccur if no Federal action is taken. Both tables reflect <strong>the</strong> addition of <strong>the</strong>Solomon Gulch hydroelectric project in <strong>1981</strong>. Table 5 assumes additionalgeneration would come from diesel, Table 6 assumes tne PRT would beconstructed.Table 5Projected Energy Generation of CVEA Without PRTTotal Load Hydro DieselYear (gwh) (gwh) (gwh)1980 47.9 0 47.91985 77.5 38.6 38.91990 97.6 38.6 59.01995 123.0 38.6 84.42000 146.0 38.6 107.4Table 6Projected Energy Generation of CVEA With PRTTotal Load Hydro PRT DieselYear (gwh) (gwh) (gwl1) (gwh)1980 47.9 0 0 47.91985 77.5 38.6 38.9 01990 97.6 38.6 52.0 7.61995 123.0 38.6 * 52.0 32.42000 146.0 38.6 ** 52.0 55.4*This figure represents 80 percent of <strong>the</strong> total energy possible based ona flow of 1.5 million uarrels per day (<strong>the</strong> current flow is 1.5 MBD withno plans <strong>for</strong> increase to <strong>the</strong> 2 MBD capacity).**Based on known oil reserves, <strong>the</strong> useful life of <strong>the</strong> project may endbe<strong>for</strong>e <strong>the</strong> year 2000; however, additional discoveries may be made,extending <strong>the</strong> life of <strong>the</strong> pipeline.The preceding tables correspond to Figures 2 <strong>and</strong> 3 on <strong>the</strong> section"Comparison of Detailed Plans."For purposes of simplification <strong>and</strong> more direct comparability to <strong>the</strong>hydropower alternatives, additional diesel generation, as evaluated by<strong>the</strong> Federal Energy Regulatory Commission, is assumed. This alternativeis <strong>the</strong> economic st<strong>and</strong>ard against which each of <strong>the</strong> hydropower plans aretested. Tnat is, <strong>the</strong> power benefits of a given hydropower systemrepresent <strong>the</strong> cost of producing <strong>the</strong> same amount of power by constructing<strong>and</strong> operating a conventional state-of-<strong>the</strong>-art diesel generation system.The Federal Energy Regulatory Commission determined that <strong>the</strong> appropriate19
diesel plant at <strong>Valdez</strong>-<strong>Copper</strong> Valley consists of a 2,625 kW unit with aheat rate of 9,370 BTU/kWh. The capital cost is estimated at $710 per kWwith a service life of 35 years.PROBLEMS, NEEDS AND OPPORTUNITIESGiven existing <strong>and</strong> planned generation, this community will be <strong>for</strong>cedto continue its reliance on diesel generation if <strong>the</strong> load requirementsgrow as anticipated. To rely on diesel fuel is to expose <strong>the</strong> communityto <strong>the</strong> likelihood of extremely high cost power. Fur<strong>the</strong>r, reliance ondiesel power is contrary to present State <strong>and</strong> National energy policy.The <strong>Valdez</strong> area has <strong>the</strong> unique potential to utilize oil flow from <strong>the</strong>pipeline in addition to nearDy hydropower potential. Tne opportunity ofdeveloping <strong>the</strong>se resources should De pursued.PLANNING CONSTRAINTSSelection of <strong>the</strong> Dest plan from among <strong>the</strong> range of alternativesinvolves evaluation of <strong>the</strong>ir comparative per<strong>for</strong>mance in meeting <strong>the</strong> studyoDJectives as measured against a set of evaluation criteria. Thesecriteria derive from law, regulations, <strong>and</strong> policies governing waterresource planning <strong>and</strong> development.Tecnnical criteria require that power generation development, from anysource or sources, be of appropriate scale to satisfy <strong>the</strong> projectedenergy needs, <strong>and</strong> tnat tne plan be technically feasible.Economic criteria specify that <strong>the</strong> power must be marketable. PlanDenefits should exceed <strong>the</strong> costs to <strong>the</strong> maximum extent possible, <strong>and</strong> eachseparable plan feature must provide benefits at least equal to its cost.The benefits arid costs are expressed in comparable quantitative terms to<strong>the</strong> fullest extent possible. Annual costs <strong>and</strong> benefits are based on a100-year period of analysis, an interest rate of 7-3/8 percent, <strong>and</strong>October 1980 price levels. <strong>Power</strong> benefits are based on providingequivalent output by means of <strong>the</strong> least costly, most likely alternative,in this case diesel-electric generating plants.Environmental criteria require <strong>the</strong> identification of impacts to <strong>the</strong>natural <strong>and</strong> human environment. Adverse environmental effects should beminimized <strong>and</strong> measures taken to protect or enhance existing environmentalvalues.Otner criteria specify that plans be <strong>for</strong>mulated with consideration <strong>for</strong>social well-being <strong>and</strong> regional development. Consideration was given to<strong>the</strong> pOSSiDility of enhancing or creating recreational values, to <strong>the</strong>effects on personal income, employment, <strong>and</strong> population, to <strong>the</strong> effects oncultural <strong>and</strong> archeological resources, <strong>and</strong> to <strong>the</strong> conservation ofnonrenewable resources.PLANNING OBJECTIVESThe stUdy oDJectives are derived from <strong>the</strong> problems <strong>and</strong> needs that arespecific to <strong>the</strong> study area <strong>and</strong> can be reasonably addressed within <strong>the</strong>20
framework of <strong>the</strong> study authority <strong>and</strong> purpose.selected <strong>for</strong> tnis study are:The planning objectivesTo meet tne intermediate <strong>and</strong> long term electrical energy needs of tne<strong>Valdez</strong>-Glennallen area.To preserve, conserve, or ennance fish <strong>and</strong> wildlife in tne study area.To reduce, to <strong>the</strong> greatest extent possible, <strong>the</strong> study area's <strong>and</strong> <strong>the</strong>ndtion's depenaence upon petroleum products as a source of energy,particularly <strong>for</strong> producing electricity.21
FORMULATION OF PRELIMINARY PLANSA number of possible solutions exist which could aid in <strong>the</strong>availability of power <strong>and</strong> energy in <strong>the</strong> future <strong>for</strong> <strong>the</strong> study area.Outlined below are <strong>the</strong> various alternatives considered, with a briefstatement about each.No Growth:"No growtn" is an alternative future scenario, not a "plan" per se.It appears here to indicate one possible outcome in <strong>the</strong> absence ofadd it i ona 1 power deve 1 opment. Tne opt i on of a no growth economy in tne<strong>Valdez</strong>-Glennallen area is no longer a realistic prospect. The pastconstruction of <strong>the</strong> Trans-AlasKa Oil Pipeline <strong>and</strong> tanKer terminal, <strong>the</strong>ongoing construction of <strong>the</strong> Solomon Gulch hydroelectric project <strong>and</strong>transmission line to Glennallen, oil exploration in <strong>the</strong> <strong>Copper</strong> <strong>River</strong><strong>Basin</strong>, ongoing expansion of <strong>the</strong> port facilities at <strong>Valdez</strong>, <strong>and</strong> <strong>the</strong>proposed Alaska Petrochemical Company plant speaK <strong>for</strong> <strong>the</strong>mselves as to<strong>the</strong> validity of a no growth option.Conservation:Conservation is beginning to play an important role in future energyneeds <strong>for</strong> <strong>the</strong> study area. New commercial <strong>and</strong> residential structures areincorporating better insulation <strong>and</strong> energy saving systems into <strong>the</strong>irconstruction. The Alaska <strong>Power</strong> Administration has taKen into accountconservation measures <strong>and</strong> increasingly efficient use of energy in itsload projections. However, conservation of electricity beyond thatanticipated by APA would require massive ef<strong>for</strong>ts. Until a st<strong>and</strong>ardizedapproach is taken to ei<strong>the</strong>r strongly encourage or require energyconservation, an accurate assessment of its impact will be difficult toascertain. A more detailed discussion of conservation appears as <strong>the</strong>nonstructural alternative in <strong>the</strong> following section.Coa 1:Although coal is <strong>the</strong> most abundant fossil fuel in <strong>the</strong> nation, no knownsizable coal resources are in <strong>the</strong> <strong>Valdez</strong> area. The Matanuska coal fieldon <strong>the</strong> Glenn Highway is <strong>the</strong> closest known site. It was in operation anumber of years ago <strong>for</strong> a relatively short period. In general <strong>the</strong> coalbeas were too tnin <strong>and</strong> impure to be economically mined. Additionalfields include <strong>the</strong> Healy field on <strong>the</strong> Parks Highway which is currently inoperation <strong>and</strong> <strong>the</strong> Beluga field northwest of CooK Inlet which is notdeveloped. The primary obstacle to be overcome is <strong>the</strong> cost oftransportation to tne <strong>Valdez</strong>-Glennallen area. In addition to this, <strong>the</strong>problems with meeting air quality st<strong>and</strong>ards, <strong>and</strong> <strong>the</strong> associatedenvironmental impacts of strip mining dO not make this an attractivealternative <strong>for</strong> <strong>the</strong> study area.22
Nucl ear:Nuclear energy development is not seen as a likely alternative <strong>for</strong> <strong>the</strong>study area. The relatively large size of a nuclear powerplant, <strong>the</strong>prooaoility of a major earthquake in <strong>the</strong> area, <strong>the</strong> growing nationalsentiment against <strong>the</strong>m, <strong>and</strong> <strong>the</strong> existence of o<strong>the</strong>r viable alternativeshas precluded this alternative from fur<strong>the</strong>r investigation.Natural Gas:Natural gas is not considered a viable alternative <strong>for</strong> <strong>the</strong> studyarea. Although it has oeen used in <strong>the</strong> Anchorage area, <strong>Valdez</strong> <strong>and</strong>Glennallen lacK <strong>the</strong> necessary transportation facilities makingfeasibility dOUbtful. Fur<strong>the</strong>rmore, national priorities may preclude itsuse <strong>for</strong> electrical energy production on a nationwide level in <strong>the</strong> nearfuture.Oil :The study area currently relies entirely on diesel-fired electricalgeneration. The completion of <strong>the</strong> Solomon Gulch hydroelectric projectwill be <strong>the</strong> first opportunity to break away from <strong>the</strong> grip of escalatingfuel costs. In <strong>Valdez</strong> <strong>and</strong> Glennallen respectively, <strong>the</strong> cost of dieselhas increased from 41.3¢ <strong>and</strong> 44.4¢ per gallon in January 1979 to 79.2¢<strong>and</strong> 84.3¢ per gallon in April 1980. As of Feoruary <strong>1981</strong> <strong>the</strong>se costsstood at $1.00 <strong>for</strong> <strong>Valdez</strong> <strong>and</strong> $1.02 <strong>for</strong> Glennallen. Even with <strong>the</strong>sefactors in mind, diesel generation is still seen as <strong>the</strong> short rangesolution. However, with adequate planning, it will be possible togreatly limit <strong>the</strong> use of diesel fuel. This will be of great benefit to<strong>the</strong> study area as well as fulfilling <strong>the</strong> State <strong>and</strong> Federal policies <strong>for</strong>utilization of renewable resources.Geo<strong>the</strong>rmal:Geo<strong>the</strong>rmal resources could eventually provide significant powergeneration in Alaska. The southcentral railbelt area has sUbstantialgeo<strong>the</strong>rmal potential primarily in <strong>the</strong> Wrangell Mountains; however thisarea has been included in <strong>the</strong> new Wrangell-St. Elias National Park. Dueto this change in l<strong>and</strong> status fur<strong>the</strong>r stUdy of this alternative is notdeemed justified <strong>for</strong> this report.Solar:The radiant heat of <strong>the</strong> sun is ano<strong>the</strong>r renewable source of energy thathas potential <strong>for</strong> generating power. Use of solar energy to produceelectrical power on a large scale is not presently feasible due to <strong>the</strong>lack of technology to generate <strong>and</strong> store large amounts of electricityproduced by <strong>the</strong> sun's radiation. The most successful methods <strong>for</strong>capturing <strong>the</strong> sun's rays have been through active <strong>and</strong> passive solar.heating. However, feasioility <strong>for</strong> heating may be limited in <strong>the</strong> <strong>Valdez</strong>23
area due to a high incidence of cloud cover. The Glennallen area mayhold more promise, out it will also De limited due to reduced sunlight in<strong>the</strong> winter. There<strong>for</strong>e, additional study of this alternative has not beenundertaken.Wind:Research <strong>and</strong> development proposals <strong>for</strong> wind generators should improvefuture capaoilities of wind-powered electrical generating systems. Withincreased diesel fuel costs, wind-generated electrical power is a possiolea lternat i ve power source <strong>for</strong> remote areas of <strong>the</strong> State with sma 11loads. However, wind is not currently felt to De a viable alternative<strong>for</strong> <strong>the</strong> study area. Wind is very difficult to adapt to present energydem<strong>and</strong>s because it is unpredictable <strong>and</strong> erratic. To effectively utilizewind energy, winds must De of sufficient speed <strong>and</strong> long duration. Asfur<strong>the</strong>r developments are made in wind power, it may prove feasiole tofeed electricity into a grid system displacing o<strong>the</strong>r expensive <strong>for</strong>ms ofenergy; however, st<strong>and</strong>oy capacity would still be required <strong>for</strong> calmperiods.Tidal:The Port of <strong>Valdez</strong> might be developed <strong>for</strong> tidal energy. The meanlower low water elevation is 0.00 feet <strong>and</strong> <strong>the</strong> mean higher high water is12.00 feet, which would provide a total gross head of 12 feet. However,such an installation would require a low dam spanning <strong>the</strong> width of <strong>the</strong><strong>Valdez</strong> Narrows (a massive cost item in itself) as well as a deep draftlock system to allow supertankers into <strong>the</strong> Port of <strong>Valdez</strong>. The dam wouldchange <strong>the</strong> entire flow regime of <strong>the</strong> Port of <strong>Valdez</strong> with a significantpotential <strong>for</strong> extensive adverse effects on major ecosystems. Fur<strong>the</strong>rstudy of this alternative is not deemed justified <strong>for</strong> this report.Wood:Wood fuel, as an energy source <strong>for</strong> <strong>the</strong> load center, is limited bylocal availaoility, transportation costs, <strong>and</strong> environmental considerations.The region surrounding both Glennallen <strong>and</strong> <strong>Valdez</strong> is <strong>for</strong>ested;however, in terms of ooard feet <strong>and</strong> sustained yield this resource isnoncommercial. Fur<strong>the</strong>rmore, <strong>the</strong> legal status of much of this l<strong>and</strong> isei<strong>the</strong>r unresolved or prohioited to logging. Realistically, <strong>the</strong> <strong>for</strong>estreserves of sou<strong>the</strong>ast Alaska would have to be utilized if wood were tomake a significant contribution to <strong>the</strong> region's power load. But likecoal, <strong>the</strong> primary oostacle ;s <strong>the</strong> cost of transportation to <strong>the</strong><strong>Valdez</strong>-Glennallen area. O<strong>the</strong>r prohioitive factors include strongcompetition to maintain this resource in higher uses such as lumber,pulp, paper, <strong>and</strong> environmental concerns associated with <strong>the</strong> large scaleharvesting, <strong>and</strong> incineration of timoer. At best, it is concluded thatwood can make a modest energy contrioution to <strong>the</strong> community, most likelythrough increasing private suostitution of wood heat <strong>for</strong> oil heat. Suchfactors are considered in <strong>the</strong> discussion on conservation <strong>and</strong> <strong>the</strong> Alaska<strong>Power</strong> Administration's marketaoility analysis.24
lntertie:With <strong>the</strong> deciSlon by <strong>the</strong> <strong>Copper</strong> Valley Electric Association toconstruct <strong>the</strong> transmission line between Glennallen <strong>and</strong> <strong>Valdez</strong>, <strong>the</strong>opportunity exists to intertie this area with Anchorage-Fairbanks areavia <strong>the</strong> Glenn Highway. This POSsibility was considered under <strong>the</strong> Alaska<strong>Power</strong> Administration's (APA) 1978 Upper Susitna Project <strong>Power</strong> MarketAnalysis. Based on <strong>the</strong> load growth assumptions <strong>and</strong> costs at that time,transmission costs were estimated at 3.3 cents/kWn. However,reevaluation based on 1980 price levels <strong>and</strong> revised load <strong>for</strong>casts showtnat tne cost per kWn nas significantly increased. A more detaileddiscussion of this alternative appears in <strong>the</strong> following section.So 1 i d Wa s t e :<strong>Power</strong> generation from solid waste has severely limited prospects in<strong>the</strong> study area. Typically, successful solid waste operations are locatedin regions of hign population density where economies of scale pennit <strong>the</strong>efficient ga<strong>the</strong>ring, transport, <strong>and</strong> incineration of solid waste. Inaddition, sucn operations playa dual role by relieving populationcenters of solid waste, a less acute consideration <strong>for</strong> smallercommunities. The <strong>Valdez</strong>-Glennallen region does not produce a sufficientvolume of solid waste to enable practicable power generation. This iseviaenced oy similar findings in a recent study made <strong>for</strong> <strong>the</strong> Municipalityof Anchorage. Although <strong>the</strong> burning of solid waste on an individual basismay have some substitution potential <strong>for</strong> heating, it is not expected tobe a significant factor during <strong>the</strong> <strong>for</strong>ecast period.Oil Pipeline Turbine:- - - --A pressure reducing turbine (PRT) has been proposed <strong>for</strong> installationin <strong>the</strong> Trans-Alaska Oil Pipeline. This turbine would produce electricityby taking advantage of tne nead drop as <strong>the</strong> pipeline descendS TnompsonPass. This project, as originally conceived, would have an installedcdpacity of 9 MW Dased on <strong>the</strong> pipeline design flow of 2 million barrelsper day <strong>and</strong> would produce approximately 63,000 MWH of energy per year.However, tne pipeline is currently pumping at about 1.5 MBD <strong>and</strong> tnere areno plans to increase this in tne future. Based on this output <strong>the</strong> PRTWOUld produce approximately 7.4 MW of power <strong>and</strong> 52,000 MWH per year ofenergy. These figures are based on a plant factor of 0.8.Hydroelectric <strong>Power</strong>:A large number of potential hydroelectric sites are available in <strong>the</strong>study area; however, most have been eliminated due to size, location, orenvironmental proulems.The Stage II report, completed in April 1978, considered sites in <strong>the</strong><strong>Valdez</strong> area only. Sites considered included Gold Creek, Sheep Creek,Wortmann Creek, Silver Lake, Solomon Gulch, Allison Lake, Unnamed Creek,Mineral Creek, <strong>and</strong> Lowe <strong>River</strong>. Of <strong>the</strong>se only Solomon Gulch <strong>and</strong> AllisonCreek demonstrated tentative feasibility.25
With <strong>the</strong> construction of Solomon Gulch by <strong>Copper</strong> Valley ElectricAssociation, only Allison CreeK was left as a viable alternative <strong>for</strong>future nydropower generation. However, since <strong>the</strong> decision was made toconstruct <strong>the</strong> transmission line to Glennallen, <strong>the</strong> POSsibility existedthat otner sites near tne transmission line corridor could be availableto serve <strong>the</strong> increased needs of <strong>the</strong> exp<strong>and</strong>ed service area.Although a number of sites are available, all sites east of <strong>the</strong> <strong>Copper</strong><strong>River</strong> have been eliminated from fur<strong>the</strong>r consideration. With <strong>the</strong>establishment of <strong>the</strong> Wrangell-St. Elias National Park, development of ahydroelectric project would be incompatible with its current status.Some of <strong>the</strong> drainages affected include Tebay Lakes, Bremmer <strong>River</strong>,Kotsina <strong>River</strong>, Chitina <strong>River</strong>, Kennicott <strong>River</strong>, <strong>and</strong> Nizina <strong>River</strong>.O<strong>the</strong>r potential sites within <strong>the</strong> study area that were evaluated areTsina <strong>River</strong>, Tiekel <strong>River</strong>, Tonsina <strong>River</strong>, <strong>and</strong> K1utina <strong>River</strong>. Of <strong>the</strong>se,Tsina <strong>River</strong> <strong>and</strong> <strong>the</strong> Tieke1 <strong>River</strong> sites would provide less than 2,000 MWH<strong>and</strong> 10,000 MWH of firm annual energy respectively. Both sites wouldrequire lOa-foot dams. Based on a 50 percent plant factor, <strong>the</strong> installedcapacity <strong>for</strong> Tsina <strong>River</strong> Would be only 425 kW. Installed capacity <strong>for</strong><strong>the</strong> Tieke1 <strong>River</strong> would be about 2,200 kW. Nei<strong>the</strong>r of <strong>the</strong>se projectswould provide significant energy or capacity to contribute to <strong>the</strong>combined loads of <strong>Valdez</strong> <strong>and</strong> Glennallen. Due to <strong>the</strong>ir small size <strong>and</strong> <strong>the</strong>great expense of tne required dam to achieve such a limited amount offirm energy, <strong>the</strong>se projects have been dropped from fur<strong>the</strong>r consideration.A 35-foot dam on <strong>the</strong> Tonsina <strong>River</strong> could provide almost 2,500 kW ofcapacity (50 percent P.F.) <strong>and</strong> 10,700 MWH of firm annual energy.However, to realize this potential a penstock nearly 6 miles in lengthwould be required. The environmental impact of diverting <strong>the</strong> riverthrough <strong>the</strong> penstock <strong>and</strong> effectively drying up <strong>the</strong> stream during much of<strong>the</strong> year would be totally unacceptable from an environmental st<strong>and</strong>point.The Tonsina drainage is a productive salmon stream <strong>and</strong> no1ds significantnumbers of sockeye, chinook, <strong>and</strong> coho. Due to <strong>the</strong> environmental concernsalld <strong>the</strong> relatively small amount of energy available this alternative hasbeen eliminated from fur<strong>the</strong>r consideration at this time.A project on <strong>the</strong> Klutina <strong>River</strong> could produce an estimated 75,000 MWHof firm annual energy with an installed capacity of almost 17 MW. Thisproject would require approximately 6,700 feet of 16-foot diameterpenstock to develop 90 feet of head available from a 50-foot dam. Aswitn <strong>the</strong> Tonsina site, this development would adversely affect tneproductive lake <strong>and</strong> river system which supports excellent runs ofSockeye, chinook, <strong>and</strong> coho salmon. Tne lake is of major importance tosockeye runs which utilize lake residence <strong>for</strong> a portion of <strong>the</strong>ir lifecycle. Estirnates from <strong>the</strong> Alaska Department of Fish <strong>and</strong> Game indicatedthat in excess of 73,000 salmon utilize <strong>the</strong> river above <strong>the</strong> potentialdams ite on good years. All of <strong>the</strong>se are ei<strong>the</strong>r chinook or sockeye whichprovide <strong>the</strong> highest price per pound to <strong>the</strong> fishermen of <strong>the</strong> PrinceWi 11 ialll Sound area.26
If <strong>the</strong> powerhouse were moved to just below <strong>the</strong> dam, a firm energyoutput of 32,200 MWH would be realized with an installed capacity of7,340 MW. However, even if this were <strong>the</strong> recommended development,significant impacts on <strong>the</strong> salmon runs could still be expected. Inaddition, <strong>the</strong> dam would inundate critical moose habitat presentlyutilized during winter months. O<strong>the</strong>r major impacts would likely takeplace on <strong>the</strong> black <strong>and</strong> brown Dear populations that utilize this areathroughout <strong>the</strong> spring, summer, <strong>and</strong> fall.ALTERNATIVES WORTHY OF FURTHER CONSIDERATIONThe alternatives which were seen as <strong>the</strong> only viaDle solutions to helpmeet dem<strong>and</strong>s <strong>for</strong> future electrical power generation in <strong>the</strong> study areainclucea diesel-fired generation, conservation, transmission intertie,oil pipeline pressure reducing turbine, <strong>and</strong> Allison Lake Hydro. Adetailed assessment <strong>and</strong> evaluation <strong>for</strong> <strong>the</strong>se alternatives is included in<strong>the</strong> following portion of <strong>the</strong> report.27
ASSESSMENT AND EVALUATION OF ALTERNATIVESTne purpose of this section is to evaluate <strong>the</strong> various alternat',vesthat could be utilized to meet <strong>the</strong> needs of <strong>the</strong> study area. Althougheacn of tnese alternatives is discussed separately, it appears that <strong>the</strong>best overall plan may combine one or more of <strong>the</strong> alternatives. Thesection "Comparison of Detailed Plans" discusses <strong>the</strong> possiblecombinations of alternatives on a comparable basis.DIESELDe s c rip t ion:Tnis alternative is effectively <strong>the</strong> without condition, <strong>the</strong> probablefuture if no Federal, State, or local action were taken to provideelectrical energy through alternative means. There is currently enoughinstalled capacity at Glennallen <strong>and</strong> <strong>Valdez</strong>, when combined with <strong>the</strong> soonto be finished Solomon Gulch hydroelectric, to meet <strong>the</strong> needs of <strong>the</strong>intertied system until <strong>the</strong> mid-1990's.Based upon <strong>the</strong> diesel scenario, between <strong>1981</strong> <strong>and</strong> 2000 CVEA will Deburning an estimated 70 to 75 million gallons; this is based uponexpecteo population <strong>and</strong> industrial increases associated with ALPETCO <strong>and</strong><strong>the</strong> exp<strong>and</strong>ed port facilities.Impact Assesslllent:From an environmental stanapoint <strong>the</strong> impacts of continued use ofdiesel <strong>for</strong> electrical generation are primarily associated with noise <strong>and</strong>air pollution. However, in comparison to o<strong>the</strong>r alternatives, such as <strong>the</strong>transmission intertie, <strong>and</strong> hydropower, <strong>the</strong>se are seen as relativelyminor. Social impacts associated with continuing energy cost escalationare already affecting business, industry, <strong>and</strong> <strong>the</strong> average household.Continued reliance on diesel generation will <strong>for</strong>ce <strong>the</strong> local economy todivert a growing proportion of its resources to electricity generation.Evaluation:<strong>Power</strong> costs associated with this alternative would be directly tied to<strong>the</strong> escalating cost of diesel fuel. As shown in Table 1, Appendix B, <strong>the</strong>cost of fuel increased 136 percent between 1974 <strong>and</strong> 1979, with <strong>the</strong> costof energy increasing 170 percent over <strong>the</strong> same time period. Increasesduring 1980 en<strong>for</strong>ce <strong>the</strong> probability that this trend will continue <strong>for</strong>some time.Besides this economic deterrent, <strong>the</strong> fact that petroleum is a nonrenewableresource of limited quantities dictates that it should beutilized <strong>for</strong> higher priority uses SUCh as transportation. To continue touse diesel fuel <strong>for</strong> energy production when o<strong>the</strong>r alternatives are availaDleis unwise from an economic stanapoint not to mention that it iscontrary to State <strong>and</strong> National policies.28
CONSERVATION:Description:THE NONSTRUCTURAL ALTERNATIVEVarious measures exist which could aid in <strong>the</strong> implementation of energyconservation. Many of <strong>the</strong> steps discussed here are already in effect intne stuay area <strong>and</strong> o<strong>the</strong>r parts of <strong>the</strong> nation. Local measures includeenergy auditing services, a public awareness program, <strong>the</strong> utilization ofwaste heat from diesel-fired generation, <strong>and</strong> <strong>the</strong> preheating of dieselfuel in winter <strong>for</strong> more efficient combustion. State <strong>and</strong> nationwideef<strong>for</strong>ts involve increased tax incentives <strong>and</strong> deductions <strong>for</strong> money spenton conservation measures <strong>and</strong> direct grants or low interest loans <strong>for</strong>conservation. The newly estao1ished energy auditing service conducted by<strong>the</strong> State Division of Energy <strong>and</strong> <strong>Power</strong> Development has provisions <strong>for</strong>grants up to $300 <strong>and</strong> low interest loans up to $5,000 <strong>for</strong> energyconservation purposes.Tnese programs are providing important incentives <strong>for</strong> energyconservation. Their effect on individual energy consumption could besigrlificant in <strong>the</strong> years to come. However, <strong>the</strong> most important gains willbe in <strong>the</strong> reduction of fossil fuels <strong>for</strong> heating, not <strong>for</strong> electricalgeneration. As it now st<strong>and</strong>s space heating in <strong>the</strong> service area isprovided almost entirely by heating oil with wood heat running a distantsecona. There are virtually no structures in <strong>the</strong> region which utilizeelectric space heating (<strong>the</strong> Totem Inn of <strong>Valdez</strong> being a notableexception). The present generation <strong>and</strong> distribution system likewiseaf<strong>for</strong>ds little opportunity <strong>for</strong> added efficiency. The operating measurestaken <strong>for</strong> diesel generation have already been described. Also, it isassumed that <strong>the</strong> retirement of older diesel units will gradually improve<strong>the</strong> efficiency of <strong>the</strong> system. Glennallen's distribution is h<strong>and</strong>led by1/0 ACSR cables (14.4 kV) which currently sustain an 11 percent annualline loss. The distribution system in <strong>Valdez</strong> likewise consists of 1/0ACSR lines (7.2 kV). Although some sections of <strong>Valdez</strong> are serviced bysmaller gage 2 ACSR cables, <strong>the</strong> relatively short distances enable anoverall annual line loss of 8 percent. Officials at CVEA regard <strong>the</strong>irdistribution system as oeing fairly modern <strong>and</strong> efficient. They do notbelieve that improvements to <strong>the</strong> system will yield significantelectricity savings.Possio1e conservation methods that would influence electricalconsumption inclUde pricing decisions <strong>and</strong> incentives, minimum efficiencyst<strong>and</strong>ards ana growth restrictions. One method that would be effective(though not acceptable) is to artifica1ly raise <strong>the</strong> price of electricityto tne level necessary to bring about reduced use. The virtue of thisapproach is that individuals could make <strong>the</strong>ir own decisions on how toreduce tneir consumption oy comparing <strong>the</strong> relative costs <strong>and</strong> merits of<strong>the</strong>ir electric appliances ana consumption habits. Given that this is notpalatable, tne only recourse would be <strong>for</strong> <strong>the</strong> utility to dictate to <strong>the</strong>consumer how to save. This could be done by offering "discounts" <strong>for</strong> offhour usage or to consumers who meet certain efficiency st<strong>and</strong>ards. Suchst<strong>and</strong>ards might entail increased insulation <strong>for</strong> hot water heaters, <strong>the</strong>introduction of microwave ovens, <strong>and</strong> minimum efficiency ratings <strong>for</strong>29
stoves, washers, dryers, <strong>and</strong> o<strong>the</strong>r electric appliances. The utilityCOuld insist on <strong>the</strong>se measures <strong>for</strong> all new customers <strong>and</strong> coordinate moreclosely with builders. More extreme steps might include rate reductions<strong>for</strong> households whicn share certain appliances (e.g. washers/dryers) or<strong>for</strong> households which do without discretionary items sucn as electrichairdryers, toothbrushes, knives, water oed heaters, etc. Finally, <strong>the</strong>community could embark on a policy of severely restricted growth or nogrowth. Puolic users could reduce use <strong>and</strong>/or reschedule <strong>the</strong>ir hours bydirect regulation. These communities might also reexamine <strong>the</strong>ir publicelectricity requirements (e.g. street lighting).Tne total impact of <strong>the</strong>se various measures is very difficult toascertain. Much would depend on <strong>the</strong> responsiveness of individualhouseholds to such a program or conversely, <strong>the</strong> magnitude of <strong>the</strong>incentives. Consumer reports indicate that <strong>the</strong> energy efficiency of someappliances, such as refrigerators <strong>and</strong> dryers can vary as much as 40 .percent, whereas ranges, washers, <strong>and</strong> toasters vary by 15 to 20 percent.Realistically, more efficient appliances would have to be phased in asold appliances are replaced. In addition, it is likely <strong>the</strong> appliancescurrently in use are not woefully inefficient. Thus <strong>the</strong> full savingspossibilities implied by <strong>the</strong>se efficiency variances could not be realizedirrmeoiately. Given a stringent incentive system, <strong>and</strong> considering <strong>the</strong>most typical <strong>and</strong> dem<strong>and</strong>ing household appliances, an electric energysavings of 10 percent over tne <strong>for</strong>ecast period beyond <strong>the</strong> conservationalready predicted to occur is Quite optimistic. This would include gainsfrom reduced pUblic <strong>and</strong> private use as well as efficiency improvements.Evaluation:As mentioned, various conservation n~asures are already in effect onboth State <strong>and</strong> National levels <strong>and</strong> represent <strong>the</strong> most attractive,inlplemental policies. Tnese will undouotably play an 'increasinglyimportant role in future energy conservation <strong>for</strong> <strong>the</strong> study area,particularly <strong>for</strong> heating; however, <strong>the</strong>ir impact on electrical consumptionwill be much more modest. currently, electricity is used primarily <strong>for</strong>horne app'liances, hot water heaters, <strong>and</strong> lighting. Because of this, <strong>the</strong>opportunities <strong>for</strong> reducing electrical consumption are not nearly assignificant as in o<strong>the</strong>r parts of <strong>the</strong> country where electric heating ismore common. Many residents <strong>and</strong> some commercial structures in <strong>the</strong> studyarea nave installed lower wattage light bulbs <strong>and</strong> eliminated unnecessarylighting. There<strong>for</strong>e, it is oelieved that <strong>the</strong> energy conservation assumedin tne Alaska <strong>Power</strong> Administration load <strong>for</strong>ecast gives a reasonableestimation of future dem<strong>and</strong>s including conservation. Although additionalreductions may be possiDle by raising <strong>the</strong> price of electricity above itsactual cost, this method is considered extreme <strong>and</strong> could result in severesoc i a 1 impacts.30
TRANSMISSION INTERTIEDescription_:This alternative consists of a 136-mile transmission line extendingeast from Palmer to Glennallen. The single circuit, 138 kV line wouldallow power to be brought in from <strong>the</strong> Anchorage-Fairbanks area. To provefeasiDle, <strong>the</strong> power transmitted would have to De of a low enough cost tojustify <strong>the</strong> transmission line. This power would probably be produced by<strong>the</strong> proposed Susitna project or possiDly from coal-fired generation. TheavailaDility of inexpensive Cook Inlet gas is fast coming to an end withincreasingly higher prices. This, coupled with recent Federal policychanges regarding <strong>the</strong> utilization of natural gas, eliminates it as aviaDle alternative.The Alaska <strong>Power</strong> Administration's Upper Susitna <strong>Power</strong> Market Analysisestimated <strong>the</strong> total transmission construction cost, including interestduring construction, <strong>for</strong> <strong>the</strong> Palmer- Glennallen intertie at $40,800,000as of OctoDer 1978. Assuming a 10 percent inflation rate of constructioncosts, <strong>the</strong> updated cost estimate <strong>for</strong> OctoDer 1980 is $44,880,000.Assuming <strong>the</strong> <strong>Power</strong> Admini- stration's figure <strong>for</strong> operation, maintenance,<strong>and</strong> replacement, <strong>and</strong> amortizing <strong>the</strong> cost over 100 years at 7-3/8 percent,yields <strong>the</strong> following results:AmortizationOM & RTotal Annual Cost$3,312,000144,000$3,456,000The Federal interest rate was applied to evaluate <strong>the</strong> intertie on acomparaDle basis with <strong>the</strong> o<strong>the</strong>r alternatives. Based on <strong>the</strong> transmissionof 50,000 MWH per year, <strong>and</strong> <strong>the</strong> 7-3/8 percent interest rate, <strong>the</strong> cost perkWh <strong>for</strong> transmission only would be 6.9¢/kWh. This, coupled with <strong>the</strong>current cost of electricty in <strong>the</strong> Anchorage area, would Dring <strong>the</strong> totalcost to approximately 13¢/kWh.Impact Assessment:The long term environmental impacts associated with this alternativewould De primarily visual. Approximately 825 acres would have to becleared along <strong>the</strong> Glenn Highway <strong>for</strong> <strong>the</strong> transmission route. Short termimpacts associated with construction would include <strong>the</strong> prObabledisplacement of various species of wildlife in <strong>the</strong> area.Evaluation:For <strong>the</strong> Palmer-Glennallen intertie to be considered a viablealternative Dased on current price levels, two requirements must be met.One, <strong>the</strong> system must transmit enough energy to bring down <strong>the</strong>transmission cost/kWh to a reasonaDle level, <strong>and</strong> two, a stable,reasonaDle cost source of energy must be made available to transmit.31
Based on <strong>the</strong> most up-to-date load <strong>for</strong>ecast <strong>for</strong> <strong>the</strong> Glennallen-<strong>Valdez</strong>area (including ALPETCO), <strong>the</strong> energy required to meet system dem<strong>and</strong>saoove <strong>the</strong> output of Solomon Gulch is relatively small. This is fur<strong>the</strong>rreduced oy <strong>the</strong> possiole presence of <strong>the</strong> pressure reducing turbine.Besides <strong>the</strong> limited dem<strong>and</strong>, <strong>the</strong> lack of a stable, reasonable costsource in <strong>the</strong> railoelt area tends to eliminate <strong>the</strong> interties as a viablealternative at present. However, if <strong>the</strong> proposed Susitna Project isultimately constructed, it may be able to supply a stably priced energysource. If <strong>the</strong> current studies prove favorable <strong>and</strong> <strong>the</strong> State pursuesFERC licensing <strong>and</strong> construction, current estimates call <strong>for</strong> a Susitnapower on-line date of 1994. Even if this were <strong>the</strong> case <strong>and</strong> power wasavailable by <strong>the</strong> mid-1990's, <strong>the</strong> intertie would not be feasible based oncurrent dem<strong>and</strong> expectations. There<strong>for</strong>e, at this time, <strong>the</strong> intertie hasbeen dismissed as all but a very long range alternative.PRESSURE REDUCING TURBINEDescription:The Trans-Alaska Pipeline hydraulic energy recovery turbine facilitywould consist of a single hydraulic turbine installed in parallel with<strong>the</strong> 48-inch main line block valve located approximately 5 miles east of<strong>the</strong> <strong>Valdez</strong> terminal. Diversion of crude oil through <strong>the</strong> turbine byclosing <strong>the</strong> main line block valve could generate nearly 65,000 MWH ofenergy per year at <strong>the</strong> pipeline flow rate of 1.5 MBD. This recoveraoleenergy is contained in <strong>the</strong> crude oil stream as it reaches <strong>the</strong> main lineolock valve #125 <strong>and</strong>, if not extracted by <strong>the</strong> hydraulic turbine, would bedissipated in pipeline friction.Crude oil flow through <strong>the</strong> PRT facility would be controlled bypressure reducing <strong>and</strong> bypass valves. A st<strong>and</strong>ard multifunction integratedelectronic control system would be provided responding to both loadchanges <strong>and</strong> pipeline conditions.The deSign provides overriding control of crude oil flow through <strong>the</strong>PRT facility to Alyeska Pipeline Service Company. All station valvingsuoject to utility control would be interlocked with Alyeska block valvecontrol. The paramount operational consideration is that of maintainingstaole continuity of flow of <strong>the</strong> crude oil stream.Inasmuch as this facility would De an integral part of <strong>the</strong>Trans-Alaska Pipeline, its design, construction, <strong>and</strong> operation would besUbject to all applicaole criteria established <strong>for</strong> <strong>the</strong> pipeline as wellas tne approval of <strong>the</strong> U.S. Department of <strong>the</strong> Interior, <strong>the</strong> Alaska StatePipeline Coordinator, <strong>and</strong> <strong>the</strong> Alyeska Pipeline Service Company. Ifapproval could be reached, <strong>the</strong> PRT could be on-line oy 1984.The primary disadvantage to this plan is its tenuous ability toprovide firm energy. Whenever a routine or emergency shutdown of <strong>the</strong> oilpipeline occu~red no energy could be produced. This is not uncommon,particularly during winter storms when <strong>the</strong> loading of tankers is32
impaired. As a result, st<strong>and</strong>oy generating capacity would almostcertainly have to be maintained at all times. Such st<strong>and</strong>oy capacitywould undouotedly oe provided oy existing diesel generators. Thepercentage of time that this would be necessary cannot be predicted.However, given that no energy source is entirely firm, <strong>and</strong> in <strong>the</strong>interest of conservatism, power produced by <strong>the</strong> PRT will be regarded asfirm <strong>and</strong> assigned a dependency factor of 80 percent <strong>for</strong> purposes of thisreport.Ano<strong>the</strong>r concern worthy of fur<strong>the</strong>r consideration is that of projectlife. Estimates of <strong>the</strong> total Prudhoe Bay field are approximately 9.6billion barrels. Based on a flow rate of 1.5 MBD, <strong>the</strong> known oil reserveswill last between 15 <strong>and</strong> 20 years. The potential of additional oildiscoveries, particularly in <strong>the</strong> Beau<strong>for</strong>t Sea, are relatively good;however, due to <strong>the</strong> uncertainty of future finds it will oe assumed that<strong>the</strong> oil will last untn 2000.Pertinent data <strong>for</strong> <strong>the</strong> project follows:Capacity (kW) 7,400 (1.5 MBD)Annual Energy (MWH) 52,000 (PF=0.8)First Cost $9,700,000The above estimates of capacity <strong>and</strong> energy were derived fromin<strong>for</strong>mation available from R.W. Re<strong>the</strong>r<strong>for</strong>d1s 1976 report on <strong>the</strong> pressurereducing turbine. Capacity <strong>and</strong> energy figures were reduced to account<strong>for</strong> an oil flow of 1.5 MBD <strong>and</strong> an 80 percent power availability factor aspreviously stated. The first cost of $9.7 million was obtained from R.W.Re<strong>the</strong>r<strong>for</strong>d Associates who are currently updating <strong>the</strong>ir previous study.The estimated annual costs based on October 1980 prices <strong>and</strong> financingover 16 years at 7-3/8 percent are as follows:Interest <strong>and</strong> AmortizationOperation, Maintenance <strong>and</strong> ReplacementAverage Annual Cost$1,052,000$ 200,000$1,252,000Based on <strong>the</strong>se prices <strong>the</strong> cost per kWh would be approximately 2.4i.The inability of <strong>the</strong> turoine-generator to follow <strong>the</strong> power dem<strong>and</strong> <strong>for</strong> <strong>the</strong>system would restrict its operation to baseload. This may reduce <strong>the</strong>usaole output until <strong>the</strong> minimum system dem<strong>and</strong> exceeds <strong>the</strong> unit1s capacity.Impact Assessment:The proposed site <strong>for</strong> <strong>the</strong> pressure reducing turbine (PRT) is located 5miles east of <strong>the</strong> pipeline terminal, approximately 3/4 mile off <strong>the</strong>Dayville Road. The PRT site is adjacent to <strong>the</strong> proposed transmissioncorridor on <strong>the</strong> south side of <strong>the</strong> Lowe <strong>River</strong>. The powerhouse <strong>and</strong> parkingfacilities would utilize an area improved during <strong>the</strong> construction of <strong>the</strong>Trans-Alaska Pipeline.33
The impacts associated with <strong>the</strong> PRT action are minor with littleconstruction occurring in nondisturoed areas. The main impacts would oedisturDance of wildlife species during <strong>the</strong> construction phase. Increasesin dust, noise, <strong>and</strong> air pollution would occur, but <strong>the</strong>se would be shortlived <strong>and</strong> end with <strong>the</strong> construction phase.Evaluation:Based on <strong>the</strong> preceding in<strong>for</strong>mation, <strong>the</strong> PRT is <strong>the</strong> lowest cost energyalternative availaole to <strong>the</strong> study area. It would operate as a oaseloadenergy source allowing <strong>for</strong> <strong>the</strong> utilization of Solomon Gulch to meet peakdem<strong>and</strong>s.Besides oeing inexpensive, <strong>the</strong> PRT has <strong>the</strong> advantage that it can oeorought on-line in a relatively short period (oy 1984), <strong>the</strong>reby greatlyreducing or temporarily eliminating <strong>the</strong> need <strong>for</strong> diesel generation.The primary disadvantages to <strong>the</strong> PRT are: (1) its energy production isonly a secondary function of <strong>the</strong> pipeline, (2) it would not produceenergy during pipeline shut downs, whe<strong>the</strong>r due to emergency, maintenance,or wea<strong>the</strong>r (i.e. winds), (3) it would no longer operate when <strong>the</strong> oil flowceases (this may cause an energy shortage <strong>for</strong> nonpipeline relatedactivities which would not cease to function with <strong>the</strong> loss of <strong>the</strong> oil),<strong>and</strong> (4) <strong>the</strong> administrative proolems of reaching an agreement oetween <strong>the</strong>affected parties. However, <strong>the</strong>se disadvantages are relatively minor whencompared to <strong>the</strong> oenefits that could be derived from <strong>the</strong> system.Plan Implementation:Implementation of this plan would be <strong>the</strong> responsibility of <strong>the</strong> localutility <strong>and</strong> <strong>the</strong> Alyeska Pipeline Service Company. Due to <strong>the</strong> sensitivenature of pipeline security, a number of questions need to be resolved.Questions as to whom would own <strong>and</strong> operate <strong>the</strong> system <strong>and</strong> what guaranteeswould be required to insure <strong>the</strong> system does not affect normal pipelineoperations are proDaoly <strong>the</strong> <strong>for</strong>emost concerns. These are primarilyquestions of security <strong>and</strong> will have to be addressed by Alyeska <strong>and</strong> <strong>the</strong>local utility respectively.ALLISON LAKE HYDRODescription:Allison Lake is located just south of Port <strong>Valdez</strong> (Figure 1). Aproject here would consist of a lake tap at approximately <strong>the</strong> 1,250-footlevel, 117 feet below <strong>the</strong> current lake level. A dam was considered at<strong>the</strong> lake outlet; however, surficial geological investigations indicatedthat <strong>the</strong> terminal moraine near <strong>the</strong> outlet would not be an adequatefoundation <strong>for</strong> a dam.The lake tap plan would require a combination of a concrete lined6-foot circular <strong>and</strong> an unlined 8-foot horseshoe shaped power tunnel.This lO,200-foot tunnel would transport <strong>the</strong> water from Allison Lake to34
ALLISON LAKE
just inside <strong>the</strong> tunnel portal where it would enter a 4-foot diameterpenstock. This above ground penstock would extend from <strong>the</strong> tunnel portalto ei<strong>the</strong>r one of <strong>the</strong> identified powerhouse sites. <strong>Power</strong>house Site #1 islocated approximately 20 feet MLLW <strong>and</strong> <strong>Power</strong>house Site #2 is located at100 feet MLLW. Ei<strong>the</strong>r powerhouse would have an installed capacity of 8MW. This was Dased on <strong>the</strong> recommended 50 percent plant factor provided by<strong>the</strong> Alaska <strong>Power</strong> Administration. A transmission line of 3 to 3.5 mileswould be required to tie into <strong>the</strong> Solomon Gulch Substation. A detaileddescription of this plan is included in Appendix D.Evaluation:Pertinent data fur both alternatives follow. The estimated firstcosts <strong>for</strong> <strong>the</strong> two plans are based on October 1980 dollars. The pricesinclude a 20 percent allowance <strong>for</strong> contingencies. Also included is <strong>the</strong>cost <strong>for</strong> environmental mitigation.Altern at i ve #1Capacity (KW)Firm Annual Energy (MWH)Average Annual Energy (MWH)First Cost ($1,000)A lternat i ve #2CapdcHy (kW)Firm Annual Energy (MWH)Average Annudl Energy (MWH)First Cost ($1,000)8,00034,30039,35037,2508,00032,20037,25034,301Annudl costs are computed by amortizing <strong>the</strong> investment cost, whichincludes interest during construction, over <strong>the</strong> life of <strong>the</strong> project <strong>and</strong>adoing <strong>the</strong> operation, maintenance <strong>and</strong> replacement costs. Interest duringconstruction is computed as compound interest on a uni<strong>for</strong>m expenditureover <strong>the</strong> 4-year construction period. Adding interest during constructiongives an investment cost of $44,644,000 <strong>and</strong> $41,109,000 respectively.The following estimated annual costs dre based on a 100-year projectlife <strong>and</strong> interest at 7-3/8 percent.Alternative itlInterest <strong>and</strong> AlliortizationOperation, Maintenance <strong>and</strong> ReplacementAverdge Annual CostAlternative #2Interest Mid AmortizationOperation, Maintenance <strong>and</strong> ReplacementAverage Annual Cost$3,295,000200,000$3,495,000$3,034,000200,000$3,234,00036
From <strong>the</strong> time of pO\'Ier-on-line, only <strong>the</strong> operation, maintenance, <strong>and</strong>replacement costs are subject to inflation. With <strong>the</strong>se representing onlya snall portion of <strong>the</strong> total, annual costs are relatively insensitive to<strong>the</strong> effects of inflation.The costs per fi rm kWh <strong>for</strong> Al tern,',ti ve #1 <strong>and</strong> #2 are 10. 2ft <strong>and</strong> 10. octrespectively. Besides being more expensive, Alternative #1 could beexposed to possible seismic waves (Appendix G), <strong>and</strong> <strong>the</strong> environmentalimpact woul d be greater due to a reducti on in spawni ng area (tai 1 racedischarge being closer to tide-water). There<strong>for</strong>e, Alternative #1 hasbeen eliminated from fur<strong>the</strong>r evaluation.Alternate #2 was analyzed at 4, 6, 8, <strong>and</strong> 10 MW to determine <strong>the</strong>optimum si ze power pl ant from an economic st<strong>and</strong>poi nt. <strong>Power</strong> benefi tswere based on <strong>the</strong> load <strong>for</strong>ecast provi ded by <strong>the</strong> A1 aska <strong>Power</strong>Administration. Fuel cost escalation, as determined by <strong>the</strong> U.S.Depa rtment of Energy, <strong>for</strong> <strong>the</strong> 1980 Annual Report to Congress was alsoused. Below is a summary of <strong>the</strong> annual benefits (excluding employmentbenefits) <strong>and</strong> costs of <strong>the</strong> various units. (Benefits <strong>and</strong> costs are inthous<strong>and</strong>s of dollars.)SUMr~ARYPlant Capacity Energy Total BIC NetSize Benefits Benefits Cost Ratio Benefits4 r,n~ $398.9 $4,262.2 $2,946.0 1. 58 $1,7156 HW $585.9 $4,772.6 $3,036.0 1.77 $2,3238 1,1104 $748.0 $4,882.9 $3,234.0 1. 74 $2,3971 0 r~w $897.9 $4,827.7 $3,456.0 1. 66 $2,270The above economic sUMmary indicates that <strong>the</strong> 8 r~w alternativemaximizes net I~ED benefits. By "including employment benefits of $182,000<strong>for</strong> <strong>the</strong> 8 r~\~ unit, <strong>the</strong> total benefits are $5,813,000 compared to <strong>the</strong>total costs of $3,234,000. This provides net NED benefits of $2,579,000<strong>and</strong> a benefit-cost ratio of 1.8 to 1.The benefits shown above have been computed under <strong>the</strong> assumption that<strong>the</strong> PRT would not be built. The results of <strong>the</strong> net benefit maximizationwould not change significantly if <strong>the</strong> PRT were assumed as part of <strong>the</strong>without project condition.Various benefit outcomes of different assumptions concerning <strong>the</strong> load<strong>for</strong>ecast, PRT, <strong>and</strong> fuel cost escalation are presented in <strong>the</strong> EconomicAnalysis of <strong>the</strong> selected plan (Appendix C). The method used in derivingNED employment benefits is also discussed in Appendix C.Impact Assessment:The major environmental effects of Alternative #2 are associated withchanges in water quality \'Ihich may impact <strong>the</strong> fishery resources inAllison Creek. The introduction of higher flows <strong>and</strong> warmer water during<strong>the</strong> wi nter months coul d cause rapi d egg i ncubati on <strong>and</strong> early emergence ofsalmon fry. The early emergence may cause <strong>the</strong> fry to enter Port <strong>Valdez</strong>at a time when food sources are scarce. Determination of <strong>the</strong> potential37
effects on <strong>the</strong> salmon run <strong>and</strong> <strong>the</strong> resultant fishery are being assessed.A stream gage has been installed to aid in <strong>the</strong> determination of existingwinter flows. A recording <strong>the</strong>rmograph has been in operation since 1979in Allision Creek. The data <strong>for</strong> that period is included in Appendix E.Two additional <strong>the</strong>rmographs will be installed to determine spawninggravel temperatures within <strong>the</strong> stream <strong>and</strong> <strong>the</strong> intertidal area.Mitigation includes providing a two tailrace system which would dischargefully into Allison Creek in <strong>the</strong> summer. Winter discharge would be toPort <strong>Valdez</strong> with partial diversion to Allison Creek to maintain adequate; nstream flow.O<strong>the</strong>r impacts include disturbances to wildlife during <strong>the</strong> constructionphase, clearing of approximately 22.5 acres of spruce/hemlock <strong>for</strong>est<strong>for</strong> <strong>the</strong> transmission rigllt-of-way, <strong>and</strong> decreases in <strong>the</strong> visual quality of<strong>the</strong> area. For fur<strong>the</strong>r in<strong>for</strong>mation on project impacts, refer to <strong>the</strong> environmentalimpact statement.~Ii ti gati on:Proposed mitigative measures are <strong>for</strong> a tailrace to Port <strong>Valdez</strong> inaddition to <strong>the</strong> one to Allison Creek. The rationale behind <strong>the</strong> twotailrace system is to divert winter powerhouse releases directly to Port<strong>Valdez</strong>, thus reducing water temperature impacts on Allison Creek duringsalmon egg incubation. Mitigative costs <strong>for</strong> <strong>the</strong> additional tailrace <strong>and</strong>gating systems are $925,000 including 20 percent contingencies, 8 percentengineering <strong>and</strong> design, <strong>and</strong> 8 percent supervision <strong>and</strong> administration.Annual costs were calculated at $68,300.Determining <strong>the</strong> monetary value of <strong>the</strong> Allison Creek fishery is notfeasible. Population estimates are not complete <strong>and</strong> reflect minimal datacollection. Biomass originating from salmon production in Allison Creekis large enough to be an important contributor to <strong>the</strong> Port <strong>Valdez</strong> derivedfood web. Fish originating from Allison Creek also add to <strong>the</strong> commercial<strong>and</strong> sport fisheries. Es<strong>the</strong>tic values <strong>and</strong> o<strong>the</strong>r intangibles are alsoillportant to <strong>the</strong> human envi ronment of <strong>the</strong> study area. The spawni ngactivity can be observed where <strong>the</strong> creek is crossed by <strong>the</strong> Dayville Road.The probability of losing of <strong>the</strong> fisheries resource of Allison Creekis high without mitigation. This loss would have an effect on <strong>the</strong> PortVal dez ecosystem <strong>and</strong> to <strong>the</strong> human envi ronment of <strong>the</strong> study area.Implementation Responsibilities:The United States would design <strong>and</strong> construct <strong>the</strong> lake tap,powerplant, <strong>and</strong> transmission facilities. Project operation would besupervised by personnel from <strong>the</strong> local utility from a centralizedoperati ons control center. Project mai ntenance woul d be per<strong>for</strong>med byFederal maintenance/operators assigned to <strong>the</strong> project who would besupplemented by utility maintenance personnel. These individuals wouldoperate <strong>the</strong> project under emergency situations. Overall projectadministration including power sales contracts, billing, accounting, <strong>and</strong>annual inspections would be provided by <strong>the</strong> Alaska <strong>Power</strong> Administrationheadquarters office in Juneau.38
Technical services such as electronic systems maintenance <strong>and</strong> repair,meter relay mechanics. <strong>and</strong> staff <strong>for</strong> major maintenance activities wouldbe provided on an as needed basis by utility personnel supplemented bystaff from APA headquarters <strong>and</strong> from <strong>the</strong> Eklutna <strong>and</strong> Snettishamhydroelectric projects. This amounts to sharing <strong>the</strong> skills of <strong>the</strong> staffsof several small projects in order to minimize total operation <strong>and</strong>maintenance costs.Transmission line maintenance <strong>and</strong> major powerplant maintenance, suchas turbine overhaul. would require additional manpower provided ei<strong>the</strong>r by<strong>the</strong> utility staff or personnel detailed from o<strong>the</strong>r APA projects.The project benefits are attributable to power <strong>and</strong> <strong>the</strong> utilization ofo<strong>the</strong>rwise unemployed labor resources. All project costs would be repaid\/ith interest through revenues derived from <strong>the</strong> sale of project power.39
COMPARlSON OFDETAILED PLANSNo single alternative was seen to be <strong>the</strong> best solution to <strong>the</strong> needs of<strong>the</strong> study area. Of <strong>the</strong> alternatives considered, various possiblecombinations were looked at to determine <strong>the</strong> "besC plan <strong>for</strong> <strong>the</strong> studyarea. Besides <strong>the</strong> all diesel alternative considered under <strong>the</strong> previoussection (designated Plan A), <strong>the</strong> plans that were evaluated include dieselplus pressure reducing turbine (Plan B), diesel plus Allison hydropower(Plan C), <strong>and</strong> PRT plus Allison hydropower (Plan D). All of <strong>the</strong>se plansinclude <strong>the</strong> utilization of Solomon Gulch hydropower which will be in fulloperation by 1982. In all cases diesel is utilized up until <strong>the</strong>power-on-line date of <strong>the</strong> various alternatives.Figures 2 through 5 give a graphic representation of <strong>the</strong> energyavailable from <strong>the</strong> various plans considered. A detailed summary of <strong>the</strong>plans is given in <strong>the</strong> system of accounts table that follows. Thepower-on-line date <strong>for</strong> <strong>the</strong> PRT is assumed to be 1984 <strong>for</strong> all cases. Theon-l i ne date <strong>for</strong> All i son hydropower is 1990 <strong>for</strong> P'I an C <strong>and</strong> Pl an D. Theenergy load growth was based on <strong>the</strong> Alaska <strong>Power</strong> Administration mostrecent <strong>for</strong>ecast <strong>for</strong> <strong>the</strong> area. A higher growth rate would requireadditional diesel consumption to meet energy needs. A lower rate woulddelay <strong>the</strong> required power-on-line dates <strong>for</strong> <strong>the</strong> projects.When evaluating Figures 2 through 5 <strong>the</strong>ir actual significance must beconsidered. The graphs represent <strong>the</strong> study area's yearly energy dem<strong>and</strong>in gigawatt hours (GWH) <strong>and</strong> <strong>the</strong> ability of <strong>the</strong> various plans to meet <strong>the</strong>dem<strong>and</strong>. The figures shown are based on firm energy ra<strong>the</strong>r than averageannual. This was done to give a more accurate representation of usableenergy available from <strong>the</strong> hydropower projects. Secondary energy isproduced duri ng tile summer months \'1hen load requi rements are downrenderi ng most of <strong>the</strong> energy unusabl e at 1 east until <strong>the</strong> year 2000. ThefollO\'1ing table sUf.1marizes <strong>the</strong> energy potentials <strong>for</strong> Solomon Gulch,Allison Lake, <strong>and</strong> <strong>the</strong> PRT:ProjectSolomon GulchAll i son LakePRTFirm Energy (MWH)38,60032,20052,000Secondary (MWH)17,0005,050-0-Total55,60037,25052,000Although Solomon Gul ch produces s i gni ficantly more total energy, <strong>the</strong>actual amount of firm energy is not much greater than Allison Lak.e. Thisis due to greater reservoir regulation of Allison Lake.The system of accounts tables following <strong>the</strong> graphs give an accuratecomparison of <strong>the</strong> various plans. In all cases, a 100-year evaluationperiod was used. The beginning date of evaluation is 1984, correspondingto <strong>the</strong> power-on-line date of <strong>the</strong> PRT.By this approach, a future project (Allison hydropower) is economicallydiscounted to <strong>the</strong> 1984 base. Annual benefits <strong>and</strong> costs can40
175150FIGURE: 2ENERGY DEMAND - REVISED APA PROJECTIONDIESEL ONLY.J:::.........1251007550- ::I:~(!)-CZ-(!)0::L1JZL1JDIESEL25SOLOMON GULCH HYDROo+-~~~--~~~~~--~~~~--~~~~--~~~~~~~~~~~1975 1980 1985 1990 1995 2000
175150FIGURE: 3ENERGY DEMAND - REVISED APA PROJECTIONDIESEL a PRESSURE REDUCING TURBINE~N125- z~(!)-100 0Z-(!)Q:50wzwDIESELPRESSURE REDUCING TURBINE25DIESELSOLOMON GULCH HYDROo~~~~~--~~~~~~~~~~~~--~~~~~~--~~~~1975 1980 1985 1990 1995 2000
175150FIGURE: 4ENERGY - REVISED APA PROJECTIONDIESEL a ALLISON HYDRO125- ::I:!t(!)-100 0Z-(!)a:I.aJZI.aJ50DIESELALLISON HYDRO25SOLOMON GULCH HYDRO1980 1985 1990 19952000--.. - .... - .. ---
175 FIGURE: 5ENERGY - REVISED APA PROJECTIONPRESSURE REDUCING TURBINE aALLSON HYDRO150125100 0Z50(!)Q:lAJZWALLISON HYDROPRESSURE REDUCING TURBINE25DIESELSOLOMON GULCH TURBINEo+-~~~~~~~~~~~~~~~~~~--~~~~~~--~~~1975 1980 1985 1990 1995 2000
SYSTEMOF ACCOUNTSAccountsPlan AAll ~iesel Generation(Without Condition)Plan B Plan C Plan 0f)i ese 1 & PRT Diesel & Hydro PRT & Hydro1984 1990 1984 1990l. National EconomicDevelopment (NED)a. Beneficial Impacts<strong>Power</strong> ProductionEmployment Benefits2, 100,000 3,835,000 5,234,000119,000 119,000TOTAL NED BENEFIT~(annua 1 )2,100,000 3,954,000 5,353,000Location of Tmpacts4'>Ul<strong>Power</strong> Production<strong>Power</strong> will be utilizedin <strong>the</strong> <strong>Copper</strong> ValleyElectric Service AreaGlennallen-<strong>Valdez</strong> &vicinity.Same Same SameEmploymentb. Adverse ImpactsConstruction CostsEmployment would remainapproximately<strong>the</strong> same as present.A slight in- Employment would Samecrease inbe gained byemployment<strong>Valdez</strong>, Alaska.may take place;however it shouldnot be a substanti a 1 increase.TOTAL NED COSTS(annual)852,000 2,110,000 2,962,000
AccountsPl an AAll Diesel Generation(Without Condition)Plan BDiesel & PRTlq84Plan CDiesel & Hydro1990Plan DPRT & Hydro1984 1990~~Location of ImpactsPro.iect rnstsc. Net NED benefits(annua 1)Costs of continued use ofdiesel fuel will be incurredby <strong>the</strong> local ~tility<strong>and</strong> passed on to <strong>the</strong>consumer.oCosts of <strong>the</strong> PRTwill be incurredby ei<strong>the</strong>r <strong>the</strong> localutility or AlyeskaPipeline ServiceCompany.$1,248,000Ninety percent of constructioncosts <strong>for</strong>hydro developmentwould be charged topeople of <strong>the</strong> U.S. <strong>and</strong>10 percent to Stateof Alaska in accordancewith <strong>the</strong> President'sguidelines <strong>for</strong> costshari ng. Interest <strong>and</strong>principal would be paidback through sale of <strong>the</strong>power to consumers of<strong>the</strong> area.$1,844,000Combinationof B<strong>and</strong> C$2,391,000d. Benefit Cost Ratioo2.461.871.812. EnvironmentalQuality (EQ)Location of Impactsa. Envi ronmenta 1Quality EnhancedNoneNoneNoneNoneb. EnviromentalQuality DestroyedLocal air pollution<strong>and</strong> noise duringconstruction.Temporary displacementof wildlife <strong>for</strong>construction.Possible long termdetrimental effects<strong>for</strong> <strong>the</strong> pink <strong>and</strong> chumsalmon in AllisonCreek. Short termdisplacement of wildlifeduring constructionas well as noise<strong>and</strong> air pollution. Adecrease of <strong>the</strong> visualqua1iLy of <strong>the</strong> area.Combinationof Plan B<strong>and</strong> C
AccountsPlan A.All Diesel Generation(Without Condition)Plan BDiesel & PRT1984Plan CDi ese 1 & Hydro1990Plan DPRT & Hydro1984 19903. Social Well Beinq(SWB)a. Beneficial ImpactsDisplacement ofPeopleNoneNoneNoneNoneEnerqy CostsEnergy costs will continueto increase directlywith fuel costs. Electricitywill continue toclaim a larger <strong>and</strong> largerportion of individualincome.Energy costs willstabilize <strong>and</strong> dropduring <strong>the</strong> life ofproject; however,as soon as <strong>the</strong> oilstops flowing substantialincreaseswill take place.The project will helpstabilize energy coststhroughout its life;however, <strong>the</strong> amount ofdiesel needed above <strong>the</strong>hydro's capabilitieswill <strong>for</strong>ce prices up.Energy costsshould drop<strong>and</strong> remainrelativelyconsistent atleast until<strong>the</strong> year 2000Community Cohesionb. Adverse ImpactsHigher energy pricesmay <strong>for</strong>ce potentialemployers to seek siteselsewhere, with lowercosts.Increase should benegligible.Increase will be amore significantthan Plan B due tolonger constructionperiod. Long runimpacts will be small.Effects shoulbe a combinationof PlansB<strong>and</strong> C.NoiseNoise will not increasesubstantially.Noise impact duringconstruction, nolong term effects.Same as B only greaternoise levels during constructiondue to blasting,drilling <strong>and</strong> longerconstruction period.Same as B<strong>and</strong>C.Es<strong>the</strong>ticsNo change from currentsituation.Temporary changeduring construction.Long term impactsare negligible.There would be scarsleft from <strong>the</strong> blasting<strong>and</strong> removal of rockthat would be at leastpartially visiblefrom Va 1 dez.Same as B<strong>and</strong>C.
AccountsAll Diesel Generation(Without Condition)Diesel & PRT1984niesel & Hydro1990PRT & Hydr1984 19904. Regional Development(RD)a. Beneficial ImpactsAdditional <strong>Power</strong>ProductionThe cost of additionalenergy will continueto rise with fuel prices.This would have a stiflingeffect on <strong>the</strong> developmentof <strong>the</strong> area.Additional powershould stabilize <strong>and</strong>lower enerqy costsat least 15 years.This should encourage<strong>the</strong> developmentof <strong>the</strong> region.Same as B except <strong>the</strong>total energy is not asgreat; however, thiswould have a muchlonger term effectthan <strong>the</strong> PRT.Same as B<strong>and</strong>C.EmploymentAny change in employmentwould be limited tomaintaining additionaldiesel units.A temporary increasein employment duringconstruction with asmaller permanentincrease <strong>for</strong> operation.Same as B except <strong>the</strong>construction work <strong>for</strong>cewould be much greater<strong>and</strong> <strong>the</strong> duration ofconstruction is muchlonger.Same as B<strong>and</strong>Cb. Adverse ImpactsTax RevenuesNo ChanqeNo ChangeNo ChangeNo ChangePublic ServicesNo ChangeNo ChangeNo ChangeNo Change
<strong>the</strong>n be determined <strong>for</strong> <strong>the</strong> 100-year evaluation period. This will portrayboth benefits <strong>and</strong> costs reduced with a corresponding reduction in netbenefits; however <strong>the</strong> ratio of benefits to costs will remain <strong>the</strong> same.In <strong>the</strong> case of <strong>the</strong> PRT <strong>the</strong> total benefits <strong>and</strong> cost were presentwor<strong>the</strong>dto 1984 <strong>and</strong> <strong>the</strong>n spread over <strong>the</strong> 100-year evaluation period.These economic evaluation procedures have <strong>the</strong> effect of evaluating <strong>the</strong>plans on equal ground.RATIONALE FOR DESIGNATION OF NED PLANThe ~Jational Economic Development (NED) objectives are achieved byincreasing <strong>the</strong> value of <strong>the</strong> nation's output of goods <strong>and</strong> services <strong>and</strong>improving national economic efficiency. Based on this criteria <strong>the</strong> NEDPlan is Plan D, <strong>the</strong> pressure reducing turbine plus Allison hydropower.This plan would provide net annual benefits exceeding any of <strong>the</strong> alternateplans. The combination of <strong>the</strong> PRT with hydropower would allow <strong>the</strong>displacement of exceedingly precious <strong>and</strong> expensive petroleum products.Although a number of questions regarding implementation of <strong>the</strong> PRT remainto be resolved between <strong>the</strong> local utility <strong>and</strong> Alyeska Pipeline ServiceCompany, <strong>the</strong>se are <strong>the</strong> responsibility of those organizations. Funding<strong>for</strong> <strong>the</strong> PRT would be private whereas it would be primarily Federal <strong>for</strong><strong>the</strong> hydropower portion of <strong>the</strong> plan. The average net annual NED benefitsover <strong>the</strong> life of <strong>the</strong> proposed plan, are $2,391,000.~ATIONALEFOR DESIGNATION OF EQ PLANThe Environmental Quality (EQ) Plan is an alternative which makes <strong>the</strong>most significant contribution to preserving, maintaining, or enhancing<strong>the</strong> cultural <strong>and</strong> natural resources of <strong>the</strong> study area. Of <strong>the</strong> detailedplans considered, none would provide an actual enhancement of <strong>the</strong>environment; however, Plan B (PRT plus diesel), would cause <strong>the</strong> leastenvironmental damage (LED). There<strong>for</strong>e, this alternative has beendesignated <strong>the</strong> LED plan.The continued use of diesel has <strong>the</strong> impact of noise <strong>and</strong> air pollution,but this is relatively minor compared to <strong>the</strong> impact of hydropowerconstruction. The fact that <strong>the</strong> generators are already in place, <strong>and</strong> noadditional units would be required until <strong>the</strong> mid-1990's, would eliminateany environmental impacts from construction.The pressure reducing turbine would have some minimal impacts fromconstruction, but <strong>the</strong>re would be less impact from noise <strong>and</strong> pollutionduring operation. Located immediately adjacent to <strong>the</strong> oil pipeline, <strong>the</strong>facility would be in an area that has been previously disturbed. The PRTwould be housed in a building approximately 60 x 170 feet. The totalarea required <strong>for</strong> <strong>the</strong> building <strong>and</strong> grounds would be approximately 1.5acres.49
RATIONALE FOR SELECTED PLANUnder realistic assumptions regarding future economic conditions <strong>and</strong>fuel costs, Plan D, PRT plus hydropower, is <strong>the</strong> most economical means ofmeeting <strong>the</strong> long term future needs of <strong>the</strong> study area. This plan wouldhelp meet both <strong>the</strong> short <strong>and</strong> long term needs of <strong>the</strong> study area <strong>and</strong> reduce<strong>the</strong> current dependence on diesel-fired generation.The PRT would have a much shorter construction period than AllisonLake hydropower allowing <strong>for</strong> faster implementation. The PRT wouldfunction as a baseload operation with Solomon Gulch <strong>and</strong> <strong>the</strong> existingdiesel generators providing back up <strong>and</strong> peaking capability.Allison Lake hydropower would come on line in 1990 at a time whenadditional energy, above <strong>and</strong> beyond <strong>the</strong> capability of Solomon Gulch <strong>and</strong><strong>the</strong> PRT would be needed. The project would meet <strong>the</strong> estimated energy <strong>and</strong>capacity needs until 1995 <strong>and</strong> 1998 respectively. In 1995 additionalenergy would come from ei<strong>the</strong>r diesel generation or possibly additionalhydropower.The following table provides a summary of <strong>the</strong> Federal <strong>and</strong> nonfederalfirst cost apportionment <strong>for</strong> <strong>the</strong> selected plan.First Cost (October 1980 Dollars)FederalPRT -0-ALLISON HYDRO $30,871,000Non-Federal$9,700,000$3,430,000The above cost apportionment <strong>for</strong> Allison Lake hydropower is inaccordance with <strong>the</strong> President's proposed cost-sharing policy. Thispolicy requires 10 percent State participation in Federal projects havinga "vendible" output.PUBLIC INVOLVEMENT AND COORDINATIONThroughout <strong>the</strong> course of this study public involvement wasaccompl i shed primar"ily through three publ i c meeti ngs hel d at vari oustimes during <strong>the</strong> study process. The purpose of <strong>the</strong> earlier meetings wasto obtain input from <strong>the</strong> public to help direct <strong>the</strong> study, where <strong>the</strong>latter meeting was to receive comments on <strong>the</strong> results.Input from State <strong>and</strong> rederal agencies was obtained by ei<strong>the</strong>r directcontact or through <strong>the</strong> State Clearing House. Nearly 200 copies of <strong>the</strong>draft report were sent to various agencies, special interest groups, <strong>and</strong>interested individuals.50
Comnents received from <strong>the</strong> city of <strong>Valdez</strong>, <strong>Copper</strong> Valley ElectricAssociation, Alaska <strong>Power</strong> Authority, <strong>and</strong> <strong>the</strong> Governor's Office basicallyconcur with <strong>the</strong> findings of <strong>the</strong> repor~. The primary concern voiced byvarious resource agencies related to <strong>the</strong> environmental impact of warmerwater being discharged over <strong>the</strong> developing salmon eggs in winter.Appendix J, "Public Views <strong>and</strong> Responses," includes comments received on<strong>the</strong> draft report <strong>and</strong> Corps of Engineer's responses.CONCLUS IONSBased on <strong>the</strong> analysis <strong>and</strong> proceedings used in this report, <strong>the</strong>combined plan of <strong>the</strong> pressure reducing turbine <strong>and</strong> hydropower fromAllison Lake appears to be <strong>the</strong> best solution to meet both National <strong>and</strong>local objectives. Implementation of <strong>the</strong> PRT at <strong>the</strong> earliest possibledate should be pursued jointly between <strong>the</strong> local utility <strong>and</strong> AlyeskaPipeline Service Company. This represents a rare opportunity <strong>for</strong> anunusual energy source to provide low cost power to a region with minimalenvironmental impact.Detailed analysis <strong>and</strong> final design should resume on <strong>the</strong> Allison Lakehydropower project by 1984. This would allow adequate time <strong>for</strong> design<strong>and</strong> construction to provide needed power by 1990. Approximately 4 yearswould be needed to construct <strong>the</strong> Allison Lake project.RECO~I:~ENDATIOIJI recommend that <strong>the</strong> Allison Lake Hydroelectric Project be authorized<strong>for</strong> construction generally as described in this report, with suchmodifications as in <strong>the</strong> discretion of <strong>the</strong> Chief of Engineers may beadvisable, at a Federal cost estimated at $30,871,000. The estimatedannual operation <strong>and</strong> maintenance cost <strong>and</strong> replacement is $200,000.Former President Carter, in his June 1978 water policy message toCongress, proposed several changes in cost-sharing <strong>for</strong> water resourcesprojects to allow states to participate more actively in projectimplementation decisions. These changes include a cash contribution frombenefiting states of 5 percent of <strong>the</strong> first costs of constructionassigned to nonvendible project purposes <strong>and</strong> 10 percent of first cost ofconstruction assigned to vendible project purposes. Contributing stateswould share with <strong>the</strong> Federal Government <strong>the</strong> revenue from vendible outputsin proportion to <strong>the</strong>ir shares of project costs.Application of this policy to <strong>the</strong> Allison Lake Hydroelectric Projectrequires a contribution from <strong>the</strong> State of Alaska of an estimated$3,430,000 in cash (10 percent of $34,301,000 total estimated first costsof construction assigned to vendible project purposes, based on October1980 price levels). The State of Alaska will share 10 percent of <strong>the</strong> netpower revenues from <strong>the</strong> Allison Lake Hydroelectric Project. Net powerrevenues are defined as <strong>the</strong> gross receipts from power outputs less all51
operat ion <strong>and</strong> rna i ntenance costs allocated to power.I reconmendconstruction authorization of <strong>the</strong> Allison Lake Project in accordance with<strong>the</strong> President's proposed cost-sharing POliCY.~~ ~dl'( /U.-- -LEE R NUNNColonel, Corps of EngineersDistrict Engineer52
FINALENVIRONMENTAL IMPACT STATEMENT
FINALENVIRONMENTAL IMPACT STATEMENTProposed plan <strong>for</strong> a hydroelectric powerplant at Allison Lake, (SouthcentralRailbelt, <strong>Valdez</strong> Interim), <strong>Valdez</strong>, Alaska.The responsible lead agency is <strong>the</strong> U.S. Army Engineer' District, Alaska.Abstract: The Corps of Engineers was authorized by Congress to study <strong>the</strong>feasibility of hydroelectric power in <strong>the</strong> Southcentral Railbelt area ofAlaska. The proposed plan would provide an additional 8 megawatts ofpower from hydroelectric generation <strong>and</strong> an estimated average output of7.4 megawatts from a pressure reducing turbine (PRT) in <strong>the</strong> oil pipelineto serve <strong>the</strong> <strong>Valdez</strong>-Glennallen area. The hydropower portion of <strong>the</strong> planwould be Federal responsibility while <strong>the</strong> PRT would be local. Possibleadverse environmental impacts include increased winter water temperatureswhich could cause early emergence of pink <strong>and</strong> churn salmon fry. Positiveimpacts include reducing <strong>the</strong> use of fossil fuels as electrical generatingpower <strong>and</strong> decreasing air <strong>and</strong> noise pollution associated with dieselgeneration.SEND YOUR COMMENTS TO THEDISTRICT ENGINEER BY:If you would like fur<strong>the</strong>r in<strong>for</strong>mationon this statement please contact:Mr. William LloydU.S. Army Engineer District, AlaskaATTN: NPAEN-PL-ENP.O. Box 7002Anchorage, Alaska 99510
LIST OF PRFPARERSNameExpert i seExperienceDiscipline.John A. Burns(EIS r.oordinator)Fisheries BiologyKing crab research, NMFSKodiak, Alaska2 yrs EIS studies,Alaska District, 1 yrFisheries BiologistLoran BaxterCivil f:.:nqineerA.laska District3 yrs, Feasibility StudiesCivil EngineerSam MurrayEconomicsNorth Pacific Division9 mo Economic StudiesAlaska District2 yrs Economic StudiesEconomistCharles WellinqEconomicsAlaska District18 yrs, Economic StudiesEconomistL i zette Boyer,A.nthropo logySocial Studies, AlaskaDistrict2 yrs Anthropological <strong>and</strong>Cu ltura 1 Stud i esAnthropoligistJulia SteeleArc h aeo logyManagement Experience, MSin Anthropology.5 years Cultural ResourcesAnthropologist
SUMMARYThe purpose of <strong>the</strong> proposed project is to provide electrical power <strong>for</strong><strong>the</strong> <strong>Valdez</strong>-Glennallen area. Presently <strong>the</strong> electric power is supplied byale~el generators located botn in <strong>Valdez</strong> <strong>and</strong> Glennallen. PrOjectedpopulation growth <strong>and</strong> <strong>the</strong> increasing cost of petroleum products willcause increasing dem<strong>and</strong> <strong>for</strong> electrical power generated from alternativeenergy sourcesThe selected Plan (D) will generate 8 megawatts (MW) with 32,200 megawatthours (MWH) of firm annual energy from <strong>the</strong> hydroelectric project <strong>and</strong> 7.4MW with 52.000 MWH of annual energy from ttle pressure reducing turoine(PRT). O<strong>the</strong>r plans include combinations of diesel PRT, <strong>and</strong>hydroelectric.Adverse environmental impacts associated wltn <strong>the</strong> selected plan are to<strong>the</strong> fisheries resources of Allison Creek. Changes in winter watertemperatures may cause accelerated egg incubation <strong>and</strong> early emergence ofsalmon fry. An increase of stream temperature of 2° C could cause fryemergence 1 to 2 months earlier, a time when adequate food sources <strong>for</strong><strong>the</strong> fry do not exist in Port <strong>Valdez</strong>. Mitigative measures include anadditional tailrace which would divert powerhouse discharge directly intoPort <strong>Valdez</strong>, thus not chanqing <strong>the</strong> natural temperature regime of Allisonr:reek.MAJOR CONCLUSIONS ANDFINDINGSNone of <strong>the</strong> alternatives make significant contributions to preservingmaintaining, or enhancing <strong>the</strong> cultural ana natural resources of <strong>the</strong> stuayarea, <strong>and</strong> <strong>the</strong>re<strong>for</strong>e. do not meet <strong>the</strong> criteria of an Environmental Qual ity(EQ) Plan. For this study. Plan B, <strong>the</strong> diesel ana pressure reducingtUrLJlne alternative, has been established a~ <strong>the</strong> Least EnvironmentallyDamaging (LED) Plan.Th~ National Economic Development (NED) Plan addresses <strong>the</strong> planningobjectives which maximize net economic oenefits. Plan D, Allison LakeHydrupower <strong>and</strong> <strong>the</strong> PRT, would provide <strong>the</strong> "lost power output, <strong>and</strong> coupledwith <strong>the</strong> increasing costs of petroleum products, this alternative may beconsidered to be <strong>the</strong> NED Plan when viewed on an overall oasis.A Section 404(b) (1) evaluation <strong>for</strong> <strong>the</strong> proposed project is included inAppendlx E. Water quality requirements set <strong>for</strong>th under <strong>the</strong> Clean WaterAct will be met through Section 404(r) exemption criteria.All <strong>the</strong> alternatives fulfill Federal, State, <strong>and</strong> local legal requirements<strong>and</strong> comply with <strong>the</strong> requirements of all applicable environmentallaws, executive orders, <strong>and</strong> policies.iii
COMPARATIVE IMPACTS OF ALTERNATIVESWETLANDSVEGETATIONHISTORICSITESPLAN A(Diesel, no action)NONENONENONEPLAN B(Diesel, PRT)NCNEall activitieswill occur indisturbed areaNONEPLAN C(Diesel, hydroelectric)minor loss atlocation of tailraceat Allison Creekloss of 24 acres<strong>for</strong> transmissionline <strong>and</strong> <strong>Power</strong>houseNONEPLl\N D(PRT, Hydroelectric)same as Plan Csame as Plan C-I.
COMPARATIVE IMPACTS OF ALTERNATIVES (cont)ECONOMYWATERQUALITY FISHERIES ESTHETICSBENEF IT -COSTRATIOPLAN A NONE NONE NONE N/A(Oiesel, no action)PLAN B NONE NONE minor local Refer to Economic(Diesel, PRT) decrease in Appendixvisual qualityimpacts notvisible from<strong>Valdez</strong>PLAN C change in flow loss of egg noticable Refer to Economic(Diesel, flydroe 1 ectri c) <strong>and</strong> temperature incubation changes in Appendixto Allison Creek habitat due visual< to temper- qua 1 ityature change. impactsPossible loss would be seenof fishery from <strong>Valdez</strong>PLAN 0 same as Plan C same as same as Refer to Economic(PRT, hydroelectric) Plan C Plan B Append i x<strong>and</strong> C
AREAS OF CONTROVERSYTo date no specific area of controversy has oeen associated with projectstudy.REI ATIONSHIP TO ENVIRONMENTAL REQUIREMENTSFederal Policies <strong>and</strong> RegulationsFederal Water Project Recreatiun ActWater Resource Planning Act of 1966Fisn <strong>and</strong> Wildlife Coordination ActAll PlansFu 11 Cump1ianceFull ComplianceFull ComplianceoNational Historical Preservation ActFull ComplianceNational Environmental Pulicy ActFull Comp 1 i anceoCoastal Zone Management Act of 1972Partial Compliance;requirements will be metcompletion of Final EISreview.upon0Endangered Species Act of 1973Fu 11 Comp 1 i anceAnadromous Fisn ActFu 11 Compliance0Flood Plain Management EO 11988Fu 11 Comp 1 i ance0Protection of Wetl<strong>and</strong>s EO 11990Fu 11 Compliance0Archeoloqical <strong>and</strong> Historic PreservationActFull Compliance0Clean Air ActFull ComplianceuooEstuary Protection ActL<strong>and</strong> <strong>and</strong> Water Conservation Fund ActMarine Protection. Research <strong>and</strong>Sanctuary ActPartial Compliance;requirements will be metcompletion of Final EISreview.Fu 11 ComplianceFu 11 Comp 1 i anceuponvi
ooo<strong>River</strong>s <strong>and</strong> Harbors ActClean Water ActWatershed Protection <strong>and</strong> FloOdPrevention ActWild <strong>and</strong> Scenic <strong>River</strong>s ActFu 11 Comp 1 i ancePartial Compliance,requirements will bemet under Section 404(e)upon congressionalapprovalFull cornplainceN/AStateoState Coastal Zone ManagementState Water Ouality CertificationPartial Compliance;requirements will De metupon completion of FinalEIS review.N/Avii
COVER SHEETLIST OF PREPARERSFINAL ENVIRONMENTAL IMPACT STATEMENTPROPOSED PLAN FOR A HYDROELECTRIC POWERPLANTVALDEZ, ALASKATABLE OF CONTENTSParagraphItemSUMMARYA. NEED FOR AND OBJECTIVES OF ACTIONiiiB.C.D.Study Authori tyAL TERNATI VES1. Plans Eliminated2. Without Conditions (Plan A)3. Diesel - Pressure Reducing Turbine (Plan B)4. Diesel - Hydroelectric (Plan C)S. Pressure Reducing Turbine - Hydroelectric (Plan D)AFFECTED ENVIRONMENT1 Pnysicala. GeneralD. Hydrology <strong>and</strong> Water Qualityc. Es<strong>the</strong>tics2. Biologicala. Vegetationb. Wildlifec. Birdsd. Fishe. Mar; nef. Rare <strong>and</strong> Endangerea Species3. Socio economics4. Cultural ResourcesENVIRONMENTAL EFFECTS1. Pnysicala. Generalb. Hydrology <strong>and</strong> Water Qualityc. Es<strong>the</strong>t icsEIS-lEIS-lEIS-lEIS-2EIS-2EIS-2EIS-3EIS-4EIS-4EIS-4EIS-SEIS-SEIS-SEIS-7EIS-7EIS-7EIS-8E1S-8EIS-8E1S-8E 1 S-lOvii i
2. Biologicala. Vegetationb. Wildlifec. Birdsd. Fishe. Marinef. Rare <strong>and</strong> Endangered Species3. Socio-economics4. Cultural ResourcesE. MITIGATIONF. CUMULATIVE IMPACTSG. PUBLIC INVOLVEMENT1. Public Involvement Program2. Required Coordination3. Statement RecipientsH. COASTAL ZONE MANAGEMENTBIBLIOGRAPHYINDEXE I S- 11EIS-12EIS-12EIS-13EIS-14EIS-14EIS-14EIS-15EIS-15EIS-17EIS-18EIS-18EIS-18EIS-18EIS-20EIS-21ix
A. NEED FOR AND OBJECTIVES OF ACTIONStudy AuthorityThe <strong>Valdez</strong> Hydropower Study was authorized by a resolution of <strong>the</strong> committeeon PUDlic Works, United States Senate, 92 Congress, 2d Session.The Southcentr~l Railbelt (SCRB) resolution was adopted on 18 January1972. This resolution specifically stated that <strong>the</strong> upper Susitna was toDe studied first <strong>for</strong> potential hydropower. The feasibility report on <strong>the</strong>upper Susitna did not find it economical to transmit power by transmissionintertie facilities in <strong>the</strong> <strong>Valdez</strong> area. There<strong>for</strong>e, <strong>the</strong> feasibilityof hydropower in proximity to <strong>Valdez</strong> was also investigated under <strong>the</strong> SCRBresolution.B. ALTERNATIVES1. Plans EliminatedNumerous sites <strong>for</strong> hydroelectric development were analyzed <strong>and</strong> found tobe infeasible due to size, location, <strong>and</strong> environmental constraints.Sites eliminated in <strong>the</strong> immediate <strong>Valdez</strong> area include Gold Creek, SheepCreek, Wortmann Creek, Silver Lake, Unnamed Creek, Mineral Creek, <strong>and</strong>Lowe <strong>River</strong>.All sites east of <strong>the</strong> <strong>Copper</strong> <strong>River</strong> have been eliminated due toestaDlishment of <strong>the</strong> Wrangell-St. Elias National Park. The Tsina <strong>and</strong>Tiekel <strong>River</strong>s located between <strong>Valdez</strong> <strong>and</strong> Glennallen were eliminatedbecause <strong>the</strong>y could not provide sufficient energy to contribute to <strong>the</strong>power loads of <strong>Valdez</strong> <strong>and</strong> Glennallen. The Tonsina <strong>and</strong> Klutina <strong>River</strong>swere eliminated because of extreme adverse impacts to <strong>the</strong> fisheriesresources which contribute to <strong>the</strong> Prince William Sound salmon harvest.For fur<strong>the</strong>r in<strong>for</strong>mation, refer to <strong>the</strong> section titled "Formulation ofPreliminary Plans.1I2. Without Conditions (No Action - Plan A)The no action alternative is <strong>the</strong> least environmentally damaging of <strong>the</strong>alternatives as it would preserve a ra<strong>the</strong>r unique glacial fed drainage.However. power consumption <strong>for</strong> <strong>the</strong> <strong>Valdez</strong>-Glennallen area is projected toexceed <strong>the</strong> capability of <strong>the</strong> Solomon Gulch hydroelectric project by <strong>the</strong>time it comes on line in late <strong>1981</strong>. With <strong>the</strong> cost of diesel escalating<strong>and</strong> its availability a concern. hydroelectric projects, like <strong>the</strong> proposedproject. would be more cost effective <strong>and</strong> efficient.The city dock expansion <strong>and</strong> ALPETCO plant will increase <strong>the</strong> population of<strong>Valdez</strong>, thus increasing power consumption. The need <strong>for</strong> additional powerwill result in <strong>the</strong> construction of a project such as Allison Lake whe<strong>the</strong>rit is constructed with Federal, State, or local funding.EIS-l
3. Diesel - Pressure Reducing Turbine (PRT) (Plan B)The proposed PRT would be located 5 miles east of <strong>the</strong> oil pipelineterminal at a site on <strong>the</strong> Trans-Alaska pipeline, Block Valve No. 125,where <strong>the</strong> necessary tap was installed during construction. This area wasselected to take advantage of <strong>the</strong> head available as <strong>the</strong> pipeline descendsThompson Pass. The PRT would produce approximately 7.4 megawatts ofelectrical power based on a flow of 1.5 million barrels per day. Theadvantages of this plan are <strong>the</strong> relatively low installation costs <strong>and</strong> <strong>the</strong>low environmental impacts. The disadvantages include <strong>the</strong> relativelyshort life of <strong>the</strong> pipeline project <strong>and</strong> <strong>the</strong> assurance of constant oilflows. The oil reserves in <strong>the</strong> Prudhoe Bay area may be depleted within15 to 20 years which would terminate <strong>the</strong> PRT project. Maintenance <strong>and</strong>emergency shutdown of <strong>the</strong> Trans-Alaska pipeline would cease electricalgeneration. During <strong>the</strong> periods of shutdown, a st<strong>and</strong>by diesel generationsystem would be utilized. This system would have to be maintained yearroundto insure dependable power when <strong>the</strong> PRT is nonoperational. Onlyminor environmental impacts associated with disturbance <strong>and</strong> <strong>the</strong>transmission corridor would occur with this plan.It should be noted that <strong>the</strong> Corps of Engineers has no authority toconstruct or fund ei<strong>the</strong>r diesel generation or <strong>the</strong> pressure reducingturbine.4. Diesel - Hydroelectric (Plan C)The hydroelectric portion of this alternative will consist of a tap ofAllison Lake, power tunnel, above ground penstock, powerhouse, <strong>and</strong> atransmission line intertie with <strong>the</strong> Solomon Gulch substation. The hydroelectricgeneration will provide approximately 8 megawatts of installedcapacity to <strong>the</strong> <strong>Valdez</strong>-Glennallen area. The hydroelectric alternativewill require mitigative measures to sustain <strong>the</strong> salmon run in AllisonCreek. Sug- gested mitigation includes a two tailrace system to maintainwater quality <strong>and</strong> flow in Allison Creek, <strong>and</strong> a comprehensive biologicalmonitoring study to insure <strong>the</strong> quality of <strong>the</strong> fisheries resource ismaintained at preconstruct ion levels.The diesel portion of this alternative would be utilized to meet loadrequirements above <strong>the</strong> capabil ity of <strong>the</strong> hydroelectric project. Bothsystems would be necessary by <strong>the</strong> time Allison Creek comes on line. (SeeFigure 4 under <strong>the</strong> section "Comparison of Detailed Plans.")The hydroelectric portion of this alternative is under <strong>the</strong> Corps ofEngineers· authorization, <strong>and</strong> can be constructed or funded <strong>for</strong>construction under this authority.5. Pressure Reducing Turbine (PRT) - Hydroelectric (Plan D)The design of both portions of this alternative are identical to thosepreviously discussed.This alternative would utilize <strong>the</strong> PRT <strong>for</strong> <strong>the</strong> base load <strong>and</strong> hydroelectric<strong>for</strong> peak load dem<strong>and</strong> <strong>and</strong> back-up. The power generated from thisEI5-2
alternative has been estimated to provide sufficient energy to <strong>the</strong> studyarea until about 1995. When <strong>the</strong> power generated from <strong>the</strong> PRT terminates,an intertie with <strong>the</strong> Anchorage-Fairbanks area may be feasible.C. AFFECTED ENVIRONMENT1. Physicala. General: Two specific sites are possible <strong>for</strong> development; <strong>the</strong>Lowe <strong>River</strong> flats <strong>and</strong> Allison Creek.The proposed PRT site lies at <strong>the</strong> head of Port <strong>Valdez</strong> on <strong>the</strong> south sideof Lowe <strong>River</strong>. The valley is of glacial origin <strong>and</strong> is filled with outwashaeposits of <strong>the</strong> <strong>Valdez</strong> <strong>and</strong> Corbin glaciers. The site is bounded on<strong>the</strong> north by <strong>the</strong> Lowe <strong>River</strong>, <strong>and</strong> south by <strong>the</strong> Chugach Mountains.Allison Lake is located on <strong>the</strong> south side of Port <strong>Valdez</strong>, directly acrossfrom <strong>the</strong> present city of <strong>Valdez</strong>, filling approximately one half of aglacier <strong>for</strong>med hanging valley. Allison Creek, which originates atAllison Lake, decends 1,360 feet in 2-1/4 miles to Port <strong>Valdez</strong>. It is anextremely high graaient stream <strong>for</strong> <strong>the</strong> first 2 miles with <strong>the</strong> lastquarter mile leveling considerably.The area is underlain geologically by <strong>the</strong> late Cretaceous Valaez Group, aseries of metagraywackes, shales <strong>and</strong> slates with occasional beds ofpillow basalt. This is indicative of a rapid, unsorted deposition in anocean environment. The beds are highly disturbed <strong>and</strong> no regionalstructures have yet been defined.The Port <strong>Valdez</strong> area is located in Seismic Zone 4, approximately 46 mileseast of <strong>the</strong> epicenter of <strong>the</strong> 27 March 1964 earthquake. Prior to 1964,<strong>the</strong>re were approximately 70 earthquakes, magnitude 5 or greater, in <strong>the</strong><strong>Valdez</strong> vicinity.Excluding <strong>the</strong> 1964 earthquake, magnitude 5 earthquakes have averagedapproximately one per year. Magnitude 8 or greater events have occurredthree times this century, consequently, <strong>the</strong>re is a good probability of alarge earthquake occurring during <strong>the</strong> life of <strong>the</strong> project.There has been no evidence of ruptures in area bedrock. Most destructionin port <strong>Valdez</strong> has been causea by tsunami <strong>and</strong> submarine mass movement ofunconsolidated Lower <strong>River</strong> delta deposits.The site <strong>for</strong> <strong>the</strong> proposed powerhouse (Alternate #2) is located at <strong>the</strong> 100foot elevation. <strong>Power</strong>house Alternate #1, located on delta deposits at<strong>the</strong> 20 foot elevation has been dismissed from fur<strong>the</strong>r consideration. Thedelta deposits would make good foundation material <strong>for</strong> a small surfacepowerplant; however, <strong>the</strong> area may be subject to tsunami to an elevationof +85 MLLW. During slide induced sea waves, runup at Anderson Bay, 7miles west of Allison Creek, was measured at 70 feet. Measurements atShoup Bay (Cliff Marine) on <strong>the</strong> north side of <strong>the</strong> arm show a runup of 170feet. No runup measurements were made at Jackson Point or Fort Liscum,but <strong>the</strong> cannery at Jackson Point was destroyed.EIS-3
. Hydrology <strong>and</strong> Water Quality: The water quality of <strong>the</strong> AllisonCreek dra1nage 15 11ttle affected by conditions o<strong>the</strong>r than natural, <strong>and</strong>is considered typical of a small, glacial fed system.A recording <strong>the</strong>rmograph was installed in Allison Creek at <strong>the</strong> weir inJune 1979 <strong>and</strong> <strong>the</strong> data will be collected <strong>for</strong> several more years. Therecordings indicate tnat high temperatures occur in August <strong>and</strong> lowtemperatures of 0 degrees Celsius first occur in early November (AppendixE, Table 1). Two additional tnermographs to record intergrave1temperatures of Allison Creek <strong>and</strong> <strong>the</strong> intertidal area are proposed <strong>for</strong>installation.A stream gage was installed in Allison Creek in March of <strong>1981</strong>, <strong>and</strong> willcontinue to monitor stream flows until at least project completion.Calculated flows have been established <strong>for</strong> <strong>the</strong> drainage basin usingmeteoroloq;cal data from 1948 to 1977 (Appendix E, Table 2). The datainaicate unregulated flows <strong>and</strong> predict flows which would occur uponproject completion. Estimates were also calculated to predict averageinflows to Allison Creek below Allison Lake (Appendix E, Taule 3). Tneseestimates were derived only to predict flows whicn may occur in additionto <strong>the</strong> diverted flows. It should be noted that <strong>the</strong>se flows are onlyestimates <strong>and</strong> may not precisely indicate actual flows.Water qua 1 ity ana lys i s <strong>for</strong> All i son Creek was per<strong>for</strong>med <strong>for</strong> A lyeskaPipeline Service on several occasions between 22 February 1975 <strong>and</strong>11 April 1977. Water quality analysis of Allison Lake was per<strong>for</strong>med by<strong>the</strong> Alaska District on 7 May 1979 (Appendix E, Table 4).The proposed PRT action would not affect <strong>the</strong> aquatic environment.c. Es<strong>the</strong>tics: The scenic value in <strong>the</strong> <strong>Valdez</strong> area is stillconsidered high. The view from tne city of <strong>Valdez</strong> of <strong>the</strong> proposedhydroelectric project area is of steep mountainous terrain with <strong>the</strong>natural values marred by <strong>the</strong> Alyeska Oil Terminal. Nei<strong>the</strong>r <strong>the</strong> lake nor<strong>the</strong> creek can be seen from <strong>the</strong> city <strong>and</strong> <strong>the</strong> creek cannot be viewed by <strong>the</strong>general public due to its location on restricted Alyeska property.The proposed site <strong>for</strong> <strong>the</strong> PRT is located south of <strong>the</strong> Lowe <strong>River</strong> in anarea changed by <strong>the</strong> construction of <strong>the</strong> Trans-Alaska pipeline. Thees<strong>the</strong>tic values have been changed in this area where <strong>the</strong> pipeline isunaerground, however <strong>the</strong> values are not considered poor.2. Biologicala. Vegetation: The transmission line corridor between Allison Creek<strong>and</strong> <strong>the</strong> Solomon Gulch substation is typified by dense coniferous <strong>for</strong>estof Sitka spruce ana mountain hemlock with an Llnderstory of alder <strong>and</strong>o<strong>the</strong>r shrubs. The area of <strong>the</strong> proposed powerhouse <strong>and</strong> lower reaches ofpenstock support tall thickets consisting primarily of alder with somesalmonberry, blueberry, ana devils club. Portions of <strong>the</strong> area have beendisturbed by <strong>the</strong> Alyeska terminal <strong>and</strong> pipeline construction. Tne steepEIS-4
slopes surrounding Allisorl Lake are almost exclusively covered by alpinetundra. At <strong>the</strong> head of Allison Lake is a small vegetated wetl<strong>and</strong> area.Detailed in<strong>for</strong>mation <strong>and</strong> vegetative species lists concerning this wetl<strong>and</strong>area are lacking as well as <strong>the</strong> significance to <strong>the</strong> wildlife species ofthis area.The affected marine vegetation, which may oe impacted by <strong>the</strong> proposedproject, visually consists mainly of rockweed (Fucus distichus) <strong>and</strong>coraline algae (Lithothamnion sp.). Tnese two algal representives areabundant in <strong>the</strong> intertidal area around <strong>the</strong> mouth of Allison Creek.The PRT site is located in a spruce-hardwood <strong>for</strong>est. Tne hardwoodsconsist of birch <strong>and</strong> cottonwood with an understory primarily of alders,salmonberry, blueberry, <strong>and</strong> devils club.b. Wildlife: Wildlife species known to occur in <strong>the</strong> project areainclude brown Dear, black Dear, mountain goat, wolf, wolverine, marten,porcupine, <strong>and</strong> snowshoe hare. Moose are also present in small numbersalong <strong>the</strong> Lowe <strong>River</strong> delta. The densities of <strong>the</strong> respective populationsare unknown. Very little in<strong>for</strong>mation is available on small mammals in<strong>the</strong> project area. A list of known species living in or around <strong>Valdez</strong> isin Appendix E, Table 5.The most conmlOn ly observed mammal near <strong>the</strong> proposed All i son site areblack bear. Both black <strong>and</strong> brown bear have been observed near <strong>the</strong> PRTsite with <strong>the</strong> highest concentrations occurring during <strong>the</strong> salmon runs.c. Birds: Approximately 150 species of birds have been observedwitnin <strong>the</strong> Port <strong>Valdez</strong> area. Waterfowl are numerous seasonally, withsome seabirds residing year-round.Waterfowl utilize Allison Lake to some extent. Canada geese <strong>and</strong> dabblerducks have been observed on <strong>the</strong> lake, however, not in large numbers. Thelake appears to support waterfowl <strong>for</strong> resting, possiole feeding, <strong>and</strong>molting. Tne intertidal area probably supports waterfowl <strong>and</strong> waterrelated biras year-rouna, mainly <strong>for</strong> feeding.The Port <strong>Valdez</strong> area contains most of <strong>the</strong> major bird habitat groups foundin Alaska (see Appendix E, Table 6 <strong>for</strong> species list).Nor<strong>the</strong>rn bald eagles are commonly observed in <strong>the</strong> Port <strong>Valdez</strong> area.Several eagle nests have been documented in <strong>the</strong> area of <strong>the</strong> proposedsites by <strong>the</strong> joint State/Federal Fish <strong>and</strong> Wildlife Advisory Team <strong>and</strong> <strong>the</strong>U.S. Fish <strong>and</strong> Wilalife Service. Refer to Figure 6 <strong>for</strong> <strong>the</strong> locations of<strong>the</strong> nests.d. F1Sh: Allisun Creek is a high gradient creek wnich restrictsfish movement to <strong>the</strong> lower reaches, approximately <strong>the</strong> lower quartermile. Spawning habitat <strong>for</strong> pink <strong>and</strong> chum salmon occurs from <strong>the</strong> existingE1S-5
ALLISONLAKEFIGURE 6: LOCATIONSN EAGLES NESTSEIS -S
weir to <strong>the</strong> mouth, with <strong>the</strong> majority of spawning occurring in <strong>the</strong>intertidal area. There are approximately 500 lineal feet of suitableintertidal spawning habitat. Prior to <strong>the</strong> construction of <strong>the</strong> weir byAlyesKa Pipeline Service Company <strong>for</strong> a water gallery, it is believed pinKsalmon spawning, in odd years when stronger runs occurred, existed above<strong>the</strong> weir. A fiSh passage facility was incorporated with <strong>the</strong> weirconstruction, however, it has proven unsuccessful.Escapement <strong>for</strong> Allison CreeK has been estimated by <strong>the</strong> AlasKa Departmentof Fish <strong>and</strong> Game <strong>and</strong> indicates a high of 750 spawning pink salmon in 1961<strong>and</strong> a high of 2,660 chum salmon in 1963 (Appendix E, Table 7). The AlaskaDepartment of Fish <strong>and</strong> Game attempted an escapement count in August of1980. Due to high turbidity, <strong>the</strong> count was unsuccessful.Dolly Varden char, <strong>and</strong> sculpin have also been identified as using AllisonCreek. Allison Lake has no known fishery population.e. Marine: The intertidal area at <strong>the</strong> mouth of Allison CreeK consistsof gravel, small cobble, <strong>and</strong> boulders. There is little saltwaterintrusion of Allison Creek because of <strong>the</strong> gradient of <strong>the</strong> creek near <strong>the</strong>mouth. Dense populations of rockweed <strong>and</strong> blue mussel (Mytilus edulis)are <strong>the</strong> most conspicuous species. Smaller populations of gastropods,arthropods, <strong>and</strong> o<strong>the</strong>r marine invertebrates typical of a rocky,semiprotected shoreline occur within <strong>the</strong> area which may be affected by<strong>the</strong> proposed project. Although no finfish were observed, <strong>the</strong> areaprobably supports those fish typical of <strong>the</strong> nearshore habitat.Port <strong>Valdez</strong> supports <strong>and</strong> is visited by several marine mammals which maybe affected by <strong>the</strong> proposed project. HIe shore area from 0.3 miles westof Allison Creek to 0.3 miles west of Dayville Flats Creek has beenidentified as a feeding area <strong>for</strong> sea otters <strong>and</strong> harbor seals.Species lists <strong>for</strong> <strong>the</strong> marine environment in <strong>the</strong> <strong>Valdez</strong> area are includedin Appendix E, Table 5.f. Rdre <strong>and</strong> Endangered Species: No rare <strong>and</strong> endangered species wereidentified <strong>for</strong> <strong>the</strong> proposed project area. Refer to U.S. Fish <strong>and</strong>Wildlife letter, Appendix E.3. Socio-economicsPrior to <strong>the</strong> construction of <strong>the</strong> Alaska Railroad, <strong>Valdez</strong> was <strong>the</strong> onlyall-season port of entry to <strong>the</strong> interior. The AlasKa Railroad established<strong>the</strong> rail system from Seward to Fairbanks through Anchorage whicheliminated <strong>Valdez</strong> as an important port of entry to <strong>the</strong> interior.During <strong>the</strong> perioo preceding <strong>the</strong> construction of <strong>the</strong> Trans-Alaskapipeline, government was HIe largest employer. Although its importancehas lessened, government is still <strong>the</strong> largest single employer today.The population of <strong>Valdez</strong> has fluctuated dramatically in <strong>the</strong> past decadebecause of <strong>the</strong> local construction boom associated with <strong>the</strong> Trans AlaskaEIS-7
pipeline <strong>and</strong> marine terminal. The population in 1969 was approximately1,000, grew to 8,000 in mid-1976 <strong>and</strong> steadied to 3,350 by 1979.Future population fluctuations will occur with <strong>the</strong> construction of AlaskaPetrochemical Company (ALPETCO) plant. During <strong>the</strong> construction phaseALPETCO will employ nearly 1,000 people <strong>and</strong> <strong>the</strong> operational phase willemploy over 700 persons.Table 2 ofwork<strong>for</strong>ce.members ofdependents<strong>the</strong> main report presents employment estimates <strong>for</strong> <strong>the</strong> <strong>Valdez</strong>Approximately 35 to 40 percent of <strong>the</strong> <strong>Valdez</strong> population are<strong>the</strong> 1abur <strong>for</strong>ce. This means <strong>the</strong>re are approximately 1.5<strong>for</strong> every member of <strong>the</strong> work<strong>for</strong>ce.4. Cu ltura 1 ResourcesThere are no cultural resources in <strong>the</strong> affected area of <strong>the</strong> <strong>Valdez</strong>hydropower project. The area had <strong>the</strong> potential of yielding prehistoricChugach Eskimo evidence because of <strong>the</strong> traaitiona1 l<strong>and</strong> use of <strong>the</strong>sepeople in Prince William Sound. Historical events surrounding early<strong>Valdez</strong>, such as Army exploration, mineral mining <strong>and</strong> settlement is veryrich. No remains, however, are left in <strong>the</strong> affected area. For a morecomplete account see Appendix F.D. ENVIRONMENTAL EFFECTS1. Physicala. General: The plans discussed in <strong>the</strong> report all utilize twomethods of power generation. Since <strong>the</strong> impacts associated with dieselgeneration already exist, no new diesel plants are proposed. Thehydroelectric project will have its own unique impacts on <strong>the</strong> environmentwhe<strong>the</strong>r associated with diesel or <strong>the</strong> Pressure Reducing Turbine. Forreasons of clarity <strong>and</strong> continuity, <strong>the</strong> impacts of <strong>the</strong> hydroelectricproject <strong>and</strong> <strong>the</strong> Pressure Reducing Turbine will be discussed separately.b. Hydrology <strong>and</strong> Water Quality:Hydroelectric Project: The proposed laKe tap would withdraw waterfrom a depth of 117 feet below <strong>the</strong> existing normal lake level. Laketemperatures have only been collected on one occasion, 13 April 1978.The temperature profile indicates that no stratification occurs <strong>and</strong>little temperature change occurred past 8 meters. Although no summertemperatures were taken, using <strong>the</strong> worse case basis, <strong>the</strong> area <strong>for</strong>withdrawal will oe approximately 4° C.The discharge of 4° C water into Allison Creek may cause <strong>the</strong> streamtemperatures to be reduced below <strong>the</strong> powerhouse during <strong>the</strong> summermonths. The actual impacts on <strong>the</strong> downstream temperature regime areunknol'm. Pred ict i ng downstream changes in stream temperatures is 1 imiteadue to problems in estimating <strong>the</strong> degree of mixing in a lateral stream<strong>and</strong> in evaluating convective <strong>and</strong> evaporative heat losses under conditionsof local atmospheric stability. Estimates made of <strong>the</strong> average inflowEIS-8
expected to Allison Creek below Allison Lake indicate <strong>the</strong> highest flowsoccur in June, July, <strong>and</strong> August. July <strong>and</strong> August are <strong>the</strong> most criticalmonths because of spawning salmon.Winter withdrawals from <strong>the</strong> lake wOUld be warmer than <strong>the</strong> natural streamtemperatures. Thermograph readings show water temperatures in <strong>the</strong> wintermonths to be near 0° C while lake temperatures are at 3.5 0 C. Sincewinter is <strong>the</strong> high power dem<strong>and</strong> period, <strong>the</strong> project would probably berunning at maximum output part of <strong>the</strong> time. The maximum power releasehas been estimated at approximately 100 CUbic feet per second (cfs) witha predicted streamflow above <strong>the</strong> powerhouse Detween 1 to 5 cfs.Hydroelectric projects tend to even flows. Natural high summer flowswould be utilized to refill <strong>the</strong> lake, <strong>the</strong>re<strong>for</strong>e reducing outflows from<strong>the</strong> lake. During <strong>the</strong> winter months when natural flows are low, <strong>the</strong> waterused <strong>for</strong> electrical generation would SUbstantially increase <strong>the</strong> flows.The entire stream would be impacted by <strong>the</strong> proposed project with bothsummer <strong>and</strong> winter flows decreased above <strong>the</strong> powerhouse location. Theproposed powerhouse site is located above <strong>the</strong> existing weir,approximately one quarter mile from Port <strong>Valdez</strong>. At this location, <strong>the</strong>water would reenter Allison Creek.Tne natural flUShing process woula be affected by <strong>the</strong> hydroelectricproject, <strong>the</strong>reby reducing streambed scour <strong>and</strong> possibly increasingsedimentation of spawning gravels. Allison Creek has a stable streambed,consisting mainly of boulders <strong>and</strong> slaty cobbles with very small amountsof s<strong>and</strong>s <strong>and</strong> gravels. Little fine grain material appears to be entering<strong>the</strong> system, consequently, sedimentation of <strong>the</strong> spawning bedS may notoccur. During high water years, <strong>the</strong> extra quantities of runoff mayprovide adequate flows <strong>for</strong> flUShing. The intertidal area supports <strong>the</strong>majority of spawning activity, <strong>and</strong> tidal fluctuation should keep <strong>the</strong>spawning area free from sedimentation.Winter is <strong>the</strong> tinle of high power consumption <strong>and</strong> also <strong>the</strong> time of lowflows into <strong>the</strong> lake. The increased flows through <strong>the</strong> powerhouse wouldcause <strong>the</strong> lake to De drawn down a maximum of 100 feet from <strong>the</strong> naturalwater 1 eve 1.The tailrace to <strong>the</strong> creeK would consist of a 5-foot diameter steel pipeat a 10 percent slope. The length would be 20 feet with a 10-foottransition to a 2.5-foot diameter steel pipe on <strong>the</strong> sanle slope. Anenergy dissipater Ivould be built on tne banks of <strong>the</strong> creek with very1 itt le instream construct ion. Tne impacts occurring with <strong>the</strong> constructionof <strong>the</strong> dissipater should be minimal; however, in order to assure noimpacts occur on ei<strong>the</strong>r spawning salmon or <strong>the</strong>ir incubating eggs, constructioncould occur between early June <strong>and</strong> mid-July or during <strong>the</strong>winter months when construction could be accomplished out of <strong>the</strong> streambecause of <strong>the</strong> reduction in flow. Approximately 5 cubic yards of riprapwould be placed in <strong>the</strong> creek just below <strong>the</strong> energy dissipater. Tneriprap would be approximately 1.5 feet thick <strong>and</strong> cover about 10 squareyards. The riprap WOUld assure that water from <strong>the</strong> powerhouse would notcause scour or erosion.EIS-9
The lake may be drawn down to <strong>the</strong> level of <strong>the</strong> tap upon completion of <strong>the</strong>project to secure necessary gating <strong>and</strong> screening structures. Tnedrawdown would decrease water quality in Allison Creek by increasingturbidity <strong>and</strong> flows, <strong>and</strong> by changing <strong>the</strong> temperature regime. Becausewater quality degradation could have an effect on <strong>the</strong> fisheries resourcesof Allison Creek <strong>the</strong> drawdown <strong>for</strong> lake tap structure placelnent wouldoccur at <strong>the</strong> optimal time <strong>for</strong> <strong>the</strong> fishery.During <strong>the</strong> operation of <strong>the</strong> proJect, <strong>the</strong> lake would be drdwn downapproximately 100 feet during <strong>the</strong> winter months when <strong>the</strong> lake is icecovered. Little erosion is anticipated because of <strong>the</strong> large bouldershoreline which surrounds most of <strong>the</strong> lake. A small delta is located at<strong>the</strong> head of tile lake which consists mainly of fine grain glacialoutwash. This area could experience some erosion during drawdown, but towhat degree is unknown. The Snettisham hydroelectric project near Juneautaps Long Lake which is similar in configuration to Allison Lake.Althougn <strong>the</strong> depth, size of <strong>the</strong> lake <strong>and</strong> size of <strong>the</strong> delta are greater,Long Lake experiences a drawdown of 114 feet. To date, little waterquality degradation is occuring <strong>and</strong> <strong>the</strong> delta area appears to be stable.The drilling of <strong>the</strong> penstock tunnel would require approximately 300gallons of water per hour which would probably be pumped from <strong>the</strong> lake.The discharged water from <strong>the</strong> drills would be allowed to flow out of <strong>the</strong>tunnel, <strong>and</strong> diKes <strong>and</strong> diversion ditches would be used to assure that <strong>the</strong>water does not enter Allison Creek.Pressure Reducing Turbine: Tnere would be no hydrology or waterquality impacts associated with <strong>the</strong> construction <strong>and</strong> operation of <strong>the</strong>PRT.c. Es<strong>the</strong>tics:Hydroelectric: Approximately 20,000 cubic yards of tunnel tailingswould be disposed of on a dense st<strong>and</strong> of alder, devils club, redelderberry, <strong>and</strong> salmonberry. Tne talus created by <strong>the</strong> disposal would bevisible from <strong>Valdez</strong>. The natural l<strong>and</strong>scape of wea<strong>the</strong>red rock <strong>and</strong>vegetative cover would be visually marred by tne deposition of lightercolored rock. If <strong>the</strong> disposal site is visually offensive, a revegetationprogram coula be initiated in attempt to cover <strong>the</strong> talus.O<strong>the</strong>r aspects of <strong>the</strong> project would probably not degrade <strong>the</strong> visualquality of <strong>the</strong> area. The powerhouse is small <strong>and</strong> located in an improvedarea. The majority of <strong>the</strong> aboveground penstock would not be in viewexcept by air or pOSSibly boat. The lake can only be viewed by air <strong>and</strong>visual impacts of <strong>the</strong> drawdown could only be seen by a few.Pressure Reducing TurDine: The constructlon of <strong>the</strong> housing <strong>for</strong> <strong>the</strong>PRT unit would distract from <strong>the</strong> existing natural visual environment,however, it appears <strong>the</strong> structure would not be visible from <strong>Valdez</strong> or <strong>the</strong>road system. The transmission line would connect with <strong>the</strong> proposed<strong>Valdez</strong>-Glennallen intertie, <strong>and</strong> little aaditional clearing would berequired.EIS-1D
2. Biologicala. Vegetation:,r-.Hydroelectric: No direct vegetative impacts would be associated with<strong>the</strong> underground penstock, however, <strong>the</strong> tailings from <strong>the</strong> tunnel would berenwved from <strong>the</strong> portal <strong>and</strong> dumped into a canyon located to <strong>the</strong> east.The material would De dumped over a near vertical cliff <strong>and</strong> cover an areaof a dense alder st<strong>and</strong> with devils Club, red elderberry <strong>and</strong> salnlonberryunderstory at <strong>the</strong> bottom of <strong>the</strong> canyon. Revegetation of <strong>the</strong> impactedarea witn simi lar species proDably WOuld not occur <strong>for</strong> nlany years due to<strong>the</strong> different nature of <strong>the</strong> tunnel material <strong>and</strong> <strong>the</strong> existing disposalsite material. Alternative methOdS <strong>and</strong> sites <strong>for</strong> tailings disposal havebeen eliminated mainly because of physical constraints. Roadconstruction to <strong>the</strong> tunnel portal would require consideraole excavationinto <strong>the</strong> mountain side which would cause es<strong>the</strong>tic degradation <strong>and</strong> greatlyincrease <strong>the</strong> possibilities of erosion. No alternative sites are near <strong>the</strong>tunnel portal with gradual slopes that could contain <strong>the</strong> tailings. Theproposed disposal site does not drain into ei<strong>the</strong>r Allison Creek orSolomon Creek <strong>and</strong> any increased sedimentation would not affect anadromousfish.The above-ground penstock would require a 2,8S0-foot right-of-wayapproximately 10 feet wide. The lower portion of <strong>the</strong> proposed right-ofwayconsists of a dense alder thicket while <strong>the</strong> upper portion of <strong>the</strong>right-of-way is ei<strong>the</strong>r unvegetated or consists of alpine tundra. Alllarge bushes <strong>and</strong> snrubs would be removed, with <strong>the</strong> low ground coverremalnlng. Sixteen concrete anchor blocks <strong>and</strong> 190 concrete support piersWould be utilized to support <strong>the</strong> penstock above ground. In <strong>the</strong>se areasall vegetation would be cleared. In <strong>the</strong> exposed areas where <strong>the</strong>vegetative cover would be removed, revegetation with suitable specieswould occur upon project completion.The transmission line would impact tne Sitka spruce/mountain hemlock<strong>for</strong>est located along <strong>the</strong> 3.S-mile long, 50-foot wide corridor. Theentire line would require essentially continuous clearing regardless of<strong>the</strong> exact alignment. Small shrubs <strong>and</strong> bushes would remain <strong>and</strong> all o<strong>the</strong>rmaterials would be burned, chipped, or left in place as determined by <strong>the</strong>U.S. Forest Service which is <strong>the</strong> administrator of <strong>the</strong> l<strong>and</strong>. The terrainexclUdes establiShing <strong>the</strong> transmission line next to tne Dayville Road(refer to Photo on page ii of <strong>the</strong> Feasibility Report <strong>and</strong> <strong>the</strong>topographical map. Plate D-A-3 in Appendix D). Although <strong>the</strong> Trans-AlaskdPipeline Corridor has been clearcut, Alyeska Pipeline Service isreluctant to allow any construction tnat would hinder <strong>the</strong>ir access along<strong>the</strong> corridor. The tentative route would De as near <strong>the</strong> Dayville Road aspossible.The powerhouse would only occupy an area large enough to house <strong>the</strong> twoturbines. The proposed powerhouse site is in an area co~ered mainly withalder with a portion of <strong>the</strong> site having been previously cleared. Aproposed mitigative tailrace leading to Port <strong>Valdez</strong> would cross an areawhich has been cleared <strong>and</strong> covered with gravel <strong>and</strong> supports littlevegetation.E I S- 11
Some impacts would occur to <strong>the</strong> intertidal algal vegetation in <strong>the</strong> areadesignated <strong>for</strong> tne riprap. Tne riprap would cover fairly dense growthsof rockweed (Fucus disticus) <strong>and</strong> encrusting algae. Colonization of <strong>the</strong>riprap material would occur, probably to a lesser extent than prior todisposal, because of <strong>the</strong> freshwater introduction <strong>and</strong> <strong>the</strong> <strong>for</strong>ce of <strong>the</strong>falling water.Pressure Reducing Turbine: Tne site <strong>for</strong> <strong>the</strong> PRT structure is locate~on <strong>the</strong> Trans-Alaska pipeline corridor. The pad <strong>and</strong> road are alreadyexisting <strong>and</strong> little vegetative alteration would occur. The exactlocation of <strong>the</strong> transmission line has not been determined at this time.If it is allowed to follow <strong>the</strong> existing oil pipeline route, littlevegetation impact would occur. Any o<strong>the</strong>r route would impact a 50-footwide corridor <strong>for</strong> <strong>the</strong> length of <strong>the</strong> transmission line.b. Wildlife:General:projects <strong>and</strong>conaucted totransmissionAct of 1940.Prior to construction of ei<strong>the</strong>r <strong>the</strong> hydroelectric or PRT<strong>the</strong>ir transmission line corridors, a survey would beascertain <strong>the</strong> exact locations of eagle nests. Theline corridors would be routed to comply with <strong>the</strong> Bald EagleHydroelectric: Tne transmission corridor would cnange approximately24 acres of mature Sitka spruce/mountain hemlock <strong>for</strong>est, located betweentne Dayville Road <strong>and</strong> <strong>the</strong> AlyesKa oil pipeline, to a small brush anashrub habitat. Utilization of <strong>the</strong> proposed transmission right-of-way bylarge mammals is low partially because <strong>the</strong> surrounding area has moderatehuman activity to act as a deterrent to migratory or resident mammals.The construction <strong>and</strong> maintenance of <strong>the</strong> transmission line corridor wouldincrease <strong>the</strong> influence of man's disturbance <strong>for</strong>cing <strong>the</strong> animals far<strong>the</strong>rsouth.The proposed construction of <strong>the</strong> project would have varying effectsduring different phases of construction. Blasting <strong>and</strong> drilling of <strong>the</strong>penstock tllnel could cause mountain goats <strong>and</strong> o<strong>the</strong>r highly mObileanima1s to evacuate <strong>the</strong> area temporarily. Winter construction coulddisturb <strong>the</strong> resident black bear causing <strong>the</strong>m to locate alternate dens.Bear-human conflicts could increase especially if stringent regulationsconcerning feeding or harassing of bears are not en<strong>for</strong>ced.Pressure Reducing Turbine: Bear have been observed along <strong>the</strong> Lowe<strong>River</strong> in <strong>the</strong> area of <strong>the</strong> PRT site. The construction of <strong>the</strong> PRT facility<strong>and</strong> transmission route may cause alterations in <strong>the</strong>ir movement to <strong>the</strong>Lowe <strong>River</strong> during salmon spawning. Operation <strong>and</strong> maintenance of <strong>the</strong>facility may also impede bear movement. This impact appears to beunavoidable <strong>and</strong> its significance is unKnown.c. Birds:Hydroelectric: Waterfowl utilizing <strong>the</strong> lake <strong>for</strong> resting <strong>and</strong> feedingwould probably not be affected except during <strong>the</strong> construction phase.EIS-12
Waterfowl <strong>and</strong> water related birds found at <strong>the</strong> mouth of Allison Creek mayavoid tne immediate area during <strong>the</strong> construction phase with no long termadverse effects expected. The possible increase of freshwater into <strong>the</strong>bay may cause minor shoreline icing during winter months <strong>and</strong> coulddecrease <strong>the</strong> available habitat.Slignt changes in tne marine habitat would occur through <strong>the</strong> increase ofwinter freshwater <strong>and</strong> <strong>the</strong> placement of 5 cubic yards of riprap. Themarine habitat changes are considered minor.Pressure Reducing Turbine: Clearing <strong>for</strong> <strong>the</strong> transmission corridorwould change blrd nabltat from dense woodl<strong>and</strong> to woodl<strong>and</strong> edge. Somenesting habitat would be lost, but it does not appear to be a significantimpact. Prior to transmission line routing, tne area would be surveyedto assure bald eagle nesting would not be impacted <strong>and</strong> an adequate bufferzone would be estaDlisned near nesting activity.d. Fish:Hydroelectric: The impacts which would occur to <strong>the</strong> fisheryresources of All1son Creek are associated with changes in watertemperature <strong>and</strong> tne flow regime.Adult pink <strong>and</strong> cnum salmon spawn from July through Septemoer when <strong>the</strong>natural high water temperature of Allison Creek is from 8 to 11 0 C.Spawning is directly related to stream temperature; salmon spawn earlierin <strong>the</strong> season in colder streams <strong>and</strong> later in <strong>the</strong> season in warmerstreams. Intertidal spawners also spawn later in <strong>the</strong> season. Because of<strong>the</strong> timing of spawning, intertidal <strong>and</strong> freshwater spawning salmon of <strong>the</strong>same stream are of different genetic stock; interbreeding does notoccur. Although it is not known at this time, Allison Creek probably hastwo distinct runs of pink salmon in <strong>the</strong> odd years, <strong>the</strong> majority of <strong>the</strong>early run enters <strong>and</strong> spawns in freshwater with a later run spawningalmost exclusively intertidally. Tne most plausible explanation <strong>for</strong> tnerelationship between time <strong>and</strong> stream temperatures is that <strong>the</strong>y arecoordinated to provide optimulTI survival <strong>and</strong> <strong>the</strong> most advantageous timing<strong>for</strong> emergence.The lake tap WOUld substantially cnange water temperatures at tne time ofspawning. The proposed project would draw water from <strong>the</strong> lake bottom ata temperature of approximately 4 0 C. Although <strong>the</strong>re would be naturalflows occurring from <strong>the</strong> drainage basin Delow <strong>the</strong> outlet, (Appendix E,Taole 3) stream water temperatures would decrease. A temperature above4.5 0 C is critical <strong>for</strong> normal embryonic development. With temperaturesbelow 4.5 0 C, mortality increases, <strong>and</strong> spinal de<strong>for</strong>mities occur. At 2 0C, complete mortality results. It appears during normal water years withnormal runoff into <strong>the</strong> stream below <strong>the</strong> lake outlet, water temperatureswith <strong>the</strong> proposed project would be above <strong>the</strong> critical level, however, lowwater years may cause temperatures oelow 4.5 0 C.EIS-13
Intertidal spawning, which is <strong>the</strong> majority of spawning activity, may alsobe affected by reduced temperatures, however, it is not known to whatextent. The t ida 1 range is approx imate 1y 18 feet ana depend i ng on whattidal level spawning occurs, <strong>the</strong> effects would vary. The most successfulspawning occurs above <strong>the</strong> -8 to -10-foot line from MHHW <strong>and</strong> at low tideswhen only freshwater would occur during early incubation. Whe<strong>the</strong>r <strong>the</strong>perioas of marine influence would compensate <strong>for</strong> <strong>the</strong> colder freshwater isunknown.Winter water temperatures of Allison CreeK would be warmer with tneproposed project than occurs naturally. Winter temperatures in <strong>the</strong> lakeat <strong>the</strong> depth of <strong>the</strong> tap are approximately 3.5 0C while <strong>the</strong> present wintertemperature of Allison Creek is near 00 C. The timing of emergence <strong>and</strong>downstream migration of salmon fry depend on <strong>the</strong> temperature regimebecause <strong>the</strong> development rate depends on temperature. Warmer water from<strong>the</strong> proposed project would decrease incubation time, possibly by onemonth. If early emergence occurred, <strong>the</strong> likelihood of an adequate foodsource <strong>for</strong> <strong>the</strong> fry would be low. Intertidal incuoation <strong>and</strong> emergencewould also be accelerated, however not to <strong>the</strong> extent of instream spawning.As discussed earlier, spawning probably occurs in Allison Creek prior tointertidal spawning. The time-temperature coordination of spawning <strong>and</strong>development is a result of adaption, to assure that <strong>the</strong> norlllal time <strong>for</strong>seaward migration of <strong>the</strong> fry is <strong>the</strong> most opportune time <strong>for</strong> foodavai 1abil ity, <strong>and</strong> possibly saltwater temperatures.The proposed project would alter both temperatures at <strong>the</strong> time ofspawning activity <strong>and</strong> during incubation. Deviations from <strong>the</strong> existingtemperatures caused by project operations cannot but influence survival.Pressure Reaucing Turbine:project.No impacts to fish would occur with thise. IViarine: The additional freshwater in <strong>the</strong> winter months may havesome impact on <strong>the</strong> intertidal area. Much of <strong>the</strong> affected area receivesfreshwater during higher flows <strong>and</strong> marine productivity appears to beequal to <strong>the</strong> areas where high concentrations of freshwater do not occur.Whe<strong>the</strong>r part of <strong>the</strong> species' life history necessitates periods of nofreshwater influence is unknown: however, it appears that increasedwinter flows would have little effect.Mitigative measures require tne placement of approximately 5 cubic yardsof riprap below <strong>the</strong> tailrace <strong>for</strong> erosion protection. Approximately 10square yards of marine habitat at <strong>the</strong> MHHW mark would be covered.Recolonization may occur, but probably not to <strong>the</strong> extent of preconstructionproductivity.f. Rare <strong>and</strong> Endangered Species: There are no rare or endangeredspecies in <strong>the</strong> project area.3. Socio-EconomicTne construction pnase may employ as many as 100 persons. No constructioncamp is likely to be built, <strong>the</strong> employees would have to fino lodgingEIS-14
within <strong>the</strong> local community. The impact of <strong>the</strong> employees on <strong>the</strong> localeconon~ would probably be minor; however coupled with <strong>the</strong> construction of<strong>the</strong> city dock <strong>and</strong> <strong>the</strong> ALPETCO plant, <strong>the</strong> cumulative effects may cause asurge in <strong>the</strong> <strong>Valdez</strong> econorr~. Proposed construction times indicate <strong>the</strong>Allison project would be built after <strong>the</strong> above projects are completed.The power generated at Allison Creek may have a long term positive impacton <strong>the</strong> economy of <strong>Valdez</strong> <strong>and</strong> Glennallen area. Initially <strong>the</strong> cost of <strong>the</strong>power would De approximately equivalent to <strong>the</strong> present power costs basedon <strong>the</strong> October 1980 cost estimate. Once constructed, future priceincreases would be related to tne increase in operation <strong>and</strong> maintenancecosts. Increases with diesel generation is directly related to <strong>the</strong> priceof diesel, which is escalating rapidly.The operation <strong>and</strong> maintenance of <strong>the</strong> facility would require very fewpersons. ana <strong>the</strong>ir presence would have little impact on <strong>the</strong> socioeconomicstructure of <strong>the</strong> study area.4. Cultural ResourcesThere are no cu ltura 1 resources in tne affected area, thus no impacts.E. MITIGATIONThe proposed hydroelectric project on Allison CreeK may eliminate <strong>the</strong>natural runs of both pink <strong>and</strong> chum salmon over a period of time.Although <strong>the</strong> fiShery resource of Allison Creek is not large in comparisonwith o<strong>the</strong>r river systems in Prince William Sound, <strong>the</strong> resource should bemaintained as close to its preconstruct ion strength as is practicable.A two tailrace system was devised to regulate <strong>the</strong> amount of water beingreleased into Allison Creek. The system consists of an additionaltailrace which would empty directly into Port <strong>Valdez</strong>. Both tailraceswould incorporate a gating mechanism which could regulate <strong>the</strong> amount offlow through a particular tailrace. Thus, all <strong>the</strong> water, any portion of<strong>the</strong> water', or none of Ule water can be regu 1 ated through ei<strong>the</strong>rtailrace. The upper powerhouse location would help protect both <strong>the</strong>intertidal <strong>and</strong> Allison Creek fisheries. This was one of <strong>the</strong> contributingfactors <strong>for</strong> <strong>the</strong> selection of <strong>the</strong> upper powerhouse site as <strong>the</strong> preferredalternative.The discharge from <strong>the</strong> powerhouse would be diverted into Allisen Creekduring <strong>the</strong> periods of salmon spawning to provide adequate flows <strong>for</strong>spawning. During <strong>the</strong> winter monthS when temperature is critical <strong>for</strong> eggincubation <strong>and</strong> emergence, <strong>the</strong> discharge would be diverted directly toPort <strong>Valdez</strong>. A 4 cfs minimum during <strong>the</strong> winter months was suggested byU.S. Fish <strong>and</strong> Wildlife Service <strong>for</strong> maintenance of egg incubation. Anadaitional 3/4 cfs is required <strong>for</strong> Alyeska's water supply. If naturalflows are below 5 cfs, <strong>the</strong> tailrace to Allison Creek can be utilized toaugment that portion belo~ 5 cfs.Studies on similar ldkes in Alaska indicate that bottom temperaturesduring <strong>the</strong> spawning season are higher than 4°C used in this report.IfE1S- 15
Allison Lake limnology is similar to Bradley Lake near Homer <strong>and</strong> CraterLaKe near Juneau, water Deing drawn through <strong>the</strong> lake tap would beapproximately 7°C. Due to <strong>the</strong> lack of data, <strong>the</strong> worse case basis wasused. Prior to any construction, temperatures would be determined <strong>and</strong>measures to prevent less than optimal temperatures would be employed, ifnecessary.Without mitigative measures, major adverse impacts to <strong>the</strong> fishery areexpected to occur. If <strong>the</strong> change in water temperature causes acceleratedegg incubation <strong>and</strong> early fry emergence, <strong>the</strong>re is a high probability that<strong>the</strong> majority of <strong>the</strong> salmon run would be destroyed. Environmental studiesto fill <strong>the</strong> data gaps associated with <strong>the</strong> impacts on <strong>the</strong> salmon resourceshave been scheduled <strong>for</strong> <strong>the</strong> advanced engineering <strong>and</strong> design phase. Thestudy would begin prior to construction, monitor <strong>the</strong> effects duringconstruction, <strong>and</strong> assess <strong>the</strong> impacts of <strong>the</strong> project on <strong>the</strong> fisheryresource of Allison Creek. The proposed stUdy would collect backgroundin<strong>for</strong>mation on numbers <strong>and</strong> species of spawning fish, hatching time withregard to water temperature <strong>and</strong> <strong>the</strong> effects of saltwater flooding toincubation time. The study would provide specific in<strong>for</strong>mation on <strong>the</strong>effects of a hydroelectric project on Allison Creek <strong>and</strong> would alsoprovide general in<strong>for</strong>mation on <strong>the</strong> effects of hydroelectric projects onshort coastal streams throughout Alaska. The in<strong>for</strong>mation would beutilized in future hydroelectric planning processes to assureenvironmentally sound projects.Determining a monetary value <strong>for</strong> <strong>the</strong> Allison Creek fishery appears to beinfeasible. Population estimates <strong>for</strong> Allison Creek were not scheduled<strong>and</strong> counts were made on a time-available basis. Tne counts were not madedaily during <strong>the</strong> entire run <strong>and</strong> <strong>the</strong> estimates must De considered as <strong>the</strong>least number of spawning adults.Commercial fishing catches show only a small portion of <strong>the</strong> value of asalmon run. Based on research statistics <strong>for</strong> this region of Alaska <strong>and</strong>using <strong>the</strong> highest number of spawning chum salmon (2,660) with half beingfemales (1,130), approximately 3,657,500 eggs are deposited. Mortalityis high <strong>and</strong> approximately 75 percent of <strong>the</strong> eggs ei<strong>the</strong>r do not hatch or<strong>the</strong> fry never migrate to <strong>the</strong> ocean. Successful fry may number in excessof 900,000 individuals. To maintain <strong>the</strong> species, at least 2,660 fishwill return to spawn, or 0.3 percent of <strong>the</strong> successful fry. For astatewide average, commercial catches equal escapement or 2,660 fish.This leaves over 909,175 fish which enter <strong>the</strong> food web. The exact amountof biomass added to <strong>the</strong> next trophic level is unknown but is considerablymore than that taken in <strong>the</strong> commercial harvest.O<strong>the</strong>r nonquantifiable values are <strong>the</strong> contribution to <strong>the</strong> sports fishery,es<strong>the</strong>tic values, <strong>and</strong> <strong>the</strong> contribution to <strong>the</strong> human nonconsumptiveknowledge of <strong>the</strong> natural environment.EIS-16
Cumulative impacts to <strong>the</strong> Port <strong>Valdez</strong> fishery are now occurring. Theconstruction of <strong>the</strong> ALPETCO facility <strong>and</strong> docK, <strong>the</strong> city docK expansion<strong>and</strong> <strong>the</strong> Solomon Gulch hydroelectric project <strong>and</strong> proposed development onMineral CreeK are reducing salmonid fishery resources by both directimpacts to habitat <strong>and</strong> migration routes <strong>and</strong> indirect impacts associatedwith <strong>the</strong> additional stress placed on <strong>the</strong> fish. The proposed <strong>and</strong> actualdevelopment in Port <strong>Valdez</strong> adds to <strong>the</strong> value of <strong>the</strong> Allison fishery,again in an unquantifiable amount.Maintenance of <strong>the</strong> powerhouse <strong>and</strong> penstock system would occur periodically.During penstock maintenance, no water would be added to <strong>the</strong>creek. If this occurs <strong>for</strong> an extended period of time while natural flowsare low, adverse impacts on <strong>the</strong> fishery resources could occur. Theprobability of maintenance of <strong>the</strong> penstock system is low <strong>and</strong> anyscheduled maintenance would occur during periods of high natural streamflows. Turbine shutdown would occur more regularly. However, at leastone of <strong>the</strong> two turbines could be run at a lower output to meet fisheriesneeds.F. CUMULATIVE IMPACTSDiesel - Pressure Reducing Turbine (PRT)1. Diesel generation alreadY exists in <strong>the</strong> <strong>Valdez</strong> area <strong>and</strong> this planwould not increase <strong>the</strong> number or output of diesel generators. Theaddition of <strong>the</strong> PRT would not cause cumulative adverse effects, but <strong>the</strong>new impacts would only occur with <strong>the</strong> construction, operation, <strong>and</strong>maintenance of <strong>the</strong> PRT facility.Diesel - Hydroelectric2. The cumulative impacts of this plan are similar to those describedbelow.Pressure Reducing Turbine - Hydroelectric3. The cumulative impacts of this plan are both biological <strong>and</strong>socio-economical. The construction of both power sources <strong>and</strong> <strong>the</strong>irancillary facilities would create a disturbed area between Port <strong>Valdez</strong><strong>and</strong> <strong>the</strong> Chugach Mountains on <strong>the</strong> south side of Port <strong>Valdez</strong>. This mayimpede movement of wildlife species <strong>and</strong> offers no areas of relief between<strong>the</strong> two projects. The extent of this impact is unknown, butsuperficially appears minor.The combination of laboran effect on <strong>the</strong> economyfacilities <strong>and</strong> services.consist largely of localeconomy.<strong>for</strong>ces to construct <strong>the</strong> two facilites may haveof <strong>Valdez</strong>. At this time, <strong>Valdez</strong> is limited inThe addition of a labor <strong>for</strong>ce which does notresidents may place a strain on <strong>the</strong> localEIS-17
Pressure Reducing Turbine - Hydroelectric <strong>and</strong> O<strong>the</strong>r Proposed RegionalActivities4. Several o<strong>the</strong>r activities have ei<strong>the</strong>r been proposed or are underconstruction in <strong>the</strong> study area. These include <strong>the</strong> construction of <strong>the</strong>city dock, transmission line to Glennallen, improvements on <strong>the</strong>Richardson Highway, <strong>and</strong> <strong>the</strong> construction of <strong>the</strong> Alaska PetrochemicalCompany (ALPETCO) refining facility. Concurrent construction activitiesin <strong>the</strong> <strong>Valdez</strong> area could cause a "boom - bust" type situation causingextreme economic impacts to <strong>Valdez</strong>. Tnis impact could be reduced withproper preparedness by <strong>the</strong> city of <strong>Valdez</strong>.G. PUBLIC INVOLVEMENT1. PUblic Involvement ProgramFormal public hearings were conducted at <strong>Valdez</strong> on 26 April 1977, 24July 1978, <strong>and</strong> 18 November 1980 to obtain public opinion describing <strong>the</strong>need <strong>for</strong> power generation, <strong>and</strong> alternative preference. Local response isstrongly in support of <strong>the</strong> selected plan. Coordination with Federal <strong>and</strong>State agencies, <strong>and</strong> local interest groups during <strong>the</strong> course of <strong>the</strong> studyinclude:U.S. Fish <strong>and</strong> Wildlife ServiceNational Marine Fisheries ServiceAlaska Department of Fish <strong>and</strong> GameState Historic Preservation Officer<strong>Copper</strong> Valley Electric AssociationAleyska Pipeline Service Company2. Required CoordinationThe final EIS was filed with tne Environmental Protection Agencyconcurrently with circulation to all parties on <strong>the</strong> project mailinglist. EPA will publish a notice of availability in <strong>the</strong> Federal Registerwhich will begin <strong>the</strong> 30-day review period. All comments received from<strong>the</strong> draft EIS are addressed in Appenaix J. The Feasibility Report <strong>and</strong>FEIS will be submitted to Congress <strong>and</strong> an exemption under Section 404(r)of <strong>the</strong> Clean Water Act will be obtainea.3. Statement ReceipientsA list of statement recipients is in Appendix I.H. COASTAL ZONE MANAGEMENTThe proposed project has been reviewed to assure that it will beundertaken in a manner consistent with <strong>the</strong> Alaska Coastal ManagementProgram to <strong>the</strong> maximum extent practicable. Coordination through <strong>the</strong> A-95Clearinghouse review <strong>for</strong> processing has been accomplished <strong>and</strong> agenciesreviewing <strong>the</strong> DEIS did not comment on any major Alaska Coastal ManagementEIS-18
Program-related issues. The Alaska District has determined <strong>the</strong> proposedhydroelectric project is consistent with <strong>the</strong> Alaska Coastal ManagementProgram.E1S-19
BIBLIOGRAPHYBailey, Jack E. 1964. "Incubation of pink salmon eggs in a simulatedintertidal environment." Reprint from Proc. of Northwest Fish Cult. Conf.,1964. p. 79-89.Bailey, Jack E. 1969. Alaska1s Fishing Resources. The Pink Salmon. DeptInter. USFWS BCF. Fish. Lent. 619. 8 pp.Bailey, Jack E., ana Evans, Dale R. 1971. liThe low-temperature threshold <strong>for</strong>pink salmon eggs in relation to a proposed hydroelectric installation." Fish.Bull. Vol 69, No.3: 587-593.Combs, Bobby D. 1965. "Effect of temperature on <strong>the</strong> development of salmoneggs. 1I Prog. Fish. Cult. 27(3): 134-137.Dames <strong>and</strong> Moore. 1980. City of <strong>Valdez</strong> Port Expansion Project. EnvironmentalAssessment. Anchorage, Alaska.Federal Energy Regulatory Commission. 1978. Solomon Gulch Project, FinalEnvironmental Impact Statement. Washington, D.C.Helle, John, H. Williamson, Richard S. <strong>and</strong> Bailey, Jack E. 1964.IIIntertidal ecology <strong>and</strong> life history of pink salmon at Olsen Creek, PrinceWilliam Sound, Alaska. 1I USFWS, Dept of Spec. Studies. 26 pp.Roberson, Ken. 1980. Personnel Communication. ADF&G, Glennallen, Alaska.Sheridan, William L. 1962. IIRelation of stream temperatures to timing ofpink salmon escapements in Sou<strong>the</strong>ast Alaska." Reprint from Symp. on PinkSalmon, H.R. MacMillan lectures in Fisheries, 1960. Univ. Brit. Col. p.87-102.State of Alaska. 1980. IIInventory report district program phase one,<strong>Valdez</strong>. Alaska. 1I Alaska Coastal Management Program. Juneau. Alaska.U.S. Environmental Protection Agency. 1980. IIAlaska petrochemical Companyrefining <strong>and</strong> petrochemical facility, <strong>Valdez</strong>, Alaska Final Environmental ImpactStatement. II Seattle, WA.Feder, Howard M., Michael Cheek, Patrick Flanagan, Stephen C. Jewitt, Mary H.Johnston, A.S. Naider, Stephen A. Norrell, A.J. Paul, Arla Scarborough <strong>and</strong>David Shaw. 1976. liThe sediment environment of Port <strong>Valdez</strong>, AlaSKa; <strong>the</strong>effect of oil on this ecosystem. 1I EPA-600/3-76-086. Corvallis, Or. 322p.Cooney, R. Ted, David Urguhart, Richard Neve, John Hilsinger, Robert Clasby<strong>and</strong> David Barnard 1978. IISome aspects of <strong>the</strong> carrying capacity of PrinceWilliam Souna, Alaska <strong>for</strong> hatchery released pink <strong>and</strong> churn salmon fry." SeaGrant Report 78-4, IMS Report R78-3. Fairbanks, Alaska 98 pp.EIS-20
13.10INDEXSubjectsAffected EnvironmentAlternativesAreas of ControversyComparative Impacts ofA lternat i vesEnvironmental EffectsList of PreparersNeed For <strong>and</strong> Objectivesof ActionPlanning ObjectivesPlans Described in DetailDraft EnvironmentalImpact StatementE1S-3 to 8EIS-1 to 3viiii to ivEIS-8 to 15i iEIS-1Feasibility Report4-821-372027-49Relationship to EnvironmentalRequirementsReport RecipientsStudy AuthoritySummaryTable of ContentsWithout Conditionsvi to viiiEIS-1iii to viiviiiE1S-1APPENDIXiii18IEIS-21
APPENDIX AHYDROLOGY
APPENDIX AHYDROLOGYTABLE OF CONTENTSItemINTRODUCTIONCL rr~ATETemperaturePrecipitationSnowWindStormsSTREAMFLOWExtension of Streamflow RecordsEstimated Damsite StreamflowsEvaporationFlood CharacteristicsPast FloodsFlood FrequenciesProbable Maximum FloodESTIMATED MONTLY STREAMFLOWSLowe <strong>River</strong> <strong>and</strong> Solomon Gulch (Table A-l)Klutina <strong>River</strong> (Table A-2)Tonsina <strong>River</strong> (Table A-3)<strong>Power</strong> Creek (Table A-4)Allison Creek (Table A-5)ALLISON LAKE - RESERVOIR REGULATION (Figure A-l)PageA-lA-lA-5A-10A-15
I NTRODUCTI ONThe area considered <strong>for</strong> possible hydroelectric alternatives included<strong>the</strong> coastal area around <strong>Valdez</strong>, <strong>the</strong> Chugach Mountains, <strong>and</strong> portions of<strong>the</strong> <strong>Copper</strong> <strong>River</strong> <strong>Basin</strong>. This area corresponds roughly to <strong>the</strong> servicearea bf <strong>Copper</strong> Valley Electric Association, over whose powerlines <strong>the</strong>electricity from any potential hydropower development would betransmi tted.This appendix describes <strong>the</strong> climate of <strong>the</strong> study area <strong>and</strong> <strong>the</strong>streamflows derived <strong>for</strong> <strong>the</strong> five sites considered as hydropoweralternatives. These sites include Allison Lake, Tsina <strong>River</strong>, Tiekel<strong>River</strong>, Tonsina <strong>River</strong>, <strong>and</strong> Klutina <strong>River</strong>. They are shown on <strong>the</strong> basinlocation map, Figurp 1 page 24 of <strong>the</strong> main report. The final page ofthis appendix is a plate which portrays reservoir regulation, includingestimated lake elevations, regulated <strong>and</strong> unregulated streamflows, as wellas firm <strong>and</strong> secondary energy <strong>for</strong> <strong>the</strong> favored development at AllisonLake. This was done on a monthly hasis <strong>for</strong> <strong>the</strong> years 1948 to 1977.CLIMATEThere is a wide variation in climate throughout <strong>the</strong> study area. Theregion adjacent to <strong>the</strong> coast is under maritime influence, with highprecipitation <strong>and</strong> relatively mild temperatures. The interior area hasmore of a continental climate, with extreme temperatures <strong>and</strong> lessprecipitation. Between <strong>the</strong>se two areas is a mountainous transitionregion whose climate is a hydbrid of maritime <strong>and</strong> continentalconditions.Valrlez, <strong>the</strong> primary load center of <strong>the</strong> coastal region, is located ona well sheltered extension of Prince William Sound. Snowcapped mountainscontaini~g extensiv~ glacier areas surround <strong>Valdez</strong> on three sides, withrugged but unglaciated mountains to <strong>the</strong> south <strong>and</strong> southwest. Activeglaciers extend t~ within 5 to 10 miles of old <strong>Valdez</strong> to <strong>the</strong> north <strong>and</strong>reach down to <strong>the</strong> level of <strong>the</strong> glacial plain on which old <strong>Valdez</strong> islocated. This level glacial plain is a well <strong>for</strong>ested area except <strong>for</strong> <strong>the</strong>tidal marshes south~/est <strong>and</strong> <strong>the</strong> glacial drainage area to <strong>the</strong> east. Theterrain surrounding <strong>Valdez</strong> exerts a pronounced influence on practicallyall aspects of <strong>the</strong> local wea<strong>the</strong>r <strong>and</strong> climate. The sheltering effects ofsurrounding mountains channel local winds into two distinct channels.From October through April prevailing winds are from <strong>the</strong> nor<strong>the</strong>ast; fromMay through September prevailing winds are from <strong>the</strong> southwest.Precipitation is abundant year-round, but builds up noticeably during <strong>the</strong>late summer <strong>and</strong> fall. The heaviest precipitation usually occurs inSeptember <strong>and</strong> October; almost 25 percent of <strong>the</strong> total annual rainfalloccurs in <strong>the</strong>se 2 months. Snowfall during <strong>the</strong> winter months is veryheavy. There is considerable cloudiness during <strong>the</strong> entire year, butslightly less tha~ is realized at Alaskan points far<strong>the</strong>r sou<strong>the</strong>ast.About 1 day in 6 can be classified as clear. Although <strong>the</strong> high mountainridges to <strong>the</strong> north provide considerable barrier to <strong>the</strong> flow of coldcontinental air from <strong>the</strong> interior during <strong>the</strong> winter months, <strong>the</strong>re is adefinite off setting factor in <strong>the</strong> downslope drainage from <strong>the</strong> highA-l
snowfields <strong>and</strong> glacier areas on <strong>the</strong> sou<strong>the</strong>rn slopes of <strong>the</strong>se mountains.The lowest temperatures recorded at <strong>Valdez</strong> appear to be due to <strong>the</strong>downslope flow of cold air, since <strong>the</strong> lowest temperatures on retord haveoccurred durinq periods with 1 ittle or no wind, providing ideal conditions<strong>for</strong> <strong>the</strong> cold air to flow down onto <strong>the</strong> flat glacial plain. Thenearby snow <strong>and</strong> icefields combine with <strong>the</strong> ocean areas to provide amoderating effect on summertime high temperatures which seldom reach <strong>the</strong>middle 80's. The surrounding mountains tend to produce considerablevariations in practically all wea<strong>the</strong>r elements within relatively shortdistances.The continental region, whic~ covers Klutina <strong>and</strong> Tonsina Lakes <strong>and</strong>most of <strong>the</strong>ir watersheds, has mean maximum summer temperatures in <strong>the</strong> midto upper 60's, <strong>and</strong> mean minimum winter temperatures around 20 below zero,Fahrenheit. The mean annual precipitation is between 10 <strong>and</strong> 20 inches,at least in lower elevations. Heavier amounts occur in <strong>the</strong> upperelevations. Surface winds are light compared to those found along <strong>the</strong>coast.In <strong>the</strong> transition region, where <strong>the</strong> conditions are between those of<strong>the</strong> maritime <strong>and</strong> continental regions, temperature extremes most resembleth~ continental zone's, while precipitation amounts range from light toheavy enough to maintain glaciers. The Tsina <strong>River</strong> <strong>and</strong> Tiekel <strong>River</strong>drainages are considered to be in <strong>the</strong> transitional zone. Surface windsin <strong>the</strong> transition region range between coastal <strong>and</strong> interior conditions,including some channeled winds through mountain valleys.While <strong>the</strong> climatic data from <strong>the</strong> <strong>Valdez</strong> wea<strong>the</strong>r station is fairlyrppresentative of <strong>the</strong> sea level conditions in <strong>the</strong> study area, lowertemperatures <strong>and</strong> greater precipitation will occur over most to <strong>the</strong> higherdrainage basins. Based on 7 years of streamflow records, which typify<strong>the</strong> amount of precipitation in <strong>the</strong> areas being studied, <strong>the</strong> Solomon Gulchgage recorded an average annual discharge of 104,300 acre-feet <strong>for</strong> a19-square mile drainage basin, yielding a basin average of 103 inchesrunoff per year.Temperature:The four climatological stations in <strong>the</strong> area are located at <strong>Copper</strong>Center, Glennallen, <strong>Valdez</strong>, <strong>and</strong> Cordova. The records <strong>for</strong> Glennallen <strong>and</strong><strong>Copper</strong> (enter are incomplete <strong>and</strong> are not presented in this analysis. Asummary of <strong>the</strong> average monthly temperatures <strong>for</strong> <strong>Valdez</strong> <strong>and</strong> Cordova ispresented below.LA-2
AVERAGE MONTHLY TEMPERATURES (OF),1anFebMarAprMayJunJulAugSepOctNovDec<strong>Valdez</strong>1 7.822.42 i). 835.1)43.851.253.352.046.537.526. 119.5Cordova23.026.729.236.043.750.453.453.048.039.630.624.6The <strong>Valdez</strong> data are recorded by <strong>the</strong> National Wea<strong>the</strong>r Service at anelevation of 87 feet mean sea level (MSL). The Cordova data are recordedby <strong>the</strong> Ferleral Aviation Administration at an elevation of 41 feet MSL.The temperatures range between 42° F <strong>and</strong> 60° F during <strong>the</strong> summer <strong>and</strong>between 11° F <strong>and</strong> 43° F during <strong>the</strong> winter <strong>for</strong> <strong>Valdez</strong> with <strong>the</strong> extremesbeing _28 0 F <strong>and</strong> 87° F. The temperatures range between 44 D F <strong>and</strong> 61° Fduring <strong>the</strong> summer <strong>and</strong> between 21° F <strong>and</strong> 39° F during <strong>the</strong> winter <strong>for</strong>Cordova with <strong>the</strong> extremes being -23° F <strong>and</strong> 86° F.80th locations average a growing season of about 4 months. Normally,<strong>the</strong> first freeze occurs early in September <strong>and</strong> <strong>the</strong> last freeze occurs inmid-May.Summertime temperature gradients follow <strong>the</strong> traditional pattern ofdecreasina temperatures with increasing altitude. During periods ofextreme winter cold, how~ver, a strong temperature inversion may exist in<strong>the</strong> lower layers of <strong>the</strong> atmosphere as a result of radiation cooling <strong>and</strong>cold air drainage <strong>for</strong> <strong>the</strong> surrounding mountains. Under <strong>the</strong>se conditions,<strong>the</strong> temperature gradient will be reversed.Precipitation:Precipitation over <strong>the</strong> basin varies from moderate amounts in <strong>the</strong> lowelevations to heavy in <strong>the</strong> mountains, to moderate amounts again in <strong>the</strong>Klutina <strong>and</strong> Tonsina drainages. The orographic effect of <strong>the</strong> ChugachMountains insures heavy precipitation in <strong>the</strong> upper elevations of <strong>the</strong>basin <strong>and</strong> lower amounts in <strong>the</strong> lower basin. Storms are generally lightin intensity, with few convective-type storms of cloudburst magnitude.The only climatological stations in <strong>the</strong> study area with reasonablycomplete precipitation data are located in <strong>Valdez</strong> <strong>and</strong> Cordova. Averagemonthly precipitation <strong>for</strong> <strong>the</strong>se communities is presented below.A-3
AVERAGE MONTHLY PRECIPITATION(inches)<strong>Valdez</strong>CordovaJan 5.06 6.14Feh 5.30 6.42Mar 4.33 5.89Apr 3.06 5.71l"1ay 3 .20 5.99,lu n 2.70 4.67Ju 1 4.31 7.08Aug 5.80 8.94Sep 7.74 13.53Oct 6.75 12.34Nov 5.67 8.37Dec 5.39 7.45ANNUAL 59.31 92.53These data were collected by <strong>the</strong> National Wea<strong>the</strong>r Service <strong>and</strong> <strong>the</strong>Federal Aviation Administration <strong>for</strong> <strong>Valdez</strong> <strong>and</strong> Cordova respectively.Snow:Snowfall records are available in <strong>the</strong> vicinity of <strong>Valdez</strong>~Glennallen.Snowfall is generally confined to October through April <strong>and</strong> comprisesapproximately 27 percent of <strong>the</strong> mean annual precipitation.Snow course data <strong>for</strong> four stations within <strong>the</strong> basin are presented in<strong>the</strong> following tahulation.Snow Cours eYears ofRecordElevation(ft) MSLAverage WaterContent Per Month(inches)MarchApri 1MayTsina <strong>River</strong>Worthington GlacierLowe <strong>River</strong><strong>Valdez</strong>721771 ,5002,4005505013.616.914.315.714.920.515.218.013.823.21 3. 118. 1lThe water content of <strong>the</strong> May snow mass provides a good index ofexpected spring runoff.Wind:The wind records available are scarce. The National Wea<strong>the</strong>r Servicemonitors <strong>the</strong> station in <strong>Valdez</strong> which has about 3 years of data. Observations<strong>the</strong>re indicate that <strong>the</strong> highest winds occur between October <strong>and</strong>A-4
April. The winds tend to follow <strong>the</strong> contours of <strong>the</strong> terrain <strong>and</strong>, thus,adjacent areas can have average winds of opposite direction. The followinqis <strong>the</strong> average fastest 1 minute wind speed <strong>for</strong> <strong>the</strong> period of record.AVERAGE WIND SPEED (MPH)JanFebMarAprMavJunJul~gSepOctNovDec2325252520181819192n2627Storms:Because of <strong>the</strong> dominating maritime influence, thunder <strong>and</strong> hail stormsrarely occur in <strong>the</strong> study area. ~wever, <strong>the</strong> area is subject to fall <strong>and</strong>winter storms of heavy precipitation intensities. These storms arecyclonic in nature <strong>and</strong> are generated by <strong>the</strong> semipermanent, Aleutian lowpressure system. This cyclogenesis takes place as a result of <strong>the</strong> coldflow of sou<strong>the</strong>asterly air from Asia, which generates a wave on <strong>the</strong> polarfront. These storms move eastward from <strong>the</strong>ir point of origin into <strong>the</strong>Gulf of Alaska, where <strong>the</strong>y cause high winds <strong>and</strong> low ceilings <strong>for</strong> a periodof 2 to 3 days. Storms of this nature usually cause copious amounts ofprecipitatio~ to fallon <strong>the</strong> coastal mountain ranges.STREAMFLOWRunoff characteristics <strong>for</strong> <strong>the</strong> study area vary substantially between<strong>the</strong> coastal <strong>and</strong> interior regions. Tn <strong>the</strong> coastal region, <strong>the</strong> maritimeinfluence areatly increases <strong>the</strong> runoff per square mile <strong>and</strong> also changes<strong>the</strong> ti~ing of high flood flows from those experienced in <strong>the</strong> interiorregion. While flood peaks do occur in May <strong>and</strong> June, due to snowmelt, <strong>the</strong>yearly maximum peaks generally center around <strong>the</strong> month of September.Streamflow records were available <strong>for</strong> several streams, in <strong>the</strong> studyarea. In all, a total of five streams were used <strong>for</strong> alternating flows.Two streams in <strong>the</strong> immediate vicinity of <strong>Valdez</strong> which have been gagedby <strong>the</strong> U.S. Geological Survey are Lowe <strong>River</strong> <strong>and</strong> Solomon Gulch. Inaddition, several o<strong>the</strong>r streams between <strong>Valdez</strong> <strong>and</strong> Glennallen have hadstreamflows recorded by <strong>the</strong> USGS. Two of <strong>the</strong>se, Klutina <strong>River</strong> <strong>and</strong>Tonsina <strong>River</strong>, are close to sites considered in <strong>the</strong> present study. Thereare discharqe data <strong>for</strong> each station <strong>and</strong> some measurements <strong>for</strong> chemicalconstituents <strong>and</strong> water temperature. The recorded monthly runoff <strong>for</strong> <strong>the</strong>A-5
gages at Lowe <strong>River</strong> near <strong>Valdez</strong>, Lowe <strong>River</strong> in Keystone Canyon near<strong>Valdez</strong>, <strong>and</strong> Solomon Gulch near <strong>Valdez</strong> are shown on Table A-l. Thestreamflows <strong>for</strong> Klutina <strong>River</strong> at <strong>Copper</strong> Center <strong>and</strong> Tonsina <strong>River</strong> atTonsina are given in Tables A-2 <strong>and</strong> A-3, respectively.The gage at Solomon Gulch was on <strong>the</strong> right bank at <strong>the</strong> tidewater, 1/2mile downstream from a small lake <strong>and</strong> about 3 miles south of <strong>Valdez</strong>. Therecords that are available are July to December 1948 <strong>and</strong> October 1949 toSeptember 1956. The average annual runoff is 104,300 acre-feet per yearor 144 cfs.The gage on <strong>the</strong> Lowe <strong>River</strong> in Keystone Canyon near <strong>Valdez</strong> is locatedon <strong>the</strong> left bank, 500 feet south of <strong>the</strong> south entrance to RichardsonHighvJay tunnel in Keystone Canyon. The records that are available areOctober 1974 to <strong>the</strong> current year. The average annual runoff is about1,200 cfs. The o<strong>the</strong>r Lowe <strong>River</strong> gage (Lm"e <strong>River</strong> near <strong>Valdez</strong>) wasupstream from this one about 4 miles. The gage was discontinued inSeptember 1974.The Klutina <strong>River</strong> gage was near <strong>the</strong> left bank on <strong>the</strong> downstream sideof <strong>the</strong> RiChardson Highway bridge, 0.7 mile south of <strong>Copper</strong> Center.Records are available from October 1949 to June 1967 <strong>and</strong> July 1970 toSeptember 1970. The mean streamflow is 1,670 cfs.The Tonsina <strong>River</strong> gage is near <strong>the</strong> right bank on <strong>the</strong> downstream sideof <strong>the</strong> RiChardson Highway bridge at Tonsina. Recorded streamflows extendfrom October 1950 to September 1954 <strong>and</strong> from October 1955 to September1978. The mean annua 1 flow is 836 cfs.txtension of Streamflow Records:Extension of t'le streamflow records <strong>for</strong> Solomon Gulch <strong>and</strong> Lowe <strong>River</strong>was per<strong>for</strong>med by linear correlation with <strong>the</strong> long term records of <strong>Power</strong>(reek near Cordova. In an attempt to observe visual relations between<strong>the</strong> stations, <strong>the</strong> respective monthly strEamflows <strong>for</strong> <strong>the</strong> two stationswere plotted against <strong>the</strong> correlative <strong>Power</strong> Creek monthly streamflows, asshown in Table A-4. Depending on <strong>the</strong> shapes of <strong>the</strong> relationshipsohserved, <strong>the</strong> data were split into time groups ranging from 1 month to 3months. After trans<strong>for</strong>mation, a linear regression analysis was per<strong>for</strong>med<strong>for</strong> each data group <strong>and</strong>, based on <strong>the</strong> correlation coefficients <strong>and</strong>st<strong>and</strong>ard errors of estimate, a relationship <strong>for</strong> each group of data wasadopted <strong>for</strong> streamflow extension.In general, <strong>the</strong>re was good correlation <strong>for</strong> <strong>the</strong> months of Aprilthrough December. The winter months of January, February, <strong>and</strong> March weregrouped toge<strong>the</strong>r <strong>and</strong> still had a low correlation coefficient. It may beexplained by <strong>the</strong> lowflow characteristics of <strong>Power</strong> Creek which did notdl"scribe <strong>the</strong> same 1m" flow on <strong>the</strong> o<strong>the</strong>r two gages. The equation on <strong>the</strong>Lowe <strong>River</strong> <strong>for</strong> August was adjusted since it was not consistent with <strong>the</strong>LA-6
slope of <strong>the</strong> two adjacent months of July <strong>and</strong> September, <strong>the</strong>re<strong>for</strong>e, nocorrelation coefficient was derived. The relationships derived <strong>for</strong> <strong>the</strong>two stations are shown in Table A-4.The monthly streamflows <strong>for</strong> Allison Creek were not correlated with<strong>Power</strong> Creek sinc~ <strong>the</strong>re were no records available <strong>for</strong> Allison. SolomonGulch's drainage area of 19.5 square miles better approximates <strong>the</strong> sizeof Allison's, so its extended streamflow values were used to derive'StreamflO\'I values <strong>for</strong> Allison Creel( ra<strong>the</strong>r than <strong>the</strong> Lowe <strong>River</strong>streamflows with a drainage area of 222 square miles. Allison <strong>and</strong>Solomon are also iYl very close proximity to each o<strong>the</strong>r so <strong>the</strong>y shouldhave similar hydrologic characteristics. The following table lists <strong>the</strong>oertinent characteristic'S of each basin.Area Mean Elevation % AreaCreek (M i 2) (Feet) in Gl aciersAllison 5. F)8 2,800 24<strong>Power</strong> 20.8 2, 140 25Solomon Gu 1 ch 19.5 2,300 21The monthly streamflow values <strong>for</strong> <strong>Power</strong> Creek were used to extend <strong>the</strong>period of record <strong>for</strong> Solomon Gulch; this extended period of record isshown in Table A-5. These values in turn were used along with a basinarea relationship to determine streamflows <strong>for</strong> those basins withoutdata. Allison Creek estimated streamflows were derived in this manner<strong>and</strong> are shown in Table A-6.The four damsites considered as alternatives to <strong>the</strong> Allison Creekdevelopment had streamgages in fairly close proximity to two of <strong>the</strong>m.The Klutina <strong>River</strong> <strong>and</strong> <strong>the</strong> Tonsina <strong>River</strong> are both gaged, but at locationsdownstream from <strong>the</strong> proposed damsites. For <strong>the</strong> Tonsina <strong>River</strong>, <strong>the</strong>average annual precipitation was estimated <strong>for</strong> <strong>the</strong> area above <strong>the</strong> dam <strong>and</strong><strong>for</strong> <strong>the</strong> area above <strong>the</strong> gage by use of isohyetal maps presented in a 1977U.S. Forest Service Water Resources Atlas. The ratio of <strong>the</strong> two areawideaverage precipitation values was <strong>the</strong>n determined, <strong>and</strong> <strong>the</strong> ratio of<strong>the</strong> project-drained area to <strong>the</strong> gaged area was also determined, <strong>the</strong>n<strong>the</strong>se two were applied to <strong>the</strong> gaged streamflows to give <strong>the</strong> expectedflows at <strong>the</strong> sites.At <strong>the</strong> Klutina <strong>River</strong> site, no isonyets were available <strong>for</strong> most of <strong>the</strong>drainage area, so streamflows were modified only on <strong>the</strong> basis of areadrained considering <strong>the</strong> Tsina <strong>River</strong> <strong>and</strong> Tiekel <strong>River</strong> sites, no streamflowrecords exist <strong>for</strong> <strong>the</strong>se rivers. Solomon Gulch was selected as mostclosely representing <strong>the</strong> Tsina <strong>River</strong>, since it was <strong>the</strong> only fairlyheavily glaciated stream with flow records in <strong>the</strong> vicinity. Averageannual precipitation <strong>and</strong> drainage area comparisons were again made inorder to adjust <strong>the</strong> Solomon flows <strong>for</strong> <strong>the</strong> Tsina. Only <strong>the</strong> 7 years ofrecorded data from Solomon were used.Because of <strong>the</strong> approximately similar glaciated percentages, overalldrainage areas, <strong>and</strong> <strong>the</strong> proximity of <strong>the</strong> watersheds, Tiekel <strong>River</strong> flowsA-7
were estimated based on Tonsina <strong>River</strong> flows. As with <strong>the</strong> Tonsina site,precipitation <strong>and</strong> area rati()s were used to generate <strong>the</strong> Tiekel flows from<strong>the</strong> Tonsina's.The pertinent characteristics <strong>for</strong> each site are shown below:GageCreek Gage Used% Average AverageArea in Annual Gage AnnualArea Glaciers Precip. Area Precip.(mi2) ( in) (rli2) ( in)Overa 11RatioKlutina Klutina 826 5 -1 0 880Tiekel Tonsina 367 15 53. 1 420 28.0Tonsina Tonsina 263 10 32.9 420 28.0Ts ina Solomon 5'1 50 70.4 19 1 140.941.660.741. 79Estimated Damsite Streamflows:It has been assumed that <strong>the</strong> streamflows determined through <strong>the</strong>previous analysis would be <strong>the</strong> estimated damsite streamflows.~v aporat ion:The normal high relative humidity, high percentage of overcast days,<strong>and</strong> cool climate preclude any appreciable loss from evaporation.Estimates of flow were based on records of existing or historical gagingstations near <strong>the</strong> project areas, <strong>and</strong> include evaporation from <strong>the</strong> streamsurface. Due to <strong>the</strong> nortllern latitude <strong>and</strong> prevailing maritime climate,additional evaporation from <strong>the</strong> reservoir surface would beinsignificant.Flood Characteristics:Snowmelt-type floods are dependent upon two conditions: (1) <strong>the</strong>amount of accumulated snow; <strong>and</strong> (?) <strong>the</strong> temperature sequence during <strong>the</strong>spring melt period. A 1 arge snowpack over <strong>the</strong> basin will give a 1 argevolume of runoff during <strong>the</strong> spring. However, if <strong>the</strong> temperaturesincrease gradually, causing slower snowmelt, <strong>the</strong> flood peak will be justslightly above normal. If <strong>the</strong> early spring is colder than normal <strong>and</strong><strong>the</strong>n tile temperatures rise rapidly <strong>for</strong> a prolonged period, <strong>the</strong> flood peakwill be extremely high with <strong>the</strong> duration of flooding dependent upon <strong>the</strong>total snowpack.On <strong>the</strong> streams in <strong>the</strong> sou<strong>the</strong>rn portion of <strong>the</strong> study area, rainfloodsproduce <strong>the</strong> highest flm ... s. These occur in <strong>the</strong> fall, generally betweenlate August <strong>and</strong> October. The flood peaks are quite sharp due to <strong>the</strong> fastrunoff, which is caused by <strong>the</strong> steepness of <strong>the</strong> terrain <strong>and</strong> <strong>the</strong> lowinfiltration losses into <strong>the</strong> underlying rock. On <strong>the</strong> Klutina <strong>and</strong> Tonsina<strong>River</strong>s, <strong>the</strong> flooding characteristics are mixed. The annual peak flows onA-8
<strong>the</strong> Klutina generally occur at any time throughout <strong>the</strong> summer, as aresult of rainstorms. However, <strong>the</strong> maximum recorded flow <strong>the</strong>re was inJune, during a snowmelt runoff. The Tonsina's highest flows yearly rangefrom early June to mid-September, being caused ei<strong>the</strong>r by snowmelt orrainfall flooding.Past Floods:The maximum instantaneous recorded discharge <strong>for</strong> <strong>the</strong> five recordingstations utilized in <strong>the</strong> study are:Lowe <strong>River</strong>Klutina <strong>River</strong>Tonsina <strong>River</strong>Pov.Jer CreekSo 1 omon Gu lchFlood Frequencies:Date9/11/75fJ/29/536/17/629/25/499/04/51Pe ak (cfs)12,6009,0408,4905,5402,420The following is a tabulation of <strong>the</strong> peak discharges <strong>for</strong> <strong>the</strong>various recurrence intervals:Peak Discharges - cfsRecurrence Lowe <strong>Power</strong> So lomonInterval <strong>River</strong> Creek Gulch(years)5 11,900 3,750 2,20010 14,900 4,650 2,60025 18,800 5,750 3,20050 23,000 6,900 3,750100 27,500 8,000 4,300Probable Maximum Flood:The Probable Maximum Flood (PMF) is used <strong>for</strong> spillway sizing <strong>and</strong> <strong>for</strong>estimating downstream impact. Since Allison Creek has a lake tap <strong>and</strong> noassociated dam, no spillv.Jay shall be required. Thus, <strong>the</strong> PMF derivationis also not necessary. Also, since <strong>the</strong> o<strong>the</strong>r proposals investigated havenot been judged worthy of fur<strong>the</strong>r consideration at this time, no PMF wasderived of <strong>the</strong>se sites.A-9
'fUR r)c r ,-. n:c JA~ FEEl "'A~ APi1 '~A Y J \.J '; JUL A.J';____ we.-- - , ~"''' ~E---.--- .------ -----.--.----- -----.- ------- ----.-- ------- ------- ------- --.---- .------ ._._---1 'H 2. -I: •• ~!.L • 72. bl4. ':11. ':18. b7. 380. 1 103. b2t>2. -IOw5. S; -. : "3 ~.1 '173. ')~~. 1 ~ ~. 88. 57. 45. 35. 52. ijbl. 1789. 320b. "023.; "':;7.l'n,. • 22: • 1 G 1 • 71 • ':17. 1.18. 33. 145. b74. 2197 • 14137. 3771. - :228.--LOWERIVER NEAR VALDEZ STREAMFLOW - CFSLOWERIVER IN KEYSTONE CANYON NEAR VALDEZ STREAMFLOW - CFS)::0 'fC:~"____ we.Iuc T---.-.-.,.j f-------,.-- ....-------JAN--.----FE3---.---~A"-------A;J-------, - - .' ~ -•• :,-ooI.J~-_.----01 9 7:; • ..j::>:>. 22!J. 101 • bb. 50 • 45. 49. 71)0. 253-1. ':1191.1. 251:'5. 2 = : = . : = 15.l'n" . b3). '2. b4. b3. ':l6. 52. bOo (l51. 287u. 4179. 307-1. 1 3: : • : :" 7.SOLOMON GULCH NEAR VALDEZ STREN~FLOW- CFS- -- -_. -- -- - --- - -~~~01 c;:r ", j" )E: JAN FE3 ~AR AP~ ~'AY JU~ JUL A ... .; ~:. - ~ . ~~AGE------- ------- .. ------ -.----- ------- ------- ------- ------- ------- ------- ------- ------- ---- .... - ....---1950. : ! • !l4. 3b. 16. 12. 9. 7. 99. 3b8. 277. 25". =::. 125.1951. .. e • 22. 10 • 1 • 4. 7. 10. 54. 2bl. 346. 25'-. .. 133 •1952. 75. 74. 21 • 14. 11 • 10. 9. 45. 3b6. 419. 2~2. .' .. - 130.1 'h3. 3 )... 131. 30. 18. 12. 11 • 10. 2214. " 5~ij. 408. 3 ... 0. :: -. 1-12.--t 1954. l w 3. 3~. 17. 11. 12. 8. 11. lb4. 357. 277. 35b. -. 13b.~\,j 1955. 133 • 74. 12. 12. 11. 10. 8. 37. 320. 514. 3b1- ::. 135...., r- 1950. S::. 27. 17. 21. 12. 8. 14 • 90. 371. 507. "'-'2. ::;. 1"8.-l>I
KLUTINARI VER NEAR COPPER CENTER STREAMFLOW~CFSJ::>IYEAR-------1950.1951.19')2.1953.1954.1955.195b.1957.1958.1959.19bO.19b I.1902.19b3.19b4.19b5.19bb.OCT ·';Jv J~C J (.',------- ------- ------- -----.-1b59. 717 • 370. 22j.941. 350. 289. .: 5 (.•1498. b07. 270. 1 c C •177 b. 911 • 710. SOC'.893. lj15. 2bO. 2 C' C'.893. 557. 295. 270.725. 227. 195. 1 be.1045. '113- 382. 251.2089. 1079. 1.191. 30 4 •827. 523. 215. 100.1192. bUS. 454. 30.J.1509. ')35. 358. 323.1353. 550. 330. 25()._. -'1222.904. -lo4. 350. 330.__ 413. ___ 370. 300 •.Q17. 455. 370. 300.1313. .,j80. 310 • 21 J •~::3 I.L."'{ .:,:)~t·A Y JU;~ JUL AUG S~;> AvERAGE---.--- ------- ----.-- ------- -.----- ------- ------- ------. -------135. 135. 1 t> 7. 1370. 35ll2. ll810. 4703. 2ljOo. 1b50.230. 24C:. 2:10. 051. 2393. 5573 • 40b8. 5,)62. 1735.1bO. 1 5 f: • 1 !J () • -l9b. 2358. 490b. 4b23. 1920. 11.1 lj 3.~OO. 2 b O. 250. 1017. 5bBb. 7071 • 5529. 2591, 2225.1 bO. 13' .• 127. 1 105. B05. 41 '17 • 57bb. 2732. lb08.220. 1 q S • 110 • 2b5. 2000. 5395. 3885. 23(jo. 13b9.150. 1t r;. 2(;0. 957. 3192. 5'120. 5132. 2200. 15b4.175. ,255. 2bO. 1251. 5941. 51b8. 451.13. 52~5. 2079.2b 1. 23:;. 223. 879. 49'::10. SOUl. 4502. 1892. 1833 •105. 10'i • 140. 1032. 5117. 5411. 4122. 1 7 ~.,. lb3b.240. 2,)5. 240. 1552. 3757. llbt>7. u729. 3b76. 1808.271 • 225. 215. 1051 • 3153. 4BO. '1680. 2859. lbl.l7.230. 220. 2';)0. bb4. 42b2. 5b53. 4b75. 2 .. 57. 1744.320. 30S. 210. 949. 2302. 5b95. 5140. 2927. lb04.320. 230. 220. 354. , , _ 47 b 1 .. 507b. 4402. 2341. lb72.270. 230. 200. 527. 2080. 4309. 3489. 2771.1. 1327.1 70 • 190. 2 u o. '::112. 3792. 4791. 3805. 2220. 1503.)::0IN
--..,I-J--. -,-- - ----- - --TONS INA RIVER AT TONSINA STREAMFLOWr::AR OCT r-.:. J~: J;' '1 :~S J:'~ ;.;,;; r·iAYwe... _---.- ------- --.---- -------------- ------- ----- -- -------____1958. 1057 L .--- ---= .... - ·.-1'150. 305. : ! : • · ..... 10: • 100. I 1 (j • : .. ~. U18.1957. 253. : ::. C~:. 9~. 01. I 0 iJ • ~ 3 J. 985.."1...,.- 175. 115. 105. ~ i • 500.1959. 30b. 2: : • 1 : :: • 81. 73. 73. :: ... 5c.7.1900. 558. 2 -:- :. ! :: : • 12 C • '10 • B5. :: I • 1395.1901. U80. c: : : • 1:;:. 175. 121 • 91. ~ 0 • 794..1962. U92. c: .. w'. 12: • &
POWER CREEK NEAR CORDOVA - CFSYEAR JC T :-mV )EC J I\r, FEd 'iAR I\pq MAY JUN JUL AJ:; S::? AvE~AGE------- ------- ------- ------- ----,.... - ---.--. ------- ------- ------. -.----- ----.-.1948. 252.-------327.-------103. 87.-------53. 28. 24. 218. 566. 6bl. .. 53. 478 • 274.19~'1. 3~'5. 1'19. 59. 49. 30. 43. 3:'. 142. 376. 454. "~5. 74~.1950. ... '3 7 • 319.246.73. 36. 22 • 25. 2':1. 141 • 571. ~ J1951.0 •123...24.'53.:.32. 203.37. 25. 29. 33. 34. 120. 35:'.1952.539. 397.250.102 ...232.23l.50. 35. 25. 20. 20. 94.1"153.427. 897.594... 55.2b7.358. 244 •65. 50. 33. 32. 50. 259.195:l.595.3 .. 3.542. 1020.103.45l. 2'18.59. 50. 47. 27. 30. 189. 412. ... 51-1955.10 12.307.4:.1 •290.232.52. 00. 43. 29. 24. 102.1956.372. 671.151 •603.bO.294. 244.38. 35. 23. 10. 22.1957.177 • 356.134.612.2H.710. 425.100.219.49. 23. 23. 24. 180. 422. 457. o.J5~.1'158. 973.3. 204.128. 92.(- )156. 98. 104. 240.1964.382.255.593. ...32.05.326. 249.11.10. 63. 69. 47. 44. 100. 1.196. 610. o.J90.1965.291.253.222.196. 11 1 • 43. 39. 47. 96. 187. 428.1966.433. J3o.320.556. 236.BO. 54. 33. 23. 22. 39. 146. 382. 431 •1967.56!> •.3ob.713. 235.178. 48. 36. 49. 59. 89. 181. 455. 497. 49~ •19bB. 174.736. 265.2bO. 102. 58. 175. 134. 53. 274. 401.1969. 184."52. 33 7. 311 •109.228.59. 27. .36. 93. 94. - 228. - 458. 399.197 O.252.o.J4B.218. 180.204. 190. 1 0 1 • 143. 1 14. 104. 173. 428.1971.527. 6.10.259. 162.3b 7. 287.74. 56. 45. 27. 47. 116. 466. 681 •1972. 559.287. 81-318. 234.39. 25. 19. 15. 16. 1 0 1 • 328. :;b5.1973 •505.3.JO.5 ... 2.90.210.61. H. 30. 21. 37. 189. 351. 449.197:J.i.&78.155.234. 193.56. 48. 36. 28. 19. 48. 180. 354.1975. 460.--352. 340.2511.531. 1 79.811. 56. 43. 26. 40. 179 • 382.1976.632. 388.267. 49.b04. 262.41. 30. 36. 21. 90. 46il. 803. 546.1977 •..69. b96.4"2. 548.292.195. 187. 257. 54. 85. 183. 454.1978.571. 522.330.51.10.B 1 •336.35. 80. 75. 47. 50. 21B. 405. 435. 41 ... 339. 209.
ALLISON CREEKESTIMATED STREAMFLOW - CFSYEAR OCT i'OV DEC JAN FEB ~ARwe.APR MAY JUN JUL AUG SE? !.::~AGE._------------____----.-. .. ---~.- ._----- ------- ------. ---- ... - ------- ... ----- .... _-- ---- ... - -- ..... _-191.18. 36. 35. 14. 7. 5. 3. 3. 59. 152. 11&. 9i. S3. 50.19149. 52. 23. 7. 5. 3~ 1.1. ... 30. 111 • 103. 89. 13..1 • 14 7.1950. 29. 28. 12. 5. ". 3. 2. 3u. 121.1. 91.1. 81:>. S!). ~2.1951. I!). 7. 3. o. 1 • 2. 3. Pi. 88. 117. 60. 1."1 ... 45.1952. 25. 2S. 7. 5. 1.1 • 3. 3. 15. 1211. 255. q9. 7 .... 53.1953. 1 u 3. 44. 10. 0, U. 14, O. 7&. 104. 138. 117. ~~. bS.1954. '10. 12. &. ". u. 3. u. 55. 121. 91.1. 120. 53. '10.1955. 1.17. 25. LI.". LI. 3. 3. 12. 108. 1711. 122. .3. II 1:>.195b. 19. 9. O. 7. 1I. 3. 5. 31. 125. 171. lU9. 72. 50.1'157. 17. -27. 13. 5. 3. 3. 3. lI'1. 121. 1011. q~. 17:.. 51.1958. 5~ • 35. 9. B. ". 1I. 7. 89, 159. 261.1. 151.1. -1. e 7....1959, 5.3. 11.1. 11. 5. u. 3. U. bb.1900. U· 110. 150. 70,19....2.10. 7. S. "0.3. 4 • 79. 130. 101. loa. 51. S ....19b1. 29. 13. 21. 9, 5. 4. b. 93. 120. 121. 118. =- ... 52.");:a 19&2. H. 15. 8,. 7. u. 1.1. 5, u 1 • 110. 109. 7u. ~l. ~o.I 19b3. H. 22. 17. ? 10. 7. 11 • 07. 112. 151. 0'1. 5 ... 46.--'19bU. .3:.1. 10. 19. 6. 6. Ii • S. 13. 131 • 157. 100. .. 7. us..0:::-1905. 35. 22. IS. 5. 'I. 1I. 10. 47. 122. Qb. 9v. =17. ..~.19b&. ij,;.,. 11 • 7. lI, 3. 3. 5. 31. 112. 95. 11 U. 127. 116.19&7. u9. " 20. b. iI. 1I. 5. 9. 41.1. 128. 1111. 101. 131. 51.19b8. 23. 28. 11.1. 5. 11. 9. O. 80. 110. 101. 71. 51. 113.19('9; ---~2iJ.----I(j.- --7~-- -1.1;-- "i4 ~ 1. 10. 62; -129; - 8~. 55. H. 3:'.1970. bl. 23. lb. 8. 10. B. 11. 111. 122. 128. 128. 01. 52.1971. 35. 19. 9. S. Q. 3. S. 20. 130. IB1. 113. 52. ;'8.1972. 39. 11. 'I. 1I. 3. 2. 2. 111. 100. 1111. 103. 95. ..3.1973. . II O. 12. 8. II. 3. 3. q. 1I8. 105. 102. 98. H. 3'1.1911.1. 20. 9. b. U. 1. 3. 5. 4b. lOb. bB. 7t • 'n. 51>.1975. o3~ 28 .• 11. 5. " Q. 3. 5. lIQ. 112. 1011. SO. lJb. 52.1910. 30. B. S. 4. 1I. 3. 9. 1511. 2140. 135. 90. 122. boo1977 • b::l. 55. 27. 12. lb. 4. 9. us. lZ8. 11.13. lOb. 9~. 5il.
i[i ~,!:,-~Hi----~~+-~-~!.!/~r--~se~c-on~d~a-ry~E-n~er-g-y+-~-_~I1360, I : I I ,--: ! iii, Izo.......I- ex:>w....JWW~1320 L __ _1280 _ _ "- -: i _". -- __.1 : -~ -- _ _ i I -V r------ - I -:5 1240I I I H;,todc El,:UOO.' 13~7.00 ft., _, iii i I -+-- ___ _"1, I I r! I iI i 'i" I ! 'I 'I I ':1200 ~~--~--------__ --~~__ ~--__ ----__--~-+__ ~I __ ~ __ +--4 __ ~ __ ~ __ ~~--~!'--~--~-r'--~'--~--~------~,300 1-- - .: _____.. _~--------:-_----- ----L------~ ____ ~-- -- . --+250 1-I ! ;! I! I ~ , I! i i ! I iI J I i I: ':,--- i ---r----r-t- ----+-,-----~-T---'---:::"-T----i--;--- -- --i I 'I' i ! i !I : ! ' I i- --- c._ --- 1_ -t,- i -- - -- -- --r-----'-----T----+----+'-,I i I II: I ~ jIi-1----- - - -- -4- '"U200IIw~ex::r:uV1.......Cl50>
APPENDIX BEXISTING SYSTEM ANDFUTURE NEEDS
APPENDIX 13EXISTING SYSTEM AND FUTURE NEEDSTABLE OF CONTENTSItemINTRODUCTIONVALDEZ SYSTEMGLENNALLEN SYSTEMFUTURE NEEDSEXCERPT FROM POWER REQUIREMENTS STUDY,COPPER VALLEY ELECTRIC ASSOCIATION, MARCH 1979PageB-1B-1B-2B-8B-19NumberB-1B-2B-3B-4B-5B-613-7B-8B-9B-lOTit 1eLIST OF FIGURESPrice Increases to CVEACVEA Utility Rates 1970~1979Peak Energy Requirements, CVEA 1964-1979Energy Dem<strong>and</strong> Projections: <strong>Valdez</strong>-<strong>Copper</strong> ValleyPeak <strong>Power</strong> Dem<strong>and</strong> Week, Oecember 1990Average <strong>Power</strong> Dem<strong>and</strong> Week, April 1990Minimum <strong>Power</strong> Dem<strong>and</strong> Week, July 1990Peak <strong>Power</strong> Dem<strong>and</strong> Week, December 1995Average <strong>Power</strong> Dem<strong>and</strong> Week, April 1995Minimum <strong>Power</strong> Dem<strong>and</strong> Week, July 1995B-3B-4B-7B-12B-13B-14B-15B-16B-17B-18
IIHf{ODUCTIONThis section is devoted to a detailed description of <strong>the</strong> region's presentutility system. Topics will include <strong>the</strong> community's current stock ofdiesel-fired units, <strong>the</strong> cost of fuel <strong>and</strong> electricity generation, industrialversus residential use, <strong>and</strong> <strong>the</strong> historical dem<strong>and</strong> <strong>for</strong> power. Also included isa brief examination of ongoing <strong>and</strong> probable additions to <strong>the</strong> system. Finally,<strong>the</strong> recent projections of future power dem<strong>and</strong> are reviewed. The selected<strong>for</strong>ecast is <strong>the</strong> basis <strong>for</strong> benefit derivation as shown in Appendix C - EconomicEvaluation.VALDEZ SYSTEM, The <strong>Valdez</strong> system came into existence following <strong>the</strong> March 27, 1964earthquake which demolished <strong>the</strong> town. Studies following <strong>the</strong> quake determinedthat <strong>the</strong> townsite should be ab<strong>and</strong>oned. A new <strong>Valdez</strong> was built at a locationapproximately 5 miles west of <strong>the</strong> original townsite.The <strong>Valdez</strong> Light, <strong>Power</strong> <strong>and</strong> Telephone Company served <strong>the</strong> <strong>Valdez</strong> area priorto <strong>the</strong> earthquake. The generating <strong>and</strong> distribution facilities of this companywere purchased by <strong>the</strong> Urban Renewal Agency which, in turn, sold <strong>the</strong> facilitiesto <strong>Copper</strong> Valley Electric Association. The old facilities were obsolete, inpoor condition <strong>and</strong> were used only until new facilities were operable.The <strong>Copper</strong> Valley Electric Association obtained a Certificate ofConvenience from <strong>the</strong> State of Alaska <strong>and</strong> a franchise from <strong>the</strong> new city of<strong>Valdez</strong> to own <strong>and</strong> operate <strong>the</strong> electric system serving <strong>the</strong> new <strong>Valdez</strong>. TheCertificate of Convenience covers <strong>the</strong> general area <strong>and</strong> is not confined to <strong>the</strong>limits of <strong>the</strong> new townsite.The <strong>Valdez</strong> system presently serves approximately 1,153 consumers over about21 miles of distribution lines. The system serves <strong>the</strong> new city of <strong>Valdez</strong>, <strong>the</strong>old <strong>Valdez</strong> area <strong>and</strong> consumers from old <strong>Valdez</strong> to <strong>the</strong> airport area <strong>and</strong> 10 mileseast of old <strong>Valdez</strong> along t~e Richardson Highway.The existing powerplant contains <strong>the</strong> following diesel <strong>and</strong> gas turbine units:3 - 600 kW, 720 rpm, Fairbanks Morse (1967) 1,800 kW1 - 1,928 kW, 400 rpm, Enterprise (1972) 1,928 kW1 - 965 kW, 360 rpm, Enterprise (1975) 965 kW1 - 2,620 kW, 450 rpm, Enterprise (1975) 2,620 kW1 - 2,800 kW, gas turbine (1976) 2,800 kWTotal Installed Capacity10,113 kWB-1
GLENNALLEN SYSTEMThe Glennallen system serves approximately 890 consumers over about 250miles of distribution lines. The present system extends from about 70 mileswest of Glennallen along <strong>the</strong> Glenn Highway to about 39 miles north <strong>and</strong> 55miles south of Glennallen along <strong>the</strong> Richardson Highway. The existing powerplantcontains <strong>the</strong> following diesel electric units:2 - 320 kW, 720 rpm Fairbanks Morse ( 1959) 640 kW1 - 560 kW, 720 rpm Fairbanks Morse ( 1963) 560 kW2 - 600 kW, 720 rpm Fairbanks Morse (1966) 1,200 kW2 - 2,624 kW, 450 rpm Enterprise (1975-76) 5,248 kWTotal Installed Capac ity7,648 kWThe load factors of <strong>the</strong>se two separate systems average 53.3 percent <strong>and</strong>54.7 percent over <strong>the</strong> years 1970-1977 <strong>for</strong> Glennallen <strong>and</strong> <strong>Valdez</strong>, respectively.The utility1s nearly absolute dependence on diesel fuel results in a closecorrelation between <strong>the</strong> cost per kWh sold <strong>and</strong> <strong>the</strong> price of diesel. Thisinterrelationship is demonstrated in Table 1 which depicts both rates <strong>for</strong> <strong>the</strong>1970 1 s.Table 1Year Year end cost of fuel (per ga 1. ) Total Cost per kWh sold (busbar)1974 .302 .03681975 .361 .04781976 .366 .06291977 .410 .06871978 .415 .07361979 .714 .09951980 (April) .814Due to <strong>the</strong> continuing escalation of fuel costs, high maintenance <strong>and</strong>operations costs, <strong>and</strong> <strong>the</strong> relatively short operational life of diesel driventurbines, <strong>the</strong> community strongly desires to lessen its dependence on thisenergy source.To that end, <strong>the</strong> Solomon Gulch Hydroelectric Project is expected to add12,000 kW of capacity to <strong>the</strong> system by <strong>1981</strong>. That addition is expected tohold <strong>the</strong> $/kWh cost of <strong>the</strong> total system to $.08677 in 1982 <strong>and</strong> below $.0900throughout <strong>the</strong> 1980 1 s. <strong>Copper</strong> Valley Electric Association also has prospects<strong>for</strong> <strong>the</strong> construction of an oil pipeline pressure reducing turbine, asdescribed in <strong>the</strong> section concerning alternatives. In <strong>the</strong> future, <strong>the</strong>Association intends to dispose of its small diesel generating units <strong>and</strong> retain<strong>the</strong> larger diesel units <strong>for</strong> emergency st<strong>and</strong>by. There are however, no nearterm plans <strong>for</strong> acquiring additional gas or diesel turbines.The following tabulation gives <strong>the</strong> installed generation capacity, peakdem<strong>and</strong>, <strong>and</strong> energy load <strong>for</strong> <strong>the</strong> <strong>Valdez</strong> district <strong>for</strong> <strong>the</strong> years 1973-1979.8-2
FIGURE: B-1PRICE INCREASES OF DIESEL FUEL TO CVEA **' WEIGHTED AVERAGE ACCORDING TO USE IN EACH SERVICE AREA1.00.90 --.80 _ ena::
120110FIGURE: B- 2CVEA UTILITY RATES 1970-198010090::r::~~......(J)..J::!::I80-0::coI «~ m(J)70 -:::::>m(J)t-600u>-~50 z '"'"3O~--~--p---~~--~--~--~--~--~--~~--~--~--~--~--~--~~~~--~.1970 1971 1972 73 1974 1975 1976 1977 1978 1979 1980
Installed Generat.or Peak Energy <strong>for</strong> LoadYear Capacity (kW) Dem<strong>and</strong> (kW) (kWh)1973 3,719 1,280 6,469,8301974 3,719 2,470 9,457,3801975 7,304 4,750 18,250,7051976 10,113 4,875 26,006, 1601977 10,113 4,700 23,323, 1831978 10,113 4,750 21,100,5421979 10,113 4,225 21,415,721For <strong>the</strong> Glennallen district, <strong>the</strong> historic trends of installed capacity,peak dem<strong>and</strong>, <strong>and</strong> energy <strong>for</strong> load are as follows:Instalied Generator Peak Energy <strong>for</strong> LoadYear Capacity (kW) Dem<strong>and</strong> (kW) (kWh)1973 2,394 1,220 6,120,9401974 2,394 1,340 6,166,7601975 2,394 2,360 8,635,8101976 7,642 3,500 13,280,5301977 7,642 4,290 19,049,9121978 7,642 4,000 17,232,1021979 7,642 3,470 16,017,863The per customer residential use of both service regions increased from3,846 to 6,423 over <strong>the</strong> years 1970 to 1977. Per customer residential use was5,735 in 1979. Industrial consumption has grown rapidly in recent years,accounting <strong>for</strong> about 75 percent of total dem<strong>and</strong> during <strong>the</strong> 19701s. Thecurrent commercial-industrial share of CVEAls generation is 74 percent(1979). The Alyeska Marine Terminal became electrically self-sufficient in1977. The impending ALPETCO plant will likewise generate its own powerutilizing waste steam. .The specific current power requirements of <strong>the</strong> community have beenclassified by CVEA as rural residential, small commercial, large commercial,<strong>and</strong> public buildings <strong>and</strong> street lights. An examination of each categorybecame <strong>the</strong> basis <strong>for</strong> a <strong>for</strong>ecast by CVEA which was in turn adopted by APA <strong>and</strong>ultimately by this study (with some modification). A detailed rationale <strong>for</strong><strong>the</strong> future needs of each of <strong>the</strong>se categories is offered in <strong>the</strong> back of <strong>the</strong>appendix.B-5
The steady but uneven growth in CVEAls net utility generation is presentedin Table 2 <strong>and</strong> Figure 8-3.Table 2UTILITY NET GENERATION (GWH) 1/GLENNALLEN-VALDEZ AREAUpper Susitna Project <strong>Power</strong> Market Analysis (APA)Year CVEA Growth %1960 3.21961 3.4 6. 11962 4.0 17. 11963 4.5 12.21964 4.2 -6.51965 6.5 55.81966 8.0 22.41967 8.2 3.71968 8.6 5.91969 9.7 17 .81970 10.7 11.31971 11. 7 8.51972 11. 8 0.81973 12.6 6.21974 16.6 29.21975 26.9 58.21976 39.3 44.31977 47.4 20. 11978 43.8 -8.01979 41.6 -5.01/ Net generation does not include line losses <strong>and</strong> <strong>the</strong>re<strong>for</strong>e exceeds totalconsumption.8-6
90008000700060005000- 4000 ~..-:3000-a::LLI2000~0a..FIGURE: B-3PEAK ENERGY REQUIREMENTS, CVEA,1964-1979CONTINUOUSDEMAND1000SYSTEM ANNUAL LOAD FACTORANNUAL LOADFACTOR %1.00.8_-_-Y'" 0.60.4o 6~ 65 66 67 68 69 70 71 72 73 74 75 76 77 78 79TIME . (YEARS)
FUTURE NEEDSThere have been three recent projections concerning electricity dem<strong>and</strong> in<strong>the</strong> <strong>Valdez</strong>-Glennallen service area. The earliest was produced by <strong>the</strong> Alaska<strong>Power</strong> Administration <strong>and</strong> subsequently appeared in a March 1979 report entitledUpper Susitna <strong>River</strong> Project <strong>Power</strong> Market Analysis. This report considers <strong>the</strong><strong>Copper</strong> Valley utility district <strong>for</strong> intertie with <strong>the</strong> proposed Susitnahydrelectric project. The <strong>for</strong>ecast provided by APA was made during a periodof unprecedented growth in <strong>the</strong> study area. Consequently it is <strong>the</strong> highest of<strong>the</strong> three load <strong>for</strong>ecasts, as will be illustrated. The second projection(chronologically) appears in <strong>the</strong> <strong>Power</strong> Cost Study 1979-1993 prepared <strong>for</strong> CVEAby Robert W. Re<strong>the</strong>r<strong>for</strong>d Associates, also in March of 1979. Contrary to <strong>the</strong>APA <strong>for</strong>ecast, this projection was <strong>for</strong>med during <strong>the</strong> post-pipeline wind-down<strong>and</strong> reflects <strong>the</strong> reduced expectations of that period. Like <strong>the</strong> APA analysis,it does not take into account <strong>the</strong> recently initiated ALPETCO refinery. Thethird <strong>and</strong> most recent load <strong>for</strong>ecast was also conducted by APA, <strong>and</strong> appears in<strong>the</strong>ir marketability analysis provided <strong>for</strong> this report. The relative positionof APA's 1980 projection can be seen in <strong>the</strong> following comparative tables:Table 3VALDEZ-GLENNALLEN AREA UTILITY FORECASTSUpper Susitna Project <strong>Power</strong> Market AnalysisEnergy (gwh)Peak Dem<strong>and</strong>(MW)CVEA lLCVEA lLYear Glenna1len <strong>Valdez</strong> Total Glennallen1976 12.5 24.5 37.0 39.3 2/ 3. 11977 21.0 27.0 48.0 47.4 2/ 4.21978 22. 1 27.2 49.3 43.8 2/ 4.41979 24.0 27.6 51.6 41.6 ]j 4.61980 45.9 27.9 73.8 7.3<strong>1981</strong> 48.5 30.5 79.0 7.71982 50.0 33.0 83.0 8. 11983 52.2 35.5 87.7 8.51984 55.0 38.2 93.2 9.01985 57.6 41.4 99.0 9.51986 60.0 45.0 105.0 10. 11987 63. 1 48.5 111. 6 10.61988 66.0 52.5 118.5 11. 11989 69. 1 56.8 125.9 11.71990 72.3 61.4 133.7 12.41991 75.0 66.4 141.4 13.0<strong>Valdez</strong>6.05.95.85.85.86.36.87.48.08.69.310. 110.911.812.813.81995 1802000 2402025 1,0251/ <strong>Copper</strong> Valley Electric Association Forecast from 1976 REA <strong>Power</strong>Requirements Study.2/ Historical valuesB-8
Table 4VALDEZ-GLENNALLEN AREA UTILITY FORECASTSRe<strong>the</strong>r<strong>for</strong>d AssociatesEnergy (,Wh)Peak Dem<strong>and</strong> {MW~Year Glennallen Va dez Total Glennallen Va"dez1980 21.4 26.5 47.9 4.4 5.4<strong>1981</strong> 22.0 28. 1 50. 1 4.7 5.71982 22.5 30.0 52.5 4.9 6. 11983 23. 1 31.9 55.0 5.2 6.51984 24.6 33.7 58.3 5.5 6.91985 26.3 35.5 61.8 5.8 7.31986 28.0 37.6 65.6 6.2 7.71987 29.8 39.8 69.6 6.6 8. 11988 31.8 42.0 73.8 6.9 8.61989 33.9 44.4 78.3 7.3 9. 11990 36. 1 47.0 83. 1 7.8 9.61995 111.22000 148.82025 638.68-9
Table 5VALDEZ-GLENNALLEN AREA UTILITY FORECASTS1980 Marketability AnalysisEnergy (gwh)Glennallen <strong>Valdez</strong>TotalPeak Dem<strong>and</strong> (MW)Glennallen <strong>Valdez</strong>Historical197619771978197913.321.420.418.526.026. 123.423.039.347.543.841.63.54.34.03.54.94.94.84.2Forecast1980<strong>1981</strong>1982198319841985198619871988198919901991199219932000 3/2025 !/21.422.022.526.027.729.531.433.535.738. 140.643.346. 149.270.0293.426.530.0 ~/33.0 '!:../35.0 2/34.0 ~/35.637.639.842.044.446.949.652.455.480.0335.347.952.055.561.061.765. 169. 173.377 .882.587.592.998.6104.6150.0628.74.44.74.95.25.55.86.26.66.97.47.88.28.79.214.056.71/ <strong>Copper</strong> Valley Electric Association Forecast from January 1980 <strong>Power</strong> Cost"S"tudy.~/ Additions <strong>for</strong> ALPETCO facility have been included.3/ APA extrapolation.4/ Corps of Engineers extrapolation based on APA growth rate.5.46. 1 '!:../6.7 ]j7. 1 '!:../7.0 '!:../7.37.78. 18.69. 19.610.210.811.416.067. 18-10
As footnoted, <strong>the</strong> Alaska <strong>Power</strong> Administration adopted future powerdem<strong>and</strong> estimates front CVEA's 1976 power requirements study. The studyincluded estimates of dem<strong>and</strong>s through 1991; APA made a rough extension to<strong>the</strong> year 2000, assuming a 6 percent rate of increase.Also footnoted is <strong>the</strong> actual per<strong>for</strong>mance of <strong>the</strong> utility from <strong>the</strong>beginning year of <strong>the</strong> APA <strong>for</strong>ecast to 1979. This projection was fairlyaccurate <strong>for</strong> 1976 <strong>and</strong> 1977 but diverged considerably in <strong>the</strong> years 1978<strong>and</strong> 1979. These later years represent a lull between <strong>the</strong> wind-down from<strong>the</strong> pipeline activity <strong>and</strong> <strong>the</strong> initiation of <strong>the</strong> ALPETCO refinery. TheRe<strong>the</strong>r<strong>for</strong>d Associates projection is too recent to test against historicaldata, however, a corresponding <strong>for</strong>ecast made by Re<strong>the</strong>r<strong>for</strong>d in 1976 per<strong>for</strong>medinversely to that of APA, with <strong>the</strong> greater inaccuracies appearingin <strong>the</strong> earlier years. Although <strong>the</strong> current Re<strong>the</strong>r<strong>for</strong>d projection willprobably out-per<strong>for</strong>m <strong>the</strong> earlier APA <strong>for</strong>ecast, it is ill-suited <strong>for</strong> <strong>the</strong>expected high activity years of <strong>the</strong> early 1980's. The load <strong>for</strong>ecastwhich is considered to be most accurate <strong>and</strong> was adopted <strong>for</strong> this study isAPA's 1980 estimate. Much too recent to test against historical data,this projection represents <strong>the</strong> best compromise between <strong>the</strong> o<strong>the</strong>r two, <strong>and</strong>incorporates <strong>the</strong> most current in<strong>for</strong>mation available. This extrapolationis essentially a variation of Re<strong>the</strong>r<strong>for</strong>d with <strong>the</strong> earlier year adjustedto account <strong>for</strong> ALPETCO construction <strong>and</strong> subsequent maintenance, <strong>and</strong> alater period of reduced growth rates in <strong>the</strong> face of energy conservation.A graphic comparison of <strong>the</strong> various <strong>for</strong>ecasts is shown on Figure B-4.Annual load factors are expected to remain in <strong>the</strong> 50 percent range.The incentive <strong>for</strong> <strong>the</strong> <strong>Valdez</strong>-<strong>Copper</strong> Valley community to avoid dieselgeneration is better understood in view of <strong>the</strong> fact that <strong>1981</strong> costs <strong>for</strong><strong>the</strong> system are expected to reach 114 mills per kWh. New hydro construction,with its high capital investment, does not appear resoundinglypreferred to diesel at this time. However, developments since 1973,including <strong>the</strong> abrupt price adjustments of 1979, cast considerable doubton <strong>the</strong> st<strong>and</strong>ard analysis based on fixed relative costs.Figures B-S through B-10 on <strong>the</strong> following pages portray how <strong>the</strong>system would look <strong>for</strong> <strong>the</strong> minimum, average, <strong>and</strong> peak weeks in 1990 <strong>and</strong>1995 with <strong>the</strong> addition of <strong>the</strong> PRT <strong>and</strong> Allison hydropower. The loadshapes are based on actual data <strong>for</strong> <strong>the</strong> combined systems of Glennallen<strong>and</strong> <strong>Valdez</strong>.The various shaded areas on <strong>the</strong> graphs represent <strong>the</strong> amount of firmenergy available during <strong>the</strong> respective weeks. It does not represent <strong>the</strong>actual ,mode in which it will operate. For example, Figure B-5 showsAllison hydro operating in a base mode with a continuous output of about4 megawatts. In reality, it may be used primarily <strong>for</strong> peaking.With <strong>the</strong> proper interfacing of <strong>the</strong> PRT with <strong>the</strong> Solomon <strong>and</strong> Allisonhydroelectric projects, it may be possible to increase <strong>the</strong> winter outputfrom <strong>the</strong> hydropower projects. This could be accomplished by increasedutilization of <strong>the</strong> PRT during periods of less dem<strong>and</strong>. However, this wasnot taken into account <strong>for</strong> <strong>the</strong> graphic representations.B-11
FIGURE: 8-4ENERGY DEMAND PROJECTIONS: VALDEZ - COPPER VALLEY200.0REVISED APAPROJECTIONcoI~r'0100.0>(!)a:UJzUJR.W. RETHERFORDPROJECTION.890 I.e2000
201510CDI5.: ...:.T. .' !', ~. '., . ~~ ...: ~.'. ,: ~.' ./"SUNWEDF'1GlR£ ~ PEAK POWER DEMA~ WEEK, GLENNALLEN - \tllEZ,THUSATDEC. t9IO. BASED ON "79 LOAD SHAPES.
flGU. a-. AYllAOI POWel DeMAND Will, GlINMALllN-VAI.8IZ, ANN. 1990. IASlD ON 1979 LOAD SHAHS.--------------------------
SOLOMON HY I.IICU'-__'lOUIE 1-7 MlNtMUM 'oweR DlMANO Will, OlINHAU.1N -VALDII. JULY 1990. lAUD ON LOAD SHAHS fROM 197 •.
2520'JGUII I-a NA« POWIt DEMAND Will, OlfNNAlLIN· VALOIZ, Dlel .... ''". 1ASi0 ON 19'9 LOAD SHl\m.1WID
, .. ,·.AYI.AG! fOWl. DlMANO WHit, GLENNAllEN. YAlDlZ, APlIL 1'"'. "'10 ON 1'" LOAD SMAPlI .•
10MUll 1-10 MINIMUM POW.I DeMAND Wltl, _"""ALLIN. YAlDlZ, JUlY'"', lASED ON LOAD IIWtIS NOM "'9,
The following is an excerpt from <strong>the</strong> <strong>Power</strong> Requirements Study, Alaska18 <strong>Copper</strong> Valley, <strong>Copper</strong> Valley Electric Association, Inc., Glennallen,Alaska, March 1979.Rural ResidentialVALDEZIncluded in this consumer classification are single <strong>and</strong> multi-familydwelling units, <strong>and</strong> approximately six trailer courts. The number ofrural residential consumers in <strong>Valdez</strong> declined substantially during 1977<strong>and</strong> moderately during 1978. A fur<strong>the</strong>r moderate decline may occur in1979. However, this trend is expected to stabilize <strong>and</strong> gradually reverseitself. According to in<strong>for</strong>mation from Mr. Cal Dauel, State Economist,<strong>and</strong> o<strong>the</strong>r available in<strong>for</strong>mation it appears that most individuals whocould be expected to leave <strong>the</strong> <strong>Valdez</strong> area due to completion of <strong>the</strong>pipeline facilities, have in fact left. In estimating future growth ofresidential consumers, it was assumed that <strong>the</strong> average number ofconsumers in 1979 <strong>and</strong> 1980 would remain at approximately <strong>the</strong> 1978 level.After 1980, additional growth would occur due to increased activity inshipping <strong>and</strong> oil transportation. A gradual increase in <strong>the</strong> number ofconsumers is also expected as <strong>the</strong> Fluor Staff Housing Units aretransferred to private ownership - 28 were transferred in 1978 <strong>and</strong> 118a~e projected in 1979-1980. Average usage is also expected to reverseits downward trend as <strong>the</strong> possibility of continued mild winter conditionsappears remote.Small CommercialThe historical data indicates a significant increase in <strong>the</strong> number ofconsumers <strong>and</strong> average monthly usage during <strong>the</strong> period 1973 through 1977.This is attributed to a deficiency of small commercial establishmentsprior to pipeline construction. Since completion of <strong>the</strong> pipeline <strong>and</strong>related terminal facilities, this class of consumer has not shown asignifjcant decrease although kWh usage has dropped. There are severalreasons <strong>for</strong> <strong>the</strong> decreased consumption, including above average wintertemperature in 1976 <strong>and</strong> 1977 <strong>and</strong> fewer hours of operation during <strong>the</strong> day<strong>for</strong> small commercial establishments such as restaurants, fast foodoutlets, etc.It was assumed that a deficiency of small commercial establishmentsexisted prior to <strong>the</strong> pipeline activity <strong>and</strong> <strong>the</strong> services which wereprovided during <strong>the</strong> construction era will remain <strong>and</strong> continue to grow ata rate at least comparable to that of prepipeline activity.Public BuildingsThis class of consumer consists of schools, churches, <strong>and</strong> governmentbuildings. There has been a gradual increase in <strong>the</strong> number of consumerssince 1969 although <strong>the</strong>re were years of static growth. Public buildingconsumers <strong>and</strong> average usage was projected to increase as consumer dem<strong>and</strong>s<strong>for</strong> more <strong>and</strong> better services, comparable to those normally found in8-19
<strong>Power</strong> Requirement Study (excerpt)Anchorage <strong>and</strong> o<strong>the</strong>r larger cities, also increases. In<strong>for</strong>mation fromAlaska Labor Force Estimates also indicates an increase in <strong>the</strong> governmentwork<strong>for</strong>ce in <strong>the</strong> area.Street LightsNormal usage <strong>for</strong> street lights was assumed to remain at presentlevels. Three additional street light installations are expected within<strong>the</strong> next 10 years as normal expansion of <strong>the</strong> community occurs.Large CommercialThe average annual kWh <strong>for</strong> this class has been estimated to show amoderate increase. Consumers have shown a slow but gradual increase <strong>the</strong>past 10 years. Consumers have increased from 22 in 1974 to <strong>the</strong> present33 in 1978. Consumers were projected to increase during <strong>the</strong> future10-year period at approximately one-half <strong>the</strong> rate previously experienced.Over 350 kVAThe system presently serves 4 loads in excess of 350 kVA, namely:1. <strong>Valdez</strong> Memorial Hospital2. <strong>Valdez</strong> City Schools3. Fluor Staff Housing4. Farm <strong>and</strong> Sea of AlaskaThe Fluor Staff Housing load consists of a housing development whichis presently being reclassified to residential. 54 units have beencompletely removed from <strong>the</strong> area, 28 have already been reclassified in1978 <strong>and</strong> <strong>the</strong> remaining 118 units are scheduled to be transferred during1979 <strong>and</strong> 1980. There<strong>for</strong>e, this load has been phased out of operationafter 1980.Farm <strong>and</strong> Sea of Alaska is a new load which was connected February 2,1979. No historical data is available <strong>for</strong> this load. Estimates havebeen prepared based on in<strong>for</strong>mation supplied by <strong>the</strong> consumer.A potential load which exists, but has not been'considered in <strong>the</strong>estimates, is <strong>the</strong> expansion of <strong>the</strong> <strong>Valdez</strong> City Dock. The bond issue <strong>for</strong><strong>the</strong> port facilities is sCheduled to go be<strong>for</strong>e <strong>the</strong> voters April 10, 1979<strong>and</strong>, if approved, construction would begin in early 1980. Completion of<strong>the</strong> dock facilities would be expected in <strong>1981</strong>.8-20
<strong>Power</strong> Requirement Study (excerpt)GLENNALLENRural ResidentialRural residential consumers in <strong>the</strong> Glennallen area consist primarilyof single family units. Significant consumer growth was experienced inthis class of consumer during <strong>the</strong> 1974 to 1976 period due to constructionactivity related to <strong>the</strong> A1yeska Pipeline construction. Beginning in 1977<strong>and</strong> 1978, growth continued in <strong>the</strong> number of rural residential consumersbut at a much slower rate than experienced during pipeline construction.This was due to a return to an economy more normal to <strong>the</strong> area. Thenumber of consumers has not experienced a decline subsequent to <strong>the</strong>completion of <strong>the</strong> pipeline. It is expected that any consumers whichwould have departed <strong>the</strong> area have already done so. Many of <strong>the</strong> transientworkers (workers from outside <strong>the</strong> State of Alaska not bringing <strong>the</strong>irfamilies during pipeline construction) were housed in <strong>the</strong> Glennallen Camp(large power load) <strong>and</strong> would not appear in rural residential statistics.In projecting future growth in this class, it is expected that apreconstruct ion (1968-1974) growth rate will be followed. There isenough economic activity in <strong>the</strong> Glennallen area to assume this type ofgrowth. It is expected that <strong>the</strong> usage will, after several years ofdecline, begin a steady upward climb due to a return to more normaltemperatures <strong>for</strong> this area. The Glennallen area experienced ra<strong>the</strong>r warmwea<strong>the</strong>r in 1976-1978. Ano<strong>the</strong>r item which may affect residential usage is<strong>the</strong> possibility of installation of electric hot-water heaters as <strong>the</strong> costof propane gas increases.Small CommercialThe small commercial class consists of primarily small businesseswhich provide specific services to <strong>the</strong> area residents such as food,hardware, lumber, etc. The growth of small commercial consumers has seena ra<strong>the</strong>r consistent pattern since 1968 with <strong>the</strong> exception of a sharpincrease during 1976 <strong>and</strong> 1977. From all available in<strong>for</strong>mation, itappears that <strong>the</strong> Glennallen area will not suffer an economic letdown nowthat <strong>the</strong> pipeline is completed <strong>and</strong> growth of small commercial consumerswill continue. Although average monthly usage has shown a leveling trendsince 1975, this is expected to increase as more severe winter wea<strong>the</strong>rconditi~ns are anticipated <strong>and</strong> as <strong>the</strong> growth rate returns to a moreconsistent level.Street LightsIt was basically assumed that <strong>the</strong> number of street lights woulddouble over a lO-year period as normal growth occurred within <strong>the</strong> area.The average usage per installation is expected to remain at approximately<strong>the</strong> same number of hours each year.B-21
<strong>Power</strong> Requirements Study (excerpt)Public BuildingsThis particular class of consumer consists of government offices, schools,churches, <strong>and</strong> o<strong>the</strong>r community type organizations. Since 1973 <strong>the</strong>re has been asteady growth in <strong>the</strong> number of consumers. Continued growth is expected but ata slower rate experienced during prepipeline construction era. Averagemonthly consumption was projected on <strong>the</strong> basis that some consolidation wouldoccur within this class <strong>and</strong> larger facilities being constructed in <strong>the</strong> futurewhich could accommodate more than one type of activity.Large CommercialThe average annual kWh usage <strong>for</strong> this class has been estimated to show amoderate increase during <strong>the</strong> study period. Consumers ranged from 24 in 1974,39 in 1976 <strong>and</strong> 19 in 1978. The erratic growth is largely attributed topipeline activity <strong>and</strong> <strong>the</strong> subsequent completion of this project. In view ofthis, growth is expected to normalize <strong>and</strong> increase moderately to 21 consumersin 1983 <strong>and</strong> 24 in 1988. Both consumer <strong>and</strong> energy requirements were estimatedon a group basis.Over 350 kVAThe system is presently serving 4 loads in excess of 350 kVA, namely:1. Alyeska Mechanical Refrigeration No.2. Alyeska Mechanical Refrigeration No. 23. Alyeska Housing @ P.S. 124. Alyeska Pipeline Pump Station No. 12The Alyeska Pipeline Glennallen Camp has been completely phased out ofoperation. Alyeska Pipeline Pump Station No. 11 is expected to come on linebeginning 1983 as capacity in <strong>the</strong> pipeline is increased from <strong>the</strong> present 1.2million barrels a day to 1.6 million barrels a day. It is felt thatincreasing <strong>the</strong> capacity in <strong>the</strong> line must occur as <strong>the</strong> dem<strong>and</strong> <strong>for</strong> oil in <strong>the</strong>Continental United States continues to increase or as oil exchange agreementsbetween <strong>for</strong>eign countries are eventually finalized. There<strong>for</strong>e usage isexpected to be approximately equal to that of Pump Station No. 12.The refrigeration loads are necessary to freeze underground sections ofpipe to prevent melting of permafrost areas. These loads were projected on<strong>the</strong> basis of existing usage.The pump station loads include all power to <strong>the</strong> station except <strong>for</strong> <strong>the</strong>actual pumping load. The pumps are run by customer self-generation.B-22
APPENDIX CECONOMIC EVALUATION
APPElmIX CECONOMIC EVALUATIONTABLE OF CONTENTSItemItHRODUCTIOtJPROJECT COSTSInterest During ConstructionAnnual CostsOperation, Maintenance <strong>and</strong> Replacement CostsTotal Average Annual System CostsPROJECT BENEFITSUpdating of FERC <strong>Power</strong> ValuesTransmission LossesCredit <strong>for</strong> Energy <strong>and</strong> CapacityNED Employment BenefitsECONOMIC ANALYSIS OF THE SELECTED PLANComparability TestSensi ti vi ty TestsLow-load Growth AssumptionAlternate Discount RateFuel Cost EscalationWithout Pressure Reducing TurbineMatrix Table of Multiple ConditionsHYDROPOWER BENEFIT COMPUTER PRINT OUTPageC-lC-lC-2C-7C-lli
INTRODUCTIONThe purpose of this section is to outline <strong>the</strong> basic assumptions usedin making <strong>the</strong> economic analysis <strong>for</strong> hYdro development in <strong>the</strong> <strong>Valdez</strong><strong>Copper</strong> Valley area. Evaluation is based exclusively on economic benefitsthat can be derived from hydropower development. Evaluation of <strong>the</strong>Allison Lake development was accomplished by comparing <strong>the</strong> benefits toaccompanying costs. The benefit value of hYdroelectric power is measuredby <strong>the</strong> cost of providing <strong>the</strong> equivalent power from <strong>the</strong> most likelyalternative source (diesel).The base condition of <strong>the</strong> selected plan calls <strong>for</strong> <strong>the</strong> installment of<strong>the</strong> PRT by 1984. The proposed Allison hydro project would <strong>the</strong>n augment<strong>the</strong> system with a power-on-line date of 1990. These projectedinstallment dates are derived from <strong>the</strong> community's future power needs, asposited by <strong>the</strong> Alaska PO\ter Administration's load growth <strong>for</strong>ecast. TheAll i son hYdro component of <strong>the</strong> sel ected pl an is <strong>the</strong> subject of a margi nalanalysis in <strong>the</strong> latter half of this appendix.PROJECT COSTSA detailed cost estimate of <strong>the</strong> selected project is contained inSection D of <strong>the</strong> appendix.Interest During Construction:For <strong>the</strong> purpose of <strong>the</strong> screening analysis, interest duringconstruction was based on <strong>the</strong> <strong>for</strong>mula of simple interest (7-3/8 percent)applied to a uni<strong>for</strong>m expenditure over <strong>the</strong> construction period.Annual Costs:The compound interest charge on costs incurred during <strong>the</strong> constructionperiod of any project is considered a logical cost of <strong>the</strong> constructionphase <strong>and</strong> is added to first cost to establish <strong>the</strong> investment cost. Thisinvestment cost can <strong>the</strong>n be trans<strong>for</strong>med into an average annual fixed costby applying <strong>the</strong> appropriate capital recovery factor associated with <strong>the</strong>7-3/8 percent interest rate <strong>and</strong> 100-year economic project life. Byadding operations, maintenance, <strong>and</strong> replacement costs, a total annualcost is establ i shed <strong>for</strong> <strong>the</strong> purpose of determi ni ng comparabil ity <strong>and</strong>feelsi bil i ty.Operation, Maintenance, <strong>and</strong> Replacement Costs (OM&R):Annual or~&R costs were provided by <strong>the</strong> Al aska <strong>Power</strong> Admi ni strati on(APA) <strong>and</strong> a more detailed discussion appears in <strong>the</strong> section on assessment<strong>and</strong> evaluation of detailed plans. An OM&R cost of $200,000 has beenestablished <strong>for</strong> <strong>the</strong> Allison Lake project.C-l
Total Average Annual System Costs:The average annual costs <strong>for</strong> <strong>the</strong> various plans of development arebased on a 7-3/8 percent annual interest rate <strong>and</strong> a 100-year economiclife. These costs also reflect transmission facilities, access, l<strong>and</strong>acquisition, replacement costs, annual operation <strong>and</strong> maintenance, <strong>and</strong>o<strong>the</strong>r associated project costs.PROJECT BE~EFITSThe benefit value of hydroelectric power is measured by <strong>the</strong> cost ofproviding <strong>the</strong> equivalent power from <strong>the</strong> most likely alternative source.The types of alternative power sources appropriate <strong>for</strong> <strong>the</strong> <strong>Valdez</strong>-<strong>Copper</strong>Valley area <strong>and</strong> <strong>the</strong> annual unit costs <strong>for</strong> those alternatives have beendetennined by <strong>the</strong> Federal Energy Regulatory Commission <strong>and</strong> updated <strong>for</strong>current fuel costs by this organization. For derivation of benefits <strong>the</strong>energy <strong>and</strong> capacity-producing capabilities of <strong>the</strong>se projects will beadjusted to account <strong>for</strong> transmission losses <strong>and</strong> marketabilityconsiderations.Updating of FERC <strong>Power</strong> Values:Escalating prices of petroleum products have made it necessary toinclude <strong>the</strong> effects of recent increases on project feasibility. TheFederal Energy Regulatory Commission provided <strong>the</strong> Corps of Engineers wi<strong>the</strong>nergy <strong>and</strong> capacity values <strong>for</strong> <strong>the</strong> most likely alternative (diesel) to beimplemented if hydropower were not developed (see 1 February 1980 letter,Appendix H). These values were based on 1 July 1979 fuel prices of 58.8<strong>and</strong> 57.1 cents per gallon at Glennallen <strong>and</strong> <strong>Valdez</strong> respectively. As ofSeptember 1980 <strong>the</strong>se prices had increased to nearly 90 cents per gallon.In order to account <strong>for</strong> <strong>the</strong>se increases <strong>and</strong> to bring <strong>the</strong>m up to datewith <strong>the</strong> Ocotber 1980 cost estimate <strong>for</strong> hydropower development, certainadjustments were made.The values given <strong>for</strong> capacity were assumed to remain <strong>the</strong> same, <strong>the</strong>majority of <strong>the</strong>se costs are fixed, with fuel cost escalation havinglittle effect. For <strong>the</strong> economic analysis <strong>the</strong> capacity values (Federalfinancing) of 93.86$/kW-yr <strong>and</strong> 97. 52$/kW-yr <strong>for</strong> <strong>Valdez</strong> <strong>and</strong> Glennallenwere ~i ghted accordi ng to energy use in <strong>the</strong> respecti ve porti ons of <strong>the</strong>study area. A weighted value of 95.43$/kW-yr has been used.The energy values provided by FERC include <strong>the</strong> cost of fuel <strong>and</strong>operation <strong>and</strong> maintenance costs. Based on heat rates of 138,000BTU/gallon <strong>and</strong> 9,370 BTU/kWh <strong>the</strong> proposed diesel units would produce14.73 kWh/gallon. By subtracting <strong>the</strong> weighted cost of fuel from <strong>the</strong>weighted energy value, a weighted value <strong>for</strong> O&M of 5.82 mills/kWh wasdetermined. This value was assumed to remain constant.To determine <strong>the</strong> updated energy values <strong>the</strong> projected cost of dieselfuel (90.0i/gallon / 14.73 kWh/gallon = 6.11¢/kWh or 61.10 mills/kWh) wasadded to <strong>the</strong> O&M cost (5.82 mi 11 s/kWh) to arri ve at an updated energyC-2
value of 66.92 mills/kWh. This figure was <strong>the</strong> basic mill rate used <strong>for</strong>economi c eval uati ons throughout <strong>the</strong> report. Its primary shortcomi ng isthat it does not take into account any inflationary changes in <strong>the</strong>capacity values or <strong>the</strong> O&M of <strong>the</strong> energy value which would put it on parwith <strong>the</strong> hydropower cost estimate. As a result <strong>the</strong>se figures are seen tobe conservative.Transmission Losses:Benefits must be based on prime power which represents projectcapabilities less losses. The highly favorable location of <strong>the</strong> AllisonLake project necessitates only 3.5 miles of additional transmissionline. Thus, <strong>for</strong> benefit evaluation purposes capacity losses are assumedto be 2.0 percent. Whil e <strong>the</strong>re "Ii 11 be addi ti onal losses through <strong>the</strong>transmission network, this would be absorbed by <strong>the</strong> local utility <strong>and</strong>reflected in <strong>the</strong>ir rates to users. This practice is consistent with <strong>the</strong>(modified) power values provided by <strong>the</strong> Federal Energy RegulatoryCommission. For purposes of <strong>the</strong> final screening analysis, a 2 percentcapacity loss ,,,as applied to each project variation.Credit <strong>for</strong> Energy <strong>and</strong> Capacity:Opportunities exist <strong>for</strong> displacing energy which could <strong>the</strong>oretically beproduced by exi sti ng <strong>the</strong>rmal pl ants. If <strong>the</strong> cost of hydro energy ischeaper than <strong>the</strong> cost of producing energy with <strong>the</strong> existing <strong>the</strong>rmalplants, it is to <strong>the</strong> utilities· advantage to shut down <strong>the</strong> <strong>the</strong>rmal plants<strong>and</strong> purchase hydro energy. This I'lould conserve fossil fuel, which wouldo<strong>the</strong>rwise be burned. The value of <strong>the</strong>nnal energy that would be displacedis dependent on prevailing fuel costs. For <strong>the</strong> <strong>Valdez</strong>-<strong>Copper</strong> Valleyregion it is apparent that maximum possible displacement of <strong>the</strong>rmalenergy is desirable. Although CVEA is expected to fully employ all hydrocapacity at <strong>the</strong> earliest opportunity, <strong>the</strong> capacity costs of displacedexisting diesel units cannot be claimed as a benefit. Thus <strong>the</strong> proposedproject is not given any credit <strong>for</strong> capacity until 1994. Capacity creditis <strong>the</strong>reafter IIstepped in ll according to a diesel retirement scheduleprovided by <strong>the</strong> Alaska <strong>Power</strong> Administration.As illustrated in Figure C-l, <strong>the</strong> communities projected pOI'ler dem<strong>and</strong>over <strong>the</strong> year 1997 will exceed <strong>the</strong> total firm energy output of SolomonGulch, <strong>the</strong> PRT <strong>and</strong> Allison <strong>for</strong> nearly every interval in that period. By<strong>the</strong> follOl'ling year, <strong>the</strong> power dem<strong>and</strong> exceeds <strong>the</strong> system·s firm energyoutput at every poi nt. The proposed project is <strong>the</strong>re<strong>for</strong>e gi ven fullcredit <strong>for</strong> firm energy as it is absorbed into <strong>the</strong> system.Figure C-2 is similar to <strong>the</strong> previous figure except that it includessecondary energy <strong>and</strong> is adjusted to reflect conditions in <strong>the</strong> year 2000.r~ote - <strong>the</strong> absence of <strong>the</strong> PRT (caused by <strong>the</strong> exhausti on of <strong>the</strong>Prudhoe Bay field).C-3
15FIGURE C-I: PRT, SOLOMON GULCH, ANDALLISON LAKE FIRM ENERGYPROJECTED ENERGYDEMAND FOR THEYEAR 1997.105oJ F M A M J J A SON 0
FIGURE C-2: SOLOMON GULCH ALLISON LAKEAPA REVISED PROJECTION15PROJECTED ENERGYDEMAND FORTHE YEAR 200010ALLISON LAKESECONDARY-----ENERGY"5oJ F M A M J J A SON D(-5
As can be seen from Figure A-l, Appendix A, <strong>the</strong> availability ofsecondary energy from Allison is very erratic, <strong>and</strong> secondary energy is asmall proportion of firm energy. Early in <strong>the</strong> project life, little of<strong>the</strong> All ison secondary energy would be usuable because loads would belm'/er <strong>and</strong> secondary energy \'Iould also be available from Solomon Gulch.Consequently, no secondary energy benefits are claimed be<strong>for</strong>e year 2000.After year 2000, however, it is estimated that an equivalent annualaverage of 65 percent of Allison secondary energy will be usable <strong>for</strong>displacing diesel generation, considering load growth <strong>and</strong> monthlydistr'ibution of loads, <strong>and</strong> <strong>the</strong> availability of energy from Solomon Gulch.tJED Employment Benefits:Project benefits <strong>for</strong> employment are claimed to show <strong>the</strong> impact ofproject construction on a local economy. A cornmunity is declaredeligible based on a condition of persistant <strong>and</strong> continuous unemployment,<strong>for</strong> which <strong>Valdez</strong> qualifies. Project labor requirements <strong>for</strong> skilled <strong>and</strong>ullski 11 ed \'Iorkers can be partly filet by <strong>the</strong> unemployed workers of <strong>the</strong>area. The amount earned by thi s group is amorti zed over <strong>the</strong> project 1 ife<strong>and</strong> claimed as a project benefit, because <strong>the</strong>re is no economic costentailed in <strong>the</strong> use of o<strong>the</strong>rwise unemployment resources.Data from <strong>and</strong> evaluation of <strong>the</strong> Public Works Impact Program (PWIP)indicates that 30 percent of <strong>the</strong> wages paid to skilled labor <strong>and</strong> 45percent of wages paid to unskilled labor can be expected to flow topreviously unemployed or underemployed \'/orkers, based on records fromo<strong>the</strong>r large public works projects. These are broad, general averages.Labor market conditions in Alaska tend to be different from those in <strong>the</strong>rest of tile country. There are adequate numbers of unemployed workers in<strong>the</strong> affected eligible labor areas (3,500 unemployed out of a labor <strong>for</strong>ceof 30,000 in <strong>the</strong> <strong>Valdez</strong> <strong>and</strong> Fairbanks area) to supply project needs.Ra<strong>the</strong>r large proportions of <strong>the</strong> project construction jobs can be expectedto be filled by immigrants, based on previous experience. Thepercentages from PWIP evaluations were consequently reduced by 36 <strong>and</strong> 75percent <strong>for</strong> skilled <strong>and</strong> unskilled labor, respectively, based on recentexperience with o<strong>the</strong>r multimillion dollar construction projects. Thisapproach provi des what may be a conservati ve estimate of ~JED employmentbenefits, but <strong>the</strong> magnitude of <strong>the</strong> benefits does not warrant <strong>the</strong>e~tensive labor market analysis which would be required to refine <strong>the</strong>sepercentages fur<strong>the</strong>r.To estimate rJED employment benefits, it is also necessary to determinewhat proportion of construction costs would flow to skilled <strong>and</strong> unskilled\'Jorkers. Based on experience with o<strong>the</strong>r project, 42 percent ofconstruction costs can be expected to accrue as \'lages. Of <strong>the</strong>se wagepayment, a 60/40 split beb/een skilled <strong>and</strong> unskilled workers isexpected. Computation of r~ED employment benefits is detailed below.Employment Benefits ComputationProject Construction Cost (less E&D S&A IDC) =Labor Costs (42%) =$29,407,000$12.351.000C-6
Er.Jployment Benefits Computation (cont)SkilledLabor Cost (60%)Unemployed (.30x.36) $7,411,000800,000Unsld 11 edLabor Cost (40%) $4,940,000Unemployed (.45'x. 75) 1,667,000Total Payment to Under or Unemployed 784,000 + 1,679,000Annual Benefit 2,538,000 x .0738Fuel Cost Escalation:$2,467,000182,000Olle of <strong>the</strong> most practical features of a hydroel ectric pl ant is itscontribution to fossil fuel conservation. The real price of petroleumhas increased dramatically in recent years <strong>and</strong> will continue this trendto <strong>the</strong> <strong>for</strong>seeable future. Real increases in diesel fuel costs createcorresponding real increases in <strong>the</strong> value of diesel generation displacedby <strong>the</strong> hydro p1 ant.For purposes of this report, diesel fuel price <strong>for</strong>ecasts developed by<strong>the</strong> U.S. Department of Energy have been used. Real diesel fuel priceescalation rates <strong>for</strong> Region 10 (Alaska) are estimated as follows: from1980-84, 3.1% from 1985-1990, 2.2% <strong>and</strong> 4% <strong>for</strong> <strong>the</strong> next 20 years. Thevalues <strong>for</strong> energy received from <strong>the</strong> Federal Energy Regulation Corronission(FERC) have been adjusted to <strong>the</strong> power-on-line date (1990) to establish astarting value. Energy values are <strong>the</strong>n escalated by 4 percent <strong>for</strong> <strong>the</strong>next 20 years <strong>and</strong> held constant <strong>for</strong> <strong>the</strong> remaining project life. Thevalues are applied to each future year <strong>and</strong> are discounted to 1990 at <strong>the</strong>current project interest rate <strong>and</strong> expressed as an average annual benefitvalue. The tables showing power benefits at <strong>the</strong> end of this appendixgive <strong>the</strong> details of yearly fuel price escalation <strong>for</strong> each conditionconsidered in <strong>the</strong> report.ECO~OMICANALYSIS OF THE SELECTED PLANThe selected plan has net benefits of $1,751,000 annually when <strong>the</strong>pressure reducing turbine is treated as part of <strong>the</strong> without projectconditi on. Project economics are summari zed below.Sensitivity Tests:Average Annual Benefits ($1,000)Average Annual Costs ($1,000)Net Annual Benefits ($1,000)Benefit-Cost Ratio4,9853,2341 , 7511. 54Several tests of economic justification wey'e made <strong>for</strong> <strong>the</strong> selected plan todemonstrate <strong>the</strong> effect of departures from <strong>the</strong> assumptions that underlie <strong>the</strong>analysis. Each of <strong>the</strong> tests was conducted under <strong>the</strong> criteria outlined earlierin this section, but with <strong>the</strong> specific changes noted below.C-7
Fuel Cost Escalation:For <strong>the</strong> base case, <strong>the</strong> assumptions concerning fuel costs have beenoutlined. Should <strong>the</strong> prOV1Slons <strong>for</strong> fuel cost escalation prove too modest,<strong>the</strong> proposed project would yield greater benefits that anticipated.Conversely, if fuel costs do not increase in real terms, <strong>the</strong> projectedbenefits of Allison are reduced. This sensitivity test examines <strong>the</strong> effectsof reduced fuel cost escalation <strong>and</strong> no fuel cost escalation. Assuming thatCVEAls current diesel costs remain unchanged throughout <strong>the</strong> project life <strong>the</strong>resulting costs <strong>and</strong> benefits are as follows:Average Annual Cost ($1,000)Average Annual Benefits ($1,000)Net Annual Benefits ($1,000)Benefit-Cost Ratio3,2342,812-422.87In <strong>the</strong> absence of fuel cost escalation project benefits are substantiallyreduced with a BC rati 0 fall i ng belo\,1 uni ty. When fuel costs are escalateduntil <strong>the</strong> pO''Ier-on-line date <strong>and</strong> held level <strong>the</strong>reafter, <strong>the</strong> feasibility of <strong>the</strong>project improves as shown bel 0\'1:Average Annual Costs (1,000)Average Annual Benefits ($1,000)Net Annual Benefits ($1,000)Benefit-Cost Ratio3,3583,2341241. 04Without Pressure Reducing Turbine:Although <strong>the</strong> selected plan anticipates <strong>the</strong> presence of <strong>the</strong> PRT, this is notnecessarily a <strong>for</strong>egone conclusion. Fur<strong>the</strong>rmore, <strong>the</strong> projected output of <strong>the</strong>PRT has recently been subject to downward adjustments as a result of moremodest expectati ons concerni ng <strong>the</strong> rate of oil flow. Thi s uncertai nty coupledwith <strong>the</strong> unusual nature <strong>and</strong> per<strong>for</strong>mance of <strong>the</strong> PRT makes its possible absencean appropriate subject <strong>for</strong> a test of sensitivity. The impact on powerbenefits of this possibility is shown in <strong>the</strong> summary which follO\~s:Average Annual Benefits ($1,000)Average Annual Costs ($1,000)~et Annual Benefts ($1,000)Benefit-Cost Ratio5,8133,2342,5791.80The preceeding table shows a significant increase in project benefits. Theeffect of <strong>the</strong> without PRT condition, combined with varing fuel cost escalationrates, is summarized in <strong>the</strong> matrix table of end of this text.Low-load Growth Assumption:The economic analysis has been based 011 <strong>the</strong> Alaska <strong>Power</strong> Administrationlsrevised load growth projection. Based on present knowledge, this isconsidered <strong>the</strong> most reasonable estimate of future conditions. An economicdownturn <strong>and</strong> lower growth in power dem<strong>and</strong> are \'tithin <strong>the</strong> realm of possibility<strong>and</strong> woul d affect pm'ler benefits of <strong>the</strong> proj ect. Lesser dem<strong>and</strong> coul d mean adelayed power-an-line date, or a longer period of underutilization. With <strong>the</strong>10\ler load growth a ssumpti on proposed by Re<strong>the</strong>r<strong>for</strong>d <strong>and</strong> Associ ates pri or toALPETCO, an additional 2 years would be required be<strong>for</strong>e <strong>the</strong> projectls firmC-8
energy would be fully utilized. As a result <strong>the</strong> annual power benefits arereduced by approximately 9 percent to $4,534,000. A summary of <strong>the</strong> resultingeconomic justification <strong>for</strong> <strong>the</strong> low case is as follows:Average Annual Benefits ($1,000)Average Annual Costs (1,000)Net Annual Benefits $1,000)Benefit-Cost Ratio4,5343,2341,3001.40The above sllmnary is based on <strong>the</strong> power-on-1ine date of <strong>the</strong> selected plan(1990). A delayed power-on-1ine date of 1995 under <strong>the</strong> low growth assumptionreduces <strong>the</strong> problem of underuti1ization. Never<strong>the</strong>less, 2 years must elapsebe<strong>for</strong>e <strong>the</strong> project is fully absorbed. Resulting benefits <strong>and</strong> costs have beenbrought back to a 1990 base <strong>for</strong> <strong>the</strong> purpose of comparison.Average Annual Benefits ($1,000)Average Annual Costs ($1,000)Net Annual Benefits ($1,000)Benefit-Cost Ratio4,3342,2662,0681. 91The effects of various fuel cost escalation rates on <strong>the</strong> low load growthscenario <strong>and</strong> <strong>the</strong> 1990 power-on-1ine date are shown at <strong>the</strong> end of this text.Impact of Solomon Gu1ch ' s Secondary Energy:As previously stated, benefits <strong>for</strong> <strong>the</strong> selected plan were estimated under<strong>the</strong> assumption that <strong>the</strong> availability of secondary energy from Solomon Gulchwould not reduce <strong>the</strong> usability of Allison Lake's firm energy. In reality,Solomon Gu1ch ' s secondary energy \'lou1d probably render some of Allison's finnenergy surplus <strong>for</strong> short intervals during high flow years early in <strong>the</strong> projectlife. Due to <strong>the</strong> lack of data on Solomon Gu1ch ' s secondary energy output <strong>and</strong>due to <strong>the</strong> limited significance of <strong>the</strong> potential effect, <strong>the</strong> SUbstantialanalysis ef<strong>for</strong>t required to quantify <strong>the</strong> effect was judged to be unwarranted<strong>for</strong> a small hydro project. To test <strong>the</strong> sensitivity of <strong>the</strong> analysis to thissimp 1 ifyi ng assumpti on, however, benefi ts \~ere reestimated based on <strong>the</strong>assumption that all of <strong>the</strong> Solomon Gulch secondary energy would displaceAl1ison ' s firm energy. This is clearly an extreme test, but it provides anupper-based estimate of <strong>the</strong> significance of this assumption. As shown,benefits are reduced to $1,717,000 under this extreme test, a reduction of 5percent. Ttli s confi rms that no si gnifi cant change in study fi ndi ngs wou1 doccur by quantifyi ng <strong>the</strong> di sp1 acement of All i son Lake IS fi rm energy by SolomonGul::h I s secondary.Average Annual Benefits ($1,000)Average Annual Costs ($1,000)Net Annual Benefits ($1,000)Benefit-Cost RatioAlternate Discount Rate:4,7173,2341,4831.46Interest rates <strong>for</strong> evaluation of civil works projects are annuallyestablished by law <strong>for</strong> use by all Federal water resource agencies. Thecurrent applicable rate is 7-3/8 percent, but some higher rate is likely <strong>for</strong>C-9
ensuing years. To test <strong>the</strong> sensitivity of project economics to changes in <strong>the</strong>discount rate, <strong>the</strong> analysis was reevaluated at a rate of 8 percent. Thehigher figure was used in <strong>the</strong> discounting of both benefits <strong>and</strong> costs, although<strong>the</strong> power values in this alternative analysis are still based on <strong>the</strong> officialrate of 7-3/8 percent. The results of this sensitivity test are presentedbelow:Average Annual Benefits ($1,000)Average Annual Costs ($1,000)Net Annual Benefits ($1,000)Benefit-Cost Ratio4,8673,2341,6331. 50C-10
ECONOMIC EVALUATION OF HYDROPONER MODE~ALASKA DISTRICT, ARMY CORPS OF ENGI~EERS____ . ~ _____ AL~ISON HYDRO: n/PRTI REvISED APA; Nt ... FUEL ESC, 8Mr.PRESENT TOTAL PRESENT MARKETABLE FIRM PRES. NORTH MAR~ET. VALut Of PRESENT______ YlOR TH MAR!5,1807 _ 5318.8 1477,6 3.2 528.6 146.8 IB31.2200'l----0~2587------7:8-----744:4 192:6 32.2 171.5552 552~.1 142'1.2 3.2 S~
ECONOMIC EVALUATIOII OF HrDROPO .. ER "'ODELALASKA DIS1R]CT, ARMY CORPS OF E~GINEERSALLISON HrDRO: W/PRTJ REvISED APAI FuEL E~~ TO 1990; 8~WYEARPRESENT TOTAL PRESENT MARKETABLE FIRM PRES. WORTH MAR~ET.wORTH MARKETABLE VALUE OF WURTH OF FIRM M!LL5/K~H ENERGY ENERGy SE~D~DAR,FACTOR ---CAPAC! T Y-- CA PAU t V-CAPAC if Y --E NE f?L___'IQ.Q.Q___5018.7 24798.3 2973.9 1048.8 30Bb5.92011---2090--3:-ZSS11 7.8 74/j~lj- .l"4~a:~---32-:-2---8~5 2720.4 8BS~---3:-2--- i7 0.4PRESENT ~ORTH- ._---BENEFITS 7441.933b54,3_ ~244 ,2- -CRF= 0.0738 AV ~NN BENEFITS = 549.3- -_._---------------------------CAPACITY VALuE= 'lS.43FUEL ENERG1 VALUE (1980): bl.IOAvE ANNUAL PO~ER BENEFITS= 3175.9EMPLOYMENT 8E~EFITS~ 182.0ANNUAL BENEFITS= 3357.9---- ANNU-Al.-COST3-"-3234-:-0--___ _______ B(~ __ ':!~ T ~9= 1.011880.11'128,912159.243025.1_2IJ84,? 3175,9
ECONOMIC EV~LUATION OF HYDROPO~ER MODELALAS~A DISTRICT, A~MY CORPS OF E~GINEERS__ _ __ ALL ISO N H Y Q R 0 I ~ I ~ R T IRE V I SED A P A; NO F U E L ESC; 8"1 WPRESENT TOTAL PRESE~T MARKETABLE FIR~ PRES. ~ORTH MARKET. VALUE OF PRESENTSEC.BEr-ERGYWORTH MAR~£TABLE VALUE OF wORTH OF fIRM MILLStKr'lH __ ~NEI!!!.Y ____ ENE~~Y ___ ~ECOIWARr- --Y-E AR---F A C TOR--t A-PACITY--CAPAC iiy-CAPAC IT Y-E-NE RGY-- i ~C:. cii.M BE NE FIT S BE r,EF ITS U.[RG Y. "'QRT t1 TQTnSEC. E~EkCY BENEFITS----- - --- ----, M W )- ---( i i 0 00 ) ( 1 I 0 00 ) ( G w H ) ( 1 I 00 0 ) ( ~ I 0 0 0 ) ( G W H ) ( S I 0 0 0 ) ( S I 0 0 0 ) ( S I 0 0 0 )1'1'10 ___ 1.0000 _______ 0,0 _______ 0,0 .0.0 7.0 __ 6(>.'1200 _468.4 .4/)8.tj 0,0 0,0 0.0 4be.41'1'11 0.9313 0.0 0,0 0.0 11.7 6b.'1200 783.0 72'1.2 0.0 0.0 0.0 72'1.2___ 1J_92 __ Q.~6D ____ 9_.0 0 ,Q_____ 9. 0 ___ I./) .. ~_/)Q.92Q 0 ____ IJQ4 .'--____ 951 .. 1 __ 0, Q ______ 0.0 ________ 0. Q _957. L1'1'13 0.8018 0.0 0.0 0.0 21.6 66._L9fOQ ___ 1L5~. ~ __) n 9.5..__ 9.90. Q ________ 0 .. L ___ l!i~Q • .e __ .---1-'19'1--0-:-5271 1:8---7~L!.~----3'l2.3 32.2 66,9200 2154.8 1135.0 0.0 0.0 0.0 1520.12000 0.1l909 7,8 744.4 3b5,4 ____ 32,2 66.9200 2154.8 1057.7 3.2 214.1 105.1 1528.2(J 2001 0.4572 7.8 744.4 340.3 32.2 66.9200 2154.8 985.1 3,2 214.1 97.9 1423.3I 2002 0,4258 7.8 744,4 316,9 32.2 66.9200 2154.8 .._917.4 3.2 214.1 91.2 1325.5t;. 2003 0:3'165 7.8 744.4 295.1 32.2 bb,'1200 2154.8 854.4 3.2 214.1 84.'1 1234.5 '___ 2004 0.3693 1.8 744,4 274J. 32.l2 __ ~6, 92QQ ___ f L~.E..Jl ___ IJ~ ... L__ _~. ~ ____ ~ 1 ~ .1____ 19. L __ llll'l. 7 __________ 12005--0:-3 Q:3 q '1:-8-- - -7 -44: 4 ---2 Sb • 0 32. 2 66 • '1200 2 154 • 8 74 I • I 3.2 2 I 4 • I 73.6 I 070.72006 0.3203 ______ 1.1l 744,4 ____ 238,4 ___ J2.2 ___ 66.9200 __ 2154.8 ___ 690,2 ;'.Z ~1~.1 b8.i> '1'1],22001 0.2'183 7.8 14~.4 222.0 32.2 66,9200 2154.8 642.8 3.2 21~,1 63.'1 '128.72006 0 • 2778 _______ 1. 8 7 ~ ~ • 4 2 0 b • 8 32 • 2 _ 66, '120 0 _ 2 I 54 • 8_ _ 598 ,I> 3 • 2 2 I 4 • 1 .. 5'1. 5 864 • 92009 - 0: 2581 1 • 8 14 /1.4---- I 92 , b 32.2 66 .9200 2 I 54 • 8 557. 5 :1.2 2 I ~ • I 55 • 4 805.52010 O. 211 I 0 7.8 144 ,Il U~L4 3L.2 __ ~~ .. 9fOO __ 2.1~.!I-L§ ___ ~J~~ ____..J.~____ ~ l!l. L_---.5I .. b __ ~_5Q.2. ___.__'5018.7 1'1642.6 2355.6 830.8 25q'l2.1-------------2011----20 q 0--3 -:-25511 7.8 21511.8 70lIJ,7 3.2PRESEtH _WORTtt. BENEFIT~26657, q __ _ _,-CRF= 0.0736 AV ANN BENEFITS:----------------------- --_._------ ----------.CAPACITY VALUE= '15.43fUEL ENERGY VALUE (1'180)= 61.10AVE ANNUAL POWER BENEFITS= 2629.8EMPLOl~ENT BENEFITS= 182.0ANNUAL BENEFITS: 2811.8----ANNUAC-COSTS=-32:111.0-----BIC RATIO: 0.87- - . --l'Ib1,L I! 2.8 262'1.8------ ---.---- ---.-- - - --.------------ .-------
ECONO~IC EvALUATION OF H~OwuPO~ER ~OOELA LA 51\ A DIS T R I Cl, A R,.. ~ COR P S 0 FEN G I I. E E R SALL!SON ~YDRO:~O(PRTI REVISED APAJ NEw FUEL ESCI 8~~----._---- - -PRESENT TOTAL PRESENT ~ARKETABLE FIRM PRES. WORTH ~A~KET. VALUE OF PRE~ENT___________ WQRI fL"'ARKEJ A!lL~_Y_~~Ul_ QF_~Q8.TH Qf __ J I R~ __ ~ ILL ~tK.!'/H~_E_Tlj~ 8~r __ ETljEg~L_?~ q,)r.[lA~L _ ~tC IiQRT H TOTA\.YEAR FACTOR CAPACITY CAPACITY C'PACITY ENERGY INC. O&~ BENEFITS &E~EFITS E~ERGY BENERGY SEC. ENlRGY blNEFITS--.----. -----.-. -------- -------- -------- -------- ---.---- --------- - -(MW) (SIOOO) (SIOOO) (Gr"'1) (!IOOO) (11000) (Gr.H) (11000) (SIOOO) (tIOOO)__ .1999___ l.Q9QO _____ 3.18 ___ 362,6 )b2.6 32.2 64.484'1 2720.4 ___ 2720.4 :'>.2 '70.~ 270.4 3353.41991 0.9313 5.3--505.8----471.0 32.2 87.6315 2821.7 2627.9 3.2 280.4 261.2 33bO.11992 0.8673 6.7 H~_.~ ___ 5?!I.6 ______ 32,? __ 90,9Q~Q __ 2_921.I __ f?:.\!I.!L_ _ 3,'- ____ 2'1Q.9 _____ 252,3. ___ ~345.7---1-9 q 3--6 :-807-8 7 • 8 7 4 4 • 4 6 0 I • 3 3 2 • 2 9 u • 3 0 7 4 3 0 36 • 7 24 5 3 • 0 3 • 2 3 0 I • 8 2 4 3 • 8 3 2 'i 8 • 0I 994 __ 0!}?2} _?8 ___ 7tj4.-,! __ 560,032.2 __ 97.84/:>9 _____ 3150.7 _____ 2370.2 3.2 313.1 235.0 3165.81995 0.7006 7.8 744.4 521.5 32.2 101.5279 3269.2 2290.5 3.2 324.'1 227.6 3039.6I 99 b 0 • 6 5 2 5 7 • 8 7 44 • 4 _ Q 8 5 • 7 3 2 • ? __ _ I 0 5 , 3 5 6 3 .3 3 9 2 ,5 ___ 2 2 I 3 • b 3 , 2 3 3 7 • 1 2 2 0 • 0 2 'I 1 9 • 31997--0:/;077"-----7:8 --7Q4~4- -----452.3 32.2 10'1.3377 3520.7 2139.5 3.2 349.9 212.6 2804.4__ --:1998 0.5659 7_.8 ___ 7 ~4 .'L __ 4f 1,3 ___ }?. f __ ln ,-,!? 84 3t>5 ~,Q ____ Z06fl.Ji_ __ _ __ ~,' HL I _____ , Q5, 5 ___ 'Q~4 ... L___ ___ _1999---6-:-5271 7. 8 744 .4 39 2.3 32.2 I I 7. 7847 ;3 79 2 • 7 19 '19 • 0 3.2 376 • 9 198. 7 2590 • 02000 0!4909 ____ 7.8 74Q.4 365,4 32,2_ 122.2633 3936,'1 1'132,5 3,2 3'11,2 1'12,1 248'1,92001 0.4572 7.8 744.4 340.3 32.2 126.9211 4086.9 le68.3 3.2 400.1 185.7 23'l~.32002 0.4258 7.8. 7Q4,4 ___ 316,'1 32,2 131,7651 _4242,8 1806,4 3,2 u21.6 179.5 230Z.92003 0.3965 7.8 744.4 2'15.1 32.2 136.802'1 4405.1 1746.7 3.2 437.8 173.0 2215.42004 0.36'13 7 I 8 7_Q.:!, ~ ____ ?7_4, 9 ______ 32 .1_1.~? .9.!
------~-~ECONO~IC EVALUATION OF HYDROPO~ER MODELALASKA DISTRIC1, ARMY CORPS OF Er.GIr>EERSALLISON HYDRO:~O/PRT, REVISED AP,; FUEL ESC yo )990; 6~wPRESENT TOTAL PRESENT MARKETABLE FIR~ PRES. ~ORTH ~A~KE1. VALUE UF PRESENTWORTH MARKETABLE VALUE OF WORTH OF FIRM MILLS/~WH ENEAGYENERGYSECONO&RISEC, ~ __ ~OR1H lOYAL-- --YTA R-- FAe {OR--CAP A C-I TY-C APACI T Y-C A PAC i i y-~ ENE RG Y -- INC ~ -oi~1 ~-~- BE I,E FiT 5-- bE ;;u ITS E rde R G Y BENlRGY SEC. ENl~GY Bl~EFI1S----.--. -.------ -------- -------- -------. -------- -------- -.-----. -.-----. ---.-.-. -------. -.---.-. ~-------(MW) (SlOOO) ($1000) (G~H) (~IOOO) (11000) (G~H) ($1000)1990 1.0000 3.~ 302.b ~ 362.0 32,2 ~4.4~~9 2720.4 2720,4 3.Z 270,41991 0.9313 5.3 505.8 471.0 32.2 84.4849 2720.4 2533.0 3.2 270,4____ J 9'12_ ~_O--, 80 7 ) ____ ~ ,J___ ~o ?"--J 1! ___??4, b __ 32, 2 _ 84, 4b4"-_~ __ 212 0, 9~ n';.'l. 5 _ 3.2 27 Q. ~1'193 0.8078 7.8 744.4 601.3 32.2 84.4849 2720.4 2197.5 3.2 270.41994 0.7523 _ 7,8 744,4 _ 560,0 32.2 84.4649 2720." 2040.0 3.2 270,41995 0.7000 7.8 744,4 521.5 32.2 e~.u849 2720.~ 1900.0 3.2 270.41990 0.6525 7.8 744.4 485.7 32.2 84.4849 2720,4 1775.1 3,2 270.41997 0.b077 7.8 744.4 452.3 32.2 84.4649 2720.4 1053.2 3.2 270,4I 998 0 • 505'1 7. 8 7 44 • 4 42 1. 3199'1---0-:-5271----7:8---7~~:4--3'l2:3--32 • 2 84 • 4 8 ~ 9 ___ 27 2 Q.'I __ ~ _ 15 39. ~__32.284.4849 2720.4 1433.93 • ;>3.22 7 Q • 4270.42000 0.4'10'1 7,8744.4 365.4 32.2 84,4649 2720.4 1335,4 3,2 270,42001 0.4572 7.8 744.4 340.3 32.2 84.4849 2720.4 1243.7 3.2 270.42002 0.4258 7.8 744.4 310.9 32.2 b~.4849 2720.4 1158,2 3,2 270,42003 0.3905 7,8 744.4 295.1 32.2 84.4849 2720.4 1078.7 3,2 270.42 0 0 4 0 • 3 b 9 3 7 • 8 74 4 • 4 27 4 • 9 3 2 • 2 il 4 • 4 8 4 9 2 7 2 0 • 4 I Q 0 ~ , L _ ~ • 2 _______ nO. ~2CC5--0~343'1 7~8---7"4-;~---25b.0-----32;2--84;4849--2720~~---- 935.0 :1.2 270.4200b 0.3203 7.B 744.4 238.4 32.2 8~.4849 2720,4 .. 871,3 3,2 270.~2007 0.2983 7.8 744;4 222.0 32.2 84.4849 2720,4 BII.5 3.2 270,42008 0.2778 7.8 74~.4 206.8 32.2 84.484'1 2720.4 755,7 3.2 270,42009 0.2587 7.8 744;4 192.6 32.2 84.4849 2720,4 703.8 3.2 270.42010 0.2410 7.8 744.4 179.4 __ g,1 ___ ~!!.,~84? ____:._f}I9__'~ b55,5 __ ~!~ ___ ~ 279.li------------------- ------71io:~4 - --3071~:3--- 5077.4nII--'U"1($1000) ($1000)270,4 3353.4251.8 32511.'14~.b218.4 3017.1203,4 2809.9189.4 2010.'1176,~ 2437.2104.3 2209.8. ___ 1 ~ 3 • Q _ _? I I ~ , 'I142.5 19bEl.7132.7 1833,5123.0 1707..,115.1 1590.3107.2 1461.099.8---- ~-~93 : 01~79,LI 284 • 08b.b11'10.380.& 1114.275.1 1037.669.9 900.465.1 900.0---305 2:S ---~ I-~ b 2 : ~-2 0112090 3.255q 7.8PRESENT wORTH BENEFITSeI~~3,110133.532.2 84.5 2720.4 8855.939575.23.2 270.45947,7880. I3932.91215Q.253041,7CRf= _0.0738 AV ANN BENEfITS =748.02921.2290.33959.5--------------------------------------------------------------------CAPACITY VALUE= 95.43FUEL ENERGY VALUE (1980): bl.IOAvE ANNUAL POwER 8ENEFITS= 3959.5-- EMPLOYMENT BENEFITS= -182.0ANNUAL BENEFITS= 4141.5- ------- -A t, NU A C C O-S T S=3 2 34; 0 ------BIC RATIO: 1!28
ECUNOMIC EVALuATIO~ OF HYDRGPO~ER MODELALASKA DISTRICT, ~R"'Y CORPS OF EI.GI',E!:.RS___ ~,=L I SON HYDRO: l'o0tPRT I REV I SED APA I ~iO FulL ESC 18M"---------PRESENT TOTAL PRESENT ~ARKETABLE FlAM PRES. ~ORTH MARKET. VALUE OF PRESENTENEFlGY ENERGY _ SECO"liA~! _ SEC, wORTH TOTALBEN EF IT oS -b ui E F f T S fI, ERG Y BEN ERG Y SEC,E:itRGY bt:"U 1 T 5WORTH MARKETABLE VALUE OF WORTH Of ____ FIRM MILLS/KrtH-----yEAR --FACTOR --O:p""jCI T Y-CAPAC I fy- CAPAC IT Y ENE RGY--- r NC -0&1'1-------- -------- -------- -------- -.-.---. ------.- ----.-.- -------- -------- -------- -------- -------. --------,---- -~--. - -"-- - ( M w ) ( S 1 0 0 0 ) ( S -1 000 ) ( G w ~ ) ( ~ 1 0 0 0 ) ( 11 0 0 0 ) ( G ~ ,., ) ( $ 1 [I 0 0 ) ( S 1 0 0 0 ) ( 1 I 0 0 0 )1'1'10 1.0000 LB :H2.6 :'>62.6 32,2 6b,9200 _ 215~.8 2154,8 :'>.~ 21~.1 ZI~.1 2731.1>1 '1'1 I - --- 0 : '13 1 3 -----5 : 3 - 505 • 8 ~ 71 • 0 3 2 • 2 66 • '12 0 0 2 I 5 ~ • B 2006 • 8 :'> • 2 2 1 " • I I '1'1 • ~ 2 b 77 • :'>___-'I'--c:'1'12 0.8673 6.7 b3'1.~ ~.2!!.Lb ___ n.f ___ bb,'12QO ___ fl?!J..8 _____ 18~'1,9 ~,? 2)4.1 1~5,7 _2QQ9,31'193 0.B078 7.-8---7il~-:-~----601.3 32.2 06.'1200 215~.6 17~O.6- 3.2 21~.1 17:'>.0 251~.'11'1'14 0.7523 ?!~ ___ 7~4,~ ___ 5~Q.O ___ 32,2 __ 66,'1200 ____ 215~,8 ____ lb21.1 3,2 214.1 )bl.l (342,1I q q 5---0 :-" 00 b 7 • B 7 4 ~ • 4 5 2 I. 5 3 2 • 2 6 6 • '12 0 0 2 I 5 ~ • 8 15 0 'I • 7 3 • 2 2 1 4 • I 15 0 • 0 2 I 8 1 • 31'1'16 0.6?25 7.8 74~.4 485,7 32,266,'12002IS~,8 ____ 1~06.P 3.2 21~.1 13'1.7 2031.41'1'17 O.b077 -----7:a------7411.4-----452.:'> 32.2 66.'1200 2IS~.8 130'1.5 ~.2 2)~.1 130.1 15'1).'1_____ I_'1~_8 ___ 0..!..~~?~ 7. a 7411.4 421,332,2 66,9209 __?J.5~ ,8 121 'I.. 5 _~, , _____ 21 ~. '--__ \ 21.2 ___ 1 H2. Q ___1'1'1'1 0.5271 7;1i---74Li:Il---3Q2.3----32.2--bb.9200 21S ... 8---1-135.8--- 3.2 21~.1 112.'1 :~~I.O2000 0.4'10'1 7.a 74~.4 365.4 32.2 66.'1200 215~,8 1057,7 3,2 21Q,I 195,1 IS26.22001 0.4572 ---7:8 744:~ 340.3 32;2 66.9200 2IS~.8 985.1 3.2 214.1 Q7,9 1423.32002 0.4258 __ 7!8 7~4.4 316,'1 32.2 6b.'I200 215~,B '117,4 3.2 21~.1 9),Z 1325.52003 0.3965 7.8 7~~.~ 2'15.1 32.2 66.9200 2IS~.8 854.4 3.2 214.1 84.'1 12:'>4.52004 0.3693 7.8 74~. ~ ____ ~ 7 jj ,'I _____ 32L? __ ~t> .9_2 99 __ JI 5jj, ~ ___ 7'12, L 3, ~ ____~) ~ , l ____ J'! .. 1. ___ 11 ~5. 7 __----2-00S--0:"3u3'1 7.-8 744.~ 256.0 32.2 60.'1200 2154.8 741.1 3.2 21~.1 73.6 1070.72006 0._3203 _______ 7~8 __ 744,4 238,4_ 32,2 6b,9200 ____ 2154,8 ___ 690,2 3.2 21~,) i:>8,b __ '1'17.22007 0.2'183 7.8 744.4 222.0 32.2 60.'1200 2154.8 642.8 3.2 21Q.1 6:r,.'1 QU.72 0 0 B 0 • 2 7 7 8 7 • 8 7 4 4 • Q 2 C 6 • 8 3 2 • 2 b b , 'I 2 0 0 2 I 5 4 ,8 ~ ____ 5 'I 8 , b 3 • 2 2 I ~ , I 5'1 • 5 8 6 4 , 'I2 0 0 'I 0 • 2 5 8 7 ----- -- 7 : a - -- H 4 • 4 I '12 • 6 3 2 • 2 6 6 • 'I 2 0 0 2 I 54 • a 557. 5 3 • 2 2 1 4 • 1 55 • 4 8 0 5 • 52010 0.2410 7.8 744.4 I}"_.~ 32.2 6b, .. ?Q.0 ___ fJ.5...IlL8 51'1-'_2 _____},f__ ?!~.I _____ ~I.!> ____ I~Q.' __ _7710.4 24332.6 ~4'17,0 2418.1 34~61.17014,7;\P~?33,2 21~.1 0'17.1 10135.0471 I 'f 31}5,3 445'16,1---------~~----CRf= 0.0738 AV ANN BENEFITS = 748.0_ 23p,'1 no, Q 32'11,BCAPACITY VALuE= '15.113FuEL ENfRGY VALUE (Iqeo): 61.10AVE AN~U.L PO~ER BENEFITS: 32'11.8EMPLOYMENT BENEfITS= IB2.0AN~UAL BE~EFITS: 3473.8--ANNUACCOSTS=3234: 0 --------_______ ._______ B! ~ _ R. A T I 0.: I . 07- . ------- ----------.- - ----- --Ii- - .. -~--- -- ----- -- .. ----------"---------- ,
ECONOMIC EVALUATION OF HYDROPO~ER MODELA~.SKA DISTRICT, ARMY CORPS OF ENGINEERS__________ ALLISON HY[)RO: r./PRTI RETHERFORD, NEr.FuEL ESCI BMwn,........'-.J. ------- ---PRESENT TOTAL PRESENT MARKETABLE FIR",· PRES. \'IORTH "'AR~ET. VALUE OF PRESENT________ IIQRTtt "'AR~U!BL~_~~LUE_ClE__"'O~TH Qf_JI R':1 ___ MI~LS/K",H __ ~r!~RG't ___ P~ERGY __ s~CONDA~L _ SEC, ____ "'QRTH __ TOr A~YEAR FACTOR CAPACITY CAPACITY CAPACITY ENERGY INC. OtM BENEFITS BENEFITS E~fRGY BENlkGY SEC. E~£RGY BENlF11S------.- ---.---- ------.- -------- -------- -------- --.-.--- ----.--- -------- ------.- -------- .------- .------------ --------- --------(Mwf- -1S1000) (51000) (GwHJ 01000) (~1000J (GrIH) (11000) (1000) (11000)1990 1.0000 ______ 0~0 ______ 0,0 _______ 0.Q_ 0,0 B~,~81
Eco~o~rc EVALUllrO~ OF HYDROPO~ER ~ODELALASKA DISTRICT, ARMY CORPS OF E~GINEERSPRESENT------ TOTAL-PRESENT MARKETABLE FIR~ PRES. I'oORTH ~AfiKET. VALUE OF PRESENTlIOR TH~J5E.T A BL~ __ ValUE _Qf _IIj:lR Tt:1_QE __ El f!M __ ~! L qt~\'I~_~NE RG! ___ ~ NE;RG L_g C Or,O A ~ L __ ~E ~._ _ _~:OR T rt T QT ~b.----YEA-R--(A-CTOR CAPACITY CAPACITY-CAPACITY ENERGY INC. 0&'" BE~,EFITS BENEFITS EI.ERGY BUiERGY SEC. EI,ERGY bE~EFITS- - - - _.(Mr.) (SIOOO) (1000) ((OWH) (11000) (11000) (GI'tH) (SIOOO) (SIOOO) ($1000)1990 1.0000_0,0 0.0_ 0,0_ 0,0 ~4,~8Lj9 ____ O.Q __ 0.0 0.0 0.0 0.0 0.019Q"i--6:CnI3 0.0 0.0 0.0 0.0 84.4849 0.0 0.0 0.0 0.0 0.0 0.0___ 19q2~~~73Q .... Q 9_.0 _____ 2_.0 , ... 8 __!l1l. 4 8~'1 ___ 230. Q ___ Z05.2 ______ 0. 0.. _______ 0. L ____ O .Q ______ 20~. 2 _____ _1993 0.8078 0.0 0.0 0.0 8.Q 84.4849 709.7 573.3 0.0 0.0 0.0 573.~_____ 1994 __ 0.7~2~ ____ I.L ____ 195.0 _____ 79.0 _14.3 __ 84.484'1 ___ 1208.1 _____ 908.9 0.0 0.0 ______ 0.0 967.E1995 0.7006 3.0 28b.3 200.6 20.b 84.4849 1740.4 1219.4 0.0 0.0 0.0 1414.9____ 1996 ___ 0,b525 _____ 4,9__ 4b7.6 305.1 27,3 _ 84.4849 __ 2306.41505.0 0.0 0.0 __ 0.0 1810.11997 0.b077 6.7 639.4 388.5 32.2 84.4849 2720.4 Ib53.2 0.0 0.0 0.0 2041.7___ 1998 0.5659 ?... 8 ___ 7.~~L_4 ____ 42 L.3 ____ ~2.~ __ 8~ ,~~~~__ U10.E ___ t5~9 ... L_ 0.0 _____ O. 0 ____ 9 ... Q __ 19~Q. 'L____ _19qq---O~-527i 7.8 7~Q.4 392.3 32,2 84.4849 2720.4 1433.9 0.0 0.0 0.0 182b.22000 0 • 4909 _ ____ _ 7. 8 _ 7 /J 4 , lj 3 b 5 ,4 _____ 32.2 84 , 4 e 4 '1 _ 2720 • 4 13 3 5. /j 3.2 nO. 4 I ~ 2.7 1 8.> 3.52 0 0 1 -- -- 0: ~ 5 72 7. 8 7 4 4 • 4 3 4 0 • 3 3 2 • 2 8 4 • 4 8 4 9 2 7 2 0 , 4 1 2 4 3 • 7 3 • 2 2 7 0 • 4 I 2 3. b I 7 0 7 • 5n 2002 0.~258 7.8 744,4 31b.9 _____ 32,2 ___ 84.4849 2720.4 1158.2 3,2 270.4 115.1 1590.3~ 2003 0;3965 7.8 744.4 295.1 32.2 84.4849 2720.4 1078.7 3.2 270.4 107.2 1481.0(X) 2004 0.3693 ? .!..~___ 7_4~ ,-~___ 2 71J.! 9 ____?2_.?__ ~!l,.484_9 __?U9 ,"-__ 19 Olj .. b___ _ _ ~.? ___ ?1 Q l~ _____ ~'!. ~ ___ 1 E9. L ____ _---2-6-05--6:-3 ilj q 7.8 744.4 25b.0 32.2 84.4849 2720.4 935.b 3.2 270.4 93.0 1284.62006 0.3203 __ ~_7,B _744,4 236,4 ____ 32.2 __ B4,4Bq9 ___ ._2720,~ ____ 871.3 3,2 nO,
ECONO~IC EVALUATION OF HYDROPOwER MODELALA9KA DIS1RICT, AR~Y CORPS OF E~GI~[ERS-- --- _._----------PR-E 9 ENT ----- TOTAL PRE S£ NT--",.A RKE T ABL E FIR'" PRE 9. ",ORT H ~A R KET • VALUE UF PRESENTWORTH ~ARKETABLE VALUE OF wORTH OF FIRM MILLS/K",H EN~R~L ____ EfiERGt SECQrIDA~rYEAR--F AC T OR--CAPAcITY-CAPAC 1 TY-C APAC J T Y-Ei;"E:RGY-INC~--O&-M--BENEF ITS 8EN£F ITS E r.ERG Y~E~. ______ ~QRTH TQTAl,.B[NEkGY SEC. E~ERGY B[~~FITS---------------------------------(MW5---(SI000) (SIOOO). . - --------_.-(GwH)_.(SIOOO) (SIOOO) (GI'lH)- - - - -- - - _.(SI000) (SIOOO) (SI000)1990 1. 0000 O. 0 0, Q ________ 0 , 0 _____ 0, Q ____ ~ 6.9200 __ ____ _0, 0 _____ 0 .9 _ 0 , 0 0 , Q ____ o. Q 0 • 0----lqq1- -O:-QJ13 0:0---- 0,0 0.0 0,0 b6.'1200 0,0 0,0 0,0 0,0 0.0 0.0___---'1992 O. S6B 0.0 9. 0 o!o_ 2~_8 __ ~~,~20_9 ___ ~].~ ___ I!?g, ~___ 0, o ________ n. Q ____ Q. Q _____ I ~~.~1993--6-:eo-78 0.0 0.0 0.0 8.4 66.9200 562.1 45~.1 0.0 0,0 0.0 ~5~.1_____ 1994 ____ 0,7523 10I ___ J05,O _______ 19,0 ____!4.}__ ~i:1.9?OQ _____ 9S7.O" __ 719,9 0,0 _ 0,0 0.0 798.91995 0.7006 3.0 286.3 200.6 20.6 66.9200 1378.6 ~65.o 0.0 0.0 0.0 116b.41996 0.6525 4.9 467.6 305,1 ___ 27.3. _____ 66.920Q ____ 1826,9 1192,1 0,0 O.Q 0,0 )497.(1997 ---0:6077 ----1;,:7--- 639.~ 38e.5 32.2 66.9200 2154.8 1309.5 0.0 0.0 0.0 1690.01998 O. 5659 1.!.S ___ 74.~!4 ~ ?J_,J ___ n-,-? __6..t!L~?Q.Q. __ 2J2.!:1_,_~ __!'?J9.~_______ Q, 9 ___ 0, L ___ Q .. 9 ___ 1 Q~9, ~ _____ _---1-999---0--:-5271 7.8 744.4 392.3 32.2 66.9200 2154.8 1135.8 0.0 0.0 0.0 1528.12000 0.4909 7.8 744.4 365.4 32.2 66.9200 - 2154.e 1057,7 3.2 ?14,1 !05,1 _1528,22001 0~4572--------7.8 744.4 340:3 32:2--- 66:9200 ----2154.0 985.1 3:2 21~.1 97.9 1423.32002 0 • 4258 _________ 7.8 744 .4 31 6. 9 32.2 66.9200 ___ 21 54 • 8 ___ 9 17 , 4 3 • 2 21 4 • 1 91 .2 1325 , ';2003 0.39b5 7.8 744.4 295.1 32.2 6b.9200 2154.8 854.4 3.2 214.1 84.9 1234.5____ 29_0tl O. 3~J3 7_L8 ___ 7_~~....'I. __?? ~-,-9 32. 2 6~-,-~?9_0 __ f L~'!.L.§ ___ 7'!~ ..] ________ J.f _______ f!~. ! ____ 1~. L __ J 1 ,,~.]____ _2005 0.3439 7.8 744.4 256.0 32.2 66.9200 2154.8 7 Ul.1 3.2 214.1 73.6 1070.72006 0.3203 7.8 _ 744.4 __ 238.4 _____ 32,2 ____ 66.9200 __ 2154.8 ___ ~_90.2 __ 3.? 2!~. 1 _____ 6§.~ 997.?--2007 --0: 2 q 8 3---7: 8 ---- -'7 4 ~ : 4 -- 222. 0 32.2 b 6. 92 0 0 2154 • 8 642.8 3 • 2 2 1 4 • 1 63.9 926 • 72008 0.2778 7.8. 7~4.4206.8 _32!2~_66.9290 __ 2154,8 ___ 598,6__ 3,2 214,1 ________ 59,5 _tl64,9-----2009--0":2587 7:8~------7~":4---1'12:b--- 32.2 66.Q200 21S~.8 557.5 3.2 21i.i.l 55,4 605.52010 0.2QIO 7.8 7~~.4 179.4 32.2 bb.9200 2154.8 519.2 .3.2 211l.1 5h~ ____ 7~Q_.? ____IIb74.6 - 15~fI6-:-9---------2355-:-6 830.821024.332.2bb.9 21511.8 70111.7?25D.7 _.3.2 21 Q • 1_?5~9. 7b97.1__ 1 ~ ~ 7. 9 _10135.031159,3CRF= _____ 0.0738 AV ANN BENEFIT~ = 523. ~ __ _112. S2309,QCAPACITY VALUE: 95.43FUEL ENERGY VALUE- (i980)= bl.l0--------------AvE ANNUAL PO",ER BENEFITS= 2300.0EMPLOYMENT BENEFITS~ 182.0ANNUAL BENEFITS= 2~82.0--------------------------ANNUAC-fosis= 3234:0------------___________________________________ ~L~ __ RATIQ=_ 0.71--------------- - ------------------------
__ ECONOMIC: EVALUATION OF HYDROPOWER MODEL.ALASKA DISTRICT, ARMY CORPS OF ENGINEERS_____________ ~LLISON hYDRO: W/P~TI REVISED APAi '"E ... FUEL ESCI SOLOMON SECONlHIHI 8Mr/-- -----------PR-ESENT TOTAi-----PRE-SENT MARKETABLE FIR'" PRES. WORTH MARKET. VALUE OF PRESENTw_()R1H.~~TAB~~L\!E_g_F _~QBJIj Q_F __ U RIoI_~nl.~LI\\'!t1_~J,!~R~l ___ Ltj~BG)' __ ~~t;ONQA:fO,O ___ 15~'1,'1 0.0 9.Q. 0.0 .. 1901.01'1'17 0.b077 7.1 b77.b L111.7 22.4 109.3377 21.1~9.2 1488.3 0.0 0.0 0.0 1900.1___ 1 998 __ 9 !...~~~'1 7,8 7--,!.,! ____ L1 1J,.l. ~ ___ ~, .~_ll ~~ /J]§'~-Z5.!lL ___ 'L __ ..J_I.j~~.b __ . ___ 9~Q ______ 0. Q _____ Q.Q ___ HS9. 8 _____ _1'199 0.5271 7.8 744.4 392.3 22.4 117.7B47· 2b38.4 1390.6 0.0 0.0 0.0 17B2.92000 0.~q09 7.8 7~4./l 3b5,4 _ 32.2122,2b33 ___ .3 9 3b,9 ___ 1'l32.5 3,2 ~,!I,? 192,1 __ 21.189,92001 0:"572 7~8--- 744.4 340.3 32.2 126.9211 L108b.9 IBbB.3 3.2 ~Ob.1 185.7 239~.3(J-- 2002 O.4258 ____ .J,8_____ 7~L1.4 ____ 316.9 ___ 32.2 131.1651 ___ 1.1242.8 180Q.4 3.2 ~21.Q 179.5 2302.9I 2003 0.3965 7.8 7~~.L1 295.1 32.2 13c..802'1 L1405.1 171.1b.7 3.2 ~37.8 173.b 2215.~ lN 2QQ./l __ 0...l~93 7,8 H~-----" n_'!.~9 32. "_l't2, Q~?2 ___ 42.U.§ __ IQ.§'L_9 __ .___ ~ .f___ ~?'L. 5 ____ H>7. 9 __, UJ..~_. __ ia 2005- 0.3439 i.8 744.4--25b.0 32.2 1'17'-~'111 L17~'1.2 Ib33.3 3,2 /l72.0 Ib2.3 2051.b____ 200b __ 0! ;!203___ h~ ___ 74L1 •.E__ 238, 1l _____ 32, 2 _ 153, 15~0. __ l!9n. 7 __ 1 ~ 79. b_ 3. 2 ~ 90, J ___ 157,0 ____ 1975. °-I2007 0.2983 7.8 744.4 222.0 32.2 159.0515 5121.5 1527.7 3.2 509.0 151.8 l'IOI.b2008 0.2778 7.8 741l./l 20b.8 32.2 IbS.IB07 5318.B 1~77.6 3,2 528.b \/lb.8 1831 t2 I2009--6-:2587 7;8--744;4--- 192:b 32.2 171:5552 552/l-:1---142'1~2- -3.2 549:0 - --142:0 ·~·i7b3.8 I2010 0.2/l10 7.8 74L1.4 179.4 32.2 178.IBLlb 5737.5 1382.5 3.2570.2 137.4.1699."56,:8:7 --- - 31 bbS-.-2-------S230.1 1791:-1 -~f8480:0-·------------------_.__ 1CRFz: 0~Q!3~ AV ANN BENEFITS =3-2--:2---178.2 5737.5 18b77,6___________________________ ~O~/l~! L____ __ _ _ __ ~ 7 1 ~. ~ _:3 • 2 0:))0--:2--1 B 5 b • 2--2 2-Q-S 7 • 1___ ~ 8 0 9 • :3 ___ ~ ~ 52.2 ___ ~.I 437. L2b~. ~ . __ ~53~, 9·11--j-----------------------------------------------CAPACITY VALU~= G5.43- - - -" ------ -- --. FUEL ENERGY· VALUE (1980): b 1.1 0AVE ANNUAL POWER BENEFITS= 453~.9.--------.----... ~----- --...EMPLOYMENT BENEFITS: 182.0ANNUAL BENEFITS: 471b.9ANNUAL-COS T 5-=-32 34: 0_~I ~RAT I Q =_ _ I. 4 b-----1
APPENDI X DPROJECT DESCRIPTION AND COST ESTIMATES
ALL ISON CREEKPERTINENT OAT A(Alternate Plan No.1)RESERVOIRWater Surface Elevation, feet MSLMaximumAverageMinimumSurface Area at Maximum Elevation, acresUsable Storage, acre-feetHYDROLOGYDrainage Area, square milesAnnual Runoff, cfsAverageMaximumMinimumLAKE TAPLake Entry Invert Elevation, feet MSLSpilhvayPOWER TUNNELTunnel Size, feetTunnel Length, feetTunnel Grade, percentPENSTOCKTypeLength, feetDiameter, inchesShell Thickness, inchesMaximumMinimumSupport Spaci~g, feetType1,3671 ,3351 ,26725819,9805.74968361 ,250Natural Outfall6 (lined circular)8 (unlined horseshoe)10,2000.5Steel, ASTM A537 Grade A4,050481.500.7540concrete PierPOWERPLANTNumher 0 f Un itsTurbine TypeInstalled Capacity, kWPlant Factor, (average) percentPlant Factor, (firm) percentDesign Head, feetGenerator Rating, kW<strong>Power</strong> Factor, percentVoltage, kV2Impulse8,00056. 148.91,2204,3509013.8
POWERHOUSETypeTRANSMISSION LINEVoltage, kVTypeLength, mi lesConductorTransmission Losses, percentPROJECT OUTPUTDependable Capacity, kWFirm Annual Energy, MWHAverage Annual Energy, MWHPERTINENT DATA (Cont)Steel Structure on Concrete Fou~dation115Wood Pole3#1/0 ACSR28,00034,30039,350i i
ALLI SON CREE KPERT! NENT OAT A(Alternate Plan No.2)RESERVOIRWater Surface Elevation, feet MSLMaximumAverageMi n imumSurface Area at Maximum Elevation, acresUsable Storage, acre-feetHYDROLOGYDrainage Area, square milesAnnual Runoff, cfsAveraqeMaximumMinimumLAKE TAPLake Entry Tnvert Elevation. feet MSLSpi llwayPOWER TUNNELTunnel Size, feetTunnel Length, feetTunnel Grade, percentPENSTOCKTypeLength. feetDiameter, inchesShell Thickness, inchesMaximumMinimumSupport Spacing, feetTypePOWERPLANTNumb e r 0 fUn itsTurbine TypeInstalled Capacity, kWPlant Factor, (average) percentPlant Factor, (firm) perce~tDesign Head, feetGenerator Rating, kW<strong>Power</strong> Factor, percentVoltage, kV1 ,3671,3351 ,26725819,9805.74968361, ?50Natural Outfall6 (lined circular)8 (unlined horseshoe)10,2000.5Steel, ASTM A537 Grade A2,450481.500.7540Concrete Pier2Impulse8,00053.245.91, 1704,3509013.8iii
POWERHOUSETypeTRANSMISSION LINEVoltage, kVTypeLength, mi lesConductorTransmission Losses, percentPROJECT OUTPUTDepennableCapacity, kWFirm Annual Energy. MWHAverage Annual Energy, MWHPERTINENT DATA (Cont)Steel Structure on Concrete Foundation115Wood Pole3.5111/0 ACSR28,00032,20037,250iv
SECTION DPROJECT DESCRIPTION AND COST ESTIMATESTABLE OF CONTENTSItemGENERALWATERWAYSLake Tap <strong>and</strong> Rock Trap<strong>Power</strong> Tunne 1In take Tr ashrackGate Control RoomAccess Ad itPenstockPOWERPLANTTRANSMISSION SYSTEMBUILDINGS, GROUNDS, AND UTILTTIESCOST ESTIMATESNumfJerLIST OF TABLESTitlePageD-lD -1D-5D-6D-7D-7DlD2D3D4Summary Cost Estimate, Alternate <strong>Power</strong>house Site No.1Summary Cost Estimate. Alternate <strong>Power</strong>house Site No.2Detailed Cost Estimate, Alternate <strong>Power</strong>house Site No.1Detailed Cost Estimate, Alternate <strong>Power</strong>house Site No.2D-8D-9D-10D-14NumberD-A-1D-A-2D-A-3D-A-4D-A-5D-A-fiL 1ST OF PLATESTit leSite Plan, Location <strong>and</strong> Vicinity MapsPhoto MosaicTopographic P1 anWaterways ProfilesLake Tap <strong>and</strong> Rock Trap Detai lsGate Structure, <strong>Power</strong>plant, <strong>Power</strong> Tunnel Sections<strong>and</strong> PortalD-18D -19D-20D-21D-22D-23v
VALDEZ HYDROELECTRIC POWER PROJECTGENERALA lake tap scheme <strong>for</strong> lake entry at Allison Lake was studied. Twosites near <strong>the</strong> lower outlet of Allison Creek were considered <strong>for</strong> <strong>the</strong>location of <strong>the</strong> powerp1ant. The first alternate site <strong>for</strong> <strong>the</strong> powerplantis located approximately 200 feet uphill from <strong>the</strong> mouth of Allison Creekat elevation 20 feet MSL <strong>and</strong> <strong>the</strong> second alternate site is located about2000 feet from <strong>the</strong> bay of <strong>the</strong> Port of <strong>Valdez</strong> at elevation 100 feet MSL.Access to both powerplant sites during construction <strong>and</strong> operation wouldbe by road. Access to <strong>the</strong> tunnel portal <strong>and</strong> o<strong>the</strong>r work areas would be byhelicopter. The first alternate powerplant site would require a waterpump system to pump adequate water back to <strong>the</strong> main creek channel aboveAlyes~a's weir to provide <strong>for</strong> <strong>the</strong>ir water supply <strong>and</strong> fishery waterrequirements. After economic evaluations it was determined that <strong>the</strong>lower powerhouse site, Alternative 1, could not be incrementallyjustified <strong>for</strong> <strong>the</strong> additional energy it would provide. However, bothalternatives are presented here.WATERWAYSThe method of lai
<strong>Power</strong> Tunne 1The power tunnel would be partially concrete lined 6-foot circular<strong>and</strong> oartially unlined 8-foot horseshoe shaped tunnel approximately 10,200feet lonq, from <strong>the</strong> lake tap chamber to <strong>the</strong> tunnel portal. About 100feet downstream of <strong>the</strong> gate structure, <strong>the</strong> power tunnel would drop at a45-deqree angle to elevation 1,050 <strong>and</strong> would continue down at 0.5 percentslope until it would daylight at elevation 1,000 at <strong>the</strong> tunnel portal.ApproximatAly 300 feet from <strong>the</strong> tunnel portal, a transition from a powertunnel to a steel penstock would occur.Intake TrashrackThe power tunnel entrance would be covered by a steel trashrack toprevent debris from entering <strong>the</strong> intake <strong>and</strong> reaching <strong>the</strong> turbines. Thetrashrack would be placed partially in <strong>the</strong> wet after <strong>the</strong> lake is drawndown through <strong>the</strong> power tunnel <strong>and</strong> aboveground penstock during <strong>the</strong> lowinflmv period.Gate Control RoomThe gate control room would consist of a hoist machinery room, avertical access shaft <strong>and</strong> a gate room. The hoist machinery room, locatedat elevation 1,456, would house a crane rail hoist <strong>and</strong> an elevator. Thevertical access shaft, which is approximately 200 feet long <strong>and</strong> 16 feethigh by 16 feet wide. would have a ladder from <strong>the</strong> hoist room to <strong>the</strong> gateroom. The elevator shaft would be adjacent to <strong>the</strong> access shaft <strong>and</strong> <strong>the</strong>elevator would be an overhead hoist cable operated system. The gate roomwould contain two 6 by 16 feet slide gates, one heavy duty <strong>and</strong> onest<strong>and</strong>ard type, set in t<strong>and</strong>em. There would be a crane rail hoist at <strong>the</strong>gate room above <strong>the</strong> heavy gate <strong>for</strong> lifting <strong>and</strong> shifting <strong>the</strong> gate to <strong>the</strong>area below <strong>the</strong> upper hoist during maintenance. An access hatch <strong>and</strong> avent would be provided at <strong>the</strong> gate room floor. The 18-inch diameter ventpipe would run from <strong>the</strong> power tunnel to <strong>the</strong> gate room <strong>and</strong> up through <strong>the</strong>vertical access shaft, to <strong>the</strong> hoist machinery room <strong>the</strong>n finally outthrough <strong>the</strong> access adit.Access AditAccess to <strong>the</strong> gate control room would be through <strong>the</strong> access adit.The adit would be an 8-foot diameter horseshoe shaped tunnel, approximately100 feet in length <strong>and</strong> located at elevation 1,456. A 100- by100-foot staging area <strong>and</strong> heliport would be cleared adjacent to <strong>the</strong>access adit portal.PenstockThe penstock would be a 48-inch diameter, all welded structuresupported on concrete piers at approximately 40 feet on centers. Thesteel penstock would emerge from <strong>the</strong> power tunnel portal <strong>and</strong> wouldcontinue downstream to <strong>the</strong> aboveground powerhouse following <strong>the</strong> existingground contours. At alternate powerhouse Site No.1, <strong>the</strong> penstock wouldbifurcate into two penstocks immediately upstream of <strong>the</strong> powerhouse valveroom. Each penstock would connect with a valve in <strong>the</strong> valve room, <strong>and</strong>downstream of each valve, a penstock extension would connect to a0-2
turbine. The penstock would bifurcate into two penstocks immediatelyupstream of <strong>the</strong> Alternate No.2 powerhouse valve room. Each penstockwould connect to a turbine. Some of <strong>the</strong> water discharged from <strong>the</strong>turbines would be diverted into <strong>the</strong> existing weir on <strong>the</strong> creek <strong>for</strong>A1yeska's water supply <strong>and</strong> <strong>for</strong> <strong>the</strong> Department of Fish <strong>and</strong> Game salmonhatchery f ac i 1 it i es.pm~ERPLAN TTwo alternative sites of <strong>the</strong> aboveground powerhouse would be locatednear <strong>the</strong> channel of <strong>the</strong> Allison Creek. The centerline of <strong>the</strong> bifurcationwould be at <strong>the</strong> same elevation as <strong>the</strong> powerp1ant. The powerhouse wouldcontain two synchronous generators driven by Pelton wheel turbines withdesign heads of 1,220 feet <strong>for</strong> <strong>the</strong> alternate Site No.1 <strong>and</strong> 1,170 feet<strong>for</strong> <strong>the</strong> alternate Site No.2. The turbines would have nameplate ratingsof 4.0 MW each. The powerhouse structure would house <strong>the</strong> generators,turbines, a 15-ton bridge crane, <strong>and</strong> all o<strong>the</strong>r equipment required <strong>for</strong>operation <strong>and</strong> maintenance. Remote control of <strong>the</strong> powerp1ant would befrom <strong>Valdez</strong> accomplished through <strong>the</strong> use of a carrier communicationsystem. The tailraces of <strong>the</strong> alternate powerhouse No.2 are longer inlength than that of <strong>the</strong> alternate powerhouse No.1. On both alternatives,stoplogs would be installed near <strong>the</strong> upstream end of <strong>the</strong> tailracepipes to regulate flow during <strong>the</strong> summer <strong>and</strong> winter operations. Energydissipators at <strong>the</strong> Allison Creek end of <strong>the</strong> tailraces would be ofconcrete construction.TRANSMISSION SYSTEMThe <strong>Valdez</strong> project power would be delivered to Solomon Gulch substation<strong>and</strong> <strong>the</strong>n transmitted over <strong>the</strong> <strong>Copper</strong> Valley Electric Associationsystem <strong>for</strong> distribution. The transmission line route was located in <strong>the</strong>field based on aerial <strong>and</strong> map reconnaissance. The route runs along <strong>the</strong>south side of <strong>the</strong> existinq road Qetween Allison Creek <strong>and</strong> Solomon Gulch.The terrain is of a moderate ro11inq mountains <strong>and</strong> close to tidewater of<strong>the</strong> Port of <strong>Valdez</strong>.The project installed capacity is 8.0 MW <strong>and</strong> <strong>the</strong> transmission systemcapacity would be 10 MVA. The transmission line from Allison Creekpowerp1ant to Solomon Gulch sUbstation would be a 115 kV line. Therewould be approximately 3.0 miles of single wood pole construction. Theoverhead conductors would be #1/0 ACSR with no overhead ground wires.The 115 kV system was chosen <strong>for</strong> power transmission to match existingfacilities. Vo1taqe regulation from Allison Creek powerplant to SolomonGulch substation is 2.5 percent <strong>and</strong> is acceptable. An addition to <strong>the</strong>Solomon Gulch sUbstation is proposed to provide switching <strong>and</strong> powerenerqy to <strong>the</strong> existing system. An oil filled circuit breaker would beremotely controlled from <strong>Valdez</strong> via a carrier communication system.The proposed right-of-way would be a 50-foot wide corridor <strong>and</strong> wouldrun over l<strong>and</strong>s administered by <strong>the</strong> U.S. Forest Service. Based on USGSmaps with vegetation overprint, <strong>the</strong> entire line would require essentiallycontinuous clearing. Small shrubs <strong>and</strong> bushes would remain <strong>and</strong> all o<strong>the</strong>rmaterials would be burned, chipped or left in place as determined by <strong>the</strong>D-3
U.S. Forest Service when <strong>the</strong> line location is established. Construction<strong>and</strong> maintenance of <strong>the</strong> transmission 1 ine would be by road <strong>and</strong> helicopter.A cleared 10-foot wide hiking trail would be provided <strong>for</strong> inspectionaccess.The transmission 1 ine would be approximately 0.5 mile longer <strong>for</strong> <strong>the</strong>alternate powerhouse No.2 but <strong>the</strong> terrain is of similar characteristicthroughout <strong>the</strong> transmission line.BUILDINGS, GROUNDS, AND UTILITIESNo permanent housing <strong>and</strong> maintenance facilities would be requiredexcept <strong>for</strong> a small warehouse <strong>for</strong> maintenance equipment <strong>and</strong> supplystorage. Existing dirt roads would be used as necessary duringconstruction <strong>and</strong> operation of <strong>the</strong> project. No sewer <strong>and</strong> water systemswould be required except those in <strong>the</strong> powerhouse.COST ESTIMATESAll estimates are based on October 1980 price levels. Thecontingency used <strong>for</strong> all alternatives was 20 percent. Engineering <strong>and</strong>Design, <strong>and</strong> Supervision <strong>and</strong> Administration costs are each 8 percent ofconstruction costs. The cost data was obtained from bid prices on recentmajor power projects in <strong>the</strong> Pacific Northwest <strong>and</strong> Alaska, <strong>and</strong> adjusted toreflect current price levels, Alaska labor costs, <strong>and</strong> transportationcosts to <strong>the</strong> sites. T~e construction time was estimated to take 4 years<strong>and</strong> power-on-line would be 1988 or 1990.D-4
TABLE D-lSUMMARY COST ESTIMATEOCTOBER 1980 PRICE LEVELVALDEZ HYDROELECTRIC PROJECTALTERNATE POWERHOUSE SITE NO.1AccountNumber010407193031ItemMOBILIZATION AND PREPARATORY WORKLANDS AND DAMAGESINTAKE WORKS AND PENSTOCKPOWERPLANT<strong>Power</strong>houseTurbines <strong>and</strong> GeneratorsAccessory <strong>Electrical</strong> <strong>and</strong> <strong>Power</strong>plant EquipmentTailraceSwitchyardTransmission FacilitiesBUILDINGS, GROlJNDS, AND UTILITIESSUBTOTAL20% CONTINGENCIESCONTRACT COSTENGBIEE~INGAND DESIGNSUPERVISION AND ADMINISTRATIONTOTAL PROJECT COSTFeatureCost( ~ 1 ,000 )1 ,56070020, 07 44,00927026,6135,32331 ,9352,5552,75937,2500-5
TABLE D-2SUMMARY COST ESTIMATEOCTOBER 1980 PRICE LEVELVALDEZ HYDROELECTRIC PROJECTALTERNATE POWERHOUSE SITE NO.2AccountNumber010407193031ItemMOBILIZATION AND PREPARATORY WORKLANDS AND DAMAGESINTAKE WORKS AND PENSTOCKPOWERPLANT<strong>Power</strong>houseTurbines <strong>and</strong> GeneratorsAccessory <strong>Electrical</strong> <strong>and</strong> <strong>Power</strong>p 1 an t Equ i pmen tTailraceSwitchyardTransmission FacilitiesBUILDINGS, GROUNDS, AND UTILITIESSUBTOTAL20% CONTINGENCIESCONTRACT COSTENGINEERING AND DESIGNSUPERVISION AND ADMINISTRATIONTOTAL PROJECT COSTFeatureCost( ~1 ,000)1,34072417,5634,62925024,5064,90129,4072,3532,54134,301D-6
TABLE 0-3DETAILED COST ESTIMATEVALDEZ HYDROELECTRIC PROJECTALTERNATE POWERHOUSE SITE NO.1Cost Unit Tota 1Account Cost CostNumber Description or Item Unit Quant i ty ilL ($1 ,000)r~OB AND PREP WORK LS 1 ,560,000 1,56001 LANDS AND DAMAGESGovernment Admin Cost LS 400,000 400<strong>Power</strong>house <strong>and</strong> Trans- LS 300,000 300mission Facilities(Private L<strong>and</strong>s)--TOTAL - LAND AND DAMAGES 70004 I NTAKE WORKS AND PENSTOCK04. 1 LAKE TAP AND ROCK TRAPExcavation CY 350 75 26.2roncrete CY 30 600 18Rein<strong>for</strong>cement LB 3,000 0.75 2.2Trashrack LB 30,000 2 60Rock Bolts, 1"x7' EA 25 210 5.2Lake Tap LS 1 420,000 420TOTAL - LAKE TAP AND ROCK TRAP 531 .604.2 GATE CONTROL ROOMSl ide Gate, heavy duty LB 10,000 5 50Slide Gate, std. type LB 6,000 5 30Access Ha tch LS 1 1 ,500 1.5Ladder (w/cage) 200' LS 1 3,000 3Hydraulic Unit &E 1 e v a to r, 1,000 # cap LS 1 60,000 60Vent, 8" 0 pipe LF 300 40 12Ho i s t , 1 0 -ton cap. EA 2 30,000 60Excavation, Rock CY 2,790 250 697.5Concrete Lining CY 754 700 527.8Rein<strong>for</strong>cement LB 37,700 1 37.7Rock Bolte;, 1" 0 x 7' EA 350 250 87.5TOTAL - GATE CONTROL ROOM 1,5670-7
TABLE 0-3 (cont)CostAccountNumber Description or Item Un it Quant ity04.3 ACCESS ADIT AND STAG1NG AREAExcavationRockCYCommonCYConcreteCYRein<strong>for</strong>cementLBExcavation (Adit) rock CYRockbolts, 1" x 10' EA04.5TOTAL - ACCESS AOITPOWER TUNNELTunnel Excavation (Rock) CYConcrete LiningCYRein<strong>for</strong>cementLBRock Bolts, l"xlO'EAPortal (Including SecondaryRock Trap, Transition, StagingArea <strong>and</strong> Haul Road)Rock ExcavationOverburdenConcreteRein<strong>for</strong>cementRock Bolts, 1"x14'.Roc k Bo lt s, 1" x 7 'Rails <strong>and</strong> Track~TrestleTOTAL - POWER TUNNEL04.5 PENSTOCKSteel, 48"0Ring Stiffeners, Exp.Anchors, Anchor SupportsConcrete Support PiersConcrete Anchor Block~TOTAL - PENSTOCK07 POWERPLANTCYCYCYLBEAE A. LfLS3, 1801,360954,800.21513021,7634,889244,4508,33817,014150,009 .17211, 100901308001LB 1,976,600LB 138,362CY 296. CY 25Uri itCostilL75156000.752003002256000.7521030107000.7546027550100,0002.503300300Tota 1·Cost($1,000)238.520.4573.64339401.54,896.72,933.4183.31,751.0510.41,500. 1120.48.341 .435.74010012,120.74,941.5.415. 188.87.55,452.907. 1 POWERHOUSEMobilization & PreparatoryWorkExcavation <strong>and</strong> ConcreteLSLS120,000230,0001202300-8
TABLE D- 3 (cont)Cost Unit Tota 1Account Cos t CostNumber Description or Item Unit Quantity ilL (~1,000)07. 1 POWERHOUSE (cont)Building Superstructure LS 1 72,000 72Misc. Building Item LS 1 97,000 97Bifurcation & LS 1 36,000 36Branch PipeValves EA 2 145,000 290TOTAL - POWERHOUSEB4507.2 TURBINES AND GENERATORSTurbines, Governor & EA 2 30B,500 617Coolinq SystemGenerators & Excitation EA 2 600,000 1,200Equipment--TOTAL - TURBINES AND GENERATORS 1,B1707.3 ACCESSORY ELECTRICAL EQUIPMENTSwitchgear, Breaker & LS 211,000 211Busses & StationService UnitSupervisory Control LS 317,000 317SystemMisc. <strong>Electrical</strong> System LS 36,000 36TOTAL - ACCESSORY ELECTRICAL EQUIPMENT 56407.4 AUXILLARY SYSTEMS AND EQUIPMENTHeating & Ventilating LS 7,000 7Eq u i pment Br i dge Cr ane LS 120,000 120& Misc. MechanicalSystems--TOTAL - AUXILLARY SYSTEMS AND EQUIPMENT 12707.5 SvJI TCHYARD<strong>Power</strong> Trans<strong>for</strong>mer LS 222,000 222Disconnects & <strong>Electrical</strong> LS lB,OOO lBEqu i pmentTOTAL - SWITCHYARD 2400-9
TABLE 0-3 (cont)Cost Un it TotalAccount Cost CostNumber Description or Item Unit Qu ant i ty ilL ($1,000 )07.6 TAILRACE CHANNELOverburden Excavation CY 48 10 0.5Rock Excavation CY 20 25 0.5Concrete CY 38 300 11.4Rein<strong>for</strong>cement LB 1,900 0.75 1.4R i prap CY 30 30 0.9Steel Pipe LB 40,040 2.25 90. 1Misc. Steel LB 4,004 2.50 10Stop1ogs EA 2 7,000 14TOTAL - TAILRACE CHANNEL 128.807.7 TRANSMISSION LINE(WITH INSPECTION ACCESS TRAIL)Clearing AC 37 2,500 92.5Line Conductors & MILE 3 65,000 195Single Wood PoleStructures (55 pcs)TOTAL - TRANSMISSION LINE 287.519 BUILDINGS, GROUNDS, AND UTILITIESMaintenance Equipment& SupplyStorage Warehouse LS 250,000 250Water Supply System &Fish FacilitiesWater Pump System LS 20,000 20TOTAL - BUILDINGS, GROUNDS, AND UTILITIES 270SUBTOTAL - CONSTRUCTION COSTS 26,61320% CONTINGENCIES 5,323TOTAL - CONTRACT COSTS 31,93630 ENGINEERING AND DESIGN (8%) 2,55531 SUPERVISION AND ADMINISTRATION (8% ) 2,759TOTAL - PROJECT COST 37,250 .0-10
TABL E D-4DETAILED COST ESTIMATEVALDEZ HYDROELECTRIC PROJECTALTERNATE POWERHOUSE SITE NO.2Cost Unit Tota 1Account Cost CostNumber Description or Item Unit Quant ity ilL ( $1 ,000)MOB AND PREP WORK LS 1 ,340,000 1,34001 LANDS AND DAMAGESGovernment Admin Cost LS 1 400,000 400<strong>Power</strong>house <strong>and</strong> Trans- LS 1 324,000 324mission Facilities(Private L<strong>and</strong>s)--TOTAL - LAND AND DAMAGES 72404 I NTAKE WORKS AND PENSTOCK04. 1 LAKE TAP AND ROCK TRAPt::xcavation CY 350 75 26.2Concret e CY 30 600 18Rein<strong>for</strong>cement LB 3,000 0.75 2.2Trashrack LB 30,000 2 60Rock Bolts, 1"x7' EA 25 210 5.2Lake Tap LS 1 420,000 420TOTAL - LAKE TAP AND ROCK TRAP 531.604.2 GATE CONTROL ROOMSl ide Gate, heavy duty LB 10,000 5 50Slide Gate, std. type LB 6,000 5 30Access Hatch LS 1 1 ,500 1.5Ladder (w/cage) 200' LS 1 3,000 3Hydraulic Unit &E1 evator, 1,000# cap LS 1 60,000 60Vent, 8" 0 pipe LF 300 40 12Ho is t, 10 -ton cap. EA 2 30,000 60Excavation, Rock CY 2,790 250 697.5Concrete Lin i ng CY 754 700 527.8Rein<strong>for</strong>cement LB 38,000 1 37.7Rock Bolts, 1" QJ x 7' EA 350 250 87.5--TOTAL - GATE CONTROL ROOM 1 ,567D -11
TABLE 0-4 (cont)Co st Unit TotalAccount Cost CostNumber Description or Item Un it Quant ity ilL ( ~l ,000)04.3 ACCESS AOIT AND STAGING AREAExcavationRock Cy 3, 180 75 238.5Common CY 1 ,360 15 20.4Concrete CY 95 600 57Rein<strong>for</strong>cement LB 4,800 0.75 3.6Excavation (Ad it) rock CY 215 200 43Rockbo lts, 1" X 10 1 EA 130 300 39TOTAL - ACCESS AOIT 401.504.5 POWER TUNNELTunnel Excavation (Rock) Cy 21,763 225 4,896.7Concrete Lining CY 4,889 600 2,933.4Rein<strong>for</strong>cement LB 244,450 0.75 183.3Rock Bolts, l"xlO' EA 8,338 210 1,751.0Portal (Including SecondaryRock Trap, Transition, StaginqArea <strong>and</strong> Haul Road)Rock Excavation Cy 17,014 30 510.4Overburden Cy 150,009 10 1 ,500. 1Concrete CY 172 700 120.4Rein<strong>for</strong>cement LB 11 ,100 0.75 8.3Rock Bolts, 1"x141 EA 90 460 41.4Roc k Bo lt s, 1" x 7 1 EA 130 275 35.7Rails <strong>and</strong> Tracks LF 800 50 40Trestle LS 1 100,000 100TOTAL - POWER TUNNEL 12,120.704.5 PENSTOCKSteel, 48"0 LB 1,063,000 2.50 2,657.5R i n9 Stiffeners, Exp. LB 74,410 3 223.2Anchors, Anchor SupportsCo ncrete Support Piers CY 190 300 57Concrete Anchor Blocks Cy 16 300 4.8TOTAL - PENSTOCK 2,942.507 POWERPLANT07. 1 POWERHOUSEMobilization & Pre- LS 120,000 120paratory WorkExcavation <strong>and</strong> Concrete LS 230,000 230D -12
TABLE D-4 (cont)Co st Unit Tota 1Account Cost CostNumber Descr-iption or Item Un it Quantity ilL ( ~l,OOO)07. 1 POWERHOUSE (cont)Building Superstructure LS 72,000 72Misc. Building Item LS 97,000 97Bifurcation & LS 36,000 36Branch Pi peValves EA 2 145,000 290TOTAL - POWERHOUSE 84507.2 TURBINES AND GENERATORSTurbines, Governor & EA 2 308,500 617Cool ing SystemGenerators & Excitation EA 2 600,000 1,200F:quipmentTOTAL - TURBI NESAND GENERATORS 1 ,81707.3 ACCESSORY ELECTRICAL EQUIPMENTSwitchgear, Breaker & LS 211,000 211Busses & StationService UnitSupervisory Control LS 317,000 317SystemMisc. <strong>Electrical</strong> System LS 36,000 36--TOTAL - ACCESSORY ELECTRICAL EQUIPMENT 56407.4 AUXILLARY SYSTEMS AND EQUIPMENTHeating & Ventilating LS 7,000 7Equipment Bridge Crane LS 120,000 120& Misc. MechanicalSystemsTOTAL - AUXILLARY SYSTEMS AND EQUIPMENT 12707.5 SWITCHYARD<strong>Power</strong> Trans<strong>for</strong>mer LS 222,000 222Disconnects & <strong>Electrical</strong> LS 18,000 18Eq u i pmentTOTAL - SWITCHYARD 240D-13
TABL E 0-4 (cont)Co st Unit To ta 1Account Cos t CostNumber Description or Item Unit Qu ant ity ilL(~l,OOO)·07.6 TAILRACE CHANNELOverburden Excavation CY 48 10 0.5Rock Excavation CY 20 25 0.5Concrete CY 38 300 11.4Rein<strong>for</strong>cement LB 1 ,900 0.75 5.2Steel P·i pe LB 270,440 2.25 608.5Misc. Steel LB 27,044 2.50 67.6R i pr ap CY 42 30 1.3Stoplogs EA 2 7,000 14.0TOTAL - TAILRACE CHANNEL 70907.7 TRANSMISSION LINE(WITH INSPErTION ACCESS TRAIL)Clearing AC 40 2,500 100Line ro nductors & MILE 3.5 65,000 227.5Single Wood PoleStructures (55 pcs)TOTAL - TRANSMISSION LINE 327.519 BUILDINGS, GROUNDS, AND UTILITIESMaintenance Equipment& SupplyStorage Warehouse LS 250,000 250--TOTAL - BUILDINGS, GROUNDS, AND UTILITIES 250--SUBTOTAL - CONSTRUCTION COSTS 24,50620% rONTINGENCIES 4,901TOTAL - CONTRACT COSTS 29,40730 ENGINEERING AND DESIGN (8%) 2,35331 SUPERVISION AND ADMINISTRATION (8% ) 2,541TOTAL - PROJECT COST 34,301D-14
, ..... ,..\ (I),;> "----f .'-.. -I 29 - - ,,~.~-- - ~'--! V ~_~;-" ~ ~--------""---:1 /)1: L------f _-\I :~...! ;':'Val(!ez '., " ~'_"L D E Z,:.::A !tN:~" :,,::,:, "'C"}'" ~ , ,;;;:;,:;;::Y"', ....): I .' Isl<strong>and</strong>s " • '- • . / ' , / 'l~ .'- " ___,,"~ ;~~,,:;t:i~-./;, -_ ,i,
I-,.,,u.s. AIOIIY ENGINEER DlflWICT. AL.A.cA_MMMALLISONCREEKPHOTO MOSAIC1>-J9
"'~~TAPANDROCK TRAP1600.•. -~ "001400i ~\?\';~1"\00"00DISTRICTALASKA NGINEERSCORPS OF E LASKAANCHORAGE, A REPORTVALDEZ INTEAR~M RAILBELTSOUTHCENTRALLISON CREEKTOPOGRAPHIC PLAN. __APPROVED,__ _SHUT 0,PLATE D-A-3
CORPS Of ENGINEERSU. S. ARMY'
CORPS OF ENGINEERSU. S. ARMY./f----4,oprox. ,500. 0. '1 4 ,o,orox. Zlo..o.StagmlJ IIrpoCalt? flaisll .,// MOc/lmenj Roamn--' : II .. 1456.0e' Horsesha.e : r_________ ~~~~~~.!:i§Q.J..,@'~~-----------------------==::iSZ~~M~a=x=.~F,~/o=O=d===E~L~.=/~:J='6=?=O=====_I-----i-----~:=----7 -)~" ll~i --;'ale Shariy ~s. a U60J(MS" Ac~,dd" 1'_/00': :I,IBol/om or laken. lieD. 0.sz Min. Pool EL. IZ6? 0Lake Tap ELLAKE ENTRY PROFILENof 10 ScaleGafe Room~ l i i"'~ ,Tunnel InyerlEL IZ4Z.0 EL. IZ5 i5:0._UWJ ELIZ .'00 ' 400--_____ ~~=~ ~---____ -_-_-_-~~_~~====-=-~ ltt-===-=-_--_--_--:.--_--_;.,:"',', ~".-f-'L't:,2::~=:::::J:::::~=~== \8' Horseshoe "': ~An'lie dependinlJon slo,oe conddion\>Fbwer Tunnel ", "EL 10.50.. Q~~~~~~_-_-_-_ _=__=__=__======={0.0.0.5 Slope<strong>Power</strong> TunnelTrashRock--SECTIONNol fo Scale-Concrete LipDead End Rock Trapo'b--~---\ / I./; ///-----<strong>Power</strong> Tunneln. 1250..0~An9led,opending{In slop~ condihon-Top Area 8'<strong>Power</strong> Tunnel--~~r~~~~~--~ 3-SECTIONNof 10 Scaleo'-- C oncrele LipDead End Rock Trap60'DNED:C.i\ME RODRAWN:EF!PEPED=all ••SUPERVlSED=~'"R'0,...t.4MEN ED:ALASKA DISTRICTCORPS OF ENGINEERSANCHORAGE, ALASKAVALDEZ INTERIM REPORTSOUTHCENTRAL RAILBELTALLISONCREEKLAKE TAP PROFILE. PLAN 8 SECT.APPROVED:SCALE:FILE NUhlBER0-22SHEETOFPLATE 0-A-5
CORPS OF ENGINEERSU. S. ARMY-:!.:Jrr1Il'!1 ;.::;,,,;;,,,Genera/or Roon/10' 1'0'-f, 1 __
APPENDIX EENVIRONMENTAL DATA
APPENDIX EENVIRONMENTAL DATATABLE OF CONTENTSItemTEMPERATURE RECORDING OF ALLISON CREEK AND SOLOMON GULCHWATER TEMPERATURE PROFILES OF ALLISON LAKEUNREGULATED FLOWS FOR ALLISON CREEKREGULATED FLOWS FOR ALLISON CREEKESTIMATED AVERAGE MONTHLY FLOWS OF ALLISON CREEK WATERSHEDBELOW ALLISON LAKEWATER QUALITY DATA FOR ALLISON CREEKWATER QUALITY DATA FOR ALLISON LAKEMAMMALS OF THE PORT VALDEZ AREABIRDS OF THE PORT VALDEZ AREAALLISON CREEK SALMON ESCAPEMENTENDANGERED SPECIES LETTER - U.S. FISH AND WILDLIFESECTION 404(b)(1) EVALUATIONTablelAlB2A2B34A4B567
TABLE 1ATEMPERATURE RECORDING OF ALLISON CREEKAND SOLOMON GULCHALLISON CREEKJUNE19792627282930JULY197912345678910111213141516171819202122232425262.7282930HIGHTEMP.LOWTEMP.4 35 . 3HIGHTEMP.LOWTEMP.5 36 46 46 45 45 46 46 56 56 56 46 56 57 . 57 68 67 57 57 57 58 78 68 57 58 69 69 7AVER.TEMP.3333.54AVER.TEMP.4555444.55.555.55.55.5555.566.5766667.576.5677.58
TABLE 1A (cant)ALLISON CREEK (cant)AUGUST HIGH LOW AVER.1979 TEMP. TEt~P . TEMP.1 9 7 82 10 7 8.53 11 8 9.54 10 7 8.55 10 7 8.56 9 7 87 9 7 88 9 7 89 8 7 7.510 8 7 7.511 8 7 7.512 8 6 713 8 6 714 8 7 7.515 716 617 618 6 5 5.519 620 7 5 621 8 5 6.522 7 6 6.523 8 6 724 9 7 825 9 7 826 9 7 827 728 9 7 829 9 7 830 8 7 7.5SEPTEMBER HIGH LOW AVER.1979 TEMP. TEMP. TEMP.2 8 6 73 8 5 6.54 9 7 85 7 6 6.56 7 6 6.57 7 5 68 8 6 79 8 6 710 7 6 6.511 8 6 712 9 7 8
TABLE 1A (cont)ALL! SON CREEK (cont)SEPTEMBER HIGH LOW AVER.1979 TEMP. TEI"1P. TEMP.13 9 8 8.514 9 8 8.515 8 7 7.516 717 718 7192021222324252627 6 5 5.528 6 5 5.529 5 4 4.530 6 5 5.5OCTOBER HIGH LOW AVER.1979 TEMP. TEMP. TEMP.1 5.52 5.53 5.54 5.55 5.56 5.57 58 6 5 5.59 5.510 5.511 5.512 5.513 514 5 4 4.515 5 4 4.516 517 5 4 4.518 419 420 321 4 3 3.522 423 4
TABLE 1A (cant)ALLISON CREEK (cant)OCTOBER HIGH LOW AVER.1979 TEMP. TEMP. TEMP.24 425 426 4 3 3.527 428 429 430 4NOVEMBER HIGH LOW AVER.1979 TEMP. TEMP. TEMP.1 3.52 3.53 3 2 2.54 2 1 1.55 16 2 0 17 2 1 1.58 3 2 2.59 310 3 2 2.511 212 313 2.514 3 2 2.515 216 2 1.517 118 019 0 .520 121 2 1.522 223 224 2 0 125 026 027 1 0 .528 2 0 129 230 2 1.5
TABLE 1A (cont)ALLISON CREEK (cont)DECErvlBER HIGH LOW AVER.1979 TEMP. TEMP. TEMP.1 12 0 .53 .54 05 06 -0.2 -0.37 -0.38 -0.39 -0.310 -0.311 -0.312 -0.3 -0.4 -0.313 -0.314 -0.3 -0.4 -0.415 -0.3 -0.5 -0.416 -0.2 -0.2 -0. 117 0.-4 0.3 0.418 0.2 -0.3 -0. 119 0.3 -0.2 O. 120 0.6 0.4 0.521 0.5 0.2 0.322 0.2 O. 1 O. 123 0.2 O. 1 0.224 0.6 0.2 0.425 0.8 0.6 0.726 0.827 0.8 0.7 0.828 0.829 0.8 0.5 0.730 0.3 O. 1 0.231 O. 1 -0.3 -0. 1JANUARY HIGH LOW AVER.1980 TEMP. TEMP. TEMP.1 -0.32 -0.33 0.0 -0.4 -0.24 O. 1 0.0 0.05 0.4 O. 1 0.26 0.6 0.5 0.57 0.6 0.5 0.58 0.59 0.5 0.0 0.410 0.0 -0.4 -0.3
TABLE 1A (cont)ALLISON CREEK (cont)JANUARY HIGH LOW AVER.1980 TEMP. TEMP. TEMP.11 -0.4 -0.5 -0.512 -0.513 -0. 1 -0.6 -0.314 0.2 -0. 1 O. 115 0.216 0.6 0.2 0.317 0.5 O. 1 0.218 0.3 O. 1 0.219 0.4 O. 1 0.220 0.2 0.0 O. 121 O. 1 -0.3 0.022 -0.4 -0 5 -0.523 -0.524 -0.5 -0.7 -0.625 -0.4 -0.6 -0.526 -0.527 -0.2 -0.5 -0.328 0.2 -0. 1 O. 129 O. 1 -0.7 -0.430 -0.631 -0.3 -0.7 -0.5FEBRUARY HIGH LOW AVER.1980 TEMP. TEMP. TEMP.1 -0.3 -0.6 -0.52 O. 1 -0.4 -0.23 O. 1 0.0 o. 14 0.05 0.0 -0.4 -0.26 O. 1 0.0 O. 17 O. 18 O. 19 O. 1 -0. 1 0.010 0.3 -0.2 0.011 0.5 0.3 0.412 0.4 0.2 0.313 0.2 0.0 O. 114 O. 115 O. 1 0.0 0.016 o. 1 -0. 1 0.017 0.0 -0.7 -0.418 -0.519 -0.4 -0.7 -0.5
ALLISON CREEK (cont)FEBRUARY HIGH LOW AVER.1980 TEMP TEMP TEMP.20 -0.2 -0.4 -0.321 0.0 -0.2 -0.122 0.3 0.0 0.023 0.8 0.4 0.624 0.9 0.7 0.825 0.7 0.4 0.526 1.0 0.7 0.827 1.0MARCH HIGH LOW1980 TEMP. TEMP.1 0.9 02 0.9 03 1.0 O.4 1.0 0.85 1.0 0.76 1.0 0.77 1.0 0.88 1.0 0.89 1.0 0.810 1.0 0.311 0 012 0 -0.213 -0.2 -0.514 -0.5 -0.515 0 -0.816 0 017 0.5 018 0.5 019 0.5 020 0 -0.921 1.0 022 0.9 023 0.5 024 1.0 0.525 1.0 0.526 1.0 0.927 1.2 0.928 1.2 029 1.2 030 1.1 031 1.0 0.8
ALLISON CREEK (cont)TABLE lA (cont)APRIL HIGH LOW1980 TEMP. TEMP.1 0.9 0.72 1.0 0.63 1.0 0.54 1.0 0.75 1.3 1.06 1.8 1.07 1.7 1.08 2.0 09 2.0 1.010 2.0 1.011 1.8 1.012 1.2 1.113 1.1 0.914 1.3 015 1.8 0.916 1.8 1.017 1.8 018 2.2 0.919 2.8 1.520 2.8 1.521 1.8 1.222 1.8 1.223 2.3 1.224 3.5 1.025 2.1 1.026 2.5 1.227 2.2 1.028 2.8 1.129 2.5 1.030 2.9 1.2MAY HIGH LOW1980 TEMP. TEMP.1 3. 12 2.0 1.23 2. 1 1.04 2.9 1.05 2. 1 1.26 2.0 1.37 2.5 1.28 2.5 1.29 2. 1 1.210 1.2 1.211 1.9 1.012 2.5 1.013 2.9 1.0
ALLISON CREEK (cant)TABLE lA (cant)MAY HIGH LOW1980 TEMP. TEMP.14 1.9 1.115 2.0 1.016 1.9 1.017 1.6 1.118 1.8 1.119 2.0 1.220 1.8 1.121 1.9 1.222 2.0 1.223 2.0 1.224 1.8 1.225 2.0 1.226 1.8 1.627 No reading28 No reading29 No reading30 No reading31 No readingJUNE HIGH LOW1980 TEMP. TEMP.1 No reading2 No reading3 No reading4 1.5 2.25 1.0 2.26 2.0 1.07 2.0 1.58 2.0 1.89 2.8 1.810 2.8 1.811 2.0 1.812 2.0 1.813 2.2 1.814 2.3 1.815 2.5 1.816 3. 1 1.817 2.0 3.018 2.2 1.819 2.5 1.820 2.4 2.021 3.0 1.822 3.2 2.023 3.3 2.224 2.9 2. 125 2.5 2. 126 3.3 2. 127 3.3 2.328 3.0 2.229 3.2 2.530 3. 1 2.2
TABLE 1A (cant)ALLISON CREEK (cant)JULY HIGH LOW1980 TEMP. TEMP.1 3.9 2.22 3.9 2.23 3.9 2.44 4.0 2.35 4.0 2.46 3.0 3.07 3.0 2.88 3.2 2.89 3.2 2.810 4.0 2.811 3.5 2.812 3.0 2.913 4.4 3.014 4.8 3.015 4.6 3.516 4.2 3.517 4.8 3.818 4.8 3.819 5.2 3.820 5.8 4.021 5.0 4. 122 6.0 4.123 5.5 4.224 5.2 4.525 5.0 4.526 4.8 4.527 4.8 4.528 4. 1 4. 129 4.3 4.130 4.8 4.231 4.8 4.2SEPTEMBER HIGH LOW1980 TEMP. TEMP.1 7.0 5.02 5.0 4.03 3.0 5.04 5.5 4.25 5.0 4.96 5.3 4.07 4.5 3.28 4.5 4.59 4.5 4.510 4.5 4.511 4.5 4.5
TABLE 1A (cont)ALLISON CREEK (cont)SEPTEMBER HIGH LOW1980 TEMP. TEMP.12 4.5 4.5 .13 4.5 4.514 4.5 4.515 5.5 5.016 5.5 5.517 7.0 5.518 5.5 5.519 5.5 5.520 5.5 5.521 5.0 4.822 3.3 3.323 3.3 3.324 3.3 3.325 3.3 3.326 3.3 3.327 3.3 3.328 3.3 3.329 3.3 3.330 3.3 3.3OCTOBER HIGH LOW1980 TEMP. TEMP.1 1.8 1.82 1.5 0.83 2.0 0.94 2.2 1.25 2.2 2.06 2.0 2.07 2.0 2.08 2.0 2.09 2.0 2.010 2.0 2.011 2.0 2.012 2.0 2.013 2.0 2.014 2.0 2.015 2.0 2.016 2.0 2.017 2.0 2.018 2.0 2.019 2.0 2.020 2.0 2.021 2.0 2.022 2.0 2.023 2.0 2.024 2.0 2.025 2.0 2.0
TABLE lA (cont)ALLISON CREEK (cont)OCTOBER HIGH LOW1980 TEMP. TEMP.26 2.0 2.027 2.0 2.028 2.0 2.029 2.0 2.030 2.0 2.031 2.0 2.0NOVEMBER HIGH LOW1980 TEMP. TEMP.1 1.0 1.02 1.0 1.03 1.0 1.04 1.0 1.05 1.0 1.06 1.0 1.07 1.0 1.08 1.0 1.09 1.0 1.010 1.0 1.011 1.0 1.012 1.0 1.013 1.0 1.014 1.0 1.015 1.0 1.016 1.0 1.017 1.0 1.018 1.0 1.019 1.0 1.020 1.0 1.021 1.0 1.022 1.0 1.023 1.0 1.024 1.0 1.025 1.0 1.026 1.0 1.027 1.0 1.028 1.0 1.029 1.0 1.030 1.0 1.0
TABLE 1A (cont)SOLOMON CREEK - HIGH VALUES EFFECTED BY TIDESSEPTEMBER HIGH LOW1979 TEMP. TEMP.10 12 711 12 712 13 813 12 914 13 815 816 8.517 718 7 619 720 721 7 622 623 624 625 626 627 628 9 629 11 630 6OCTOBER HIGH LOW1979 TEMP. TEMP.1 12 52 12 63 9 64 11 6
TABLE 1A (cont)SOLOMON CREEK (cont)OCTOBER HIGH LOW AVER.1979 TEtJIP. TEMP. TEMP.5 6 56 12 57 58 59 10 510 11 511 512 513 514 515 4.516 4.5 3.517 7 418 10 419 10 420 11 421 10 322 9 223 9 224 9 225 9 326 9 327 9 328 8 329 9 330 9 3NOVEMBER HIGH LOW AVER.1979 TEMP. TEMP. TEMP.1 6 32 33 8 34 7 35 7 26 7 17 8 18 8 19 8 010 2 111 3 212 3 213 2 114 1.515 4.5 1.5
TABLE 1A (cant)SOLOMON CREEK (cant)NOVEf>lIBER HIGH LOW AVER.1979 TEMP. TEMP. TEMP.16 6 1.517 6 218 6 119 6 120 5 021 7 122 7 123 7 124 6 125 6 126 6 127 5 128 6 129 5 130 6 1DECEMBER HIGH LOW AVER.1979 TElviP. TEMP. TEMP.1 6 12 6 13 7 14 7 15 7 06 6 07 7 08 6 09 5 010 1 -0.711 -0.612 0.6 -0.613 3.8 -0.614 2.4 -0.515 4.0 -0.516 3.7 -0.517 4.5 -0.718 4.4 -0.519 4.5 -0.320 4.6 -0.421 4.6 -0.422 3.7 -0.323 3.3 -0.424 4.8 -0.225 4.8 -0.226 4.4 -0.2
TABLE 1A (cant)SOLOMON CREEK (cant)DECEMBER HIGH LOW AVER.1979 TEMP. TEMP. TEMP.27 4.3 -0.228 3.2 -0.229 3.0 -0.330 2.9 -0.531 3.3 -0.5JANUARY HIGH LOW AVER.1980 TEMP. TEIVlP. TEMP.1 3.8 -0.52 4. 1 -0.33 2.5 -0.44 3.5 -0.25 3.7 -0.26 3. 1 -0.27 3.3 -0.28 3.2 -0.29 1.2 -0.510 2.7 -0.511 2.9 -0.612 2.2 -0.613 2.9 -0.314 3.4 -0.315 2.9 -0.516 3. 1 -0.317 2.8 -0.218 3.0 -0.219 2.3 -0.220 2.6 -0.221 3.0 -0.222 2.0 -0.323 1.8 -0.524 1.8 -0.525 2. 1 -0.526 1.5 -0.527 3. 1 -0.428 2.8 -0.529 2.4 -0.530 2.8 -0.531 3.2 -0.6•
TABLE 1A (cont)SOLOMON CREEK (cont)FEBRUARY HIGH LOW AVER.1980 TEMP. TEMP. TEMP.1 2.9 -0.42 3.0 -0.33 3. 1 -0.34 2.2 -0.55 2.5 -0. 16 2.0 -0.37 2.2 -0.48 2.0 -0.59 1.6 -0.510 1.7 -0.211 2.0 -0.412 1.0 -0.813 1.7 -0.514 1.9 -0.515 1.8 -0.416 1.7 -0.717 2. 1 -0.518 2.0 -0.519 2.8 -0.420 2.6 -0.321 2.5 -0.322 2.6 -0.323 2.0 -0.424 2.0 -0.525 2.4 -0.326 2.3 -0.227 3.8 -0.2
TABLE 1A (cent)SOLOMON CREEK (cent)MARCH HIGH LOW1980 TEMP. TEMP.1 3.0 -0.52 2.5 -0.53 2.8 -0.54 2.9 -0.35 3.0 -0.46 3.0 ':0. 17 3.0 -0. 18 3.0 -0.19 2.8 -0. 110 2.4 -0.411 2.0 -0.412 2.0 -0.513 2.0 -0.514 3.0 -0.515 2.9 -0.516 3. 1 -0.317 3.5 -0.318 3.2 -0.319 3.5 ':0.520 3.0 -0.521 3.9 -0.222 3.5 -0.523 3.3 -0.524 3.8 -0.225 3.8 -0.226 3.8 -0. 127 3.2 -0. 128 3.2 a29 3.4 a30 3.5 -0.231 3.0 -0.4APRIL HIGH LOW1980 TEMP. TEMP.1 2.8 -0.52 2.8 -0.23 4.0 -0.24 4.0 -0.35 4.5 .026 4.3 .027 4.9 .058 4.5 .029 5.8 .0510 4. 1 011 * *
TABLE lA (cont)SOLOMON CREEK (cont)APRIL HIGH LOW1980 TEMP. TEMP12 * *13 * *14 * *15 * *16 * *17 * *18 * *19 * *20 * *21 * *22 * *23 * *24 * *25 * *26 * *27 * *28 6.2 029 5 .0230 5 .08*Machine malfunctioned - data not avail ab 1 eMAY HIGH LOW1980 TEMP. TEMP.1 5.2 .082 5.8 .083 5.2 04 6.0 0.85 6.8 1.06 6.8 .057 7.4 .098 7.8 .099 7.9 1.010 7.8 .0811 7.5 .0812 9.5 .0813 8.4 .0514 8.2 015 9.8 016 9.8 .0517 9.0 .0918 9.0 .0819 8.5 .0820 8. 1 .0821 7.4 .08
TABLE 1A (cant)SOLOMON CREEK (cant)MAY HIGH LOW1980 TEMP. TEMP.22 7. 1 .0823 2.5 .0924 3.0 .0925 3.3 .0826 3.0 .0927 1.09 .0828 3.01 .0829 3.0 .0930 8.1 031 4.0 .08JUNE HIGH LOW1980 TEMP. TEMP.1 5.3 0.82 5.3 0.83 3.5 0.84 3.0 0.55 4.8 4.86 1.2 3.07 4.5 1.38 5. 1 1.39 3.0 2.010 3. 1 1.811 4.0 2.012 4.8 2.013 4.5 2.014 5. 1 1.815 7.0 2.216 4.0 2.217 3.8 2.018 4.2 2.019 4.6 2. 120 7. 1 2.121 7.2 2.622 5.9 2.923 5.0 2.224 4.8 3.025 7.6 3.026 6.2 3.027 4.0 3.028 6.0 3.029 7.4 3.030 9.0 3.0
TABLE 1A (cont)SOLOMON CREEK (cont)JULY HIGH LOW1980 TEMP. TEMP.1 9.2 3.02 5. 1 3.03 9.5 3.04 7.0 3.55 4.5 3.86 5.0 3.87 6.0 4.08 5.5 4.59 6.5 4.010 7.0 5.011 7.0 5.212 6. 1 5.013 7.0 5. 114 8.0 5.215 9.2 6.216 9.0 5.817 8.0 5.218 7. 1 5.519 6.3 5.020 5.0 6.221 5.5 5.022 6. 1 5. 123 5.3 6.524 8.4 5.525 8.4 5.026 9.0 6.027 9.0 5.028 7.5 5.029 6. 1 5.530 7.3 5.031 9.0 5.3AUGUST HIGH LOW1980 TEMP. TEMP.1 9.0 5.22 7.0 5.23 7. 1 5.04 8.2 4.55 6.5 5.66 7.0 4.87 9.5 5.28 9.5 5.29 10.8 4.210 11.5 4.211 12. 1 7.012 11. 1 6.813 9. 1 6. 114 11.8 5.215 11.8 5.816 7.2 7.0
SOLOMON CREEK (cont)TABLE 1A (cont)AUGUST HIGH LOW1980 TEMP. TEMP.17 6.0 6.018 6.0 6.019 6.0 6.020 6.0 6.021 6.0 6.022 6.0 6.023 6.0 6.024 6.0 6.025 6.0 6.026 6.0 6.027 6.0 6.028 6.0 6.029 6.0 6.030 6.0 6.031 6.0 6.0SEPTEMBER HIGH LOW1980 TEMP. TEMP.1 6.5 6.02 7.2 4.63 6.3 4.44 10.2 4.55 9.8 4.86 9.8 5.37 9.8 5.88 9.8 6.09 10.0 6.010 10.5 4.811 10.8 4.812 10.5 5.013 10.0 5.214 5.5 5.415 6.0 5.516 6.4 6.017 5.4 7.518 5.0 6.019 5.0 5.920 8.9 4.821 9.5 5. 122 9.5 5.523 9.9 5.424 10.0 4.925 10.0 4.926 10.0 5.527 10.0 5.528 10.0 5.029 9.9 5.030 5.9 5.4
SOLOMON CREEK (cont)TABLE 1A (cont)OCTOBER HIGH LOW1980 TEMP. TEMP.1 5.5 5.02 5. 1 5.03 9. 1 4.84 9. 1 4.05 9.5 4.06 8.5 4.57 5.0 4.88 5.0 3.89 8.8 1.810 7.8 1.811 8.2 2.012 8. 1 1.013 9.0 1.014 8.9 2.015 7.4 2.016 3.5 3.517 7.5 2.518 7.0 2.219 7.5 2.220 7.5 2.221 8.3 2.822 8. 1 3.023 8.2 2.824 8.0 2.425 7.4 2.826 6.5 0.927 6.4 1.328 7.2 1.829 6.8 2.030 6.5 1.831 6.5 1.8NOVEMBER HIGH LOW1980 TEMP. TEMP.1 6.5 2.52 5.5 1.83 5.8 1.54 5.0 1.55 5.8 1.56 4.0 1.57 4.0 1.58 4.0 1.59 4.0 1.510 4.0 1.511 4.0 1.512 4.0 1.513 4.0 1.514 4.0 1.5
TABLE 1A (cant)SOLOMON CREEK (cant)NOVEMBER HIGH LOW1980 TEMP. TEMP.15 4.0 1.516 3.0 1.017 3.0 1.018 3.0 1.019 3.0 1.020 3.0 1.021 3.0 1.022 3.0 1.023 3.0 1.024 3.0 1.025 3.0 1.026 3.0 1.027 2.5 028 2.5 029 2.5 030 2.5 0DECEMBER HIGH LOW1980 TEMP. TEMP.1 2.5 02 2.5 03 2.5 0
TABLE 2ACalculated Flows of Allison CreekUsing Meteorological Data from 1948 to 1977(Unregulated Flows)YEAR OCT NOV DEC JAN FEB MAR APR MAY JUN JUL· AUG SEP AVG1948 38. 35. K To 5. 3. 3. 59. 152. 176. 93. 83. 56-. -1949 52. 23. 7. 5. 3. 4. 4. 30. 11l. 103. 89. 134. 47.1950 29. 28. 12. 5. 4. 3. 2. 34. 124. 94. 86. 86. 42.1951 16. 7. 3. O. l. 2. 3. 18. 88. 117. 86. 194. ~ ~.1952 25. 25. 7. 5. 4. 3. 3. 15. 124. 255. . 99. 74. 54.1953 103. 44. 10. 6. 4. 4. 6. 76. 184. 138. 117. 89. 65.1954 48. 12. 6. 4. 4. 3. 4. 55. 12l. 94. 120. 83. 46.1955 47. 25. 4. 4. 4. 3. 3. 12. 108. 174. 122. 43. 46.1956 19. 9. 6. 7. 4. 3. 5. 3l. 125. 17l. 149. 72. 50.1957 17. 27. 13. 5. 3. 3. 3. 44. 12l. 104. 99. 176. 5l.1958 54. 35. 9. 8. 4. 4. 7. 89. 159. 264. 134. 4l. 68 .. 1959 53. 14. ll. 5. 4. 3. 4. 66. 130. 150. 70. 42. 46.1960 44. 19. 10. 7. 5. 3. 4. 79. 130. 163. 108. 8l. 55.1961 29. 13. 23. 9. 5. 4. 6. 93. 120. 12l. 118. 84. 52.1962 39. 15. 8. 7. 4. 4. 5: 4l. 116. 109. 74. 6l. 40.1963 33. 22. 17 . 7. 10. 7. ll. 67. 112. 15l. 89. 54. 49.1964 34. 10. 19. 6. 6. 4. 5. 13. 137. 157. 100. 47. 45.1965 35. 22. 15. 5. 4. 4. 10. 47. 122. 96. 90. 97. 46.1966 44. 1l. 7. 4. 3. 3. 5. 3l. 112. 95. 114. 127. 46.1967 49. 20. 6. 4. 4. 5. 9. 44. 128. 114. 10l. 13l. 5l.1968 23. 28. 14. 5. ll. 9. 6. 80. 116. 103. 7l. 5l. 43.1969 24. 14. 7. 4. 4. 7. 10. 62. 129. 84. 55. 33. 36.1970 6l. 23. 26. 8. 10. 8. ll. 4l. 122. 128. 128. 6l. 53.1971 35. 19. 9. 5. 4. 3. 5. 20. 130. 18l. 113 . 52. 48.1972 39. ll. 4. 4. 3. 2. 2. 14. ' 100. 14l. 103. 95. 43.1973 46. 12. 8. 4. 3. 3. 4. 48. 105. 102. 98. 36. 39.1974 20. 9. 6. 4. 3. 3. 5. 46. 106. 68. 7l. 93. 36.1975 63. 28. ll. 5. 4. 3. 5. 44. 112. 164. 80. 106. 52.1976 36. 8. 5. 4. 4. 3. 9. 154. 240. 135. 96. 122. 68.1977 60. 55. 27. 12. 16. 4. 9. 45. 128. 143. 106. 94. 58.AVERAGE 4l. 2l. ll. 6. 5. 4. 6. 50. 127. 137. 99. 85. 49.
TABLE 1BWater Temperatureof A 11 i son Lake13 April 1979Site #1 Site #2 Site #3Ice Thickness 1 ft. 3 ft. 6 ft.Overflow 1. 5 ft. 0 0.5 ft.Temperature °CSurface (top of ice) -0.25 -0.25 +0.251 Meter -0.25 -0.25 0.002 -0.25 0.00 0.002.5 +0.25 +0.253 0.25 +0.25 0.303.5 0.50 +0.75 0.754 1.00 1.25 1.504.5 2.00 1.90 2.405 2.25 2.40 2.505.5 2.75 2.756 2.75 3.00 2.906.5 3.00 3.007 3.00 3.25 3.107.58 3.25 3.25 3.258.59 3.25 3.25 3.309.510 3.25 3.30 3.3010.511 3.25 3.30 3.3012 Bottom Cd 12.25 M 3.30 3.3013 3.40 3.3014 3.40 3.3015 3.40 3.3016 3.40 3.5017 3.40 3.4018 3.40 3.5019 3.50 3.5020 3.50 3.5030 3.50 Bottom @ 22.25 MBottom @ 37 M
TABLE 2BCalculated Flows of Allison CreekUsing Meteorological Data from 1948 to 1977(Regulated Flows)YEAR OCT NOV DEC JAN FEB MAR APR MAY JUN JUL AUG SEP AVGT948 19- 4"5"":- 48"-:- j7-: 4lf": jT. 14- 13. "j"j."" 96. 82. 78. W.1949 47. 45. 49. 37. 40 32. 34 33. 34. 32. 34. 77. 4l.1950 39. 45. 49. 37. 40. 32. 34. 33. 34. 32. 34. 39. 37.1951 39. 46. 49. 38. 4l. 32. 35. 34. 35. 33. 35. 39. 37.1952 39. 46. 49. 37. 40. 32. 34. 33. 34. 65. 88. 69. 38.1953 98. 45. 48. 37. 40. 32. 34. 33. 33. 120. 106. 84. 47.1954 43. 45. 49. 37. 40. 32. 34. 33. 34. 32. 34. 72. 59.1955 42. 45. 49. 37. 40. 32. 34. 33. 34. 32. 64. 39. 40.1956 39. 46. 49. 38. 40. 32. 34. 33. 34. 32. 87. 67. 40.1957 39. 46. 49. 37. 40. 32. 34. 33. 34. 32. 34. 135. 44.1958 49. 45. 48. 37. 40. 32. 34. 33. 33. 227. 123. 39. 45.1959 46. 45. 49. 37. 40. 32. 34. 33. 34. 35. 59. 39. 62.1960 39. 45. 49. 37. 40. 32. 34. 33. 34. 67. 97. 76. 40.1961 39. 46. 49. 37. 40. 32. 34. 33. 33. 32. 103. 79. 49.1962 39. 45. 49. 37. 40. 32. 34. 33. 33. 32. 34. 39. 46.1963 39. 46. 49. 38. 40. 32. 34. 33. 34. 32. 50. 49. 37.1964 39. 45. 49. 37. 40. 32. 34. 33. 34. 32. 5l. 32. 40.1965 39. 45. 49 37. 40. 32. 34. 33. 34. 32. 34. 68. 39.1966 39. 45. 49. 37. 40. 32. 34. 33. 34. 33. 34. 76. 40.1967 44. 45. 49. 37. 40. 32. 34. 33. 34. 32. 40. 126. 40.1968 39. 45. 49. 37. 40. 32. 34. 33. 34. 32. 34. 39. 45.1969 39. 46. 49. 38. 40. 32. 34. 33. 34. 32. 34. 39. 37.1970 39. 46. 49. 38. 40. 32. 34. 33. 34. 32. 37. 56. 37.1971 39. 45. 49. 37. 40. 32. 34. 33. 34. 32. 84. 47. 39.1972 39. 45. 49. 37. 40. 32. 34. 33. 34. 33. 34. 39. 42.1973 40. 45. 49. 37. 40. 32. 34. 33. 34. 33. 34. 39. 37.1974 39. 46. 49. 38. 4l. 33. 35. 34. 35. 33. 35. 40. 37.1975 40. 47. 50. 38. 4l. 33. 23. 34. 35. 33. 35. 39. 38.1976 39. 46. 49. 38. 4l. 32. 35. 33. 7l. 124. 85. 117. 59.1977 55. 50. 48. 37. 39. 3l. 34. 33. 33. 84. 95. 89. 52.AVERAGE 43. 46. 49. 37. 40. 32. 34. 33. 35. 5l. 58. 62. 43.
TABLE 3ESTIMATED AVERAGE MONTHLY FLOWS OF ALLISON CREEKWATERSHED BELOW ALLISON LAKEMONTHSOct 29Nov 14Dec 4Jan 3Feb 2Mar 2Apr 2May 24Jun 86Ju1 103Aug 86Sep 691\ilr1Ua 1j6cfs (Average)
TABLE 4AWater Quality Data of Allison CreekCollected by Alyeska Pipeline Servicefrom 1975 to 1977PARAMETERSodiumPotassiumIronManganeseAluminumZincArsenic<strong>Copper</strong>BariumCadmiumCharomium, HexavalentLeadSilverMercuryChlorideFluorideCyanideSilica, TotalSilica, DissolvedSu If ateNitratePhosphate, TotalSolids, TotalSolids, SuspendedSolids, DissolvedHardness, as CaC03CalciumMagnesiumAlkalinity, Total, as CaC03M Alkalinity, as CaC03P Alkalinity, as CaC03Bicarbonate, as CaC03Carbonate, as CaC0 3Hydroxide, as CaC0 3Turb i d ityColor, ApparentpH(Laboratory)22 February 1975VALUE0.5o. 1O. 10.010.016 mg/l10 mg/l10 mg/l0.011 mg/l10 mg/l2 mg/l2 mg/l0.2 mg/l0.330.050.052.53. 16.40.51.243.80.743. 131.210.01.519.619.6o19.6° o3.0 JTU5 Color Units(at pH 7.2)7.2 pH Units
TABLE 4A (cont)PARAMETERCalciumMagnesiumSodiumBicarbonate, as CaC03Carbonate, as CaC03Hydroxide, as CaC03M Alkalinity, as CaC03P Alkalinity, as CaC03SulfateChlorideIronAluminumSilica (Total)Silica (Dissolved)Total Dissolved SolidsTurbidity, JTUColor, Color UnitsHardness, as CaC0 3Ammonia<strong>Copper</strong>pH (Laboratory), pH unitsTemperature (Field), 0CDissolved Oxygen (Field)Carbon Dioxide (Field)13 FEBRUARY 1975VALUE8.71.10.9818.5o18.5o6.50.24O. 10.27.02.235.02.2526.00.480.027. 1318.43.75
TABLE 4A (cont)PARAMETERCalciumMagnesiumSodiumBicarbonate, as CaC03Carbonate, as CaC0 3Hydroxide, as CaC0 31'1 Alkalinity, as CaC0 3P Alkalinity, as CaC0 3Su HateChlorideIronAluminumSi 1 ica (Total)Silica (Dissolved)Total Suspended SolidsTotal Dissolved SolidsTurbidity, JTUColor, Color UnitsHardness, as CaC03<strong>Copper</strong>pH (Laboratory), pH UnitsTemperatureCarbon Dioxide4 APRIL 1975VALUE8.40.80.8020.7o20.7o7.71.2O. 1o. 14.03.51.535.21.1524.3O. 17.07 0 C4.0
TABLE 4A (cant)PARAMETERTurbidity, NTUColor, Color UnitspH (Laboratory), pH UnitsBicarbonate, as CaC03Carbonate, as CaC0 3Hydroxide, as CaC03M Alkalinity, as CaC03P Alkalinity, as CaC0 3Hardness, as CaC03CalciumMagnesiumChlorideIronManganesePotassiumSodiumAluminumArsenicBariumCadmiumChromium-Hexavalent<strong>Copper</strong>LeadMercurySilverZincCyanideFluorideAmmoniaNitratePhosphate, TotalSilica, TotalSilica, DissolvedSu lf ateSolids, TotalSolids, SuspendedSolids, Dissolved23 MAY 1975VALUE1.257.313.8o13.8o20.87. 10.80.3o. 10.010.70.900.210 mg/l0.210 mg/l10 mg/l10 mg/l10 mg/l0.2 mg/l10 mg/l10 mg/l26 mg/lO. 178.840.40.3113.44. 133.01.531.5
TABLE 4A (cont)PARAMETERTurb i d ity, NTUColor, Color UnitspH (Laboratory), pH UnitsBicarbonate, as CaC03Carbonate, as CaC03Hydroxide, as CaC03M Alkalinity, as CaC03P Alkalinity, as CaC03Hardness, as CaC03CalciumMagnesiumChlorideIront~anganeseSodiumSu If ate24 JUNE 1975VALUE1.357.010.7o10.7o18.55.81.00.50.010.010.64.7TABLE 4A (cont)PARAMETERTurbidity, NTUColor, Color UnitspH (Laboratory), pH UnitsBicarbonate, as CaC03Carbonate, as CaC03Hydroxide, as CaC03M Alkalinity, as CaC03P Alkalinity, as CaC03Hardness, as CaC0 3CalciumMagnesiumChlorideIronManganeseSodiumSu If ateAUGUST 1975VALUE4.357. 111.8o11.8o15. 15.70.20.50.150.010.503. 1
TABLE 4A (cont)PARAII,jETERTurbidity, NTUColor, Color UnitspH (Laboratory), pH unitsBicarbonate, as CaC03Carbonate, as CaC03Hydroxide, as CaC03M Alkalinity, as CaC0 3P Alkalinity, as CaC0 3Hardness, as CaC0 3CalciumMagnesiumChlorideIronManganesePotassiumSodiumAluminumArsenicBariumCadmiumChromium-Hexavalent<strong>Copper</strong>LeadMercurySilverZincCyanideFluorideAmmoniaNitratePhosphate, TotalSilica, TotalSilica, DissolvedSulfateSolids, TotalSolids, SuspendedSolids, Dissolved19 AUGUST 1975VALLIE4.457.011.911.916.35.80.50.4O. 150.01O. 140.5O. 110 mg/lO. 10.010.010.010.010.3 mg/l0.010.010.05O. 1O. 100.50.381.34.841.52.039.5
TABLE 4A (cont)PARAMETERTurb i d ity, NTUColor, Color UnitspH (Laboratory), pH UnitsBicarbonate, as CaC03Carbonate, as CaC03Hydroxide, as CaC03M Alkalinity, as CaC03P Alkalinity, as CaC03Hardness, as CaC03CalciumMagnesiumChlorideIronMaganeseSodiumSulfateb OCTOBER 1975VALUE7.0107.223.9oo23.9o16.35.60.50.50.860.010.43. 1TABLE 4A (cont)PARAMETERTurbidity, NTUColor, Color UnitspH (Laboratory), pH UnitsBicarbonate, as CaC03Carbonate, as CaC03Hydroxide, as CaC03. M Alkalinity, as CaC03P Alkalinity, as CaC03Hardness, as CaC03CalciumMagnesiumChlorideIronI"'anganeseSodiumSulfate9 DECElvlBER 1975VALUE1.657 • 121.2o21.2o26.09.00.70.90.250.010.98.5
TABLE 4A (cont)22 APRIL 1977ELEMENT RUN #1 RUN #2 ELEMENT RUN #1 RUN #2Silver .005 .005 Magnesium 0.8 0.7Aluminum .009 .009 Manganese .002 .00Arsenic .02 .02 Molybdenum .004 .00Gold .02 .021 SodiumBoron .001 .001 Nickel .006 .00Bari urn .001 .001 Phosphorus . 1 . 1Bismuth .03 .03 Lead .02 .02Calcium 8.6 8.6 Platinum .05 .05Cadmium .01 .01 Antimony .016 .01Cobalt .03 .03 Selenium .01 .01Chromi urn .01 .01 Silicon 1.40 1.38<strong>Copper</strong> .017 .016 Tin .001 .00Iron .001 .001 Strontium .003 .00Mercury .025 .025 Vanadium .002 .00Potassium .2 .2 Zinc .025 .02TABLE 4A (cont)PARAMETER TOTAL Si02, ppm DISSOLVED SiOAllison 3.00 2.95
TABLE 4BALLISON LAKEWA TER QUALI TVMay 1979SAI~PLEDEPTH6 FeetAlkalinity mg/l as CaC03 11.0Aluminum mg/l as Al0.00Ammonia mg/l as N0.23Arsenic mg/l as As0.00Barium mg/l as Ba0.00Cadmium mg/l as Cd0.03Chloride mg/l as Cl1. 15Chlorine mg/l as Cl0.33Chromium mg/l as Cr0.01Color pt-co unit0.00<strong>Copper</strong> mg/l as Cu0.02Flourine mg/l as F0.0Iron mg/l as Fe0.01Iron BacterianoneLead mg/l as Pb0.01Magnesium mg/l as Mg0.02Manganese mg/l as Mn0.01Mercury mg/l as Hg0.00Nickel mg/l as Ni0.00Nitrate mg/l as NO. 11Nitrite mg/l sd N0.004Kjeldahl mg/l as NO. 14Petroleum or derivatives mg/l 0.00ph7.52Potassium mg/l as K0.09S-ilver mg/l Ag0.00Sodium mg/l as Na0.06Sulfate mg/l (S04)6.5Total Dissolved Solids mg/l @ 103C 20.0Total Settleable Solids mg/l 0.0Turbidity NTU0.01Zinc mg/l0.0070 Feet11.40.000.310.000.000.020.900.360.010.000.020.00.01none0.010.020.020.000.000.080.006O. 110.007.810.080.000.077.219.00.00.010.00
TABLE 5Mammals of <strong>the</strong>Port <strong>Valdez</strong> ArealMammalsBlack bear - Ursus americanusBrown bear - Ursus arctosWolverine - Gulo ~Marten - Martes americanaShort-tailed weasel - Mustela ermineaMink - Mustella vision<strong>River</strong> otter - Lutra canadensisLynx - Lynx canadensisCoyote - Canis latransGray wolf - Canis lupusPorcupine - Erethizon dorsatumSnowshoe hare - Lepus americanusMountain goat - Oreamnos americanusMarine MammalsSea otter - Enhydra lutrisNor<strong>the</strong>rn sea lion - Eumetopias jubataNor<strong>the</strong>rn fur seal - Callorhinus ursinusHarbor seal - Phoca vitulinaDolphin - unidentifiedKiller Whale - Orcinus orcaHarbor porpoise - Phocoena-phocoenaDall's porpoise - Phocoenoides dalliHump-backed whale - Megapetera novaeangliaeCompiled by U.S. Fish <strong>and</strong> Wildlife Service, Western EcologicalServices, Anchorage, Alaska.
TABLE 6BIRDS OF THE PORT VALDEZ AREACommon LoonYellow-billed LoonArctic LoonRed-throated LoonRed-necked GrebeHorned GrebeShort-tailed Albatross*Black-footed AlbatrossLaysan AlbatrossFulmarPink-footed Shearwater*Pale-footed Shearwater*Sooty ShearwaterSlender-billed ShearwaterScaled Petrel*Fork-tailed PetrelLeach's PetrelDouble-Crested CormorantPelagic CormorantRed-faced CormorantGreat Blue HeronWhistling SwanTrumpeter SwanCanada GooseBlack BrantEmperor GooseWhite-fronted GooseSnow GooseMallardGadwa 11PintailCommon TealGreen-winged TealBlue-wi nged Tea 1European WidgeonAmerican WidgeonShovelerRedheadRing-necked DuckCanvasbackGreater ScaupLesser ScaupCommon GoldeneyeBarrow's GoldeneyeBuffleheadWhite-winged ScoterSurf ScoterCommon ScoterHooded MerganserCommon MerganserRed-breasted MerganserGoshawkSharp-shined HawkRed-tailed HawkHarlan's HawkRough-legged HawkGolden EagleBald Eaglel"1arsh HawkOspreyGyrf a 1 conPeregrine FalconPigeon HawkSparrow HawkSpruce GrouseWillow PtarmiganRock PtarmiganWhite-tailed PtarmiganS<strong>and</strong>h ill CraneAmerican Coot*Black OystercatcherSemipalmated PloverKilldeerAmerican Golden PloverBlack-bellied PloverSurfbirdRuddy TurnstoneBlack TurnstoneWhimbrelBristel-thighed CurlewSpotted S<strong>and</strong>piperSolitary S<strong>and</strong>piperW<strong>and</strong>ering TattlerGreater YellowlegsLesser YellowlegsKnotRock S<strong>and</strong>piperSharp-tailed S<strong>and</strong>piperPectoral S<strong>and</strong>piperBaird's S<strong>and</strong>piper
OldsquawHarlequin DuckSteller's EiderCommon EiderKing EiderWestern S<strong>and</strong>piperGray JaySteller's JayBlack-billed MagpieCommon RavenNorthwestern CrowBlack-capped ChickadeeBoreal ChickadeeChestnutbacked ChickadeeRed-breasted NuthatchBrown CreeperDipperWinter WrenRobinVaried ThrushHermit ThrushSwainson's ThrushGray-cheeked ThrushWheatearGolden-crowned KingletRuby-crowned KingletWater PipetBohemian WaxwingNor<strong>the</strong>rn ShrikeStarlingRed-eyed Vireo*Orange-crowned WarblerYellow WarblerMyrtle WarblerTownsend's WarblerBlackpoll WarblerNor<strong>the</strong>rn WaterthrushWilson's WarblerRed-winged BlackbirdRusty BlackbirdCommon Grackle*Pine GrosbeakGray-crowned Rosy FinchHoary RedpollCommon RedpoolRed CrossbillWhite-winged CrossbillSavannah SparrowSlate-colored JuncoLeast S<strong>and</strong>piperDunlinShort-billed DowitcherLong-billed DowitcherSemipalmated S<strong>and</strong>piperHudsonian GodwitS<strong>and</strong>erlingRed PhalaropeNor<strong>the</strong>rn PhalaropePomarine JaegerParas it ic JaegerLong-tailed JaegerSkua*Glaucous GullGlaucous-winged GullHerring GullMew GullBonapart'sGullBlack-legged KittiwakeSabine's GullArctic TernAleutian TernCommon MurreThick-billed MurrePigeon GuillemotMarbled MurreletKittlitz's MurreletAncient MurreletCassin's AukletParakeet AukletRhinoceros AukletTufted PuffinScreech Owl*Great Horned OwlSnowy OwlHawk OwlGreat Grey OwlShort-eared OwlBoreal OwlAnnals Hummingbird*Rufous HummingbirdBelted KingfisherYellow-shafted FlickerHairy WoodpeckerDowny WoodpeckerNor<strong>the</strong>rn Three-toed WoodpeckerRed-shafted FlickerSay's PhoebeWestern Flycatcher
Oregon JuncoTree SparrowWhite-crowned SparrowFox SparrowLincoln's SparrowSong SparrowLapl<strong>and</strong> LongspurSnow BuntingWestern Wood PeeweeOlive-sided FlycatcherViolet-green SwallowTree SwallowBank SwallowBarn Swa 11 owCliff Swallow
TABLE 7All i son Creek EscapementYEAR-.--~.. -.Pink Salmon1960 100.-.--- ~---.--.EscapementChum Salmon1961 7501962 560 5801963 -0- 2,6601964 -0- 1901965 -0- -0-1966 -0- -0-1969 500-1,0001971 3001973 25Source:ADF&G.Note: Allison Creek was not regularly checked <strong>for</strong> escapement by Fish <strong>and</strong>Game but only as time <strong>and</strong> funding allowed. A year which shows zeroescapement does not necessarily mean that no fish spawned that year, itonly indicates that at <strong>the</strong> time it was checked <strong>the</strong>re were no fish present.
UNITED STf-lrESDEPARTMENT OF THE INTERIORFISH AND WILDLIFF SERVICE1011 E. TUDOr: H[).IN FH:Pl.Y REFf:~1 TO (8£)M,CHORAGE, ALASKA 99503(9071 276-30:00Colonel Lee R. Nunn, District EngineerAttention: Mr. Jay SoperDepartment of <strong>the</strong> ArmyAlaska District, Corps of EngineersP.O. Box 7002Anchorage, Alaska 99510.:.Dear Colonel Nunn:This responds to your letter of Novemher 9, 1979, requesting a list ofthreatened <strong>and</strong> endangered species H'hich may be affected by constructionof a hydroelectric power facility on Allison Creek near <strong>Valdez</strong>, Alaska.Based on <strong>the</strong> best in<strong>for</strong>mation currently available to us, no listed orproposed threatened or endangered species <strong>for</strong> ,,,hich <strong>the</strong> Fish <strong>and</strong> WildlifeService (FWS) has responsibility, are known to occur in <strong>the</strong> <strong>Valdez</strong>area. There<strong>for</strong>e, you may conclude that <strong>the</strong> hydroelectric power projecton Allison Creek will have no affect on those species, <strong>and</strong> that <strong>for</strong>malSection 7 consultation ,,,ith <strong>the</strong> FWS is not required.Protection of threatened <strong>and</strong> endangered marine mammals is <strong>the</strong> responsibilityof <strong>the</strong> National Marine Fisheries Service (m1FS). Hhereas AllisonCreek is a tributary to <strong>Valdez</strong> Arm, you may \I1ish to contact <strong>the</strong> NMFS todetermine potential effects of <strong>the</strong> project on those species.New in<strong>for</strong>mation indicating <strong>the</strong> presence of currently listed threatenedor endangered species administered by <strong>the</strong> n~s or <strong>the</strong> listing of newspecies which might be affected by <strong>the</strong> proposed project will requirereinitiation of <strong>the</strong> consultation process.Thank you <strong>for</strong> your concern <strong>for</strong> endangered species. Please contact us ifyou have questions or if we can be of fur<strong>the</strong>r assistance.Sincerely, "I.. ~/I?/~AS~rea DirectorIII I
1. PROJECT DESCRIPTION:Section 404(b)(1) EvaluationSouthcentral Railbelt<strong>Valdez</strong> InterimThe proposed project consists of a lake tap at Allison Lake, power tunnel,above ground penstock, powerhouse, <strong>and</strong> a transmission line intertie with<strong>the</strong> Solomon Gulch Substation. Approximately 5 cubic yards of riprap wouldbe placed in Allison Creek below <strong>the</strong> tailrace as an erosion protectionmeasure. Five cubic yards of riprap would also be placed below <strong>the</strong>tailrace to Port <strong>Valdez</strong> at <strong>the</strong> MHI~~ mark <strong>for</strong> erosion protection.2. AREA DESCRIPTION:a. Physical: The area impacted at Port <strong>Valdez</strong> would be approximately90 square fe8t of rock <strong>and</strong> cobble wi thin <strong>the</strong> intertidal area near <strong>the</strong>mouth of Allison Creek. Five cubic yards of riprap would be placed inAllison Creck above <strong>the</strong> existing weir. The impacted area is wi thin <strong>the</strong>banks of <strong>the</strong> stream on a rock <strong>and</strong> cobble area.b. Biological: The proposed disposal site in Port <strong>Valdez</strong> would be at<strong>the</strong> MHI-tN level which supports little attached vegetation <strong>and</strong> minorpopulations of benthic organisms. The Allison Creek disposal site isabove any salmonid spawning or rearing <strong>and</strong> is in an area where <strong>the</strong>velocity is high. The area contains typical algae <strong>and</strong> juvenileinvertebrate species associated with short, glacial fed, coastal streams.3. CONFORMITY WITH GUIDELINES:Evaluation Under 404(b)(1) Guidelines (40 CFR 230)a. Physical Effects: The direct ~hysical impact of this dischargeinvolves <strong>the</strong> elimination of 20 square yards of a water resource from <strong>the</strong>physical, chemical, <strong>and</strong> biological systems. The work is exempt fromtesting since <strong>the</strong> material to be used does not represent a possible sourceof contamination to <strong>the</strong> surrounding aquatic ecosystem.b. Water Column Effects: Turbidity would increase during workoperations. Accordingl \f, light penetration would be decreased. Turbiditycaused by runoff at <strong>the</strong> project site would not be significant. Highnutrient concentrations or toxic materials would not be discharged into<strong>the</strong> water column. The water column, as a whole, would not besignificantly impacted.
c. Effects on Benthos: The proposed discharge would eliminate aportion of <strong>the</strong> benthic community due to smo<strong>the</strong>ring from sedimentation. Itis likely that this community will recolonize <strong>the</strong> project site. Overall,<strong>the</strong> benthos would not be adversely impacted.d. Chemical-Biological Effects: The material to be discharged wouldnot significantly impact <strong>the</strong> chemical integrity of <strong>the</strong> aquatic ecosystem.The project site is not located in a biologically sensitive area. Thus,<strong>the</strong> chemical-biological system would not be significantly disrupted.4. GENERAL CONSIDERATIONS AND OBJECTIVES:a. This project would not significantly disrupt <strong>the</strong> integrity of <strong>the</strong>aquatic ecosystem.b. The food chain would not be significantly disrupted by <strong>the</strong>proposed work.c. This activity would not inhibit <strong>the</strong> movement of fauna.d. The filling activity would not destroy wetl<strong>and</strong>s having significantfunctions in maintenance of water quality.e. The filling activity would not destroy wetl<strong>and</strong> areas that retainnatural high or flood waters.f. The proposed work would be conducted in a manner so as to minimizeturbidity.g. The activity would not degrade aes<strong>the</strong>tic, recreational, <strong>and</strong>economic values.5. DEGRADATION OF WATER USES:a. The discharge is not in <strong>the</strong> vicinity of a public water supplyintake.b. The discharge is not in an area of concentrated shellfishproduction.c. The discharge would not disrupt fish spawning <strong>and</strong> nursery areas.d. The discharge has been designed to minimize impact on wildlife.e. The discharge would not adversely impact recreation areas or wateroriented recreation.2
6. ENDANGERED AND THREATENED SPECIES:No endangered or threatened flora <strong>and</strong> fauna, as listed in <strong>the</strong> FederalRegister, Vol. 44, No. 12, 17 January 1979, "List of Endangered <strong>and</strong>Threatened Wildlife <strong>and</strong> Plants" <strong>and</strong> subsequent updates, would be impactedby <strong>the</strong> proposed project. No critical habitat would be destroyed ormodi fied which would jeopardize <strong>the</strong> continued existence of an endangeredor threatened species.7. WETLANDS:Wetl<strong>and</strong> species impacted by this proposal include: rockweed (Fucusdisticus) <strong>and</strong> coraline algae. The project site is not considered to be aproductively vegetated wetl<strong>and</strong>. This project would not adversely impact<strong>the</strong> wetl<strong>and</strong> resource.8. SUBMERGED VEGETATION:The project site is vegetated with submerged vegetation. The followingspecies are located on <strong>the</strong> site: rockweed <strong>and</strong> coraline algae. Thisproject would not adversely impact this wetl<strong>and</strong> resource.9. APPROPRIATE ALTERNATIVES:a. No Action: The no action alternative may cause erosion <strong>and</strong> scourin both Port <strong>Valdez</strong> <strong>and</strong> Allison Creek. This alternative would not beenvironmentally acceptable.b. Reduced Fill Size: The fill is at <strong>the</strong> smallest practicable size.c. Modi fy Fill Location or Dimensions: The location is below <strong>the</strong>outfall at <strong>the</strong> MHHN level <strong>and</strong> cannot be located at any o<strong>the</strong>r site.10. WATER DEPENDENCY:The purpose of <strong>the</strong> project is water dependent or water oriented.activities taking place on <strong>the</strong> fill are water oriented in nature.is a water dependent need <strong>for</strong> <strong>the</strong> proposed project.11. DISPOSAL SITE SELECTION:AllThereThe disposal site has been selected to be <strong>the</strong> least environmentallydamaging. There are no alternate disposal sites available which are lessenvironmentally sensitive <strong>and</strong> still feasible <strong>for</strong> <strong>the</strong> proposed project.The disposal site has been limited to its smallest practical size.3
An ecological evalu~)tion as required by Section 40 LI(b) (1) of <strong>the</strong> Clean\~() ler Act has bO::cn made following <strong>the</strong> evaluation guidance in 40 CFR2~XJ. 5. ApprofJI iate measures have been identified <strong>and</strong> incorporated in <strong>the</strong>proposed plan to minimize adverse effects on <strong>the</strong> aquatic <strong>and</strong> wetl<strong>and</strong>(~Co~;ystems as a result of <strong>the</strong> discharge. Consideration has been given to<strong>the</strong> need <strong>for</strong> <strong>the</strong> proposed activity, <strong>the</strong> availability of alternate sites<strong>and</strong> methods of disposal that are less damaging to <strong>the</strong> environment, <strong>and</strong>such water quality st<strong>and</strong>ards as are appropriate <strong>and</strong> applicable by law.Impacts on wetl<strong>and</strong>s at <strong>the</strong> site would be unavoidable. Approximately lessthan one-ten th of an acre of aquatic habitat would be eliminated. Allactivities upon <strong>the</strong> fill would be water oriented or dependent. There areno o<strong>the</strong>r viable or <strong>for</strong>eseeable practical alternatives.The discharge site does con<strong>for</strong>m with <strong>the</strong> Guidelines. As such, <strong>the</strong>discharge site can be specified through <strong>the</strong> application of Section404(b)(1) of <strong>the</strong> Federal Water Pollution Control Act of 1972 as amended by<strong>the</strong> Clean Water Act of 1977. .
APPENDIX FCULTURAL RESOURCES
JAY S. HAMMO~D. GOVERNORDEPARTMENr OF lW&nJRAL RESOIJRCESDIVISION OF PARKS619 WAREHOUSE DR., SUITE 210ANCHORAGE, ALASKA 99601PHONE: 2744676November 12, 1980Re: 1130-2-1Col. L. R. NunnCorps of EngineersP. O. Box 7002Anchorage, Alaska 99510Subject:<strong>Electrical</strong> <strong>Power</strong> <strong>for</strong> <strong>Valdez</strong>, etc.Dear Col. Nunn:We have reviewed <strong>the</strong> subject proposal <strong>and</strong> would like to offer <strong>the</strong> followingconnnents:STATE HISTORIC PRESERVATION OFFICERNo probable impacts. Should cultural resources be found during <strong>the</strong>construction, we request that <strong>the</strong> project engineer halt all work whichmay disturb such resources & contact us innnediately.The proposed action is consistent with <strong>the</strong> Alaska Coastal ManagementProgram's historic, prehistoric <strong>and</strong> archaeological resources st<strong>and</strong>ard.i 7)A-;~ f/~~ l .. I~ ~i~L piDouglas?R. Reger, D~putyState Historic Preservation OfficerSTATE PARK PLANNINGPage 20 of <strong>the</strong> EIS states that consideration was given to <strong>the</strong> possibilityof enhancing or creating recreational values, yet <strong>the</strong>re is littletext given to <strong>the</strong> recreational <strong>and</strong> scenic values or opportunities.These elements appear to be dismissed due to <strong>the</strong> restricted l<strong>and</strong> usecontrol <strong>and</strong> existing site modifications.
Col. L. R. NunnNovember 12, 1980Page 2LWCFNo connnent.Sincerely,~~~.{~£,\' ~--~'.~ Chip DennerleinDirectorCD:mlb
CULTURAL RESOURCESAboriginal Setting: Prince William Sound is <strong>the</strong> home of <strong>the</strong> ChugachEskimo, or Cuatit, as <strong>the</strong>y call <strong>the</strong>mselves. The Chugach Range <strong>and</strong> <strong>the</strong>mountains of Kenai Peninsula <strong>for</strong>m material boundaries between <strong>the</strong> Chugach<strong>and</strong> <strong>the</strong> Tanana Athabaskans of Cook Inlet <strong>and</strong> o<strong>the</strong>r Athabaskan groups in<strong>the</strong> interior.The Chugach hunted primari ly marine ra<strong>the</strong>r than 1 <strong>and</strong> animals. Present in<strong>the</strong> sound were harbor seal, fur s~al, sea otter, sea lion, <strong>and</strong> belugawhale. Fish of all kinds were abundant. In <strong>the</strong> 1 ate winter <strong>and</strong> earlyspring when bad wea<strong>the</strong>r prevented hunting, <strong>the</strong> natives relied on shellfish.This is evidenced by <strong>the</strong> accumulation of shells that mark almostevery village site or camping spot.Federica de Laguna surveyed Prince William Sound <strong>and</strong> Cook Inlet during<strong>the</strong> summers of 1930 through 1933. She was able to reconstruct much of<strong>the</strong> Chuqach material culture as it must have been within 500 or so yearspreceeding first contact with <strong>the</strong> white man. The following is a summaryof her conclusions.Archeological evidence indicated <strong>the</strong> population of <strong>the</strong> sound was verysmall. There were long stretches of shoreline where no sites werereported or observed. The material evidence shows that <strong>the</strong>y had anelaborate social <strong>and</strong> religious culture. The Chugach were impressivecraftsmen in woodworking, evidenced by a rich asortment of tools,especially common was <strong>the</strong> heavy splitting adz, present in some of <strong>the</strong>oldest sites. There was a reliance on chipped flint <strong>and</strong> chert that weregrinded on wet stones. Native copper was worked by hammering, heating,<strong>and</strong> grinding <strong>for</strong> weapons, needles, spear points, <strong>and</strong> decorative uses.Village sites were usually on <strong>the</strong> shore, usually in protected waters, <strong>for</strong>travel was almost all by sea. The village was frequently placed in astrategic position with a view of <strong>the</strong> approaches. This seems to be amore important consideration than a neighborhood of a salmon stream or arich bead of shellfish. Thus, it is thought, no permanent villages werelocated at <strong>the</strong> heads of bays in spite of <strong>the</strong> presence of some of <strong>the</strong> bestsalmon streams. Temporary summer camps were set up at fish streamsduring <strong>the</strong> salmon runs. Small rocky isl<strong>and</strong>s or cliffs which were difficultto climb were used as refuge places or <strong>for</strong>ts. Hunting camps wereset up on small isl<strong>and</strong>s <strong>for</strong> <strong>the</strong> pursuit of sea mammals. Rock shelters orcaves near <strong>the</strong> shore might be used as camping places <strong>and</strong> burial grounds<strong>and</strong> <strong>the</strong> rock walls of such sllelters were sometimes used <strong>for</strong> pictographs.There were no permanent settlements in <strong>the</strong> interior.The dwell ings of <strong>the</strong> Chugach were generally underground with spruce bark<strong>for</strong> roofing, although <strong>the</strong>re is evidence of wood plank houses aboveground. There is also evidence of <strong>the</strong> Chugach using bath houses.F -1
The closest site investigated by De Laguna to <strong>the</strong> <strong>Valdez</strong> area was GalenaBiiY. It was reportedly a fish camp. There '/Jere two semi-subterraneanhouses which have since washed away. The only trace of early occupationwas a 2-foot layer of humus <strong>and</strong> fire cracked rock at a s<strong>and</strong> beach. Aspitting adz, a broken pestle <strong>and</strong> an unfinished hunting lamp came from abank near tl'lO existing cabins.A cultural resou~ce survey conducted in connection with <strong>the</strong> proposedright-of-way <strong>for</strong> <strong>the</strong> Alyeska pipeline checked out <strong>the</strong> area being cleared<strong>for</strong> storage tanks. This area is located just south of <strong>the</strong> remainingbuildings of old Fort Liscum which is in <strong>the</strong> affected area of AllisonCreek hydropower project. Th e 0 pi ni on was t he a rea conta i ned 1 itt 1 epromise of archeological value (Workman 1970).Historical SettingThe Spaniards are credited with <strong>the</strong> initial discovery of <strong>Valdez</strong> Bay byDon Salvador Fidalgo in 1790. He named <strong>the</strong> bay <strong>for</strong> a fellow navalofficer Antonio Valdes y Basan. In 1884, Captain William RalphAbercrombie of <strong>the</strong> U~S. Army surveyed a portage route from <strong>the</strong> interiorto Port Va 1 del;Around 1889, <strong>the</strong> early beginnings of what 10 years 1 ater was to be abooming stamped town began to make an appearance at Port <strong>Valdez</strong>. Earlyminers came to seek routes leading to <strong>the</strong>ir <strong>for</strong>tune in mineral wealth.The discovery of gold in <strong>the</strong> interior established <strong>Valdez</strong> as one of <strong>the</strong>three Alaskan routes to <strong>the</strong> gold fields. There was prospecting donearound <strong>Valdez</strong>, also. The streamer <strong>and</strong> transport companies were making a<strong>for</strong>tune bringing men to <strong>the</strong> port towns (Wartan 1972).Captain Abercrombie was responsible <strong>for</strong> establishing a military road toFort Egbert in Eagle, exploring <strong>the</strong> <strong>Copper</strong> <strong>River</strong> valley <strong>and</strong> maintainingsome order in <strong>Valdez</strong>. Fort Liscom, across <strong>the</strong> east end of Port <strong>Valdez</strong>"'Ias established <strong>for</strong> this purpose in 1900. Company C, 7th Infantrya r r i ve d tog a r r i son For t Lis com 0 nAp r i 1 29 , 19 00 . ( Arm yin A 1 ask a1972). Fort: Liscom was also <strong>the</strong> base of operations <strong>for</strong> <strong>the</strong> WashingtonDC-Alaska military cable <strong>and</strong> telegraph system connecting Alaska to <strong>the</strong>lower 48 via Canada.The follol'ling is taken from a report written by C.I"1. Brown <strong>for</strong> <strong>the</strong> Stateof Alaska, Department of Natural Resources, 1975.Of <strong>the</strong> 1,600 acres which comprised <strong>the</strong> Fort Liscum military reservation(reduced to 660 acres in 1903) <strong>the</strong> post buildings occupied only a fewacres. The buildings were located closely to one ano<strong>the</strong>r, with plankwalks linking most. Officers' quarters were arranged in a row, <strong>for</strong>ming<strong>the</strong> western boundary of tIle parade ground. The barracks, gymnasium, postexchange, hospital, <strong>and</strong> guardhouse <strong>for</strong>med <strong>the</strong> eastern <strong>and</strong> sou<strong>the</strong>rnboundaries of <strong>the</strong> parade ground. Large structures, such as <strong>the</strong> hospital<strong>and</strong> barracks, were located some distance from <strong>the</strong> shore, while smallerhuildings such as <strong>the</strong> sheds <strong>and</strong> storehouses, were placed nearer to <strong>the</strong>F-2
shorp--probablv to facilitate easier transport of supplies <strong>and</strong> equipmentfrom <strong>the</strong> l,o,iharf. Civilian quarters <strong>and</strong> stables <strong>for</strong>med <strong>the</strong>ir own complex.a short distance west of <strong>the</strong> post.Both permanent <strong>and</strong> portable buildings were constructed at Fort Liscum.Nearly all of <strong>the</strong> permanent buildings, such as <strong>the</strong> barracks, officers 'quarters, offices, amusemet hall, hospital, etc., were occupied in 1900;<strong>the</strong>y were frame structures with wood foundations <strong>and</strong> corrugated ironroofs. Additional permanent structures were constructed in 1904-05 when<strong>the</strong> post garrison was increased to two companies; <strong>the</strong>se buildingw wereessentially <strong>the</strong> same in architectural style as earlier structures. Theexception was <strong>the</strong> comm<strong>and</strong>ing officer's quarters, <strong>the</strong> only building atFort Liscum with concrete foundations, basement, <strong>and</strong> closed porch. Mostportable buildings at Fort Liscum were assembled from sheets of corruqatediron in 1901; many had boarded interiors, while o<strong>the</strong>rs were metalshells.For a community of its size. Fort Liscum was provided with a remarkablenumber of modern facilities. The post had its own telephone system,connecting all of <strong>the</strong> offices <strong>and</strong> several officer's quarters. The"centra 1" was located in <strong>the</strong> guardhouse, <strong>and</strong> operated by a member of <strong>the</strong>guard on duty. The post also had a telegraph office which, by means of asubmarine cable to <strong>Valdez</strong>, allmved communications with almost any pointin Alaska <strong>and</strong> <strong>the</strong> contiguous United States. Also, <strong>the</strong> post had a governmentlaunch, which made trips to <strong>Valdez</strong> on a regular basis. Fort LiscumW(jS not an isolated post in <strong>the</strong> wi lderness.In <strong>the</strong> early 1900 ' s, water was obtained primarily from a barrel sunk into<strong>the</strong> bed near <strong>the</strong> mouth of Allison Creek. Water \',as dipped from <strong>the</strong>barrel, <strong>and</strong> <strong>the</strong>n del ivered by water cart to <strong>the</strong> post. Thi s arduousmethod was modified somewhat in early 1903 when a small pipe wasinstalled to conduct water from Allison Creek to <strong>the</strong> company <strong>and</strong> hospitalkitchens, <strong>and</strong> bath house. Water <strong>for</strong> <strong>the</strong> officers ' quarters <strong>and</strong> barracklavatories was still obtained oy water cart. Late in 1903, however,Chief Surgeon of <strong>the</strong> Department of Columhia, Lieutenant-Colonel Wilcox,inspected <strong>the</strong> post <strong>and</strong> recommended <strong>the</strong> installation of modern water <strong>and</strong>sewage systems, noting also that Allison Creek might prove a source ofelectricity. In 1904, a dam was constructed to <strong>for</strong>m a reservoir, <strong>and</strong> atemporary pipe system installed. The next season, modern plumbingfacilities began to be installed.Completed in 1906, <strong>the</strong> new water system eliminated <strong>the</strong> old method oftransporting water by cart to post buildings <strong>and</strong> disposing garbage <strong>and</strong>refuse in dry earth closets. A 4-inch main conducted water from AllisonCreek to distributinq pipes with a pressure of about 75 pounds to <strong>the</strong>square inch. Barracks, officers ' quarters, <strong>the</strong> hospital, <strong>and</strong> o<strong>the</strong>rbuildings were thus equipped with enamel bath tubs <strong>and</strong> wash bowls, showerbaths in <strong>the</strong> barracks, wash sinks <strong>and</strong> closets. Two sewer mains drainedinto <strong>the</strong> bay near <strong>the</strong> limit of low tide. Fire hydrants were convenientlylocated about <strong>the</strong> grounds. Water pressure on <strong>the</strong> lower levels of <strong>the</strong>reservation was sufficient to throw two fair streams of water over two-F-3
story buildings. At higher points <strong>the</strong> results were not satisfactory. By1913, Ilydroelectric dams with an aggregate rated capacity of 700 horsepowerwere operating in Solomon Gulch, providing electricity <strong>for</strong> lights,heat, etc. <strong>for</strong> <strong>the</strong> post. (U.S. Geological Survey 1914: 78).For several years after Fort Liscum was ab<strong>and</strong>oned in 1922, <strong>the</strong> postbuildinqs remained vacant <strong>and</strong> unused. In 1925, however, President CalvinCoolidge ordered (No. 4131) <strong>the</strong> Fort Liscum military reservation placedunder <strong>the</strong> control of <strong>the</strong> Secretary of <strong>the</strong> Interior. Several privatecitizens <strong>the</strong>n applied <strong>for</strong> permission to acquire <strong>the</strong> buildings. In July1925, <strong>the</strong> Reverend T. Lavrischeff, Rector of Russian-Greek OrthodoxMission in Prince William Sound, requested <strong>the</strong> removal of any two buildingsat Fort Liscum, to Cordova where he intended to establish a "temple<strong>and</strong> church house (Lavrischeff 1925). The appl ication was denied. Theremust have been numerous requests to obtain <strong>the</strong> post buildings, <strong>for</strong> in1926 <strong>the</strong> district General L<strong>and</strong> Office was instructed to send an inspectorto Fort Liscum <strong>and</strong> appraise <strong>the</strong> improvements. In <strong>the</strong> meant-ime, tIleAlaska Road Commission was permitted to salvage several of <strong>the</strong> postbuildings (Nos. 20 <strong>and</strong> 30). (General L<strong>and</strong> Office, February 26, 1926)In early 1928 <strong>the</strong> General L<strong>and</strong> Office submitted an appraisal of <strong>the</strong> FortLiscum military reservation at $2.50 per acre. Each post building wasappraised separately, <strong>the</strong> inspector arriving at values considerably lessthan <strong>the</strong> original cost of tIle buildings--reportedly because <strong>the</strong> woodfoundations of most structures were in poor condition <strong>and</strong> because <strong>the</strong>roofs of some structures had collapsed. In any case, <strong>the</strong> reservation,buildings, <strong>and</strong> miscellaneous objects were valued at $2,288. (GeneralL<strong>and</strong> Office, January 9, 1928) Shortly <strong>the</strong>reafter, on October 2, 1928,<strong>the</strong> Alaska Road Commission received permission to salvage all buildingson <strong>the</strong> reservations. A special survey (U.S. Survey No. 1746) was made of<strong>the</strong> military reservation, with <strong>the</strong> Interior Department accepting <strong>the</strong> platon March 11, 1929. (General L<strong>and</strong> Office, February 8, 1934)The Alaska Road Commission moved a number of <strong>the</strong> post buildings to o<strong>the</strong>rsites; it also sold various buildinCjs to private citizens, who in turnsalvaged <strong>the</strong> structures. One of <strong>the</strong>se individuals, A.S. Day, applied <strong>for</strong>a homestead on <strong>the</strong> mi 1 itary reservation, <strong>and</strong> converted several <strong>for</strong>merpost buildings <strong>for</strong> use as a residence <strong>and</strong> salmon-canning operations. In<strong>the</strong> mid-1Q30's, <strong>the</strong> Interior Department cancelled U.S. Survey 1746 <strong>and</strong>Day acquired a patent to his homestead, 160 acres of USS 1746. Daysubsequently applied <strong>for</strong> permisstion to purchase an additional number ofbuildings. Referrinq to Day's application, a special agent to <strong>the</strong>District L<strong>and</strong> Office reported: "<strong>the</strong> Alaska Road Commission at <strong>Valdez</strong>stated that during <strong>the</strong> time <strong>the</strong> buildings were in <strong>the</strong>ir possession, <strong>the</strong>yhad removed everything <strong>the</strong>y considered to have any salvage value, <strong>and</strong>that what remained on <strong>the</strong> ground was not worth transporting to any o<strong>the</strong>rplace, <strong>and</strong> tlley as well stated that had not Mr. Day been right at FortLiscum, no o<strong>the</strong>r person in all probability would ever have offered $1 <strong>for</strong>what rem2ined." (General L<strong>and</strong> OffiCe, December 7, 1937) On December 7,1937, 11 buildings, <strong>the</strong> dock, water pipes, telegraph poles, etc. weresold to Day <strong>for</strong> $500.F-4
Today <strong>the</strong> Alyeska oil terminal encompasses <strong>the</strong> original site of FortLiscom.Impact InvestigationA cultural resource reconnaissance was conducted <strong>for</strong> <strong>the</strong> Allison Creekhydropower project.The 10catiCln tested <strong>for</strong> cultural remains was within <strong>the</strong> confines of <strong>the</strong>Alyeska Pipeline Terminal across <strong>Valdez</strong> Arm from <strong>the</strong> city of <strong>Valdez</strong>.The proposed pm"erhouse site area was specifically tested.The area is reached from a short gravel road on <strong>the</strong> west side of AllisonCreek that leads to an exist-ing pUlTlphouse. The general terrain slopes to<strong>the</strong> north yet <strong>the</strong> area in question has been flattened <strong>and</strong> graded. It ispresently a material source, approximate 50 meters in diameter.The edges of this gravel pit seemed to have been disturbed at some pointin <strong>the</strong> past based on <strong>the</strong> evidence of <strong>the</strong> vegetation which consists of lowgrowing alders <strong>and</strong> o<strong>the</strong>r brush. The cleared area was visually inspected<strong>for</strong> cultural remains, because test pits were useless in <strong>the</strong> gravelsubstratum. A number of rusted metal parts were noted scattered throughout<strong>the</strong> gravel pit. It was difficult to ascertain just how old <strong>the</strong>ywere. On <strong>the</strong> western side of <strong>the</strong> pit several large chunks of concretethat seemed old <strong>and</strong> eroded \'Jere found. The gravel incorporated into<strong>the</strong>se blocks was not of uni<strong>for</strong>m size as it is in more recent concrete;however, it is probably pre-World War II. The concrete <strong>and</strong> metal partsmay be <strong>the</strong> remains from Fort Liscum. Three test pits were dug on <strong>the</strong>alder covered hillside to <strong>the</strong> south of <strong>the</strong> gravel pit. Bedrock was onlyan inch or two below <strong>the</strong> surface so natural exposures were looked atinstead of digging test pits. No cultural remains were found.Cultural resource clearence is recommended <strong>for</strong> <strong>the</strong> proposed powerhousesite. In <strong>the</strong> unlikely event that any unknown cultural resources arediscovered during construction activities <strong>the</strong> Corps of Engineers CulturalResource Coordinator wi 11 be contacted.No properties included in or that may be eligible <strong>for</strong> inclusion in <strong>the</strong>National Register of Historic Places are located within <strong>the</strong> area ofenvironmental impact, <strong>and</strong> this undertaking will not affect any suchproperty.The latest edition of <strong>the</strong> National Register <strong>and</strong> monthly supplementscontained in <strong>the</strong> Federal Register have been consulted.F-5
APPENDIX GFOUNDATIONS AND MATERIALS
APPENDIX GFOUNDATIONS AND MATERIALSTABLE OF CONTENTSItemINTRODUCTIONLOCAL LINEAR FEATURESSEISMICITYLAKE TAPPOWER TUNNELPOWERHOUSECOMMENTSADDI TIONAL WORKBORING LOGSPageG-lG-lG-lG-lG-2G-2G-3G-3G-4
INTRODUCTIONAllison Lake is located on <strong>the</strong> south side of Port <strong>Valdez</strong>, directly acrossfrom <strong>the</strong> city of <strong>Valdez</strong>, filling approximately one-half of a glacier <strong>for</strong>medhanging valley. The area is underlain by <strong>the</strong> Late Cretaceous <strong>Valdez</strong> Group, aseries of metagraywackes, shales <strong>and</strong> slates with occasional beds of pillowbasalt. This is indicative of a rapid, unsorted deposition in an oceanenvironment. The beds are highly disturbed <strong>and</strong> no regional structure has yetbeen defined.LOCAL LINEAR FEATURESAerial photographs <strong>and</strong> regional mapping show three strong lineaments nearAllison Lake. They are: Jack Bay, east-west leg on <strong>the</strong> north side of JackBay, <strong>and</strong> an east-west trend approximately 1 mile north of Jack Bay. Thesefeatures have been mapped as faults by <strong>the</strong> U.S.G.S. (Bulletin 989-E dated1954) .SEISMICITYAllison Lake is located in Seismic Zone 4, approximately 46 miles east of<strong>the</strong> epicenter of tne 27 March 1964 earthquake. The major source of seismicactivity in this region is <strong>the</strong> relative motion of <strong>the</strong> Pacific <strong>and</strong> NorthAmerican plates. The Pacific plate is plunging under <strong>the</strong> North American plate<strong>and</strong> it is active along <strong>the</strong> Benioff Zone which controls <strong>the</strong> tectonic setting of<strong>the</strong> area.Prior to 1964, <strong>the</strong>re were approximately 70 magnitude 5, or greater,earthquakes recorded in <strong>the</strong> <strong>Valdez</strong> vicinity. Magnitude 5 earthquakes haveaveraged approximately one per year in recent years. Submarine l<strong>and</strong>slideshave been associated with several of <strong>the</strong> larger events. Magnitude 8 orgreater events have occurred three times this century, <strong>the</strong>re<strong>for</strong>e <strong>the</strong>re is agood probability of a large earthquake occurring during <strong>the</strong> life of <strong>the</strong>project. Maximum Credible Earthquake (MCE) should be tentatively set atmagnitude 8.5 at 40 miles.It is important to note that <strong>the</strong>re has been no evidence of rupture in areabedrock. Most destruction in Port <strong>Valdez</strong> has been caused by tsunami <strong>and</strong>submarine mass movement of unconsolidated Lowe <strong>River</strong> delta deposits.LAKE TAPAllison Lake valley has <strong>the</strong> very typical "U" shape of glacier scouring.Sidewalls are extremely steep metagraywacke cliffs with extensive talusdeposits <strong>and</strong> fans at lake elevation. Lake bottom slope changes indicate talusslopes continuing to <strong>the</strong> bottom. DH-l, drilled near <strong>the</strong> original taplocation, went through 33 feet of pourous s<strong>and</strong>y boulders. Metagraywackebedrock is highly fractured to 70 feet <strong>and</strong> from 130 feet to 168 feet. A zoneof liqht to moderate fracture extends from 70 feet to 130 feet <strong>and</strong> from 168feet to <strong>the</strong> bottom of <strong>the</strong> hole at 176 feet. Artesian water was encountered atapproximately 110 feet. Shutoff pressure of 50 psi indicate approximatelyG-l
100 psi pressure at depth. The source is located in or above <strong>the</strong> cliffsbordering <strong>the</strong> lake. Precisely locating <strong>the</strong> tap will require underwaterphotography <strong>and</strong> possible use of diver inspection. Additional drilling will berequired during <strong>the</strong> General Design Memor<strong>and</strong>um phase to determine exactoverburden thickness <strong>and</strong> rock characteristics. Artesian conditionsencountered in <strong>the</strong> vicinity could pose a problem during construction <strong>and</strong> willrequire fur<strong>the</strong>r investigation.POWER TUNNELAs noted, Allison Lake sits in a glacier scoured valley. The lake outletis in what appears to be deep till deposits. DH-2, located approximately4,000 feet downstream of <strong>the</strong> lake outlet, did not penetrate bedrock at a depthof 64 feet. Assuming a relatively flat rock line, bedrock may be at anelevation between 1,150 <strong>and</strong> 1,200, 170 to 220 feet below lake elevation. Thisis based on <strong>the</strong> elevation of <strong>the</strong> falls downstream of <strong>the</strong> outlet. DH-2 wasdrilled from an elevation of 1,350 feet, 1,200 feet east of metagraywackecliffs. This rein<strong>for</strong>ces <strong>the</strong> suspicion of deep tills in <strong>the</strong> valley.Plans call <strong>for</strong> a power tunnel invert elevation of 1,050 feet. The tunnelhas been alined to be under <strong>the</strong> metagraywacke cliffs to assure that it waslocated in rock. Additional postauthorization explorations <strong>and</strong> studies maylocate suitable rock in <strong>the</strong> valley floor which would permit a shorter tunnelalinement. The cost estimate <strong>for</strong> <strong>the</strong> proposed tunnel was based on an 8-footunlined horseshoe tunnel <strong>for</strong> 50 percent of <strong>the</strong> length <strong>and</strong> a 6-foot diameterconcrete lined circular tunnel <strong>for</strong> 50 percent of <strong>the</strong> length. Duringpostauthorization studies, additional drilling will be done to determine <strong>the</strong>extent of overburden <strong>and</strong> condition of underlying rock.POWERHOUSEOne hole DH-3, has been drilled in <strong>the</strong> lower powerhouse area, penetrating69 feet of Allison Creek delta deposits be<strong>for</strong>e encountering moderately tohighly fractured metagraywacke. While <strong>the</strong> delta deposits would make goodfoundation material <strong>for</strong> a small surface powerp1ant, <strong>the</strong> area may be subject totsunami below an elevation of +85 MLLW. During slide induced sea waves, runupat Anderson bay, 7 miles west of Allison Creek, was measured at 70 feet.Measurements at Shoup Bay (Cliff Mine) on <strong>the</strong> north side of <strong>the</strong> arm show arunup of 170 feet. No runup measurements were made at Jackson Point orFort Liscum, but <strong>the</strong> cannery at Jackson Point floated away.Maximum high tide in Port <strong>Valdez</strong> is approximately +14 MLLW; <strong>the</strong>re<strong>for</strong>e, toinclude <strong>the</strong> 70-foot runup at Anderson Bay <strong>the</strong> powerhouse elevation should beat least +85 MLLW. For this reason <strong>the</strong> upper powerhouse, located atapproximately +100 MLLW was selected. Additional reconnaissance <strong>and</strong>explorations will be required <strong>for</strong> final powerhouse location duringpostauthorization studies.G-2
COMMEIHSPermeability of <strong>the</strong> glacial till <strong>and</strong> <strong>the</strong> artesion water will have to beassessed after additional drilling <strong>and</strong> e~ploration~ to determine <strong>the</strong> extent of<strong>and</strong> solution to <strong>the</strong> problem.ADDITIONAL WORKDue to preliminary nature of <strong>the</strong> work per<strong>for</strong>med to date, additionaldrilling <strong>and</strong> regional <strong>and</strong> local mapping will have to be done during <strong>the</strong>General Design Memor<strong>and</strong>um phase. The particular questions to be addressedwi 11 be:a. Condition <strong>and</strong> permeability of bedrock on proposed tunnel alinements <strong>for</strong>lining requirements.b. Depth <strong>and</strong> permeability of tills.c. Source of artesian water in lake tap area.G-3
-1'~~ ·/~-IU-'J\·-----'~r-.-;-,~ __ .. 3t!;tiv.ll:£~onILLOAT£9' START 22 ~) 1978~. .8apW·j.17!1.8' O£,.TH O'F OVEnOUROVi 33.2' OIAM .• tQ.I•rz- •.nOCK CORE RECOV£r.EO 138.3' 'R. ft£""..,D~I~LL~E~O ____ 1'_12_._6_' +-~~~~~~~ ________ ~ __ ~M-~~ _____NJGLE f'RO:'-A VERT. 00 AtR'.1\ITH mo:'J NOilT.1 1M.-r------.-----------"----h.----------=---1tOIST'SICES: VERTICAL. .. • HI ... l ./·:" .15.0'. '.... :~. Bouldery s<strong>and</strong>; s<strong>and</strong> fine to·b· ::. medium, boulders to 1 foot diAmeter()ye~'burden I!JIIftt)We ClOnIIwt'- .... f>. of boulder fniJuiliiu. _:~.::.::.:~- '::6''-0.:, •. ".':27.5'~A 0 ::;anay DOIHoers; OOUloors t;o ;t reet3p_ :&".~ in diameter _1347 ?J:~ Top of Rock 1-'33=:,.2=--' _________"- :f):': Metagraywacke, noderat;ely wea<strong>the</strong>red C8J to 32.8'11.:. nodcratcly hard, fine to n~clhrn n~. rained. mas.
---s\.J~,f'~~.RYLOG.... ,~'-,.' -;: ~-.. it: ;, .,'":-i,,\"I,(,.),mlk \__._~cu.~EI 1. Of 1 1--1:LO LEN O. I ~I-:.! ~ __ SU:1rACs..~b~V,_1PROJECT Allison l:lko DRILL [d.TES I START 3 Oct 1978 COMPo 18 OctlU1K1CE?TII OF HOLE 61.0' ~"" O'F CVEnaUROEft 64.0' 0111:.1. OF 1t000E NX/Blt.1ROC'( OniLLEO 0.0' COR( RECOVEr.EO NA ~\ RECOVERY NAANt:;LE' FROM VERT. rP AZIrJUTH mo.J HOaTH !~D8Y. DAT!: !_." /#~?9OlSTAI'JCES I VERTICAL. i H~IZOHTAL. IIOIWttG£LFi. OEPTH DESCRIPTION Of k'ATERIALSLOGREMARKSJ:mtu _ 11." ~! Bouldery silt, red-browo. metagray-1~j,l, wacke boulders, non-plastic fines. 3---5' TIlL I j- ~~.:
~UMi'.'j~'~Y!lfGIOL~ N ..--Pa.w'rlnllsc1-'-- - f3~fJ 1Q~ ! l t11.[-3 AJ"C:l,. • SURr-A£:_~~V. I-.~',.--PRO·JECT All bOil Lake OmLL CV\TES I SlArrrf---.:t OI:t 1978 COMPo 19 (kt197; iOEPTIf OF HOLE 90.0' DEPTH Or OVEnaunOEN 68.S' DIAU. OF .. OLE NCQ •!noc" DrlILLED 21 2' COrtE RECOVEfiEO 21.2' % RECOVEnv .~ j....... .ANGLE FROM VERT. AZIMUTtI FROM r-!OiITti0° ..NA ~~D BY. DAT£. i---'DISTAtlCES' V:~.RTICAl t HC;'lIZONTAL. Val-- . Overburden; fill, (',obbley gravel .!CIlc)~()•• 0:!- '" D " 6.0' .-l~·· o. ,..~at r O.t!10 '"••• &)._.Gravel with minor cobbles,_:1,Igraywacke origin. Creek outwash0.0'-17' drilled with"'., Trioone bit·1-.~""].0."Jrr.17'.1, -.,i~~Boulders (95%) with 5% gravelf20 20' .:. RBoulder till, gray, occ .'O'•• 0% DI~'R 0' -23'-IClay layers <strong>and</strong> s<strong>and</strong> layers, lQ
i"'$U~,~~·"hV (00 .. ~-1J~.~,I,;-. no. Ilil··1Pf(OJECTAllison Lake!1--'1-. ~~ __ ~~ HOlE 111;.1:5 'AOCI< OfULLEOlt12.G'NlGlE FRO~1 VERT. 00r-------OISTA!.!£.ES: VERTICAL.pwn~conE nECOVEnfOAZ !:':Ntli FAO~A NonrHi HO:nZOttTAL.138.3'ELEV. I>~PTH LOG DESCRIPTION OF "'ATERIALSCCAE REMARKS.......,P'I'rV'I+-.?r+.-.-:--+~-----:-~~------t---t----------..~ lUU :','.:.:. Metagraywacke, IBID .;:.:A::·~ .,-::.~\\" .:': (j.:::ll'::':Sanci"itone, ] ight 1 Y wea <strong>the</strong> red , hard,medilun grained, light to rroderatefracture, grayNfl,."A nECOYEAY 97I rw~i) BY. DATl I,~ IJ~'"it109.0'.'1261 12 n - '~'.i\,~'1259 ~~~·~'·~H.~.~~~I~e~la~lgr~:a~w\'a~ck~e~I~B~I~J) __ ~~ ______ ~:: . .'.:': S<strong>and</strong>stOne, IBID. Dec. shale :rones.- ':..;:..:.:.: -..-.""....:-1251. - ..:-;-:-1249 1~~·~:~~·~~'~~·'-:~-A-~-l-~,-.t-·a--~v-ac-'k-e-'--II-ll-D-.------------'1247 . I .. .. • S<strong>and</strong>stone, mID.1237. -==_-- --14~ - _--.:.....::::-- =-:::: Sha 1 e, rroderalely weath('nxl,rroderate!ly harel, fill(! gl'ainecl,thin bedded, highly fractured--dark gray ._ {/:// S<strong>and</strong>stone, mID., highly fractured.1230 150 ::.'.:.:::;. ':-:(::i Metagraywacke, m!D., highlyclay cOlmun on12121204::'."4,::. fractured. ~linor- ·.'jii joinls..__ .::~~~·S:/1...-'·:,n;·_ -Shale, mID. Dec. SS. lay~rs'- =.==:_ .~ .. ,~:::. SS. 161.4' - 161.9' <strong>and</strong> 167.3' -_ - 167.8'- .. : .. ' .:17Q......:: '::-~ ,.:': S<strong>and</strong>stone!, IBID, Oce. Irctagr;I)"I'.
; ;; Ii; Z II;;; II til, ;;; : i;; ; IIAIi,Ii, I ' !jiil' "',,1'APPENDIX HFISH AND WILDLIFE COORDINATION ACT REPORTANDCORPS OF ENGINEERS RESPONSE
UNITED STATESDEPARTMENT OF THE II\lTERIORFISH AND WILDLIFE SERVICE1011 E. TUDOR RD.IN REPL YREFFR TO: ANCHORAGE, ALASKA 99503Co.lonel Lee R. Nunn.District Engineer. Alaska DistrictCorps of EngineersP.O. Box 7002Anchorage, Alaska 99510(907) 276-3800Dear Colonel Nunn:This correspondence transmits <strong>the</strong> final Coordination Act report of<strong>the</strong> Secretary of <strong>the</strong> Interior in accordance with <strong>the</strong> Fish <strong>and</strong> WildlifeCoordination Act, 48 stat. 401, as amended, <strong>for</strong> <strong>the</strong> proposed hydroelectricproject at Allison Lake near <strong>Valdez</strong>, Alaska. The U. S. Fish<strong>and</strong> Wildlife Service participation in this project was initiated onDecember 17, 1976, through a letter from <strong>the</strong> Corps of Engineers.Project design in<strong>for</strong>mation was obtained via a preliminary reportdated April, 1978, <strong>and</strong> through correspondence <strong>and</strong> conversations withCorps of Engineers personnel.In<strong>for</strong>mation provided is based on <strong>the</strong> analysis of field investigations,a . literature review, <strong>and</strong> discussions with personnel from <strong>the</strong>Alaska Department of Fish <strong>and</strong> Game, National Marine Fisheries Service,Corps of Engineers, <strong>the</strong> Heritage Conservation <strong>and</strong> Recreation Service,<strong>the</strong> City of <strong>Valdez</strong>, Alyeska Pipeline Service Company, <strong>and</strong> <strong>the</strong> U.S.Geological Survey. Review comments of <strong>the</strong> draft Coordination Actreport by <strong>the</strong> Alaska Department of Fish <strong>and</strong> Game <strong>and</strong> <strong>the</strong> Corps ofEngineers were considered in preparation of <strong>the</strong> final document.Should you or your staff have any questions concerning <strong>the</strong> contentsof <strong>the</strong> report, please contact <strong>the</strong> Western Alaska Ecological ServicesField Office at 271-4575. ,Sincerely,~r"·""f' Vc,.. V C
<strong>Valdez</strong> InterimSouthcentral Railbelt StudyAllison Lake Hydropower ProjectAlaskaFinal Fish <strong>and</strong> Wildlife Coordination Act ReportSubmitted to Alaska DistrictU.S. Army, Corps of Engineers·Anchorage, AlaskaPrepared by:Western Alaska Ecological Services Field OfficeU.S. Fish <strong>and</strong> Wildlife ServiceAnchorage, AlaskaMay 1980
TABLE OF CONTENTSPageINTRODUCTION ••••••••••••••••••••••••••••••••••••••••••••• 4AREA DESCRIPTION ••••••••••••••••••••••••••••••••••••••••• 4PROJECT DESCRIPTION •••••••••••••••••••••••••••••••••••••• 5RESOURCE INVENTORy ••••••••••••••••••••••••••••••••••••••• 5PROJECT IMPACTS •••••••••••••••••••••••••••••••••••••••••• 8DISCUSSION ••••••••••••••••••••••••••••••••••••••••••••••• 13RECOMMENDATIONS •••••••••••••••••••••••••••••••••••••••••• 17LITERATURE CITED ••••••••••••••••••••••••••••••••••••••••• 20APPENDIX A: SCIENTIFIC NAMES OF SPECIES ••••••••••••••••• 21APPENDIX B:TEMPERATURE DATA ••••••••••••••••••••••••••• 22a
LIST OF FIGURES AND TABLESPageFigure 1. Location <strong>and</strong> Vicinity Map SouthcentralRailbelt Study, <strong>Valdez</strong> Interim ••••••••••••••••••••• 4aFigure 2. <strong>Valdez</strong> Interim Report, SouthcentralRailbelt, Allison Lake, Topographic Plan •••••••••• SaFigure 3. <strong>Valdez</strong> Interim Report, SouthcentralRailbelt, Allison Creek, Topographic Plan •••••••••• 5bFigure 4. Seasonal Variation Population Densityof Harpacticus uniremis •••••••••••••••••••••••••••• 7aFigure 5. Bald Eagle Nest Sites,September 14 <strong>and</strong> 16, 1976 •••••••••••••••••••••••••• 8aTable IPrince William Sound Salmon Catch bySpecies in Numbers of Fish, 1970-79 •••••••••••••••• 6aTable II Value of Prince William Sound Salmon Catchin Pounds, <strong>and</strong> Value to Fishermen, 1970-79 ••••••••• 6bTable III Allison Creek Salmon Escapement Data ••••••••••••••• 6eITable IVAllison Creek - Discharge Measurements ••••••••••••• 8b
INTRODUCTIONThe Alaska District, Corps of Engineers (CE) is investigating <strong>the</strong>need <strong>for</strong> electrical energy at <strong>Valdez</strong>, Alaska <strong>and</strong> surrounding communities.In per<strong>for</strong>mance of this investigation, <strong>the</strong> CE analyzedvarious alternatives <strong>and</strong> has identified <strong>the</strong> hydropower potential ofAllison Lake. A detailed feasibility analysis of this project isoccurring. This final Coordination Act report is being provided to<strong>the</strong> CE by <strong>the</strong> Western Alaska Ecological Services Field Office of <strong>the</strong>U.S. Fish <strong>and</strong> Wildlife Service (FWS) to assist in that analysis.AREA DESCRIPTIONPort <strong>Valdez</strong> is located in <strong>the</strong> nor<strong>the</strong>asternmost extension of PrinceWilliam Sound, <strong>and</strong> is surrounded by <strong>the</strong> Chugach Mountains. The Portis a steep walled, glaciated fiord which is 3 miles wide <strong>and</strong> extendsin an east-west direction about 14 miles. At its western end <strong>the</strong>fiord bends to <strong>the</strong> southwest <strong>and</strong> constricts to a one mile width at<strong>Valdez</strong> Narrows be<strong>for</strong>e opening into <strong>the</strong> <strong>Valdez</strong> Arm of Prince WilliamSound. The steep mountain slopes extend beneath <strong>the</strong> water, <strong>for</strong>minga flat bottomed trough 400 to 800 feet deep. The shore of Port<strong>Valdez</strong> is steep <strong>and</strong> rocky, except where river deltas <strong>and</strong> glacialmoraines project into <strong>the</strong> fiord. Port <strong>Valdez</strong> is <strong>the</strong> nor<strong>the</strong>rnmostice-free seaport in Alaska, <strong>and</strong> provides <strong>the</strong> shortest <strong>and</strong> mostdirect route between tidewater <strong>and</strong> <strong>the</strong> interior of Alaska. Thesou<strong>the</strong>rn terminus of both <strong>the</strong> Trans-Alaska Pipeline <strong>and</strong> <strong>the</strong> RichardsonHighway are located in <strong>Valdez</strong>.Approximately 70 earthquakes with a magnitude of five or greater on<strong>the</strong> Richter scale have been reported at <strong>Valdez</strong> since 1898, <strong>and</strong> sevenearthquakes have equaled or exceeded a magnitude of eight. The 1964Alaska Earthquake <strong>and</strong> <strong>the</strong> attendant secondary impacts virtuallydestroyed <strong>the</strong> original town of <strong>Valdez</strong> on <strong>the</strong> Lowe <strong>River</strong> Delta. Anew' town has since been constructed on <strong>the</strong> delta of Mineral Creek on<strong>the</strong> north side of <strong>the</strong> bay.<strong>Valdez</strong> enjoys a maritime climate, characterized by heavy precipitation<strong>and</strong> relatively mild temperatures. The average annual precipitationis 59.31 inches, including 244 inches of snow. The averageannual temperature at sea level ranges from 39° to 43° F, with arecorded maximum of 87° F <strong>and</strong> a minimum of minus 28° F. Local windsare influenced by <strong>the</strong> Chugach Mountains <strong>and</strong> follow two distinctpatterns: (1) from October through March or April prevailing windsare from <strong>the</strong> nor<strong>the</strong>ast, <strong>and</strong> (2) from May through September prevailingwinds are from <strong>the</strong> southwest. Maximum sustained winds of 58m.p.h. <strong>and</strong> gusts of 115 m.p.h. have been recorded at <strong>Valdez</strong>.Allison Lake (Figure 1) is located near <strong>the</strong> Trans-Alaska Pipelineterminal in a glacial cirque lying in a north-south trend. A glacialmoraine extends across <strong>the</strong> valley <strong>and</strong> impounds <strong>the</strong> lake at a surfaceelevation of 1,367 feet. The lake is 1.25 miles long, approximately0.3 mile wide, <strong>and</strong> over 190 feet deep. Several small glaciers <strong>and</strong>permanent snowfields at <strong>the</strong> head of <strong>the</strong> valley drain into <strong>the</strong> lake.The outlet stream traverses a gentle gradient <strong>for</strong> approximately 0.6mile be<strong>for</strong>e descending steeply to sea level.
------------------------------------------------------------------------~IGLENNALLENVALDEZLOCATION A ~J () V I C I NIT Y M /\ Ps au THe [ N T R A L n A I L. [3 E L T S H; 0 Y----_._------_._--------------------_.--------------------3
PROJECT DESCRIPTIONThe proposed Allison Lake hydropower facility will consist of a laketap at 1,250 feet elevation, a rock tunnel from this level to 1,220feet elevation, <strong>and</strong> a 48~inch penstock reaching from <strong>the</strong> lake tapthrough <strong>the</strong> rock tunnel to one of <strong>the</strong> two proposed powerhouse alternatives(Figures 2 <strong>and</strong> 3). Both proposed powerhouse alternativesare located on Alyeska Pipeline Service Company property <strong>and</strong> ei<strong>the</strong>rwould occupy about 1.5 acres. The Alyeska terminal site road wouldprovide access to ei<strong>the</strong>r site, with only an additional 50-100 feetof road construction required.<strong>Power</strong>house alternative #1 is proposed above <strong>the</strong> existing weir inAllison Creek, which was constructed by <strong>the</strong> Alyeska Pipeline ServiceCompany <strong>for</strong> a partial source of water <strong>for</strong> <strong>the</strong> terminal of <strong>the</strong> TransAlaska Pipeline. The proposed powerhouse is at an approximateelevation of 100 feet (Figure 2). The tailrace would run directlyinto Allison Creek at this location. The CE has not proposed a dualtailrace configuration at this site as described below <strong>for</strong> powerhousealternative #2; however, fur<strong>the</strong>r consideration of such a feature atthis site is contained in <strong>the</strong> discussion section of this report.<strong>Power</strong>house alternative #2 is proposed near tidewater at an approximateelevation of 10 feet (Figure 3). A combination of two tailraces areproposed by <strong>the</strong> CE <strong>for</strong> this powerhouse. One would discharge directlyinto Port <strong>Valdez</strong>, <strong>the</strong> o<strong>the</strong>r would discharge into Allison Creek near<strong>the</strong> proposed powerhouse. CE personnel have stated that <strong>the</strong> dischargefrom <strong>the</strong> proposed powerhouse could be regulated through each tailraceindependently or through each simultaneously. For example, flowthrough one tailrace could be constant while flow through <strong>the</strong> o<strong>the</strong>rwould vary according to power generation requirements. In addition,a six-inch steel diversion pipe is proposed from <strong>the</strong> penstock toAllison Creek above <strong>the</strong> existing weir to provide supplemental waterif <strong>the</strong> tributary flow to <strong>the</strong> creek is not sufficient <strong>for</strong> <strong>the</strong> needsof Alyeska, <strong>and</strong> resident <strong>and</strong> anadromous fish.To allow disposal of <strong>the</strong> proposed spoil, excavated from <strong>the</strong> rocktunnel, an access road approximately 500 feet long will be constructedfrom <strong>the</strong> lower end of <strong>the</strong> rock tunnel at 1,220 feetelevation due east to <strong>the</strong> edge of a cliff. About 45,000 cubic yardsof rock is proposed to be dumped over this cliff <strong>and</strong> into a deepgorge.The proposed transmission line will run 3.5 miles from one of <strong>the</strong>proposed powerhouse sites to <strong>the</strong> Solomon Gulch substation of <strong>the</strong>Solomon Gulch hydropower facility, now under construction by <strong>the</strong><strong>Copper</strong> Valley Electric Association. It will closely follow <strong>the</strong>route of <strong>the</strong> existing Dayville Road along Port <strong>Valdez</strong>.RESOURCE INVENTORYLower elevations of thi/coastal <strong>for</strong>est in this region support densest<strong>and</strong>s of Sitka spruce- <strong>and</strong> mountain hemlock with an understory of_T I' Common names of plant <strong>and</strong> animal species are used throughout t hi sreport. A list of scientific names is given in APPENDIX A.
-~~ ~..rt~i~;<strong>Valdez</strong> Interim ReportSouthcentral RailbeltAllison LakeTopographic PlanFigure 2
I\ g g :,. - I<strong>Valdez</strong> I nteriSouthcentral m ~eport RadbeltTo Allison C reekpographic PlanFigure 3-
alder, salmonberry, blueberry, <strong>and</strong> devilsclub. The steep wallsabove Allison Lake <strong>and</strong> upper Allison Creek support alpine tundra.Tall shrub thickets dominated by alder <strong>and</strong> some balsam. poplar' occurin <strong>the</strong> area of lower Allison Creek. The riparian area above <strong>the</strong>lake supports mainly willow thickets.The fresh <strong>and</strong> saltwaters of <strong>the</strong> Prince William Sound area support anumber of valuable fish species which are of great· economicimportanceto <strong>the</strong> local economy. The short. coastal streams (approximately700) are important <strong>for</strong> salmon production. Salmon usage of<strong>the</strong>se small streams is so widespread that, unlike o<strong>the</strong>r areas ofAlaska, no single stream or small group of streams plays a dominantrole in salmon production. In addition, <strong>the</strong> isl<strong>and</strong>-bay complex of<strong>the</strong> Sound, provides thous<strong>and</strong>s of miles of shoreline. distributed in afiord system particularly suited to early-stage rearing of juvenilesalmon. .The Prince William Sound area has been a ra<strong>the</strong>r consistent salmonproducer since 1960. The average total salmon catch of 4.6 millionfish represents approximately 10 percent of <strong>the</strong> statewide salmonharvest (Table I). The economy of <strong>the</strong> Prince William Sound area islargely dependent on <strong>the</strong> commercial salmon fisheries (Table II).The sport fisheries in <strong>the</strong> Prince William Sound area are also importantto <strong>the</strong> economy <strong>and</strong> are primarily centered around <strong>the</strong> communities ofCordova, <strong>Valdez</strong>, <strong>and</strong> Whittier.· <strong>the</strong> area supports an exp<strong>and</strong>ingmarine fishery which is concentrated in <strong>Valdez</strong> Arm near <strong>the</strong> city of<strong>Valdez</strong>.Sport fishing is an important tourist attraction <strong>for</strong> <strong>Valdez</strong> <strong>and</strong> amajor source of summer recreation <strong>for</strong> local residents. Saltwatersalmon fishing is popular, with coho salmon being <strong>the</strong> most soughtafter species. Pink <strong>and</strong> chum salmon are also caught in large numbers,<strong>and</strong> a few chinook are occasionally l<strong>and</strong>ed. Dolly Varden, halibut,rockfish, dungeness crab, <strong>and</strong> butter clams are also harvested in <strong>the</strong>saltwater fishery. Freshwater fishing activity is minor in <strong>the</strong><strong>Valdez</strong> area. Salmon fishing is prohibited in all streams draininginto <strong>Valdez</strong> Bay, <strong>and</strong> trout habitat <strong>and</strong> populations are limited.No fish are known to occur in Allison Lake,but fish do inhabit <strong>the</strong>lower 0.5 mile of Allison Greek. Fish migration above this point isblocked by high water velocity <strong>and</strong> <strong>the</strong> steep gradient of <strong>the</strong> stream.The weir in Allison Creek is also a partial barrier to fish migration.Dolly Varden <strong>and</strong> sculpin are resident in <strong>the</strong> creek, while spawningpopulations of adult pink <strong>and</strong> chum salmon seasonally occur in <strong>the</strong>summer <strong>and</strong> fall. Egg development of salmon occurs through <strong>the</strong>winter months until out-migration of fry in early spring.Salmon escapement estimates are limited <strong>and</strong> <strong>the</strong> available datacollected between 1960 <strong>and</strong> 1971 by <strong>the</strong> Alaska Department of Fish <strong>and</strong>Game (ADF&G) are given in Table III. It is apparent that escapementcounts on Allison Creek were not conducted on a regular basis;however, numbers of chum salmon counted in 1963 exceeded 2600 <strong>and</strong>7
Table I·1Pr ince William Sound Salmon Ca~ch hyS.pecies, in Numbers of ·fish, 1970-79.-1Y~e-a-r----~Ch~in-o-o~k~----~S~o-c~k-eX-e--·----~C~o7h-O------~Pi7n~k~------~C7h-u-m1970l l 1,031 104,169 11,485 2,809,996 230,661Total3,157,34219713,551 88,36830,5517,310,964574,2658,007,6991972547 197,5261,63454,78345,370299,86019732,405 124,8021,3992,056,878729,8392,915,32319741,590 129,366801448,77388,544669,07419752,519 189,6136,1424,452,805100,4794,751,55819761,044 112,8096,1713,018,991370,4783,509,493* 19772./632 310,1478044,509,260570,4975,391,340*1978!!../1,043 220,3291,4642,785,156483,5593,491,551*197¢.12,002 146,4686,78015,375,339323,39715,853,986Totals16,364 1,623,59767,23142,822,945 3,517,089 48,047,22610 yrAverage1,636 162,3606,7234,282,294 351,709 4,804,7221/IJ Does notSource:include <strong>Copper</strong>-Bering <strong>River</strong>s~1970-76, Alaska catch <strong>and</strong> production.statistics. Statistical leaflets H21,29.3/~/ Source: Alaska Department ofSource: Pete Fridgen, Alaska* Preliminary results.Commercial fisheries23, 25, 26, 27, 28, <strong>and</strong>Fish <strong>and</strong> Game, 1977, Annual Report.Department 6fFish arid-Game, -Coidova.
Table IIPrince William Sound Salmon Catch in Pounds,<strong>and</strong> Value to Fisherrr:en, 1970-79Pounds All Species ~( Catch % Catch hy wei~ht Tot
1/Source: 1970-76, Alaska catch <strong>and</strong> production. Commercialfisheries statistics. Alaska Depart~entof Fish <strong>and</strong>Game. Statistical leaflets~ No.'s 21,23,25,26,27, 28, <strong>and</strong> 29.2/Includes value of salmon from <strong>the</strong> <strong>Copper</strong>~Beringalso.<strong>River</strong> districts3/1977 data in paren<strong>the</strong>ses are preliminary estimates only <strong>and</strong> notpublished by <strong>the</strong> Alaska Department of Fish <strong>and</strong> Game.Totalpounds calculated using 1976 average weights <strong>for</strong> each species.Chinook salmon not included. Source: Dennis Haanpaa, AlaskaDepartment of Fish <strong>and</strong> Game, Anchorage.1978 data in paren<strong>the</strong>ses are preliminary estimates only <strong>and</strong> notpublished by ADF&G.Total pounds calculated using 1976 averageweights <strong>for</strong> each species. Chinook salmon not included. Totalvalue of <strong>the</strong> catch calculated by using <strong>the</strong> 1978 average dollarvalue per fish paid to <strong>the</strong> fishermen.Chinook salmon notincluded. Source: Dennis Haanpaa, Alaska Department of Fish<strong>and</strong> Game, Anchorage.~/1979 data in paren<strong>the</strong>ses are preliminary estimates only <strong>and</strong> notpublished by ADF&G.Total pounds calculated using 1976 averageweights <strong>for</strong> each species. Chinook salmon not included.Totalvalue of <strong>the</strong> catch calculated by using <strong>the</strong> 1979 average priceper pound <strong>for</strong> each species paid to <strong>the</strong> fishermen <strong>and</strong> <strong>the</strong> 1976average weights <strong>for</strong> each species.Chinook salmon not included.Source:Dennis Haanpaa, Alaska Department of Fish <strong>and</strong> Game,Anchorage.
3/ 4/ 5/- - -1976 Average weights by speciesSockeye -7.4 IbsCoho - 8.5 IbsPink-'4.2 IbsChum - 9.1 IbsSource: ADF&G, 1976 catch <strong>and</strong> production. Commercial fisheriesstatistics. Statistical leaflet 1129.1978 Average price per fish paid to <strong>the</strong> fishermenSockeye -CohoPinkChum$ 7.48/fish3.59/fish1. 29/fish3.28/fishSource:Dennis Haanpaa, ADF&G, Anchorage1979 Average price per pound paid to <strong>the</strong> fishermenSockeye -CohoPinkChum$ 1.400/lb0.390/lb0.377/lb0.530/lbSource:Dennis Haanpaa, ADF&G, AnchorageII
T:lhlc IIIALlison Creek Salmon Escapement Data·Y l':\ rEscapenien tPink Sa lmonChum Salmon1%0 1001961 7501962 560 5801963 -0- 2,6601901965 -0- -0-1966 -0- -0-1969 500-1.0001971 300197] 25-.---.---------------------------'Source:ADF&G.~\utC': Allis,)!! Creek W
<strong>the</strong> number of pink salmon counted in 1969 reached 1,000. In even yearsspawning by both pink <strong>and</strong> chum salmon occurs almost exclusively in<strong>the</strong> intertidal reach of Allison Creek, an area estimated to be 40 feetwide by 300· feet long. During odd years, when stronger runs of pinksoccur in Prince William Sound streams, spawning also occurs inAllison Creek upstream to <strong>the</strong> existing weir.A basic underst<strong>and</strong>ing of <strong>the</strong> life cycle of pink <strong>and</strong> chum salmon isnecessary to recognize all potential impacts which could occur from<strong>the</strong> proposed project. Adult pink salmon return'to <strong>the</strong>ir natalstreams to spawn in mid-summer or fall of <strong>the</strong>ir second year. Adultchum salmon are predominantly three, four, <strong>and</strong> five year old fish.Pink salmon enter streams in<strong>the</strong>.<strong>Valdez</strong> area in July <strong>and</strong> spawn inAugust <strong>and</strong> early September, while chum salmon spawn slightly later.Eggs are deposited in <strong>the</strong> streambed gravels' where development' to<strong>the</strong> fry stage occurs. .Alevins (embryos which have emerged from <strong>the</strong>'egg) remain in <strong>the</strong>gravel until <strong>the</strong>ir yolk sacs are compietely, or almost completelyabsorbed •. The life cycles of pink <strong>and</strong> chum salmon are very similar •. For chums, <strong>the</strong> alevin stage' (from hatching to emergence) is completedIn 30 to 50' days, depending on <strong>the</strong> water temperature. In Port<strong>Valdez</strong>, fry emergence of pink <strong>and</strong> chum salmon begins in mid-April<strong>and</strong> peaks in May.Both pink <strong>and</strong> chum salmon fry migrate to salt water during <strong>the</strong>irfirst summer, generally within a few days to a few weeks afteremergence. Once in. salt water, <strong>the</strong> young salmon feed in schoolsnear shore until late July or August; some remain near shore untilautumn. Between mid-summer of <strong>the</strong>ir first year <strong>and</strong> <strong>the</strong>ir secondsummer, <strong>the</strong>y disperse throughout <strong>the</strong> offshore waters of <strong>the</strong> NorthPacific Ocean <strong>and</strong> Bering Sea.In salt water, main foods of young pink <strong>and</strong>/or chum salmon have beenreported to be cladocerans, copepods, barnacle naupli, barnaclecyprids, euphasids, <strong>and</strong> tunicates (Bakkala, 1970). O<strong>the</strong>r studieshave shown harpacticoids to be a major' component of <strong>the</strong> stomachcontents of post-emergent pink <strong>and</strong> chum salmon fry (Kaczynski et.al., 1973; Healey, 1979). The seasonal population density of <strong>the</strong>copepod Harpacticus uniremis in Port <strong>Valdez</strong> is shown in Figure 4.Wildlife known to occur in <strong>the</strong> Allison Lake drainage include brownbear, black bear, mountain goat, wolf, wolverine, marten, porcupine,<strong>and</strong> snowshoe hare. Upl<strong>and</strong> game birds include willow, rock, <strong>and</strong>white-tailed ptarmigan <strong>and</strong> spruce grouse. There is littlein<strong>for</strong>mationon <strong>the</strong> occurrence of small mammals <strong>and</strong> birds in <strong>the</strong> projectvicinity, although lists of species are available <strong>for</strong> <strong>the</strong> <strong>Valdez</strong>area. A general list of species which may occur in <strong>the</strong> vicinity ofAllison Creek is provided in APPENDIX A.Waterfowl use of Allison Lake <strong>and</strong> <strong>the</strong> creek is considered quitelimited. The lake may occasionally be used <strong>for</strong> resting, <strong>and</strong> feedingmay occur in <strong>the</strong> shallow, upper part <strong>and</strong> along <strong>the</strong> braided streamchannel. Approximately 18 Canada geese have been observed resting(1
"0 [-----.-.i100 f--1, r~ '"'r; i,• r-:: ~:rti."r- :---1--------1.1)]I~/OE'= J",N n.B ....... YI ..,. -----IISeasonal Variation in Population Density of Harpacticu~ uniremis.Feder, et. al., 1976.
in <strong>the</strong> fall at <strong>the</strong> upper end of <strong>the</strong> lake by FWS personnel. Also,molting geese were observed in <strong>the</strong> Allison Lake <strong>Basin</strong> by FWS personnelduring 1979.Extensive waterfowl use is made of <strong>the</strong> intertidal area around upperPort <strong>Valdez</strong> <strong>and</strong> <strong>the</strong> Lowe <strong>River</strong> Delta. Numerous seabirds inhabitthat area also. Waterfowl present in <strong>the</strong> <strong>Valdez</strong> area year-roundinclude scoters, goldeneye, common <strong>and</strong> red-breasted mergansers,mallards, buffleheads, harlequins, <strong>and</strong> Canada geese. O<strong>the</strong>rs seasonallypresent in <strong>the</strong> <strong>Valdez</strong> area include pintails, teals, wigeons,oldsquaws, <strong>and</strong> shovelers.Nor<strong>the</strong>rn bald eagles are common in <strong>the</strong> <strong>Valdez</strong> area. Personnel of<strong>the</strong> FWS conducted a survey in 1976, locating 23 eagles <strong>and</strong> 10 nestswithin Port <strong>Valdez</strong> (includes all of <strong>the</strong> shoreline inside of MiddleRock except <strong>for</strong> <strong>the</strong> Lowe <strong>River</strong> flats south of old <strong>Valdez</strong>). Twonests were identified within three miles on <strong>the</strong> mouth of AllisonCreek, one on each side of <strong>the</strong> stream (see Figure 5). Congregationsof eagles are attracted by salmon to mouths of stream which flowinto Port <strong>Valdez</strong>. The carcasses of salmon are an important additionto <strong>the</strong> diet of both resident <strong>and</strong> migratory eagles. O<strong>the</strong>r raptorsfound in <strong>the</strong> <strong>Valdez</strong> area include <strong>the</strong> osprey, red-tailed hawk, sharpshinnedhawk, goshawk, <strong>and</strong> Peale's peregine falcon.No terrestrial threatened or endangered species are known to occurin <strong>the</strong> <strong>Valdez</strong> area. The endangered finback <strong>and</strong> humpback whales havebeen sited in Port <strong>Valdez</strong>. Peale's peregrine falcon is not listedas an endangered species under <strong>the</strong> Endangered Species Act of 1973.Hunting, hiking, <strong>and</strong> overnight recreational use in <strong>the</strong> Allison Lakearea appear to be limited, due to <strong>the</strong> rugged terrain. However, arough hiking trail to <strong>the</strong> lake is presently used by local residents.Port <strong>Valdez</strong> is used, or occasionally visited, by <strong>the</strong> followingmarine mammals: nor<strong>the</strong>rn fur seal, harbor seal, sea otter, nor<strong>the</strong>rnsea lion, killer whale, humpback whale, Dall's porpoise, <strong>and</strong> harborporpoise. The nearshore area from 0.3 mile west of Allison Creek to0.3 mile west of Dayville Flats Creek has been identified as afeeding area <strong>for</strong> sea otters <strong>and</strong> harbor seals.The flow regime of Allison Creek varies from high flow in earlysummer <strong>and</strong> fall to low flow in <strong>the</strong> late winter <strong>and</strong> early spring.Specific data are lacking <strong>and</strong> that data available is given in TableIV.PROJECT IMPACTSImpacts which would result from <strong>the</strong> project are discussed in twocategories: construction, <strong>and</strong> operation <strong>and</strong> maintenance.Construction: At present, no access road is planned to AllisonLake. This considerably reduces <strong>the</strong> possible impacts of <strong>the</strong> projecton <strong>the</strong> upl<strong>and</strong> area. The road <strong>and</strong> rock dump associated with <strong>the</strong>tunnel construction will cover existing vegetation, as well ascreate a scar visible from <strong>Valdez</strong>. Wea<strong>the</strong>ring of <strong>the</strong> rock will
Figure 5. Bald Eagle Nest Sites, September 14 & 16, 1976.~:: /'~.='~-: /-:~.:~ =/- -~..-~.• _" -.,",",-'- .____.__;;; • ~ ,\.:,"/" . - I •=;~-.-=~+-'-/-~5C.bi~.\\ '- I / -:.~ ~-r/' -~_./.-• C"~JI"V A L [) 1..,' 7..36 'I. .'t.~ (,';:~J !" ~ I1(:';:'~---:::::/ / .-' r "~··,1···.·f..;.t;;j?'~:·/\:\. . /-:o-..f~::-~f~··l··': )';- i.:.:....:~.:... ~.: ... \~:~.:.':.::\.::.. :::.~'.:"::;. " r.~;~~/, I"'i .M~,er8,6~·:!".". f --. -- ;!. '-'-sl;nds -.,. "':',;;' -.·;{';"'t. /1 It ~ :- B ;'V"d'f.~::: .. :.': :~ .' T, 9 ~ (j 1p~L-L !-___.i:r 1 L ~j:: -~"".TJ)! r-rT1--l::!. -I~
Table 1 VAllison Creek -Discharge MeasurementsDate9-01-501-23-742-12-742-23-74.1-15~74[j-09-74!,-2J-7!,11-18-7412-17-7LI1-25-752-07-752.-19-753-06-753-07-753-13-753--17-753-:1.0-753--2b-/'l11-] 1-75Ij -l7-})1,-24-751,-25-755-01-756-05-756-12-75L,-01-76Ij-02-76L,-03-764-04-764--05-764-06-764-07-764-08-764-09-764-10-764-11-764-12-761.-13-764-14-764-15-76Flow in cubic feetper second (c.f.s.)54.911. 915.27.610.913.212.920.420.27.27.710.35.156.75.13.9611. 76.07.010.04.65.15.885.080.03.94.24. 74.94.64.53.83.93.94.75.14.45.54.51,.2D3ta collE:'ctL'd by:U.S. Geological SurveyNurthwest Hydraulic Consultants, Ltd.JFI·JAT, George PerkinsFluor Alaska, Inc.17
occur, <strong>and</strong> may allow <strong>the</strong> rock to blend in with <strong>the</strong> surroundings. within several years. Blasting <strong>for</strong> tunnel construction couldtemporarily disturb resident wildlife. The above ground portion of<strong>the</strong> penstock will be a permanent scar on <strong>the</strong> hillside.Increased erosion <strong>and</strong> subsequent stream sedimentation may resultfrom cleared areas. The extent of this occurrence will be directlyrelated to construction techniques <strong>and</strong> can be avoided. Adverseimpacts which can occur to aquatic species as a result of siltationare numerous <strong>and</strong> well documented. Major impacts from siltation, as aresult of construction of <strong>the</strong> proposed project, include decreasedvigor or death of incubating salmon eggs by interfering with orpreventing respiration, loss of spawning gravels, <strong>and</strong> physicaldisturbance to both adult salmon <strong>and</strong> o<strong>the</strong>r resident species.Clearing of approximately 21.5 acres of vegetation would be required<strong>for</strong> <strong>the</strong> transmission line. Visual impact would be significant.Clearing <strong>and</strong> construction activities could disturb nesting eagleswhich may result in desertion of eggs <strong>and</strong> young. Bird collisions·with power lines will result in mortality. Transmission poles couldbe <strong>the</strong> tallest object in <strong>the</strong> immediate vicinity <strong>and</strong> may commonly beused by raptors as a perch. Improper line spacing presents <strong>the</strong>hazard of electrocution to large raptors.Construction activities will disturb terrestrial wildlife <strong>and</strong> maycause avoidance of <strong>the</strong> area while construction is occuring. Thisimpact should be minor as no wildlife concentrations or criticalhabitat areas are known to occur in <strong>the</strong> immediate area.To prevent debris from reaching <strong>the</strong> turbines, construction of ascreen over <strong>the</strong> penstock intake at <strong>the</strong> lake will be necessary <strong>and</strong>could require lake drawdown to <strong>the</strong> lake tap inlet. This will result·in dewatering <strong>the</strong> upper reaches of Allison Creek. If discharge didnot occur directly to Port <strong>Valdez</strong> or occur in a carefully controlledmanner it could create excessive discharge into <strong>the</strong> lower stream;possible scouring of <strong>the</strong> streambed; <strong>and</strong> depending when this occurred,above normal stream velocities could ei<strong>the</strong>r prevent returning adultsfrom entering <strong>the</strong> stream or expose incubating eggs. Also, residentDolly Varden could be flushed out of <strong>the</strong> system to marine waters.Operation <strong>and</strong> Maintenance: During project operation, <strong>the</strong> lake levelwould be drawn down as much as 100 feet, primarily over <strong>the</strong> wintermonths. Biological impacts to <strong>the</strong> lake resulting from this drawdownwould probably be minor, although <strong>the</strong> aes<strong>the</strong>tic impact would besignificant. Fortunately, <strong>the</strong> lake itself is not visible from <strong>the</strong>town of <strong>Valdez</strong>. Fluctuating lake levels could cause lake shoreerosion leading to l<strong>and</strong>slides in steeper areas with accompanyinghabitat degradation. During winter, shelf ice <strong>for</strong>med by <strong>the</strong>dropping lake level could impede movement of mountain goats. Thelow number of goats in <strong>the</strong> area reduces <strong>the</strong> extent of this occurrence.The impacts which would result from project operation have <strong>the</strong>greatest potential <strong>for</strong> adversely affecting <strong>the</strong> environment ofAllison Creek. The drawdown would dewater Allison Creek at its
outlet from <strong>the</strong> lake; however, <strong>the</strong> CE expects· natural seepage throughglacial deposits to provide some flow into <strong>the</strong> upper creek. Also,tributary flow will provide some stream flow to lower portions of<strong>the</strong> creek.Water <strong>for</strong> hydropower production would be drawn from deep in <strong>the</strong> lake<strong>and</strong>, based upon available in<strong>for</strong>mation, will be warmer than AllisonCreek water in <strong>the</strong> winter <strong>and</strong> colder than <strong>the</strong> stream's water in <strong>the</strong>summer. Water at lake tap depth may also be deficient in dissolvedoxygen. A minimum dissolved oxygen concentration of 6.0 milligramsper liter (mg/l) has been recommended <strong>for</strong> coldwater fish (Doudoroff<strong>and</strong> Shumway, 1966). At <strong>the</strong> present time, dissolved oxygen data at<strong>the</strong> depth of <strong>the</strong> proposed lake tap is not available. The passage ofwater through <strong>the</strong> powerhouse <strong>and</strong> energy dissipator is expected toaerate <strong>the</strong>se waters, although <strong>the</strong> extent of this occurrence inrelation to <strong>the</strong> acceptable limits <strong>for</strong> fish is not known at present.Temperature has a major influence on <strong>the</strong> freshwater stages of salmon.Stream temperature data <strong>for</strong> Allison Creek has been collected by <strong>the</strong>U.S. Geological Survey <strong>and</strong> is now being collected by <strong>the</strong> ADF&G(APPENDIX B). The CE has also collected some temperature data <strong>for</strong>Allison Lake (APPENDIX B). The ADF&G has also taken intertidaltemperatures at Solomon Creek (three miles to <strong>the</strong> east) sinceSeptember, 1979, <strong>and</strong> this data would probably be consistent withsalt water temperatures off <strong>the</strong> mouth of Allison Creek (APPENDIX B).No intragravel temperatures have been taken~The effects of warm water discharges on developing eggs <strong>and</strong> alevinshave been studied in laboratory situations <strong>and</strong> at most major hatcheryfacilities. Increased mortality <strong>and</strong> abnormal embryonic developmenthave been shown to occur if <strong>the</strong> initial incubation temperatures <strong>for</strong>developing pink salmon eggs is 4.SoC or lower. At 2.0°C or lower,complete mortality will occur (Bailey <strong>and</strong> Evans, 1971). Preliminarytemperature data from <strong>the</strong> lake (APPENDIX B) indicates that <strong>the</strong> waterthrough <strong>the</strong> powerplant would be 4°C or less. Based upon <strong>the</strong>se data,<strong>the</strong> potential alteration of <strong>the</strong> temperature regime in Allison Creekcould have a significant adverse impact upon <strong>the</strong> fish resources ofAllison Creek.Low concentrations of dissolved oxygen <strong>and</strong> exposure to light canincrease incubation time, but temperature is <strong>the</strong> primary factor inregulating <strong>the</strong> duration <strong>and</strong> timing of incubation <strong>and</strong> hatching.Development is normally expressed in terms of temperature units. Atemperature unit is defined as one degree above freezing <strong>for</strong> aperiod of 24 hours. A given number of temperature units is required<strong>for</strong> <strong>the</strong> eggs to hatch. The number of temperature units required isgenerally specific to <strong>the</strong> species of fish <strong>and</strong> even to <strong>the</strong> particularstock. Hatching <strong>and</strong> emergence is delayed in colder water temperatures<strong>and</strong> accelerated in warmer temperatures. A minor temperature increaseor decrease could considerably advance or delay hatching. A changein <strong>the</strong> natural temperature regime of Allison Creek could change <strong>the</strong>timing of pink <strong>and</strong> chum salmon fry emergence. The extent of thisimpact is difficult to assess with <strong>the</strong> data available; however,significant early development of eggs would result in early1'1
emergence <strong>and</strong> outmigration of fry to Port <strong>Valdez</strong> at a time when itis questionable that <strong>the</strong>re would be adequate planktonic productionto sustain rearing activity. Consequently, a substantial alterationin natural water temperature during <strong>the</strong> egg to fry developmentperiod would negatively impact run strength.With sufficient data, <strong>the</strong> number of temperature units required <strong>for</strong>eggs to hatch under natural stream temperatures can be calculated<strong>and</strong> compared to <strong>the</strong> number of temperature units anticipated to existunder altered stream conditions. The difference in temperatureunits will show if early or late emergence will occur, <strong>and</strong> if so,give <strong>the</strong> approximate magnitude of change in <strong>the</strong> time of emergence.Where intertidal spawning occurs, such as in Allison Creek, <strong>the</strong>warmer saltwater contributes to higher intragravel temperatures.This adds to <strong>the</strong> complexity of <strong>the</strong> temperature regime in intertidalareas because intertidal zone temperatures are influenced by (1)upstream water temperatures, (2) saltwater temperatures exposed tostream gravel, (3) time of exposure to saltwater, <strong>and</strong> possibly (4)<strong>the</strong> permeability of gravels.Should early fry emergence occur, sufficient food sources may notexist. Figure 4 illustrates <strong>the</strong> seasonal variation in populationdensity of <strong>the</strong> copepod, Harpacticus uniremis, an organism whichcould be an important food source <strong>for</strong> post-emergent fry. Healey(1979) found that H. uniremis made up 50% of <strong>the</strong> overall diet ofjuvenile chum salm~n in <strong>the</strong> Nanaimo Estuary <strong>and</strong> greater than 80%of <strong>the</strong> diet when fry were most abundant. He also found that<strong>the</strong> seasonal pattern of abundance of fry <strong>and</strong> H. uniremis in <strong>the</strong>estuary was <strong>the</strong> same, <strong>and</strong> that fry consumed most of <strong>the</strong> estimatedproduction of H. uniremis. Large numbers of this copepod are usuallynot present in Port <strong>Valdez</strong> until mid-March to early April. Undernatural conditions pink <strong>and</strong> chum salmon fry emergence begins inmid-April in <strong>the</strong> Port <strong>Valdez</strong> area.Radical fluctuations in stream flow contribute most heavily tomortality of developing eggs through erosion, shifting of gravel, ordewatering of spawning beds. Flooding also causes mortality bydeposition of silt on spawning areas, which slows intragravel watermovement, decreasing <strong>the</strong> oxygen supply to <strong>the</strong> eggs, <strong>and</strong> preventingremoval of waste products. O<strong>the</strong>r factors contributing to mortalityof eggs are freezing, exposure to light, parasites, predation, highsalinity, shock, <strong>and</strong> superimposition of redds (spawning beds).The tailrace discharge could cause increased velocity in <strong>the</strong> stream<strong>and</strong> scouring of <strong>the</strong> streambed with subsequent removal or burial ofspawning gravel. Alterations in natural streamflow could also haveadverse impacts upon spawning adults as a result of ei<strong>the</strong>r high orlow flows which are not optimum <strong>for</strong> spawning. Post-project flowschedules could be beneficial to fish resources by reducing radicalflow fluctuations <strong>and</strong> providing flows optimum <strong>for</strong> life stage requirementsof pink <strong>and</strong> chum salmon.
As stated previously, two alternative sites have been proposed <strong>for</strong><strong>the</strong> powerhouse. Ei<strong>the</strong>r site would require clearing of approximately1.5 acres <strong>for</strong> construction purposes. Some alteration of <strong>the</strong> streambank<strong>and</strong> streambed will result from installation of <strong>the</strong> tailrace <strong>and</strong>sedimentation could occur. The magnitude of <strong>the</strong>se impacts could bereduced significantly depending on <strong>the</strong> construction techniquesutilized <strong>and</strong> <strong>the</strong> time of work.Impacts which would result from ei<strong>the</strong>r of <strong>the</strong> proposed powerhousealternatives were described above. Those impacts which would vary,depending on <strong>the</strong> site selected, are described below.<strong>Power</strong>house Alternative Itl: The discharge of flow from this alternativeis proposed by·<strong>the</strong> CE directly from <strong>the</strong> tailrace into AllisonCreek. Radical flow changes would result <strong>and</strong> all adverse impactsdescribed previously <strong>for</strong> alteration of flow would occur. In addition,if instream flows were totally dependent on power generation needs,periods of very low flow could result when <strong>the</strong> power plant was shutdown <strong>for</strong> maintenance or o<strong>the</strong>r reasons.The discharge of all project flows into Allison Creek at this sitewould also result in temperature <strong>and</strong> possibly dissolved oxygenimpacts occurring in <strong>the</strong> total reach of Allison Creek utilized byf ish. Flows in <strong>the</strong> creek above this site may not have any appreciablebuffering effect <strong>for</strong> maintenance of natural water qualitysince <strong>the</strong>y would be low in relation to <strong>the</strong> flow through <strong>the</strong> powerhouse.<strong>Power</strong>house Alternative 1t2: Impacts described above <strong>for</strong> site Itl mayalso be applicable to this alternative. This alternative has twotailraces proposed. If <strong>the</strong> tailrace waters were discharged directlyinto Port <strong>Valdez</strong> during <strong>the</strong> summer months, a portion of <strong>the</strong> salmonpopulation could be diverted away from spawning areas in <strong>the</strong> naturalstream by <strong>the</strong> larger quantities of Allison Creek water issuing from<strong>the</strong> tailrace into Port <strong>Valdez</strong>. Diverting water from <strong>the</strong> powerhousethrough <strong>the</strong> tailrace positioned in Allison Creek would alleviatethis impact; however, those impacts discussed above under powerhouse1t1 would occur. Hhen <strong>the</strong> discharge is diverted back through <strong>the</strong>tailrace into Port <strong>Valdez</strong>, some of <strong>the</strong> redds could be dewatered.Also, <strong>the</strong> discharge could prove to be such an attractant to adultsalmon that <strong>the</strong>y would pool up below <strong>the</strong> discharge <strong>and</strong> not utilizeo<strong>the</strong>r portions of <strong>the</strong> stream or intertidal area <strong>for</strong> spawning.Periods of very low flow during powerhouse shut down could alsoresult from this alternative. The proposed 6 inch diversion pipecould be used to add supplemental water to <strong>the</strong> creek. However, <strong>the</strong>use of <strong>the</strong> diversion pipe <strong>for</strong> long periods to supply water to <strong>the</strong>stream or as a substantial supplement to natural flows could alsocause early fry emergence as dicussed earlier.Diversion of flows directly into Port <strong>Valdez</strong> during most of <strong>the</strong> yearwould result in a reduction of water velocity in <strong>the</strong> natural stream~bed which could result in sedimentation of <strong>the</strong> spawning gravel.
Should a major earthquake occur, this site could be severely damagedor destroyed by seismic sea waves.DISCUSSIONWith fossil fuel prices continuing on an upward spiral, increasingattention is being given to alternative energy sources. In Alaska,with steep slopes <strong>and</strong> abundant streams, hydropower is a logicalchoice. Sites with large hydropower potential close to populationcenters are limited, but potential small hydropower sites are numerous.Alaska also has abundant fish resources, which frequently inhabit<strong>the</strong> same drainage systems suitable <strong>for</strong> hydropower development.Un<strong>for</strong>tunately, <strong>the</strong>se two resources may not be completely compatible.Allison Creek, cumulatively with <strong>the</strong> o<strong>the</strong>r short coastal streams ofPrince William Sound, provides an important contribution to <strong>the</strong>overall salmon production of <strong>the</strong> area. Both <strong>the</strong> commercial <strong>and</strong>sport fisheries play an important role in <strong>the</strong> economy of <strong>Valdez</strong>. Inaddition, maintenance of natural <strong>and</strong> wild stocks of salmon in~llison Creek can be viewed as an aes<strong>the</strong>tic value which cannot bemeasured in monetary terms.The most significant impacts upon fish <strong>and</strong> wildlife resources whichwould occur from construction of <strong>the</strong> Allison Lake project are <strong>the</strong>potential changes in <strong>the</strong> flow <strong>and</strong> temperature regimes of <strong>the</strong> creek.All o<strong>the</strong>r potential impacts are considered less significant. Ananalysis of existing data <strong>and</strong> subsequent impacts indicate thatappropriate structural <strong>and</strong> non-structural features to mitigate majoradverse impacts could be incorporated into project design includingei<strong>the</strong>r of <strong>the</strong> proposed powerhouse sites which would make <strong>the</strong> proposalacceptable environmentally. However, baseline data gaps presentlyexist which preclude a complete assessment of potential impacts.Execution of appropriate studies be<strong>for</strong>e or during <strong>the</strong> advancedengineering <strong>and</strong> design stage of planning will enable a thoroughevaluation of potential impacts to fish <strong>and</strong> wildlife <strong>and</strong> refinement/development of necessary mitigation features. In addition to <strong>the</strong>sestudies, a cooperative study jointly scoped by <strong>the</strong> FWS <strong>and</strong> CE, <strong>and</strong>conducted through project construction <strong>and</strong> operation, would enablerefinement of mitigation recommendations; assessment of <strong>the</strong> accuracy<strong>and</strong> effectiveness of those recommendations; <strong>and</strong> provide a comprehensivedata base useful in <strong>the</strong> future planning of similar projects.Available data suggests that peaking or excess flow should bedischarged directly to port <strong>Valdez</strong> year round <strong>and</strong> that regulatedflows be discharged through <strong>the</strong> tailrace to Allison Creek. Apre-project instream flow analysis of Allison Creek is needed toderive accurate <strong>and</strong> specific optimum flow recommendations <strong>for</strong> fishmaintenance. The regulated flows would vary according to life stagerequirements of fish <strong>and</strong> natural streambed flow. For example, fromapproximately mid-July to early September adult salmon are presentin <strong>the</strong> creek <strong>and</strong> a constant flow optimum <strong>for</strong> spawning should occurin Allison Creek. Peaking or excess flow would continue d:i.rectly toPort <strong>Valdez</strong> <strong>and</strong> this discharge should occur subtidally to at least-10 feet mean lower low water from June through September to eliminateattracting adults.
Discharge measurements are sparse <strong>and</strong>; according to <strong>the</strong> CE, accuratepredictions of <strong>the</strong> amount of water flowing through <strong>the</strong> powerhousecannot yet be determined. Daily discharge measurements of AllisonCreek should be taken <strong>for</strong> a minimum of one year, beginning as soonas possible. However, collection of data <strong>for</strong> two years or more isrecommended. These data should be provided to <strong>the</strong> FWS quarterly toassist in refining discharge flow schedules through <strong>the</strong> proposedpowerhouse to Allison Creek.The CE has stated that tributary <strong>and</strong> groundwater flow to AllisonCreek will contribute seasonally to base flow in <strong>the</strong> creek afterproject operation. The specific amount of this flow is needed <strong>for</strong>analysis in <strong>the</strong> development of flow recommendations to Allison Creekfrom <strong>the</strong> powerhouse. The CE expects that tributary <strong>and</strong> groundwaterflow will maintain adequate flow in that reach of <strong>the</strong> stream below<strong>the</strong> weir; however, during <strong>the</strong> low flow period of late winter <strong>and</strong>early spring it may be necessary to supplement instream flow below<strong>the</strong> weir to 5.0 cubic feet per second (cfs). The proposed 6 inchdiversion pipe should be adequate to accomplish this.Temperature profile data of Allison Creek is needed to assessimpacts. The CE should conduct temperature profiles in Allison Laketo <strong>the</strong> proposed lake tap intake depth <strong>for</strong> a period of one yearbeginning as soon as possible. A minimum sampling ef<strong>for</strong>t shouldinclude <strong>the</strong> months of March, June, September, <strong>and</strong> December.Concurrently, water samples <strong>for</strong> testing dissolved oxygen, pH, heavymetal, <strong>and</strong> turbidity levels, should also be taken at <strong>the</strong> surface <strong>and</strong>at <strong>the</strong> same depth <strong>and</strong> general location of <strong>the</strong> proposed lake tap. Itmay be feasible <strong>for</strong> <strong>the</strong> CE to model or accurately predict <strong>the</strong> <strong>the</strong>rmalregime of Allison Lake with data available <strong>for</strong> similar alpine lakes.If dissolved oyxgen concentrations are below 6.0 mg/l, correctivemeasures may be necessary if <strong>the</strong> dissipators do not insure dissolvedoxygen readings of 6.0 mg/l or above. A temperature probe or similarrecording device should be installed in <strong>the</strong> gravel where intertidalspawning occurs to record intragravel temperature <strong>for</strong> <strong>the</strong> same timeperiod. The <strong>the</strong>rmograph now installed in Allison Creek should alsobe maintained throughout <strong>the</strong> same one-year period.With knowledge of <strong>the</strong> existing temperature regime <strong>for</strong> Allison Creek,<strong>the</strong> temperature of <strong>the</strong> water coming from <strong>the</strong> powerplant, <strong>the</strong> anticipatedbase flow, <strong>and</strong> <strong>the</strong> anticipated flow schedules <strong>for</strong> projectoperation, <strong>the</strong> temperature in <strong>the</strong> spawning beds could be predicted<strong>and</strong> <strong>the</strong> effects on developing salmon embryos calculated. Until <strong>the</strong>extent of adverse impacts can be identified, it is difficult topredict if any o<strong>the</strong>r <strong>for</strong>m of mitigation may be appropriate. Itcould be determined that regulation of <strong>the</strong> <strong>the</strong>rmal regime of AllisonCreek may be required to protect fish resourCeS.During <strong>the</strong> first year of project operations, daily temperaturereadings should be taken in Allison Creek below <strong>the</strong> tailrace discharge<strong>and</strong> provided monthly to <strong>the</strong> FWS <strong>and</strong> <strong>the</strong> ADF&G. Depending on<strong>the</strong> temperatures, it may be feasible that refinement of dischargerecommendations could fur<strong>the</strong>r mitigate potential impacts due to
alteration of <strong>the</strong> temperature regime through mixing base flows inAllison Creek with project flows. An extension of <strong>the</strong> one yearrecording period may be necessary.As additional in<strong>for</strong>mation is available <strong>for</strong> a thorough assessment ofimpacts due to potential changes in flow <strong>and</strong> temperature regimes,o<strong>the</strong>r alternatives <strong>for</strong> <strong>the</strong> discharge to Port <strong>Valdez</strong> may be acceptableor recommended. For example: (1) operation of <strong>the</strong> project only <strong>for</strong>base load pmver production would eliminate <strong>the</strong> radical flow variationsassociated wi th a peaking facility, (2) alterations in <strong>the</strong> dischargeof flow· from <strong>the</strong> tailrace in response to power dem<strong>and</strong> could be doneincrementally by a specified discharge in a given time period (ex.10 cfs/hour), (3) discharge of excess flows directly into Port<strong>Valdez</strong> could be done via .a flume or manmade channel <strong>and</strong> dischargedsub tidally only from June through September.Recent in<strong>for</strong>mation on spawning populations in Allison Creek is alsolacking. Beginning in 1980, escapement counts should be taken atleast once a month in July, August, <strong>and</strong> September of each year.These surveys should continue through <strong>the</strong> planning, construction,<strong>and</strong> operation phase of <strong>the</strong> project to allow assessment of projectimpacts upon salmon populations.A dual tailrace design as proposed <strong>for</strong> <strong>the</strong> lower powerhouse alternativeshould be included in plans <strong>for</strong> <strong>the</strong> upper powerhouse alternativeas well. The impacts associated with <strong>the</strong> potentfal changesto flow <strong>and</strong> temperature regimes described previously would occur atei<strong>the</strong>r powerhouse alternative unless appropriate mitigation featuresare incorporated into project design. In fact, construction <strong>and</strong>operation of <strong>the</strong> upper powerhouse with <strong>the</strong> dual tailrace feature isfavored slightly because stabilizing <strong>the</strong> flows in that stream reachbetween <strong>the</strong> lower <strong>and</strong> upper site would benefit fish resources in agreater portion of <strong>the</strong>ir habitat.To prevent scouring <strong>and</strong> downstream sedimentation, energy dissipatorsshould be installed in both <strong>the</strong> tailrace <strong>and</strong> outlet of <strong>the</strong> 6 inchdiversion pipe to Allison Creek. Design of <strong>the</strong> dissipators shouldinsure that <strong>the</strong> velocity of <strong>the</strong> discharge into Allison Creek willnot exceed <strong>the</strong> optimum velocity of <strong>the</strong> natural stream <strong>for</strong> fishmaintenance.The timing of construction will be of considerable importance inminimizing impacts to fish. The work should be done to avoid criticalbiological life stages. Disturbance of <strong>the</strong> water quality orstreambed morphology while eggs are incubating or fry are emergingcan result in direct mortality through suffocation by burial orphysical damage. Disturbance ,",hile adults are present can disruptor prevent spawning <strong>and</strong> l:Lmit production of future generations. Thetiming of any inwater construction activity or construction on th.ebanks of Allison Creek should he coordinated with <strong>the</strong> FWS, NationalMarine Fisheries Service (ID-IFS) ,<strong>and</strong> <strong>the</strong> ADF&G to avoid unnecessaryimpact on <strong>the</strong> salmon population. Also, because highest densities ofpopulations of spawning salmon occur in odd years, major constructionaffecting flows should be done on even years.
Streambed sedimentation can be caused by a variety of activities.Improper construction <strong>and</strong> clearing techniques can cause increasedrunoff <strong>and</strong> excessive erosion. Clearing <strong>for</strong> penstock constructionabove ground should be limited to large shrubs <strong>and</strong> any trees whichmay be encountered to reduce ground disturbance <strong>and</strong> erosion. Adamaged streambank is unstable <strong>and</strong> can cause sedimentation.Streambanks should be restored to pre-project integrity during <strong>the</strong>. construction season in which <strong>the</strong>y are damaged. Transmission lineconstruction should be initiated after <strong>the</strong> ground is frozen <strong>and</strong> somesnow cover exists to minimize erosion <strong>and</strong> rutting.Alteration of <strong>the</strong> streambed or barriers in <strong>the</strong> channel can causescouring <strong>and</strong> downstream sedimentation. Vegetation <strong>and</strong> debris shouldbe kept out of Allison Creek <strong>and</strong> any streams crossed by <strong>the</strong> transmissionline. Any structures placed in or across streams or waterbodies,as a result of project work, should be removed be<strong>for</strong>e <strong>the</strong>end of <strong>the</strong> current construction season. An erosion control plan <strong>and</strong>a plan <strong>for</strong> any instream work (including transmission lines) shouldbe developed prior to construction <strong>and</strong> presented foy review byresource agencies to insure appropriate precautions are implemented.Care should be taken to prevent <strong>the</strong> introduction of toxic materialsinto any waterbody. Fuels, lubricants, <strong>and</strong> o<strong>the</strong>r potential pollutantsshould be stored in leakproof containers within an area surroundedby a containment berm at a mintmum of 300 feet from any stream orwaterbody.Improper disposal of refuse can serve as an attractant to bears <strong>and</strong>o<strong>the</strong>r wildlife <strong>and</strong> lead to bear/human confrontations, usuallyresulting in removal or destruction of <strong>the</strong> bear. Feeding of wildlifeby construction crews is illegal <strong>and</strong> should not be allowed.During construction, all refuse should be placed in metal containerswith heavy lids <strong>and</strong> be removed from <strong>the</strong> site regularly.Nesting eagles can easily be disturbed by human activity which maycause <strong>the</strong>m to desert eggs or young as a result. Nest removal ordisturbance of bald eagles is prohibited by <strong>the</strong> Bald Eagle Act of1940. When <strong>the</strong> exact transmission line route is established, FWSpersonnel should be given <strong>the</strong> opportunity to survey <strong>the</strong> route <strong>for</strong>any nests. Restrictions may be placed on construction activityoccurring between April 1 <strong>and</strong> July 15 if nests are found in closeproximity.Improper spacing of transmission lines can cause electrocution ofraptors. Transmission line design <strong>and</strong> construction should be governedby "Suggested Practices <strong>for</strong> Raptor Protection on <strong>Power</strong>lines," RaptorResearch Foundation, 1975. Use of this in<strong>for</strong>mation should be madeto design <strong>the</strong> powerline with proper grounding, spacing, <strong>and</strong> configuration,such that it will prevent <strong>the</strong> electrocution of raptors.Clearing <strong>for</strong> <strong>the</strong> transmission line could create a visually displeasingscar on <strong>the</strong> l<strong>and</strong>scape. To lessen this impact, clearing <strong>for</strong> <strong>the</strong>right-of-way should be limited to that needed to string <strong>the</strong> conductors<strong>and</strong> allow <strong>the</strong> passage of construction equipment. To fur<strong>the</strong>r reducevisual impacts, small shrubs should be left in <strong>the</strong> right-of-way <strong>and</strong>along <strong>the</strong> edge of clearings so <strong>the</strong> vegetation will blend with <strong>the</strong>natural surroundings.
It is our intent to protect <strong>the</strong> existing salmon runs of AllisonCreek. Should we be unsuccessful in adequately protecting.thoseresources, o<strong>the</strong>r mitigation measures such as providing artificialhatching, spawning, <strong>and</strong>/or rearing areas may be· determined necessary.A final analysis to determine whe<strong>the</strong>r or not any of <strong>the</strong>se mitigationmeasures would be acceptable or are favored cannot be made with datanow available.· However, based upon present flow <strong>and</strong> temperaturedata, we have tenatively determined that excess flows from <strong>the</strong>powerhouse should be discharged directly to Port <strong>Valdez</strong> to mitigatepotential adverse impacts to fish resources.Additional data needs which have been identified should be satisfiedas soon as possible. Those studies are: a comprehensive analysisof <strong>the</strong> pre- <strong>and</strong> post-project temperature regimes, salmon escapementsurveys, bald eagle nest surveys, <strong>and</strong> an instream flow assessment.These studies should be conducted cooperatively by <strong>the</strong> FWS <strong>and</strong> CEoExecution of <strong>the</strong>se studies would satisfy data needs <strong>for</strong> refinement/development of mitigation recommendations <strong>and</strong> provide data needed<strong>for</strong> preparation of a supplement to this report. A cooperative studythrough project construction <strong>and</strong> operation would allow fur<strong>the</strong>rrefinement of mitigation recommendations, assessment of <strong>the</strong> accuracy<strong>and</strong> effectiveness of <strong>the</strong>se recommendations, <strong>and</strong> provide baselinedata <strong>for</strong> use in <strong>the</strong> planning of similar projects in <strong>the</strong> future. Anamended scope of work <strong>and</strong> associated transfer of funds to <strong>the</strong> FWSwould be required.RECOMMENDATIONS1. That <strong>the</strong> design of <strong>the</strong> powerhouse allow <strong>the</strong> release ofregulated flows to Allison Creek through <strong>the</strong> tailrace <strong>and</strong>excess flows to Port <strong>Valdez</strong> through <strong>the</strong> o<strong>the</strong>r tailrace.2. That flows from <strong>the</strong> powerhouse tailrace to Port <strong>Valdez</strong> bedischarged subtidally to at least -10 feet MLLW from Junethrough September.3. That <strong>the</strong> proposed start-up of project operation affecting<strong>the</strong> natural flows in Allison Creek occur in an even year.4. That <strong>the</strong> timing of proposed construction activities in oron <strong>the</strong> banks of Allison Creek be coordinated with <strong>the</strong> FWS,NMFS,<strong>and</strong> <strong>the</strong> ADF&G.5. That streambanks be restored to pre-project integrityduring <strong>the</strong> construction season in which <strong>the</strong>y are damaged<strong>and</strong> debris or vegetation be kept out of streams.6. That any structures placed in or across streams be removedduring <strong>the</strong> same construction season.7. That clearing <strong>for</strong> <strong>the</strong> penstock construction be limited tolarge shrubs <strong>and</strong> any trees which may be encountered.
8. That during <strong>the</strong> construction phase, bulk fuels, lubricants,<strong>and</strong> o<strong>the</strong>r potential pollutants be stored in leakproofcontainers within an area surrounded by a containment bermat a minimum of 300 feet from any stream or water body.9. That no feeding of wildlife occur <strong>and</strong> all refuse be placedin metal containers with heavy lids <strong>and</strong> removed regularly.10. That transmission line construction be governed by"Suggested Pr&ctices <strong>for</strong> Raptor Protection on <strong>Power</strong>lines,"Raptor Research Foundation, 1975.11. That clearing <strong>for</strong> <strong>the</strong> transmission line right-of-way be.1imited to only that area needed <strong>for</strong> construction <strong>and</strong> bereduced by leaving shrubs <strong>and</strong> blending <strong>the</strong> edges of <strong>the</strong>clearing with <strong>the</strong> surrounding vegetation.12. That an erosion control plan <strong>and</strong> instream work plan beprepared <strong>and</strong> made available to resource agencies <strong>for</strong>review <strong>and</strong> comment be<strong>for</strong>e construction.13. That <strong>the</strong> CE collect natural discharge data of AllisonCreek continuosly <strong>for</strong> at least one year, beginning as soonas possible.14. That <strong>the</strong> CE maintain <strong>the</strong> <strong>the</strong>rmograph in Allison Creek tocollect natural temperature data continuously during <strong>the</strong>one year period that o<strong>the</strong>r temperature data is recorded.15. That <strong>the</strong> CE collect intragravel temperature data of AllisonCreek continuously <strong>for</strong> at least one year, beginning assoon as possible.16. That <strong>the</strong> CE take temperature profiles of Allison Lake to<strong>the</strong> lake tap depth <strong>and</strong> temperature, dissolved oxygen,turbidity, heavy metal, <strong>and</strong> pH readings at <strong>the</strong> lake surfaceas well as <strong>the</strong> depth of <strong>the</strong> lake tap. These measurementsshould be collected as soon as possible. A minimum samplingef<strong>for</strong>t would include <strong>the</strong> months of March, June, September,<strong>and</strong> December.17. That <strong>the</strong> CE collect continuous temperature data below <strong>the</strong>proposed tailrace into Allison Creek <strong>for</strong> at least <strong>the</strong>first year of project operation.18. That <strong>the</strong> CE determine <strong>the</strong> base flow in Allison Creekexpected above <strong>the</strong> powerhouse after project operation.19. That provisions be included in advanced project planning<strong>for</strong> <strong>the</strong> FWS to survey <strong>the</strong> selected transmission line route<strong>for</strong> eagle nests.20. That provisions be included in advanced project planning<strong>for</strong> escapement surveys of salmon in Allison Creek by <strong>the</strong>FWS or ADF&G.17
21. That prov1s1onsbe made in advanced project planning <strong>for</strong>instream flow analysis of Allison Creek by <strong>the</strong> FWS todetermine optimum flow schedules <strong>and</strong> <strong>the</strong> velocity ofsupplemental flows to Allison Creek.22. That a cooperative study of <strong>the</strong> proposed Allison CreekHydropower project, jointly scoped by <strong>the</strong> CE <strong>and</strong> FWS <strong>and</strong>funded by <strong>the</strong> CE, be conducted through project construction<strong>and</strong> operation.23. That, if after execution of <strong>the</strong> recommended additional. studies, it is determined that some losses to fish <strong>and</strong>wildlife are unavoidable, those losses be offset byimplementation of mitigation measures mutually acceptableto <strong>the</strong> FWS <strong>and</strong> <strong>the</strong> CEo
LITERATURE CITEDBailey, Jack E., <strong>and</strong> Dale R. Evans. 1971. The low-temperaturethreshold <strong>for</strong> pink salmon eggs in relation to a proposed hydroelectricinstallation. Fishery Bulletin 69(3): 595-613.Bakkala, Richard G. 1970. Synopsis of biological data on <strong>the</strong>chum salmon Oncorhynchus keta (Walbaum) 1972. FAO FisheriesSynopsis No. 41, Circular 315, U.S. Department of <strong>the</strong> Interior,Washington, D.C.Doudoroff,Peter <strong>and</strong> Dean L. Shumway. 1966. Dissolved oxygencriteria <strong>for</strong> <strong>the</strong> protection of fish. American Fisheries Sociey,Special Publication No.4, A symposium on Water Quality Criteriato Protect Aquatic Life.Feder, Howard M., L. Michael Cheek, Patrick Flanagan, StephenC. Jewett, Mary H. Johnston, A.S. Naidu, Stephen A. Norrell,A.J. Paul, ArIa Scarborough, <strong>and</strong> David Shaw. 1976. The sedimentenvironment of Port <strong>Valdez</strong>, Alaska: <strong>the</strong> effect of oil on thisecosystem. For: Corvallis Environmental Research Laboratory,U. S. Environmental Protection Agency. Corvallis, Oregon.Healey, M.C., 1979. Detritus <strong>and</strong> juvenile salmon production in <strong>the</strong>Nanaimo Estuary: I. Production <strong>and</strong> feeding rates of juvenilechum salmon (Oncorhynchus keta). J. Fish. Res. Board Can. 36:488-496.Kaczynski, V. W., R. J. Feller, <strong>and</strong> J. Clayton. 1973. Trophicanalysis of juvenile pink <strong>and</strong> chum salmon (Oncorhynchus gorbuscha<strong>and</strong> O. keta) in Puget Sound. J. Fish. Res. Board Can. 30:1003=-10OS--:-
APPENDIX A:SCIENTIFIC NAMES OF SPECIESPlantsSitka spruce - Picea sitchensisMountain hemlock - Tsuga mertensianaBalsam poplar - Populus balsamiferaWillow - Salix spp.Alder - Alnus sp~.Salmonberry - Rubus spectabilisDevils club - Oplopanax horridusBlueberry - Vaccinium spp. .AnimalsInvertebratesDungeness crab - Cancer magisterButter clam - Saxidomus spp.Copepod - Harpacticus uniremisFishPink salmon - Oncorhynchus gorbuschaChum salmon - Oncorhynchus ketaCoho salmon - Oncorhynchus kisutchSockeye salmon - Oncorhynchus nerkaChinook salmon - Oncorhynchus tshawytschaDolly Varden - Salvelinus malmaTrout - Salmo ~.Rockfish - Sebastes spp.Sculpin - Cottus spp.Halibut - Hippoglossus spp.BirdsCanada goose - Branta canadensisMallard - Anas platyrhynchosPintail - Anas acutaGreen-winged teal - Anas creccaAmerican wigeon - Anas americanaNor<strong>the</strong>rn shoveler - Spatula clypeataGoldeneye - Bucephala spp.Bufflehead - Bucephala albeolaOldsquaw - Clangula hyemalisHarlequin - Histrionicus histrionicusSurf scoter - Melanitta perspicillataBlack scoter - Oidemia nigraCommon merganser - Mergus merganserRed-breasted merganser - Mergus serra torGoshawk - Accipiter ~tilis30
Sharp-shinned hawk - Accipiter striatusRed-tailed hawk - Buteo jamaicensisNor<strong>the</strong>rn bald eagle - Haliae~tus leucocephalus alascanusOsprey - P<strong>and</strong>ion haliaetusPeale's peregrine falcon - Falc6 peregrinus pealeiSpruce grouse - Canachites canadensisWillow ptarmigan - Lagopus lagopusRock ptarmigan - Lagopus mutusWhite-tailed ptarmigan - Lagopus leucurusMammalsBlack bear - Ursus americanusBrown bear - Ursus arctosWolverine - Gulo luscusMarten '- Martes americanaShort-tailed weasel - Mustela ermineaMink - Mustela vison<strong>River</strong> otter - Lutra canadensisLynx- Lynx canadensisCoyote - Canis latransGray wolf - Canis lupusPorcupine - Erethizon dors~tumSnowshoe hare - Lepus americanus.Mountain goat - Oreamnos americanusMarine MammalsSea otter - Enhydra lutrisNor<strong>the</strong>rn sea lion - Eumetopias jubataNor<strong>the</strong>rn fur seal - Callorhinus ursinusHarbor seal - Phoca vitulinaKiller Whale - Orcinus rectipinnaHarbor porpoise - Phocoena phocoenaDall's porpoise - Phocoenoides dalliHumpback whale - Megaptera novaeangliae
APPENDIX BTEMPERATURE DATA
Allison ereekTemperature DataDateTemperature °e09/23/7102/15/72. OS/23/72·07/24/7210/12/7204/04/7306/17/735.01.03.07.02.52.54.0Source:U.S. Geological Surveyj3
· Thermograph Re8(/ingsALLISON CREEKJune 1979 July 1979 AUBust 19790CHigh Low·· Aver. High· Low. Aver. High . Low Aver.Temp. Temp. Tem:e. Tem:e. Tem:e. Tem:e. Tem:e. Tem:e. Tem:e.1 5 3 4 9 7 82 6 4 5 10 7 8.53 6 4 5 11 8 9.54 6 4 5 10 7 8.5 .5 4 10 . 7 8.56 4 9 7 87 5 4 4.5 9 7 88 5 4 4.5 9 7 89 6 4 5 .8 7 7.510 6 5 5.5 8 7 7.511 6 5 5.5 8 7 7.512 6 5 5.5 8 6 713 6 4 5 8 6 714 5 8 7 7.515 6 5 5.5 716 6 5 5.5 617 7 5 6 618 7 6 6.5 6 5 5.519 8 6 7 620 7 5 6 7 5 621 7 5 6 8 5 6.522 . 7 5 6 7 6 6.5--------23 7 5 6 8 6 724 8 7 7.5 9 7 825 8 6 7 9 7 826 3 8 5 6.5 9 7 827 3 7 5 6 728 3 8 6 7 9 7 829 ·4 3 3.5 9 6 7.5 9 .7 830 5 3 4 9 7 8 8 7 7~--_ ... --~ ----.... --.--Source:Alaska Department of Fish <strong>and</strong> Game.
ALLISON CREEKSeptember 1979 . October 1979 . November 1979COHigh Low Aver. High Low Aver. High . Low Aver.Temp. TemE_ Teme· Teme·· Teme· Teme· Teme· Teme· Teme·1 5.5 3.52 8 6 7 5.5 3.53 8 5 6.5 · 5.5 3 2 2.54 9 7 8. · 5.5 2 1 1.55 7 6 6.5 5.5 16 7 6· 6.5 5.5 2 0 17 7 5 6 5 2 1 1.58 8 6 7 • 6 5 5.5 3 2 2.59 8 ·6 7 5.5 310 7 6 6.5 5.5 3 2 2.511 8 6 7 .. 5.5 212 9 7 8 · 5.5 313 9 8 8.5 5 2.514 9 8 8.5 5 4 4.5 3 2 2.515 8 7 7.5 5 4 4.5 216 7 5 2 1 1.517 7 5 4 4.5 118 7 4 019 4 1 0 0.520 3 121 . 4 3 3.5 2 1 1.522 4 223 4 224 4 2 0 125 4 026 4 3 3.5 027 6 5 5.5 4 1 0 0.528 6 5 5.5 4 2 0 129 5· 4 4.5 4 230 6 5 5.5 4 2 1 1.5Source: . Alaska Department of Fish <strong>and</strong> Game.
ALLISON CREEKDecember 1979 Januarl 1980 Februarl 1980COHigh Low Aver. High· Low Aver. High Low Aver.Temp •. Temp. Temp. Temp. Temp. Temp· Temp. Temp. Temp.1 1 -0.3 -0.3 -0.6 -0.52 1 0 0.5 -0.3 0..1 -0..4 -0.23 0.5 0.0 -0.4 -0.2 0.1 0.0 0.14 a 0..1 0.0 0.0 0.05 0 0..4 0.1 0.2 0.0 -0.4 -0.26 -0.3 -0.3 0..6 0.5 0.5 0.1 0.0 0.17 -0.3 0.6 0.5 0.5 0.18 -0.3 0.5 0.19 ·-0.3 0.5 0.0 0.4 0.1 -0.1 0.010 -0.3 0.0 -0.4 -0.3 0.3 -0.2 0.011 -0.3 -0.4 -0.5 -0.5 0.5 0.3 0.412 -0.3 -0.4 -0.3 -0.5 0.4 0.2 0.313 -0.3 -0.1 -0.6 -0.3 0.2 0.0 0.114 -0.3 -0.4 -0.4 0.2 -0.1 0.1 0.115 -0.3 -0.5 -0.4 0.2 0.1 0.0 0.016 0.2 -0.2 001 0.6 0.2 0.3 0.1 -0.1 0.017 0.4 0.3 0.4 0.5 0.1 0.2 0.0 -0.7 -0.418 0.2 -0.3 -0.1 0.3 0.1 0.2 -0.519 0.3 -0.2 0.1 0.4 0.1 0.2 -0.4 -0.7 -0.520 0.6 0.4 0.5 0.2 0.0 0.1 -0.2 -0.4 -0.321 0.5 0.2 0.3 0.1 -0.3 0.0 0.0 -0.2 -0.122 0.2 0.1 0.1 -0.4 -0.5 -0.5 0.3 0.0 0.123 0.2 0.1 0.2 -0.5 0.8 0.4 0.624 0.6 0.2 0.4 -0.5 -0.7 -0.6 0.9 0.7 0.8I.-25 0.8 0.6 0.7 -0.4 -0.6 -0.5 0.7 0.4 0.5
ALLISON CREEKDecember 1979 Januarl 1980 Februarl 1980COHigh Low Aver. High Low ',Ayer. High Low Aver. "Temp. Temp. Temp. Temp. Temp. Temp Temp. Temp. Temp.26 0.8 -0.5 1.0 0.7 0.827 0.8 0.7 0.8 -0.2 ' -0 .. 5 -0.3 1.028 0.8 0.2 -0.1 0.129 0.'8 0.5 0.7 0.1 -0.7 -0.430 0.3 0.1 0.2 -0.6Source: Alaska Depart~ent of Fish <strong>and</strong> Game.37
Allison Lake Temperature DataMay 7, 1979Type Probe Itl Probe 1t2 Probe 1t3Ice Thickness 1 Ft. 3 A 6 Ft.Overflow 1.5 Ft. 0 0.5 Ft.TemperatureoCSurface (top of ice) ~O. 25°o·-0.25 +0.25°1 Meter -0.25 -0.25 0.002 -0.25 0.00 0.002.5 +0~25 +0.253 . 0.25 +0.25 0.303.5 . 0.50 +0.75 0.754 1.00 1. 25 1.504.5 2.00 1. 90 '2~405 2.25 2.40 2;50'5.5 2.75 2.756 2.75 3.00 2.906.5 3.00 3.007 3.00 3.25 3.107.58 3.258.52.25 3.259 3.25 3.25 3.309.510 3.2510.53.30 3.3011 3.25 3.30 3.3012 Bottom@ 12.25 M 3.30 3.3013 3.40 3.30Source:Corps of Engineers.A
SOLOMON. CREEKSeEtember 1979 October 1979 November.1979COHigh Low Aver. High Low Aver. . High Low Aver.Tem:e. Tem:e. TeriJ:e. . Temp. TemE·· Tem:e. Temp. . Tem:e. Tem:e •1 12 5 6 32 12 6 33 9.6.8 34 11 6 7 35 6 5 7 26 12 5 7 L7 5 8 18 5 8 19 10 5 8 010 12 7 11 5 2 111 12 7 5 3 212 13 8 5 ·3 213 12 9 5 2 114 13 8 5 1.515 8 4.5 4.5 1.516 8.5 4.5 3.5 6 1.517 7. 7 4 6 218 7 6 10 4 6 119 7 10 4 .6 120 7 11 4 5 021 7 6 10 3 7 122 6 9 2 7 123 6 9 2 7 124 6 9 2 6 125 6 9 3 6 126 6 9 3 6 127 6 9 3 5 128 9 6 8 3 6 129 11 6 9 3 5 130 6 9 3 6 1Source:Alaska Department of Fish <strong>and</strong> Game~.. 31
RESPONSES TO RECOMMENDATIONS of <strong>the</strong> U.S. Fish <strong>and</strong> Wildlife Service in <strong>the</strong>Final Coordination Act Report.1. That <strong>the</strong> design of <strong>the</strong> powerhouse allow <strong>the</strong> release of regulatedflows to Allison Creek throught <strong>the</strong> tailrace <strong>and</strong> excess flows to Port<strong>Valdez</strong> through <strong>the</strong> o<strong>the</strong>r tailrace.Response: The selected plan includes a two tailrace system which wouldallow regulated flows to both Allison Creek <strong>and</strong> Port <strong>Valdez</strong>.2. That flows from <strong>the</strong> powerhouse tailrace to Port <strong>Valdez</strong> be dischargedsubtida11y to at least -10 feet MLLW from June through September.Response: During <strong>the</strong> advanced engineering <strong>and</strong> design phase, studies willbe conducted to determine stream temperatures with project operation. If<strong>the</strong>se studies indicate <strong>the</strong> stream temperature during <strong>the</strong> spawning wouldbe below <strong>the</strong> critical level <strong>and</strong> all <strong>the</strong> project discharge could not bedischarged into Allison Creek during spawning, mitigative measures, suchas a subtidal outlet would probao1y be employed.3. That <strong>the</strong> proposed start-up of project operation affecting <strong>the</strong> naturalflows in Allison Creek occur in an even year.Response: The initial drawdown <strong>for</strong> securing <strong>the</strong> tap <strong>and</strong> <strong>the</strong> placement oftrash racks would probably occur during <strong>the</strong> winter months when flows into<strong>the</strong> Port <strong>Valdez</strong> tai1ace <strong>and</strong> would have no impacts on <strong>the</strong> incubating eggswithin Allison Creek <strong>and</strong> <strong>the</strong> intertidal area. Project operation wouldprobably occur with <strong>the</strong> refilling of <strong>the</strong> lake <strong>the</strong> same year as <strong>the</strong>drawdown. It would be impossible at this time to insure project startupwould occur in an even year.4. That <strong>the</strong> timing of proposed construction activities in or on <strong>the</strong>banks of Allison Creek be coordinated with <strong>the</strong> FWS, NMFS, <strong>and</strong> <strong>the</strong> ADF&G.Response: This recommendation will be included in <strong>the</strong> stipulations to<strong>the</strong> contractor.5. That streambanks be restored to preproject integrity during <strong>the</strong>construction season in which <strong>the</strong>y are damaged <strong>and</strong> debris or vegetation bekept out of streams.Response:Refer to response to number four.6. That any structures placed in or across streams be removed during <strong>the</strong>same construction season.Response:Refer to response to number four.
7. That clearing <strong>for</strong> <strong>the</strong> penstock construction be limited to largeshrubs <strong>and</strong> any trees whi~h may be encountered.Response: Some clearing to base ground would be required <strong>for</strong> <strong>the</strong> footingof <strong>the</strong> pensto~k brac~s. Stipulations to <strong>the</strong> contractor would includerevegetati6n in areas where erosion could possibly occur.8. That during <strong>the</strong> const:'uction phase, bulk fuels, lubricants, <strong>and</strong> o<strong>the</strong>rpotential pollutants be stored in leakproof containers within an areasurrounded by a containment berm at a minimum of 300 feet from any streamor water body.Response:Refer to response to number four.9. That no feeding of wildlife occur <strong>and</strong> all refuse be placed in metalcontainers with heavy lids <strong>and</strong> removed regularly.Response:Refer to response to number four.lO. That <strong>the</strong> transmission line construction be governed by "SuggestedPractices <strong>for</strong> Raptor Protection on <strong>Power</strong>lines," Raptor ResearchFoundation. 1975.Response:practices.The design of <strong>the</strong> transmission lines will follow <strong>the</strong> above.11. That clearing <strong>for</strong> <strong>the</strong> transmission line right-of-way be limited toonly that area needed <strong>for</strong> construction <strong>and</strong> be reduced by lea~ing shrubs<strong>and</strong> blending <strong>the</strong> edges of <strong>the</strong> clearing with <strong>the</strong> surrounding vegetation.Response:Refer to response to number four.12. That an erosion control plan <strong>and</strong> instream work plan be prepared <strong>and</strong>made available to resource agencies <strong>for</strong> review <strong>and</strong> comment be<strong>for</strong>econstruction.Response: Little instream work is anticipated, however <strong>the</strong>recommendation will be included in <strong>the</strong> stipulations to <strong>the</strong> contractor~13. That <strong>the</strong> CE collect natural discharge data of Allison Creekcontinuously <strong>for</strong> at least one year, beginning as soon as possible.Response: At least one stream gage will be installed on Allison Creekduring <strong>the</strong> advanced engineering <strong>and</strong> design phase <strong>and</strong> it will collect data<strong>for</strong> several years.14. That <strong>the</strong> CE maintain <strong>the</strong> <strong>the</strong>rmograph in Allison Creek to collectnatural temperature data continuously during <strong>the</strong> one year period thato<strong>the</strong>r temperature data is recorded.Response: The <strong>the</strong>rmograph is in place at this time <strong>and</strong> will remaincollecting temperatures well after project completion.
15. That <strong>the</strong> CE collect intragravel temperature data of Allison Creekcontinuously <strong>for</strong> at least one year, beginning as soon as possible.Response: Intragravel temperature data will be collected during <strong>the</strong>advanced engineering <strong>and</strong> design phase.16. That <strong>the</strong> CE take temperature profiles of Allison Lake to <strong>the</strong> laketap depth <strong>and</strong> temperature, dissolved oxygen, turbidity, heavy metal, <strong>and</strong>pH readings at <strong>the</strong> lake surface as well as <strong>the</strong> depth of <strong>the</strong> lake tap.These measurements should be collected as soon as possible. A minimumsampling ef<strong>for</strong>t would include <strong>the</strong> months of March, June, September, <strong>and</strong>December.Response: Refer to response to number 15.17. That <strong>the</strong>.CE collect continuous temperature data below <strong>the</strong> proposedtailrace into Allison Creek <strong>for</strong> at least <strong>the</strong> first year of projectoperation.Response: The <strong>the</strong>rmograph which is now operating in Allison Creek willcontinue to collect data <strong>for</strong> at least <strong>the</strong> first year after projectcompletion.18. That <strong>the</strong> CE determine <strong>the</strong> base flow in Allison Creek expected above<strong>the</strong> powerhouse after project op~ration.Response: Preliminary estimates have been completed <strong>and</strong> are included inthis report. A gage will be installed during AE&D <strong>and</strong> maintained afterproject completion.19. Response: An eagle nest survey will be.conducted prior to anyconstruction associated with <strong>the</strong> project.20. That provisions be included in advanced project planning <strong>for</strong>escapement survey of salmon in Allison Creek by <strong>the</strong> FWS or ADF&G.Response: ADF&G, has indicated <strong>the</strong>y would increase <strong>the</strong>ir ef<strong>for</strong>t onAllison Creek. During AE&D at least one year of intensive an escapementsurvey will be conducted.21. That provisions be made in advanced project planning <strong>for</strong> instreamflow analysis of Allison Creek by <strong>the</strong> FWS to determine optimum flowschedules <strong>and</strong> <strong>the</strong> velocity of supplemental flows to Allison Creek.Response: Provisions <strong>for</strong> flow analysis of Allison Creek will be includedin <strong>the</strong> AE&D phase. Whe<strong>the</strong>r an extensive instream flow analysis isreqUired is not known at this time.
22. That a cooperative study of <strong>the</strong> proposed Allison Creek Hydropowerproject, jointly scoped by <strong>the</strong> CE <strong>and</strong> FWS <strong>and</strong> funded by <strong>the</strong> CE, beconducted through project construction <strong>and</strong> operation.Response: The U.S~F.W.S. will be involved in <strong>the</strong> scoping process <strong>for</strong>environmental studies during <strong>the</strong> AE&D.23. That, if after execution of <strong>the</strong> recommended additional studies, itis determined that some losses to fish <strong>and</strong> wildlife are unavoidable,those losses be offset by implementation of mitigation measures mutuallyacceptable to <strong>the</strong> FWS <strong>and</strong> <strong>the</strong> CEoResponse: The CE is in full accord.
123456789101112131415161718192021222324252627282930December 1979HighTemp.66777676510.63.82.44.03.74.54.44.54.64.63.73.34.84.84.44.33.23.02.9LowTemp.111100000-0.7-0.6-0.6-0.6-n.s-0.5-0.5-0.7-0.5-0.3-0.4-0.4-0.3-0.4-0.2-0.2-0.2-0.2-0.2-0.3-0.5Aver.Temp.SOLOMON CREEKJanuary 1QROHighTemp.3.84.12.53.53.73.13.33.21.22.72.92.22.93.42.93.12.83.02.32.63.02.01.R1.82.11.53.12.82.42.8LowTemp.-0.5-0.3-0.4-0.2-0.2-0.2~0.2. -0.2-0.5-0.5-0.6-0.6-0.3-n.S-0.3-0.3--0.2-0.2-0.2-0.2-0.2-0.3-0.5-0.5-0.5-0.5-0.4-0.5-0.5-0.5Aver.Temp.Source:Alaska Department of Fish <strong>and</strong> Game.February 19ROHighTemp,2.93.03.12.22.52.n2.22,f)1.61.7. 2.01.f)1.71.91.81.72.12.02.82.62.52.62.02.n2.42.33.8LowTemp.-n.4-0.3-0.3-0.5-0.1-0.3-0.4-0.5-0.5-0.2-0.4-n,R-n.S-0.5-n.4-0.7-0.5-n.S-0.4-0.3-n.3-n.3-0.4-0,5~b.3.... 0,2,""0.2Aver.Temp.
APPENDIX IMARKETABILITY REPORT
Val d ez - G len n a lie nPovver MarketAnal'ysisJanuary <strong>1981</strong>U.S. Depart ment of EnergyAlaska <strong>Power</strong> AdministrationJuneau, Alaska 99802
Department Of EnergyAlaska <strong>Power</strong> AdministrationP.O. Box 50Juneau, Alaska 99802January 27, <strong>1981</strong>Colonp.l Lee NunnDistrict EngineerCorps of EngineersAlaska DistrictP.O. Box 7002Anchorage, AK 99510Dear Colonel Nunn:This is Alaska <strong>Power</strong> Administration's power market report <strong>for</strong> <strong>the</strong><strong>Valdez</strong>-Glennallen area.The power market analysis includes load projections, power market size<strong>and</strong> characteristics, a review of available alternatives, <strong>and</strong> a determinationof marketability <strong>and</strong> financial feasibility. APA consideredvarious alternative power supply alternatives as follow-on projectsafter completion of <strong>the</strong> Solomon Gulch Project. They were:1. Allison Creek.2. Pressure reducing turbines (PRT's) in <strong>the</strong> Alyeska Pipeline.3. Interconnection of CVEA system with Railbelt power supplies.4. Use of diesel generation.The marketability findings were:1. PRT' s appeared to have a tremendous cost advantage over o<strong>the</strong>ralternatives.2. If PRT's are constructed, Allison Creek could be deferred afew years. If not, Allison Creek would be needed as soon aspossible after completion of Solomon Gulch.3. Allison Creek represents generally a higher cost of powercompared to o<strong>the</strong>r projects now under active consideration in<strong>the</strong> State.4. Railbelt power supplies made available through interconnectioncould be competitive with Allison Creek.
2APA concludes that <strong>the</strong> outlook <strong>for</strong> financial feasibility is sufficientlyfavorable to warrant steps towards project authorization, but recommendsrep-valuation of <strong>the</strong> power markets <strong>and</strong> alternative costs prior to construction.EnclosureSincerely,·/-7 /7I{-:'-V. @~Robert J. CrossAdministrator
<strong>Valdez</strong>/Glennallen <strong>Power</strong> Market AnalysisCONTENTSChapterI. INTRODUCTION...............................................Purpose <strong>and</strong> Scope..................................... 1Project Plans <strong>and</strong> Costs...............................Previous Studies...................................... 1I I • SUMMARY. • • • • • • • • • • • • • • • • • • • • • • • • • • • • • • • • • • • • • • • • • • • • • • • • • • • 3III. POWER MARKET DESCRIPTION AND OUTLOOK....................... 7Location.............................................. 7Economy. • • • • • • • • • • • • • • • • • • • • • • • • • • • • • • • • • • • • • • • • • • • • • • 7Population <strong>and</strong> Employment............................. 9IV. EXISTING POWER SySTEMS..................................... 11System................................................ 11Installed Capacity.................................... 11Historical Loads...................................... 12General.......................................... 12Energy Growth Relationships...................... 12Load Factors ••••••••••••••••••••••••••••••••••••• 15Rates................................................. 16V. FUTURE POWER AND ENERGY ASSUMPTIONS AND REqUIREMENTS....... 17Energy <strong>and</strong> Peak Dem<strong>and</strong> Forecasts...................... 17Installed Capacity Forecast <strong>and</strong> Future Needs.......... 18Energy Distribution................................... 18VI. ALTERNATIVE GENERATION AND COSTS ••••••••••••••••••••••••••• 23Hydropower............................................ 23Tidal Powe r • • • • • • • • • • • • • • • • • • • • • • • • • • • • • • • • • • • • • • • • • • • 24Steamplants........................................... 24Coal-fired....................................... 24Oil- <strong>and</strong> Gas-fired............................... 24Biomass-fired •••••••••••••••••••••••••••••••••••• 25Solar............................................ 25Nuclear •••••••••••••••••••••••••••••••••••••••••• 25Combustion or Gas Turbines............................ 25Diesels ••••••••••••••••••••••••••••••••••••••••••••••• 25Geo<strong>the</strong>rmal <strong>Power</strong>plants................................ 25Wind 'Ma.chi-nes ••.•• "................................... 26Exogp.nous Supply •••••••••••••••••••••••••••••••••••••• 26O<strong>the</strong>r Altprnatives.................................... 26VII. LOAD/RESOURCE ANALySIS ••••••••••••••••••••••••••••••••••••• 29Installed Capacity •••••••••••••••••••••••••••••••••••• 29Ne t Energy............................................ 30i
ChapterVIII.IX.FINANCIAL ANALySIS ••••••••••••••••••••••••••••••••••••Co'st Summary •••••••••••••••••••••••••••••••••••••Average Rates ••••••••••••••••••••••••••••••••••••B IBL IOGRAPHY ••••••••••••••••••••••••••••••••••••••••••39394559ii
List of·Tab1esTableIII-1IV-1IV-2V-IV-2VII-1VII-2VII-3VIII-1AVIII-1BVIII-2VIII-3VIII-3A.VIII-4VIII-4AVIII-5VIII-6VIII-7VIII-8VIII-9VIII-lO·VIII-lOAVIII-llVIII-12Demographic Data •••••••••••••••••••••••••••••••••••••• 10Historical Loads •••••••••••••••••••••••••••••••••••••• 13Historical Growth Rates <strong>and</strong> Energy Use................ 14<strong>Valdez</strong>/Glennallen Area Utility Load Estimates......... 19Installed Capacity Estimates <strong>and</strong> Existing Generation •• 21<strong>Valdez</strong>/Glennallen Forecast with Allison Creek Supply.. 31<strong>Valdez</strong>/Glennallen Forecast with PRT Supply............ 32<strong>Valdez</strong>/Glennallen Forecast with Allison Creek<strong>and</strong> PRT Supply ........ • -••••••• e, •••••• '.......... ••• •• 33Summary Cost Estimate Allison Creek Alternate No. 1. 40Summary Cost Estimate Allison Creek Alternate No. 2. 41Summary Cost Estimate Pressure Reducing Turbine ••••• 42Summary Cost Estimate Railbe1 t Area toGlennallen Intertie •••• ~ ••••••••••••••••••••••••••• 43Average Rate Determination - Anchorage Portion ofRailbel t System ••••• ~ ••••••••••••••••••.•••••••••••CVEA Diesel Generation Expenses - Historic ••••••••••••CVEA Diesel Generation Expenses - Future ••••••••••••••Average Rate Comparisons •••••••••••••••••••••••••.•••••Average Rate Determinations - Allison CreekAl tp:rna t ive No.1 ••.••••••••,••••••••••••••••••• e-. • • 50Average Rate Determination - Allison CreekAlternative No.2 •••••••••••••••••••••••••••••••••• 51Average Rate Determination - PressureReducing Turbi~e ••••••••••••••••••.••••• e._.... .. ... 52Average Rate Determination - Interconnectionwith Rai1be1t System •••••••••••••••••••••••••••••••Average Rate Determination - ContinuedDiesel Generation-(5 Percent Fuel Escalation) ••••••Average Rate Determination - ContinuedDiesel Generation-(2 Percent Fuel Escalation) ••••••Average Rate Determination Allison Creek Case •••••••Average Rate Determination - Intertie Case ••••••••••••444647485354555657iii
List of FiguresFigureIII-l Utility Market •••••••••••••••••••••••••••••••••••••••• 8V-I <strong>Valdez</strong>/Glennallen Area Energy Forecasts •••••••••••••••• 20VII-l <strong>Valdez</strong>/Glennallen Capacity/Resource Diagram •••••••••••• 34Plan 1 Allison Creek Alternative 1 or 2 •••••••••• 34Plan 2 Pressure Reducing Turbine ••••••••••••••••• 34VII-2 Plan 3 Continuing Thermal Generation ••••••••••••• 35VII-3 <strong>Valdez</strong>/Glennallen Net Energy/Forecast Resource ••••••••• 36Plan 1 Allison Creek Alternative No.1 ••••••••••• 36VII-4 Plan 2 Pressure Reducing Turbine ••••••••••••••••• 37VII-5 Plan 3 Continuing Thermal Generation ••••••••••••• 38VIII-l<strong>Valdez</strong>/Glennallen - Alternative GenerationSources' - Busbar Costs .•...•••••..•.•• 0 •••••••••••••• 49iv
<strong>Valdez</strong>/Glennallen <strong>Power</strong> Market AnalysisCHAPTER IINTRODUCTIONPurpose aQd ScopeThis power market analysis evaluates alternatives <strong>for</strong> meeting <strong>the</strong> powerneeds of <strong>the</strong> <strong>Valdez</strong>/Glennallen areas after full utilization of <strong>the</strong>Solomon Gulch hydro project, now under construction. Included are powermarket <strong>for</strong>ecasts, analyses of various alternatives <strong>for</strong> supplying <strong>the</strong>projected needs, <strong>and</strong> estimates of future energy costs. The <strong>Valdez</strong> <strong>and</strong>Glennallen areas are considered as one, <strong>for</strong> <strong>the</strong> purposes of this report,since <strong>the</strong> <strong>Copper</strong> Valley Electric Association (CVEA) line between <strong>the</strong> twoareas is presently under construction.The analysis primarily focuses on <strong>the</strong> Allison Creek Hydro Project as apotential to meet area power needs after full utilization of SolomonGulch. It also looks at <strong>the</strong> alternatives of (1) pressure reducingturbines in <strong>the</strong> Alyeska Pipeline, <strong>and</strong> (2) interconnection with Railbeltarea power supplies.Project Plans <strong>and</strong> CostsThe Corps of Engineers Southcentral Railbelt Stage II Checkpoint reportof April 1978 titled, Hydroelectric <strong>Power</strong> <strong>and</strong> Related Purposes <strong>for</strong><strong>Valdez</strong>, Alaska, identified <strong>the</strong> Allison Creek project lake tap scheme ashaving <strong>the</strong> best potential of several alternatives considered. Sincethat report, <strong>the</strong> Corps designed two alternatives <strong>for</strong> using a powertunnel <strong>and</strong> a penstock between lake tap <strong>and</strong> powerplant. Alternative 1uses a "lower" powerplant near <strong>the</strong> shoreline <strong>and</strong> alternative 2 an"upper" one on <strong>the</strong> mountainside. The following chart outlines <strong>the</strong>se:<strong>Power</strong>plant LocationInstalled CapacityAverage Annual EnergyFirm EnergyPlant Factor (firm)Project CostUnit <strong>Power</strong> CostAverage Annual CostUnit Energy CostTransmission LineAlternative 1Lower8 MW39,350 MWH34,300 MWH48.9%$37,250,000$5,029/kW$3,489,52110.2¢/kWh3 milesPrevious StudiesAlternative 2Upper8 MW37,250 MWH32,200 MWH45.9%$34,301,000$4,63l/kW$3,229,17610.0¢/kWh3.5 milesAn inventory of potential hydroelectric sites in Alaska was done by <strong>the</strong>Alaska District of <strong>the</strong> U.S. Bureau of Reclamation (now <strong>the</strong> Alaska <strong>Power</strong>Administration) in <strong>the</strong> 1960's. Several sites near <strong>Valdez</strong>, includingAllison Creek, were part of this inventory. However, when <strong>the</strong> inventory1
list was classified into <strong>the</strong> 76 most economical, Allison Creek was notincluded. Higher fuel co~ts have since changed <strong>the</strong> economic outlook.Allison Creek project has not previously been studied as a lake tapscheme, o<strong>the</strong>r than in <strong>the</strong> above mentioned, Corps report. However, <strong>the</strong>project with a dam has been included as an alternative or an adjunct toSolomon Gulch in studies by Robert W. Re<strong>the</strong>r<strong>for</strong>d Associates (see bibliographyitems 8, 10, 15). Re<strong>the</strong>r<strong>for</strong>d, as well as <strong>the</strong> Corps, concludedthat <strong>the</strong> scheme with a dam was not feasible.Load <strong>for</strong>ecasts of <strong>the</strong> <strong>Valdez</strong>/Glennallen area have been reported inseveral reports •. <strong>Copper</strong> Valley Electric Association <strong>and</strong> REA jointlystudy future loads about every two years. Results are shown in severalSolomon Gulch studies <strong>and</strong> in <strong>the</strong> Robert W. Re<strong>the</strong>r<strong>for</strong>d Asssociates reportsof po~er supply (see bibliography items 1, 3, 9, 10, 11, 15, 17, 18).The ,Upper Susitna <strong>River</strong> Project Market Study completed by APA in 1979<strong>and</strong> <strong>the</strong> Alaska Water Study Committee S.C. Alaska Level B Phase I studyinclude sections on <strong>the</strong> <strong>Valdez</strong>/Glennallen area.2
CHAPTER IISUMMARY<strong>Valdez</strong> <strong>and</strong> Glennallen, both served by <strong>Copper</strong> Valley Electric Association(CVEA), <strong>and</strong> <strong>the</strong> Alyeska Pipeline terminal in <strong>Valdez</strong> are all presentlysupplied from oil-fired electric generation. CVEA is currently into. construction of <strong>the</strong> l2-MW Solomon Gulch hydro project. Assumed projecton-line-dateis <strong>1981</strong>. A l38-kV transmission line between <strong>Valdez</strong> <strong>and</strong>Glennallen is also assumed to be completed in <strong>1981</strong>.This report dealt primarily with alternatives <strong>the</strong> <strong>Valdez</strong>/Glennallenareas have <strong>for</strong> meeting <strong>the</strong>ir electric power needs after full utilizationof Solomon Gulch. .The <strong>Valdez</strong> area <strong>and</strong>, toa lesser extent, <strong>the</strong> Glenallen area experiencedrapid growth during <strong>the</strong> Alyeska pipeline construction period of 1974 to1977.· The following table shows a summary of historical annual growthrates.ResidentialPeriod Growth (%)1970-1973 7.71973-1977 50.01977-1979 -9.4<strong>Valdez</strong>Commercial/IndustrialGrowth (%)3.438.2-3.91970-1973 15.91973-1977 24.01977-1979 -7.5Glennallen5.042.6-9.8Energy use per customer in 1979 was:Residential6,666 kWh<strong>Valdez</strong>Commercial/Industrial62,350 kWhResidential4,708 kWhGlennallenCommercial/Industrial55,171 kWhCVEA retail rates <strong>for</strong> electric energy in 1979 were:(revenue per kWh)Residentiall2.7e<strong>Valdez</strong>Commercial/Industrial10.geResidentiall4.leGlennallenCommercial/Industrial13.4eThe annual cost of generation in <strong>the</strong> CVEA area in 1979 averaged 8.le perkWh. Preliminary input from <strong>the</strong> utility indicates close to lOe/kWh in1980.3
It was found that <strong>the</strong>re are considerable uncertainties in making load<strong>for</strong>ecasts <strong>for</strong> this area. For example, <strong>the</strong>re are many questions onprecise timing <strong>and</strong> numbers of jobs associated with <strong>the</strong> construction <strong>and</strong>operation of <strong>the</strong> State's Alaska Liquid Petroleum Company Refinery(ALPETCO) scheduled <strong>for</strong> <strong>Valdez</strong>. Because of such contingencies, both<strong>Valdez</strong> <strong>and</strong> Glennallen have potential <strong>for</strong> growth appreciably differentthan <strong>the</strong> assumed <strong>for</strong>ecast. The basic <strong>for</strong>ecast adopted was presented in<strong>the</strong> CVEA <strong>Power</strong> Cost Study of January 1980. That <strong>for</strong>ecast <strong>the</strong>n wasextrapolated to year 2000 <strong>and</strong> adjustments made to reflect conservation<strong>and</strong> estimated additional loads during ALPETCO construction <strong>and</strong> operation.Future power requirements are estimated as follows:<strong>Valdez</strong>EnerSil (GWH) Dem<strong>and</strong> (MW) caj2acityl/ (MW)Historical 1978 23.4 4.8 10.11979 23.0 4.2 10.11980 26.5 5.4 7.21985 48.0 9.8 13.11990 57.0 11.7 15.61993 63.0 12.9 17.22000 76.0 15.2 20.3GlennallenEnerSil (GWH) Dem<strong>and</strong> (MW) CaEacityl/ (MW)Historical 1978 20.4 4.0 7.61979 18.5 3.5 7.61980 21.4 4.4 5.91985 29.5 5.8 7.71990 40.6 7.8 10.41993 49.2 9.2 12.32000 70.0 14.0 18.71./ Forecasted capacity is computed from peak dem<strong>and</strong> + 75% (assumes25 % reserves).Various alternative power supply alternatives were considered as followonprojects after Solomon Gulch:1. Allison Creek2. Pressure reducing turbines (PRT's) in Alyeska Pipeline3. Interconnection of CVEA system with Railbelt power supplies4. Use of diesel generationLoad/resource <strong>and</strong> cost analysis were per<strong>for</strong>med to compare <strong>the</strong> <strong>for</strong>ecastedloads with <strong>the</strong> alternatives listed above. The load/resource resultsindicated:4
A. Assuming Allison Creek follows Solomon Gulch:1. CVEA needs energy <strong>and</strong> capacity immediately after completion ofSolomon Gulch.2. Allison Creek firm energy would be fully utilized by 1985.3. Allison Creek capacity plus Solomon Gulch can supply <strong>the</strong> areapeak dem<strong>and</strong> until 1991.B. Assuming PRT's follow Solomon Gulch:1. Allison Creek energy would not be needed until about 1990.2. Solomon Gulch, Allison Creek, <strong>and</strong> PRT capacity <strong>and</strong> firm energywould all be fully utilized be<strong>for</strong>e 2000.The cost analyses showed <strong>the</strong> following:1. Allison Creek alternative 1 has slightly higher power costthan Allison Creek alternative 2. Both are about 10¢ per kWh,under current prices, assuming 50-year payout, <strong>and</strong> with 8 percentinterest rate.2. PRT unit costs are about one-fourth of Allison Creek.3. Allison Creek power costs appear comparib1e with 1980 dieselgeneration costs.4. Based on rough studies from <strong>the</strong> March 1979 Upper Susitna <strong>Power</strong>Market Study, with allowance <strong>for</strong> inflation to <strong>the</strong> present, cost ofpower supply obtained through an interconnection to <strong>the</strong> Rai1be1tmay be comparable to or slightly higher than Allison Creek.The marketability findings are as follow:1. PRT's appear to have a tremendous cost advantage over <strong>the</strong>o<strong>the</strong>r available alternatives.2. If PRT's are constructed, Allison Creek would be deferred afew years. If not, Allison Creek would be used about as quickly asit could be brought on line after Solomon Gulch.3. Allison Creek represents generally a higher unit cost of powerthan o<strong>the</strong>r projects now under active consideration elsewhere in<strong>the</strong> State.4. It appears probable that power supplies made available throughinterconnection with <strong>the</strong> main Rai1be1t area load centers would becompetitive with Allison Creek.5
5. Marketing vagarities (loads, Railbelt intertie, local or stateconstruction) make present comparisons uncertain.Interest rates <strong>for</strong> repayment of Federal investment in power projects arekeyed to long-term borrowing costs, with an annual determination by <strong>the</strong>Secretary of Treasury. The <strong>for</strong>mula is based on average costs of governmentsecurities with 15 or more years to maturity at <strong>the</strong> beginning ofeach fiscal year. Changes in <strong>the</strong> rate to be applied to new investmentsare limited to one-half percent per year.Studies <strong>for</strong> this re.port used an 8 percent interest rate, which was <strong>the</strong>rate to be applied <strong>for</strong> new Federal investment in FY 1980.A larger increase in borrowing costs was experienced in FY 1980, asreflected in Tn~asury' s determination that <strong>the</strong> average rates <strong>for</strong> <strong>the</strong>long-term securities as of October 1, 1980 was in excess of 10 percent(10.25). Thus, if Allison Creek Project is constructed in <strong>the</strong> mid tolate 1980's, it is likely that <strong>the</strong> project interest rate will be 10percent or higher.Under <strong>the</strong> 8 percent assumption <strong>and</strong> October 1980 price levels, annualreserves $3,229,000 are needed to cover operations, maintenance, <strong>and</strong>amortization costs <strong>for</strong> Allison Creek. Under a 10 percent assumption,annual reserve requirements would be $3,937,000, an increase of 22percent. Average rates <strong>for</strong> repayment would reflect similar increases.These figures do not reflect future inflation.Changes in interest rate <strong>and</strong> future inflation would have similar impactson costs <strong>for</strong> alternative power sources.APA concludes that <strong>the</strong> outlook <strong>for</strong> financial feasibility is sufficientlyfavorable to warrant steps towards project authorization, but recommendsreevaluation of <strong>the</strong> power markets <strong>and</strong> alternative costs prior to construction.6
CHAPTER IIIPOWER MARKET DESCRIPTION AND OUTLOOKLocation<strong>Valdez</strong>, situated in <strong>the</strong> nor<strong>the</strong>ast corner of Prince William Sound, is now~~ll known as <strong>the</strong> sou<strong>the</strong>rn·· termim,ls of <strong>the</strong> Alaska oil pipeline. It isals~ . <strong>the</strong>·sou<strong>the</strong>rn termin~s of <strong>the</strong> Richardson highway, which leads toFairbanks, 363 miles·north. Anchorage is 306 miles by road from <strong>Valdez</strong>.The Alaska Marine Highway connects <strong>Valdez</strong> to Whittier <strong>and</strong> Cordova. Itis served by air, but not mainline schedules.Glennallen, about half way between <strong>Valdez</strong> <strong>and</strong> Fairbanks, is 115 milesnorth on <strong>the</strong> Richardson highway. It is <strong>the</strong> eastern end of <strong>the</strong> Glennhighway, 189 miles from Anchorage.Figure 111-1 locates <strong>Valdez</strong> <strong>and</strong> Glennallen geographically.Economy<strong>Valdez</strong> economy be<strong>for</strong>e <strong>the</strong> oil pipeline was based on fishing <strong>and</strong> government.Be<strong>for</strong>e <strong>the</strong> 1964 earthquake, shipping played a part. The pipelineactivity has had heavy impact since 1970 when <strong>the</strong> first pipe stockpilingstarted. Oil storage <strong>and</strong> shipping facilities have been operating in<strong>Valdez</strong> since <strong>the</strong> middle of 1977. Stability is returning after <strong>the</strong>extreme economic <strong>and</strong> demographic fluctuations caused by pipeline constructionbetween 1974 <strong>and</strong> 1976, <strong>and</strong> construction "wind-down" in late1976 <strong>and</strong> early 1977. The following chronology summarizes economicactivity in <strong>Valdez</strong> since 1970:1970 - Beginning of pipe delivery to <strong>Valdez</strong> <strong>and</strong> o<strong>the</strong>r areas along<strong>the</strong> pipeline corridor.1971 - Value of pipe dropped off but delivery of pipe continued.1972 <strong>and</strong> 1973 - No pipe delivered in this period. Business receiptsdecreased by SO percent in 1972 <strong>and</strong> continued to decrease in 1973.1974 to 1976 - Pipe delivery resumes with seven-fold increase by1975. Community experiences an ll-fold increase in businessreceipts from 1974 to 1975 <strong>and</strong> a four-fold increase from 1975 to1976.1976 - Peak of pipeline terminal construction. Pipe delivery eighttimes less than 1975 activity.1977 - Operation of pipeline <strong>and</strong> terminal began in late summer.CVEA service of some pump station utility type loads commenced.Since 1977, <strong>Valdez</strong> economy, judged by employment, dipped <strong>for</strong> severalmonths after pipeline operation commenced, <strong>the</strong>n recovered with cyclic7
Figure III-lALASKA POWER ADMINISTRATIONUTILITY NARKET AREASMARCH 1979o1:0DI Il.!C-8[iTCL r Kor SlNmEGION8
increases. Municipal construction has been perhaps <strong>the</strong> major vehicle ofeconomic stability in <strong>the</strong> last two years. Three municipal buildings,port <strong>and</strong> airport improvements, <strong>and</strong> <strong>the</strong> start of Solomon Gulch hydroprojecthave been <strong>the</strong> major activities. Along with "gearing-up" <strong>for</strong> <strong>the</strong> proposedALPETCO refinery, <strong>the</strong> city is working towards re-establishing its preearthquakestatus as a significant port <strong>for</strong> more than oil tankers. Noindications point towards a future economic downturn <strong>for</strong> <strong>Valdez</strong>.Glennallen <strong>and</strong> its neighboring towns are crossroad <strong>and</strong> tourist dependentplaces. Interior Alaska government functions also contribute to <strong>the</strong>economy. The pipeline activity had a definite influence but not assevere as in <strong>Valdez</strong>. No definite activities appear in <strong>the</strong> offing toalter <strong>the</strong> area economy. The proposed gas pipeline in <strong>the</strong> Alaska highwaycorridor is not within commuting distance of Glennallen; so its impactis expected to be minimal to negligible. Recent oil exploration activitynear <strong>the</strong> area appears now to be small <strong>and</strong> uncertain. The Glennallenarea will exp<strong>and</strong> with <strong>the</strong> state tourism industry.Population <strong>and</strong> EmploymentAvailable demographic statistics do not separate <strong>Valdez</strong> <strong>and</strong> Glennallen.Statewide data is disaggregated into census divisions <strong>and</strong> both placesare included in <strong>the</strong> <strong>Valdez</strong>-Chitina-Whittier census division.Table 111-1 shows annual historic values of population, employment, <strong>and</strong>housing starts, which come from Alaska Department of Labor <strong>and</strong> Departmentof Housing <strong>and</strong> Urban Development publications (see bibliography items 2,7,14,16).The peak of <strong>Valdez</strong> pipeline terminal construction, <strong>the</strong> dip at <strong>the</strong> end ofconstruction, <strong>and</strong> <strong>the</strong> increase with recent construction activity clearlyshow in <strong>the</strong> employment statistics. Preliminary 1979 data indicatespopulation decline has leveled off. Housing starts also indicate anincrease, from 14 starts in 1978 to 29 starts in 1979.Overall, it appears <strong>the</strong> pipeline boom-bust cycle left <strong>Valdez</strong> on a somewhathigher economic plane than be<strong>for</strong>e <strong>the</strong> pipeline. The future outlook iscontinuing moderate (compared to pipeline construction years) growthuntil <strong>the</strong> ALPETCO installation is completed, <strong>the</strong>n steady but smallergrowth at least to <strong>the</strong> year 2000. The Environmental Protection AgencyEnvironmental Impact Statement of December 1979 estimates 2,800 employeesmay be needed at ALPETCO construction peak <strong>and</strong> 1,200 <strong>for</strong> operations.9
Census DivisionTABLE III-1Demographic Data--<strong>Valdez</strong>/Chitina/Whittier1970 1971 1972 1973 1974 1975 1976 1977 1978 1979Population 3,098 2,932 3,464 3,568 3,833 9,639 13,000 9,905 5,000 5,OOO(p)Employment 1/ 831 1,085 904 985 1,526 . 4,626 7,818 3,768(r) 2,043 2,140(1st 9Employment 2/ 1;209 2,023 3,054 2,794 2,143 2,239Unemployment 2/ 8.8 6.9 9.3 14.1 18.1 11.4(Percent)Housing Starts 1 0 6 6 161 85 39 33 14 29(p) = preliminary.(r) = revised since previous use.1/ Nonagricultural wage <strong>and</strong> salary employment by place of work (based on jobs).2/ = current population survey (CPS) labor <strong>for</strong>ce statistics (based on people).mas)Source: Alaska Department of Labor, Research <strong>and</strong> Analysis Division Alaska <strong>Power</strong> AdministrationAugust 1980
CHAPTER IVEXISTING POWER SYSTEMSSystemThe <strong>Copper</strong> Valley Electric Association (CVEA) utility serves both Glennallen<strong>and</strong> <strong>Valdez</strong>. Radial distribution lines of CVEA extend from Glennallen30 miles north on <strong>the</strong> <strong>Copper</strong> <strong>River</strong>, 55 miles south on <strong>the</strong> <strong>Copper</strong><strong>River</strong> to Lower Tonsina, <strong>and</strong> 70 miles west on <strong>the</strong> Gl~nn Highway. Theutility is constructing a 138 KV transmission line between <strong>Valdez</strong> <strong>and</strong>Glennallen in conjunction with <strong>the</strong> Solomon Gulch hydroplant construction •.The area contains no national defense installations significant to <strong>the</strong>study, but self-supplied industry is represented by a sizable powerplantat <strong>the</strong> <strong>Valdez</strong> oil terminal. Oil pipeline pumping is not electrical; .however, CVEA supplies utility-type loads at pumping stations within<strong>the</strong>ir market area.Installed CapacityThe installed capacity <strong>for</strong> utility <strong>and</strong> industry by type of prime moveris listed on <strong>the</strong> following table:1979 INSTALLED CAPAC I TY--MWGasTurbine(oil)Diesel(oil)Steam(oil)TotalUtility<strong>Copper</strong> Valley Electric Association--Glennallen. --<strong>Valdez</strong>2.87.67.37.610.1Self-Supplied Industry<strong>Valdez</strong> Oil TerminalPumping Station St<strong>and</strong>by1.21.22.50.052.537.537.540.0·1.241.2<strong>Copper</strong> Valley Electric Association is now cortstructing <strong>the</strong> Solomon Gulchhydro project, a l2-MW plant across <strong>Valdez</strong> Arm from <strong>Valdez</strong>. It isscheduled <strong>for</strong> completion in 1983.11
Historical LoadsGeneral<strong>Valdez</strong> <strong>and</strong> Glennallen utility loads divide into residential, commercial/industrial, <strong>and</strong> o<strong>the</strong>r. "O<strong>the</strong>r" includes street lights, public buildings,utility use, <strong>and</strong> losses. The only load that may be considered industrialis <strong>the</strong> CVEA supplied non-pumping requirements at a few pipelinepumping stations. Table IV-1 lists CVEA loads from 1970 through 1979.Energy use, customers·,. <strong>and</strong> peak dem<strong>and</strong> are shown. The "o<strong>the</strong>r" sector isnot listed separately, but <strong>the</strong> totals include it. Peak dem<strong>and</strong> data isnot metered by sector, so only annual totals can be shown. Some earlieryear customer in<strong>for</strong>mation is not available <strong>for</strong> this study as designatedby '~A" in <strong>the</strong> table.Self-supplied industrial loads were non-existent until 1977 when pipelineoperation commenced. Table IV-1 shows this <strong>Valdez</strong> terminal steamplantload.Energy Growth RelationshipsTable IV-2 shows historical growth rates <strong>and</strong> energy Use per customer.The unsettlednati)re of <strong>the</strong> area is depicted in growth rate variances<strong>and</strong> extremes. <strong>Valdez</strong> residential energy, <strong>for</strong> instance,. jumped from nogrowth in 1973 to 135 percent in 1975. O<strong>the</strong>r extremes were less, butsimilar. Business depressions followed cessation of pipe deliveries in1972 to 1973 <strong>and</strong> pipeline construction in 1977. Extreme economic upturnfrom 1974 to 1976 co-existed with pipeline construction.Examination of Table IV-2 also shows some lack of correlation betweencustomers <strong>and</strong> energy use. <strong>Valdez</strong> residential energy growth peaked ayear earlier than residential customers, <strong>for</strong> instance. Customer growthdropped off more sharply than energy. Pipeline construction employmentcharacteristics can help explain some of this. It is only necessary topoint out he.re, however, that <strong>the</strong>se facts emphasize <strong>the</strong> difficulty inprojecting <strong>the</strong> historical data.The energy use (kWh/customer) statistics show <strong>the</strong> variations too. Ameasure of constancy can be noticed until 1975, <strong>the</strong> year of peak pipelineconstruction. Then, a large usage increase occurred--much more soin <strong>Valdez</strong> than in Glennallen. After 1975, residential use moderatedsomewhat but at a higher level than be<strong>for</strong>e 1975. A large jump in <strong>the</strong>Glennallen commercial/industrial sector in 1977 reflects <strong>the</strong> utilityassumption of pipeline pumping station non-pumping loads.12
TABLE IV-1HISTORICAL LOADS--VALDEZ AND GLENNALLENVALDEZ GLENNALLEN TOTAL eVEA VALDEZYEAR RESI C/I TOTAL RESI C/I TOTAL RESI e/I TOTAL INDUSTRIALENERGY (MWH)1970 1,200 3,800 5,912 900 3,200 4,790 2,134 7,072 10,7021971 1,483 4,010 6,363 1,128 3,447 5,363 2,610 7,457 11,7261972 1,500 3,800 6,202* 1,300 3,400 5,601* 2,796 7,173 11,8031973 1,500 4,200 6,470 1,400 3,700 6,121 2,887 7,942 12,5911974 2,110 6,176 9,457 1,641 3,802 6,167 3,751 9,979 15,6241975 4,966 10,894 18,251 2,690 4,692 8,636 7,656 15,586 26,8871976 6,966 14,353 26,006 3,269 7,570 13,281 10,235 21,923 39,2871977 7,589 15,330 26,060 3,306 15,287 21,401 10,895 30,617 47,461 39,4201978 6,455 14,222 23,411 3,090 13,738 20,425 9,545 27,960 43,835 54,7501979 6,393 14,153 22,977 2,961 12,027 18,522 9,354 26,181 41,499I-'wPEAK DEMAND (kW)1970 1,160 1,030 2,1901971 1,266 1,060 2,3261972 1,270* 1,130* 2,400*1973 1,280 1,220 2,5001974 2,470 1,340 3,8101975 4,750 2,360 7,1101976 4,875 3,500 8,3751977 4,850* 4,290* 9,140 38,560 (capacity1978 4,750 4,000 8,750 40,000 (capacity1979 4,225 3,470 7,695CUSTOMERS1970 N/A N/A N/A N/A N/A N/A 542 219 7861971 348 107 467 329 117 464 677 224 9311972 N/A N/A N/A N/A N/A N/A 651 235 9181973 N/A N/A N/A N/A N/A N/A 680 245 9571974 494 178 685 413 137 575 907 315 1,2601975 637 209 860 531 150 708 1,168 359 1,5681976 1,052 231 1,297 621 171 823 1,673 402 2,1631977 1,040 222 1,276 651 203 887 1,691 425 2,1631978 892 229 1,140 666 194 894 1,558 423 2,0341979 959 217 1,209 629 218 882 1,588 445 2,091* = estimated Alaska <strong>Power</strong> AdministrationApril 1980
TABLE IV-2 Historical Growth Rates (%) <strong>and</strong> Ener~.l Use (kWh/customer)VALDEZ GLENNALLEN TOTAL eVE AYear Resi C/I Total Resi C/I Total Resi C/I TotalENERGY GROWTH RATES (%)1971 23.6 5.5 7.6 25.3 7.7 12.0 22.3 5.4 9.61972 1.1 -5.2 -2.5 15.2 -1.4 4.4 7.1 -3.8 0.7 .1973 0 10.5 4.3 7.7 8.8 9.3 3.3 10.7 6.71974 40.7 47.0 46.2 17.2 2.8 0.8 29.9 25.6 24.11975 135.4 76.4 93.0 63.9 23.4 40.0 104.1 56.2 72.11976 40.3 31.8 42.5 21.5 61.3 53.8 33.7 40.7 46.11977 8.9 6.8 -0.1. 1.1 101.9 61.1 6.4 39.7 20.81978 -14.9 -7.2 -9.9 -6.5 -10.1 -4.6 . ...,.12.4 -8.7 -7.61979 -1.0 -0.5 -1.9 -4.2 -12.5 -9.3 -2.0 -6.4 -5.31970-1973 7.7 3.4 3.1 15.9 5.0 8.5 10.6 3.9 5.61973-1977 50.0 38.2 41.6 24.0 42.6 36.7 39.4 40.1 39.3CUSTOMER GROWTH RATES (%-)1971 24.9 2.3 18.41972 12.4* 18.5* 13.6* 7.9* 5.4* 7.4* -3.8 4.9 . -1.4~ 1973 12.4* 18.5* 13.6* 7.9* 5.4* 7.4* 4.5 4.3 4.2.p..1974 12.4* 18.5* 13.6* 7.9* 5.4* 7.4* 33.4 28.6 31.71975 28.9 17.4 25.5 28.6 9.5 23.1 28.8 14.0 24.41976 65.1 10.5 50.8 16.9 14.0 16.2 43.2 12.0 35.21977 -1.1 -3.9 -0.8 4.8 18.7 7.8 1.1 5.7 2.51978 -14.2 3.2 -U.4 2.3 -4.4 0.8 -7.9 -0.5 -6.41979 7.5 -5.2 6.1 -5.6 12.4 -1.3 1.9 5.2 2.8ENERGY USE (kWh/CUSTOMER)1970 N/A N/A N/A N/A N/A N/A 3,937 32,292 13,6161971 4,261 37,477 13,625 3,429 29,462 11,558 3,855 33,290 12,5951972 N/A N/A N/A N/A N/A N/A 4,295 30,523 12,8571973 N/A N/A N/A N/A N/A N/A 4,246 32,416 13,1571974 4,271 34,697 13,806 3,973 27,752 10,725 4,136 31,679 12,4001975 7,796 52,124 21,222 5,066 31,280 12,198 6,555 43,415 17,1471976 6,622 62,134 20,051 5,264 44,269 16,137 6,118 54,535 18,5321977 7,297 69,054 20,367 5,078 75,305 24,126 6,443 72,040 21,9421978 7,237 62,105 20,546 4,640 70,814 22,832 6,126 66,099 21,5511979 6,666 65,221 19,005 4,708 55,170 21,000 5,890 58,834 19,8471978 7,237 62,105 20,546 4,640 70,814 22,832 6,126 66,099 21,551* Average annual from 19JL to 1974 Alaska <strong>Power</strong> AdministrationApril 1980
Load FactorsThe following chart lists historical load factors, showing <strong>the</strong> relationshipbetween e.nergy <strong>and</strong> peak dem<strong>and</strong> in percent:<strong>Valdez</strong> Glennallen Total CVEA1970 58.2 53.1 55.8.1971 57.4 57.8 57.51972 55.7 56.6. 56.11973 57.7 57.3 57.51974 . 43.7 52.5 46.81975 43.9 41.8 43.21976 60.9 43.3 53.61977 61.3 57.0 59.31978 56.3 58.3 57.21979 62~3 60.9 61.6Avg. 55.7 53.8 54.9Load factor equals energy divided by <strong>the</strong> product of peak dem<strong>and</strong> <strong>and</strong>hours (8,760 hours annually). A peak load <strong>and</strong> subsequent installedcapacity <strong>for</strong>ecast can be obtained from <strong>the</strong> energy <strong>for</strong>ecast by using anaverage assumed load factor. The load factors are fairly constant except.during <strong>the</strong> years of greatest pipeline activity. Revised averages obtainedby excluding those years are:<strong>Valdez</strong>58.7% (1974-1975 excl~)Glennallen 56.7% (1975-1976 excl.)Total CVEA 57.3% (1974-1975 excl.)RatesRates to residential customers as stated in <strong>the</strong> Alaska Public UtilitiesCommission (APUC) annual report of 1979 were as follows (in C/kWh):For. <strong>Valdez</strong>Glennallen100 kWh16.8C/kWh17 .5500 kWh15.516.21;000 kWh14.015.71,500 kWh13.214.8Ano<strong>the</strong>r <strong>for</strong>m of customer rate (costs/kWh), as shown in <strong>the</strong> followingchart, illustrates averages of all users. The values are calculated bydividing annual revenue <strong>for</strong> each sector by annual energy sold in eachsector.15
REVENUE/KWH (¢/KWH)YEAR VALDEZ GLENNALLEN TOTAL CVEAR C/I Total R C/I Total R C/I Total1970 N/A N/A 9.1 7.0 7.51971 8.4 6.2 6.8 9.9 8.1 8.6 9.1 7.1 7.61972 N/A N/A 9.0 7.3 7.81973 N/A N/A 8.9 7.1 7.61974 8.1 6.3 6.8 9.5 7.9 8.4 8.7 6.9 7.41975 7.6 6.2 6.6 10.5 9.3 9.7 8.6 7.1 7.61976 9.6 6.6 7.6 11.1 11.7 11.5 10.2 8.4 8.91977 9.4 7.7 8.3 1101 9.8 9.9 9.9 8.8 9.01978 10.8 9.3 9.7 12.5 11.5 11.7 11.4 10.4 10.61979 12.7 10.9 11.5 14.1 13.4 13.5 13.1 12.1 12.4Note: 1975 <strong>and</strong> 1976 include sllrcharge revenue--o<strong>the</strong>r years <strong>the</strong> surchargewas not separately specified.R = ResidentialC/I= Commercial/IndustrialThe annual generation cost rates are shown on <strong>the</strong> following table whichis a summary of Table VIII-3. These values were compiled from datasubmitted by <strong>the</strong> utility to <strong>the</strong> Alaska Public Utilities Commission(APUC). The annual investment cost was calculated using productionplant-in-service data times <strong>the</strong> capital recovery factor <strong>for</strong> 7.5 percentdiscount· rate <strong>and</strong>. assumed 20-year diesel generator life.Energy Production Expense Rates (¢/kWh)1974 1975 1976 1977 1978O&M Excluding Fuel 1.0 103 104 106 2.0O&M Including Fuel 3.2 3.9 4.1 4.7 5.2Investment Cost/Year 104 102 2.0 106 1.7Total Annual Cost 4.6 5.1 6.1 6.3 6.919792.16.31.88.1Data <strong>for</strong> 1977-1979 indicates about 55 percent of <strong>the</strong> total operation <strong>and</strong>maintenance expenses, including fuel, occur at <strong>Valdez</strong>. In 1975, it was66 percent. Data <strong>for</strong> <strong>the</strong> o<strong>the</strong>r years is not available.The last line of <strong>the</strong> production expense table shows that total annualcosts had about a 15 percent average annual growth during <strong>the</strong> pipelineconstruction years. The average from 1974 through 1979 is 12 percent.A large increase in fuel cost occurred in 1979.16
CHAPTER VFUTURE POWER AND ENERGY ASSUMPTIONS AND REQUIREMENTSEnergy <strong>and</strong> Peak Dem<strong>and</strong> ForecastsAny <strong>for</strong>ecasts in <strong>the</strong> <strong>Valdez</strong>/Glennallen area have a high measure ofuncertainty, not only from lack of a stable historic base but also fromvagueness of <strong>the</strong> future. Future contingencies include <strong>the</strong> ALPETCOpetrochemical plant proposal, expansion of <strong>Valdez</strong> port activities, somepetroleum exploration activity near Glennallen, <strong>and</strong> possible electricalinterconnection to <strong>the</strong> Railbelt area.Periodically, <strong>Copper</strong> Valley Electric Association (CVEA), in conjunctionwith <strong>the</strong> Rural Electric Administration (REA), commissions a power requirementsor power cost study. The last one available was datedJanuary 1980 <strong>and</strong> made load estimates <strong>for</strong> <strong>the</strong> 1980 to 1993 period. Ithas been adapted <strong>for</strong> this study as shown in Table V-I, which listsenergy <strong>and</strong> peak dem<strong>and</strong> by year <strong>for</strong> <strong>Valdez</strong>, Glennallen, <strong>and</strong> <strong>the</strong> totalCVEA area. Growth rates <strong>and</strong> load factors are also shown.The CVEA <strong>for</strong>ecast does not include <strong>the</strong> proposed ALPETCO petrochemicalfacility near <strong>Valdez</strong> nor adjustment <strong>for</strong> conservation. There<strong>for</strong>e, <strong>the</strong>estimates have been altered by Alaska <strong>Power</strong> Administration to reflect<strong>the</strong>se contingencies. The <strong>Valdez</strong> <strong>for</strong>ecast was derived by first decreasing<strong>the</strong> CVEA 6-percent.average annual growth rate in five-year increments<strong>the</strong>n adding 17 GWh <strong>for</strong> 1982 peak year construction <strong>and</strong> 12 GWh per year<strong>for</strong> ALPETCO operation. The following average annual growth rates wereapplied to <strong>the</strong> CVEA base 1980 energy:1980-1985 6%1985-1990 5%1995-2000 3%The 17 GWH <strong>and</strong> 12 GWh were developed from <strong>the</strong> 1970 to 1978 net generationper employee statistics <strong>and</strong> estimated numbers of employees. During <strong>the</strong>oil terminal construction in <strong>Valdez</strong>, CVEA supplied 5 to 6 MWh peremployee. The o<strong>the</strong>r years <strong>the</strong>se values were 10 to 14 MWh. The EnvironmentalProtection Agency Environmental Impact Statement of December 1979indicated almost 2,800 peak construction employees <strong>and</strong> about 1,200operational employees. (6 MWh/employees x 2,800 employees = 17 GWh;10 MWh/employees x 1,200 employees = 12 GWh).The Glennallen <strong>for</strong>ecast comes directly from <strong>the</strong> CVEA study. It wasassumed growth factors <strong>and</strong> conservation would cancel any need <strong>for</strong>revision. Peak"loads can be determined by using <strong>the</strong> following loadfactors from <strong>the</strong> CVEA study:Glennallen<strong>Valdez</strong>Total1980-19931993-200057.8%57.1%55.8%57.1%56.7%57.1%17
Figure V-I pictures <strong>the</strong> <strong>for</strong>ecast of <strong>the</strong> total CVEA area. It also shows<strong>the</strong> 1980 CVEA power cost study load growth, <strong>the</strong> <strong>for</strong>ecast from <strong>the</strong> CVEA1976 <strong>Power</strong> Requirements Study, <strong>and</strong> a projection that averages <strong>the</strong>selatter two. The 1976 <strong>for</strong>ecast was presented in <strong>the</strong> March 1979 Susitna<strong>Power</strong> Market Study <strong>and</strong> <strong>the</strong> Y~rch 1979 AWSU S.C. Alaska Level B Phase ITechnical Memor<strong>and</strong>um (see bibliography items 5 <strong>and</strong> 6). The projectedaverage was used as an interim <strong>for</strong>ecast by <strong>the</strong> Corps of Engineers in<strong>the</strong>ir Allison Creek draft report. It could be cons~dered a high range<strong>for</strong>ecast <strong>for</strong> this power market report.In addition to <strong>the</strong>se utility <strong>for</strong>ecasts, self-supplied industries shouldbe mentioned. The only ones considered were <strong>the</strong> oil pipeline terminal<strong>and</strong> <strong>the</strong> proposed ALPETCO project. The terminal commenced operation in1977 with a 37.5 MW oil-fired steamplant, about four times <strong>the</strong> totalCVEA 1977 peak load. The ALPETCO installation may have up to 55 MWinstalled capacity as reported in a CVEA/REA <strong>Power</strong> Requirements Study ofMarch 1979.These industries, with <strong>the</strong>ir large loads compared to <strong>the</strong> utility, wereconsidered unlikely to be utility supplied. There<strong>for</strong>e, <strong>the</strong> <strong>for</strong>ecast didnot combine utility <strong>and</strong> industry.Installed Capacity Forecast <strong>and</strong> Future NeedsIn'stalled capacity is equal to peak load plus system reserves. The 1979Susitna <strong>Power</strong> market analysis assumed a 20 percent reserv,e in urbanareas <strong>and</strong> 25 percent in towns <strong>and</strong> rural areas. This study assumes thatpeak load is 75 percent of installed capacity.Table V-2 exp<strong>and</strong>s <strong>the</strong> peak load <strong>for</strong>ecast by dividing each value by 0.75.Existing installed capacity is listed also <strong>for</strong> each year, decreasingaccording to an assumed retirement schedule. Solomon Gulch capacity(12 MW) shows <strong>for</strong> <strong>Valdez</strong> in accordance with its assumed on-line date of<strong>1981</strong>. An interconnection is assumed under "CVEA Total"; so <strong>Valdez</strong> <strong>and</strong>Glennallen capacity estimates <strong>and</strong> existing generation are totaled. Alast column adds Solomon Gulch to existing <strong>the</strong>rmal capacity.Energy DistributionAssuming current energy use patterns will not change significantly in<strong>the</strong> future, <strong>the</strong> annual energy <strong>for</strong>ecast values divide into <strong>the</strong> followingmonthly distribution. This distribution is arranged in water yearorder, October 1 through September 30. The assumption of no significantchange in percentages is justified as long as <strong>the</strong> utility remains isolatedelectrically from a large industry. Exp<strong>and</strong>ing use of electric spaceheating in <strong>the</strong> residential <strong>and</strong> commercial sectors may modify <strong>the</strong> distributionsomewhat also.18
Table V-IVALDEZ/GLENNALLEN AREA UTIUTY LOAD ESTIMATESEnpr~:z: (GWh)Glennallen <strong>Valdez</strong> TotalHistorical1976 13.3 26.0 39.31977 21.4 26.1 47.51978 20.4 23.4 43.81979 18.5 23.0 41.6GlennallenPeak Dem<strong>and</strong> (MW)<strong>Valdez</strong>3.5 4.94.3 4,94.0 4.8,3.5 4.2Total8.49.18.87.7-\0Forecast*1980 21.4 26.5 47.9<strong>1981</strong> 22.0 (28.2) 30.0** 52.01982 22.5 (30.0) 33.0** 55.519B3 26.0 (31.9) 35.0** 61.01984 27.7 (D.n 34.0** 61.71985 29.5 35.6 65.11986 31.4 37.6 69.1<strong>1981</strong> D.5 39.8 73.31988 35 .• 7 42.0 77.81989 38.1 44.4 82.51.990 40.6 46.9 87.51991 43.3 49.6 92.91992 46.1 52.4 98.61993 49.2 55.4 104.62000*** 70.0 80.0 150.04.4 5.44.7 (5.7) 6.1*'"4.9 (6.1) 6.7**5.2 (6.5) 7.1**5.5 (6.9) 7.0**5.8 7.36.2 7.76.6 8.16.9 8.67.4 9.17.8 9.68.2 10.28.7 10.89.2 11.414.0 16.09.810.811.512.412.513. 113.914.715.516.417.418.419.520.630.0Avera!le Annual Growth Rates (%)1910-1973 8.5 3.1 5.61973-1977 36.7 41.7 39.31977-1979 -6.0 -7.0 -6.41970-1979 16.2 16.3. 16.31980-1993 6.6 5.8 6.21993-2000 5.2 5.4 5.3Avera!!,e Load Factors54.3 (56.6)*4 54.1 (56.4)*457.8 55.857.1 57.154.1 (56. n*456.757.1* <strong>Copper</strong> Valley E1pctric Association Forecast from January 1980<strong>Power</strong> Cost Study.** Additions <strong>for</strong> ALPETCO facility have been included. Values in( ) are from original <strong>for</strong>ecast.*** APA extrapolation.*4 Average excluding pipeline construction impact.Alaska <strong>Power</strong> AdministrationApril 1980
Figure V-I200.VALDEZ/GLENALLEN AREAENERGY FORECASTS1751501255.9%5.7%August Annualgrowth-from19BO100755025Hist
Table V-2INSTALLED CAPACITY REQUIREMENTS AND USE OF EXISTING GENERATION(MW)VALDEZ GLENNALLEN CVEA·TOTALSSolomon Existing Existing Solomon Existing TotalYear Estimate Gulch Diesels Estimate Diesels Estimate Gulch Diesels GenerationNI-'1980 7.2 10.1 5.9 7.6 13.1 17.7 17.7<strong>1981</strong> 9.1 12.0 10.1 6.3 7.0 15.3 12.0 17.1 29.11982 12.8 12.0 10.1 6.5 7.0 19.3 12.0 17.1 29.11983 12.5 12.0 10.1 6.9 6.4 19.5 12.0 16.5 28.51984 12.5 12.0 7.3 7.3 9.2 19.9 12.0 16.5 28.51985 13.1 12.0 7.3 7.7 9.2 20.8 12.0 16.5 28.51986 13.6 12.0 7.3 8.3 8.0 21.9 12.0 15.3 27.31987 14.1 12.0 7.3 8.8 8.0 22.9 12.0 15.3 27.31988 14.4 12.0 5.5 9.2 8.0 23~6 12.0 U.S 25.51989 15.1 12.0 5.5 9.9 8.0 24.9 12.0 13.5 25.51990 15.6 12.0 5.5 10.4 8.0 26.0 12.0 U.S 25.51991 16.1 12.0 5.5 10.9 8.0 27.1 12.0 U.S 25.51992 16.7 12.0 3.6 11.6 8.0 28.3 12.0 11.6 23.61993 17.2 12.0 3.6 12.3 8.0 29.5 12.0 11.6 23.62000 20.3 12.0 0.0 18.7 0.0 38.9 12.0 0.0 12.0Notes:'1. Installed capacity estimates = peak dem<strong>and</strong> in table V-I ~ 0.752. Totals are derived from unrounded components3. Existing diesels decrease according to an assumed retirement scheduleAlaska <strong>Power</strong> AdministrationAugust 1980
Monthly Energy Distribution<strong>Valdez</strong> Glennallen Total UtilityOctober 7.5 7.4 7.5November 8.9 8.9 8.9December 9.2 10.0 9.6January 9.5 10.4 9.9February 9.4 10.3 •• 9.9March 8.3 8.9 8.6April 8.6 8.7 8.6May 7.7 7.2 7.5June 7.6 6.8 7.2July 7.4 6.6 7.0August 7.8 7.1 7.4September 8.2 7.7 8.0100.0% 100.0% 100.0%October through April 61.3% 64.7% 62.9%These values are averages of historical monthly energy from October 1969through September 1979. Year to year values <strong>for</strong> anyone month vary less<strong>the</strong>n 2 percent from <strong>the</strong> average--even during <strong>the</strong> pipeline constructionyears. The total utility percentages vary less than <strong>the</strong> components.The winter months, October through April (58 percent of <strong>the</strong> year),consume over 60 percent of <strong>the</strong> annual energy.22
CHAPTER VI .ALTERNATIVE GENERATION AND COSTS·Focus of this chapter is selection of feasible power <strong>and</strong> energy supplypossibilities <strong>for</strong> <strong>the</strong> <strong>Valdez</strong>/Glennallen area. As follow-up to <strong>the</strong>Solomon Gulch hydro project, now under construction, only three alternativesappear reasonable:1. Allison Creek hydro (two options)2. P~essure Reducing Turbines (PRT's) in <strong>the</strong> Alyeska pipeline3. Interconnection to <strong>the</strong> Railbelt area (Palmer-Glennallen transmissionline).Discussion of <strong>the</strong> alternatives considered follows:HydropowerSeveral sites in addition to Aliison Creek <strong>and</strong> Solomon Gulch have beeninventoried in <strong>the</strong> <strong>Valdez</strong> <strong>and</strong> Glennallen areas. These are part of astatewide list of 252 published in February 1980 in an Alaska" <strong>Power</strong>Administration report titled Hydroelectric Alternatives <strong>for</strong> <strong>the</strong> AlaskaRailbelt. Sizes <strong>and</strong> evaluations are given in <strong>the</strong> following list:<strong>Valdez</strong>Lowe <strong>River</strong> 0.2 - 55 MWSilver Lake10 MWMineral Creek 0.4 - 1.3 MWGold Creek ?Unnamed Creek 3.6 - 10.4 MWCleave820 MWWood Canyon 2,600Currently classed as not feasible economicallyor environmentally.Requires much longer transmission thanAllison Creek. Can perhaps be <strong>the</strong> nextincrement.Currently classed as uneco~omical.Currently classed as uneconomical.Currently classed as uneconomical.Far too large <strong>for</strong> area.Far too large <strong>for</strong> area.GlennallenTazlinaLower Gulkana <strong>River</strong>San<strong>for</strong>d104 MW9MW80 MWPrevious studies show less feasibilitythan Lowe.Previous studies show less feasibilitythan Lowe.Previous studies show less feasibilitythan Lowe.23
These are <strong>the</strong> sites closest by. O<strong>the</strong>r sites could also be consideredbut are judged not alternative to Allison Creek~ If <strong>the</strong> very largeprojects, Wood Canyon or Cleave, are developed <strong>for</strong> energy export elsewhere;feasibility of serving <strong>the</strong> Glennallen-<strong>Valdez</strong> interconnectionshould be considered.Tidal <strong>Power</strong>Tidal power is not considered an 'alternative to Allison Creek. The mainreason is sizing <strong>and</strong> economics. The size needed <strong>for</strong>.tida1project1 feasibility is much too large <strong>for</strong> indigenous use. In qddition, a <strong>Valdez</strong>area tidal project would certainly conflict with port traffic (oiltankers, etc.). If a tidal project is· constructed in <strong>the</strong> Cook Inletarea, it would be considered as exogeneous supply to <strong>the</strong> <strong>Valdez</strong>/Glennallenarea by new transmission facilities.Steamp1antsSteam turbines can use many types of resources: coal, oil, gas, nuclear,biomass, sun heat. The availability of each resource, economics, <strong>and</strong>institutional constraints preclude steamp1ants from consideration asalternatives <strong>for</strong> <strong>the</strong> <strong>Valdez</strong>/Glennallen area.Coal-FiredCoal is Scarce in <strong>the</strong> <strong>Valdez</strong>/Glennallen area. One deposit has beendefined in <strong>the</strong> Chugach Mountains, east of <strong>the</strong> <strong>Copper</strong> <strong>River</strong> delta. Noo<strong>the</strong>rs are evidenced. This deposit is ranked low in probability ofdevelopment. A State report of Alaska's resources (see bibliographyreference 13) lists it as ninth out of a dozen possibilities.Several recent report~/ have indicated small size (less than 50 MW)coal-fired steamp1ants cost between $4,000 <strong>and</strong> $5,000 per kW. Thisincludes scrubbers. O<strong>the</strong>r environmental equipment would increase capitalcosts. Adding escalating fuel costs, fuel transportation costs (coalwould have to be imported), <strong>and</strong> high maintenance costs would causesteamp1ant energy to be more expensive than Allison Creek.Oi1- <strong>and</strong> Gas-FiredOil <strong>and</strong> gas provinces in <strong>the</strong> Gulf of Alaska area are evaluated in <strong>the</strong>State study of Alaska's resources (see bibliography item 13). Evaluationsrank an off-shore province as promising, a province surroundingGlennallen as possible, <strong>and</strong> a province east of Cordova as very improbable.In addition to <strong>the</strong> lack of local fuel supplies, oil- <strong>and</strong> gas-firedsteamp1ants are considered as unlikely alternatives to Allison Creekbecause shortages <strong>and</strong> national policy indicate that in a few years <strong>the</strong>sefuels will not be availablp <strong>for</strong> powerplants. In <strong>the</strong> sizes needed <strong>for</strong>generation at ValdeZ/Glennallen, o<strong>the</strong>r <strong>for</strong>ms of energy supply are morepractical <strong>and</strong> economic.1/ 1979 Susitna <strong>Power</strong> Market Study; Alaska Study Committee SouthcentralAlaska Level R Studies.24
Biomass-FiredAlthough of many <strong>for</strong>ms, biomass, <strong>for</strong> current applications, assumes <strong>the</strong>burning of wood <strong>and</strong> wood residues in steamplants. The pulp mills inSou<strong>the</strong>ast Alaska burn mill waste as part of <strong>the</strong>ir process, but verylittle has been done to inventory biomass generation possibilitiesstatewide.Biomass-fired steamplants may be a possibility if wood is proved available.However, because of <strong>the</strong> limited state-of-<strong>the</strong>-art <strong>and</strong> lack oflocal studies, <strong>the</strong>y are not, at this time, considered an alternative toAllison Creek.SolarThe state-of-<strong>the</strong>-art also eliminates solar as alternative to AllisonCreek hydro. The solar boiler technology <strong>for</strong> steamplant power is stillin <strong>the</strong> development stage. Also, sun incidence during high energy usageis low in <strong>the</strong> <strong>Valdez</strong>/Glennallen area.NuclearThe economics of nuclear steamplants preclude this as a possibility in<strong>the</strong> ValdeZ/Glennallen area. Nuclear plants, apart from questionablesociability, require a minimum 200 MW to 400 MW <strong>for</strong> economic feasibility.This is too large <strong>for</strong> <strong>the</strong> area.Combustion or Gas TurbinesBecause of <strong>the</strong>ir relatively low capital costs, continued use of oilfiredcombustion turbines could be an alternative to Allison Creek.However, escalating fuel cost <strong>and</strong> national objectives <strong>for</strong> use of petroleumpreclude this option. Alternative cost comparisons are <strong>the</strong>re<strong>for</strong>enot pursued.DieselsO<strong>the</strong>r than one small gas turbine installed in 1976, diesels now supplyall electric power <strong>and</strong> energy requirements in ValdeZ/Glennallen. Mostof <strong>the</strong>se will most like.ly be on st<strong>and</strong>by service when Solomon Gulch hydrocomes on line in <strong>the</strong> early 1980's.If oil conservation <strong>and</strong> high costs were not factors, bringing <strong>the</strong>sediesels off st<strong>and</strong>by status <strong>and</strong> adding more would be a likely alternativeto Allison Creek. However, by <strong>the</strong> time additional capacity is needed,diesels are expected to be allowed only if no o<strong>the</strong>r alternative isavailable.Geo<strong>the</strong>rmal <strong>Power</strong>plantsThe most promising geo<strong>the</strong>rmal sites in Southcentral Alaska occur in <strong>the</strong>Wrangell Mountains near Glennallen. This may be a source of electricpower <strong>and</strong> energy <strong>for</strong> <strong>the</strong> ValdeZ/Glennallen area <strong>for</strong> <strong>the</strong> long-term.25
However,techno10gy has not yet developed enough to consider it as analternative resource in <strong>the</strong>. area be<strong>for</strong>e <strong>the</strong> year 2000.Wind MachinesThis resource only supplements a basic power supply. Energy storagetechnology needs to develop be<strong>for</strong>e wind can serve as primary energy.The Alaska Division of Energy <strong>and</strong> <strong>Power</strong> Development report dated January1979 <strong>and</strong> titled, Alaska's Energy Resources, Phase 1. Volume III hasranked wind power sites in Alaska. Based on sketchy data, out of a listof 67, <strong>Valdez</strong> is number 54 <strong>and</strong> <strong>the</strong> Glennallen area number 41.Demonstration units (under 100 kW) in Colorado are presently estimateda t over $5, OOO/kW not including installation. Costs will undoubtedlydecrease as <strong>the</strong> technology develops.Overall, <strong>for</strong> <strong>the</strong> <strong>Valdez</strong>/Glennallen area, wind machines cannot be consideredan alternative to Allison Creek. However, <strong>the</strong>y certainly must be investigatedas supplemental power to any future electric supply system.Exogenous SupplyExogenous to <strong>the</strong> <strong>Valdez</strong>/Glennallen utility system are several possibilities<strong>for</strong> generation import:1. Rai1be1t interconnection.2. O<strong>the</strong>r large hydroprojects; such as Rampart, Porcupine, Woodchopper.(Wood Canyon <strong>and</strong> Cleve, within <strong>the</strong> <strong>Valdez</strong> general region,were mentioned under hydropower.)The large hydro projects should not be considered as alternatives<strong>for</strong> this area or any o<strong>the</strong>r area, at this time.The 1979 Susitna power market study included a section on costs of aPalmer-Glennallen transmission line. A $40.8 million investment <strong>and</strong>$3.3 million annual cost result in 3.3~/kWh transmission costs at atransfer of 100 million kWh (1978 costs). 50 million kWh would morenearly fit <strong>the</strong> <strong>Valdez</strong>/Glennallen system; so <strong>the</strong> unit cost would aboutdouble. This would probably be economically feasible. Delivery to CVEAat Glennallen would supply <strong>Valdez</strong> over <strong>the</strong> Glennallen-<strong>Valdez</strong> transmissionline. The Susitna study indicated Railbe1t generation costs averageabout 5~ per KWh to 6~ per KWh at 1978 prices.O<strong>the</strong>r Alternatives1. Pressure Reducing Turbines (PRT's) in <strong>the</strong> A1yeska pipeline.2. A1yeska pipeline terminal generation at <strong>Valdez</strong>.3. ALPETCO petrochemical installation at <strong>Valdez</strong>.26
A Solomon Gulch article in <strong>the</strong> December 1978 issue of Alaska Construction<strong>and</strong> Oil magazine <strong>and</strong> a January 1980 CVEA power cost study both discusspressure reducing turbines in <strong>the</strong> trans-Alaska oil pipeline. A twomillion barrel per day (MBD) oil flow can produce 77,263 MWh with a9.8-MW installed capacity. However, a more likely flow of 1.6 MBD <strong>and</strong> acapacity factor of 80 percent results in 56,000 MWh energy <strong>and</strong> 8 MWcapacity. Investment W0uld be $9.7 million or $1,200/kW. This isdefinitely an alternative to Allison Creek, but requires industry/utilityagreements.A 1974 power cost study <strong>for</strong> <strong>Copper</strong> Valley Electric Association by Robert W.Re<strong>the</strong>r<strong>for</strong>d Associates suggests oil pipeline pressure reducing turbinesin conjunction with hydro pumped storage at Solomon Gulch. This schemeappears quite favorable <strong>and</strong> <strong>the</strong>re<strong>for</strong>e worth more investigation.The interties to <strong>the</strong> industrial installations at <strong>Valdez</strong> (Alyeska pipelineterminal <strong>and</strong> ALPETCO) conceptually are feasible but considered unlikely.The industries would not have excess firm energy; so <strong>the</strong>se were notincluded as Allison Creek alternatives.27
CHAPTER VIILOAD/RESOURCE ANALYSISThis chapter analyzes three plans that relate feasible power supplyalternatives to <strong>the</strong> <strong>Valdez</strong>/Glennallen load <strong>for</strong>ecasts. The discussionaddresses installed capacity <strong>and</strong> energy separately. A <strong>Valdez</strong>-Glennallentransmission is assumed so total CVEA loads are used.Chapter VI indicated three viable alternatives <strong>for</strong> consideration:Allison Creek; pressure reducing turbines (PRT) in <strong>the</strong> Alyeska pipeline;<strong>and</strong> an interconnection with Railbelt power sources. An all <strong>the</strong>rmal casehas been added <strong>for</strong> comparison. The following plans are illustrated onFigures VII-1 through VII-5. Bases <strong>for</strong> <strong>the</strong> curves are Tables VII-1 <strong>and</strong>VII-2. Table VII-3 combines plans 1 <strong>and</strong> 2.Figure NumberPage NumberPlan 1 Allison Creek alternative VII-1 <strong>and</strong> VII-3 34 <strong>and</strong> 36Plan 2 Pipeline PRT alternative VII-1 <strong>and</strong> VII-4 34 <strong>and</strong> 37Plan 3 Continuing <strong>the</strong>rmal generation VII-2 <strong>and</strong> VII-S 35 <strong>and</strong> 38A Railbelt interconnection has not been separately illustrated. It canfit in <strong>the</strong> cross hatched areas in <strong>the</strong> diagrams or displace AllisonCreek.Installed CapacityFigures VII-l <strong>and</strong> VII-2 illustrate how <strong>the</strong> installed capacity <strong>for</strong>ecastcan be supplied. The analysis assumes that much of <strong>the</strong> existing <strong>the</strong>rmalgeneration of both <strong>Valdez</strong> <strong>and</strong> Glennallen will be put in st<strong>and</strong>by statuswhen Solomon Gulch comes on line.The diagrams show clearly <strong>the</strong> need <strong>for</strong> capacity in addition to SolomonGulch. Fur<strong>the</strong>r, <strong>the</strong>y show that more than one of <strong>the</strong> three alternativesis required be<strong>for</strong>e 1990 (see Figure VII-I).Allison Creek as part of an interconnected system could be fully utilizedto supply load dem<strong>and</strong> plus reserves by 1985. If diesels are used <strong>for</strong>reserves, <strong>the</strong>n Allison Creek full utilization would come in 1991 (seeFigure VII-l <strong>and</strong> Table VII-I). From a capacity viewpoint, PRT's have<strong>the</strong> same schedule.Figure VII-2 indicates existing generators, if not displaced by hydro,will not be adequate after <strong>1981</strong>. Retirement schedules <strong>for</strong> <strong>the</strong> existingdiesels <strong>and</strong> gas turbine are based on an assumed 20 to 2S-year life.Solomon Gulch plus existing capacity will not be adequate after 1989.29
Net EnergyThis section discusses <strong>the</strong> relationships between alternative generation<strong>and</strong> total energy load plus losses. Time scheduling of alternatives issomewhat different than <strong>for</strong> peak dem<strong>and</strong> because <strong>the</strong> PRT'fOl, while equalin capacity to Allison Creek, have about 60 percent more energy capability.Figures VII-3 through VII-5 <strong>and</strong>, again, Tables VII-1 through VII-3 show<strong>the</strong> energy load/resource analyses. Firm energy <strong>for</strong> Solomon Gulch <strong>and</strong>Allison Creek is depicted in <strong>the</strong> graphs <strong>and</strong> listed in <strong>the</strong> Tables.Average annual energy would add secondary generation as additionaldisplacement of diesel g~neration <strong>and</strong> as contirtgency supply. From anenergy st<strong>and</strong>point, installation timing would not be affected in <strong>the</strong>interconnected system if average annual was used in place of firm <strong>for</strong><strong>the</strong> analyses.~ith an interconnected system, generation in addition to Solomon Gulchis needed immediately to displace diesels. Allison Creek would be fullyloaded when it comes on line in 1985. The PRT's would gain full energyoutput by 1990.Figure VII-5 indicates existing generation, if operated at 75 percentplant factor, would meet <strong>the</strong> load until 1988. However, economics <strong>and</strong>national policy, as stated in <strong>the</strong> recent national energy act, wouldpreclude this case.30
Table VII-l<strong>Valdez</strong>/Glennallen Forecast with Allison Creek SupplyEnergr (GWH) 1980 <strong>1981</strong> 1982 1983 1984 1985 1986 1987 1988 1989 1990 1991 1992 1993 2000Energy Forecast 47.9 55.0 69.5 72.0 73.7 77.5 81.4 85.5 R8.7 93.1 97.6 102.3 107.1 112.2 14&.0Solomon Gulch( finn) 38.6 38.6 38.6 38.6 38.6 38.& 38.& 38.& 38.& 38.& 38.& 38.& 38.& 38.&Energy Need 47.9 16.4 30.9 33.4 35.1 38.9 42.8 46.9 50.1 54:5 59.0 fin 68.5 73.& 107.4Allison Creek( firm) 34.3 34.3 34.3 34.3 34.3 34.3 34.3 34.3 3t,.3 34.3Fur<strong>the</strong>r Need 47.9 16.4 30.9 33.4 35.1 4.6 ---s:s 12.6 IT.8 20.2 24.7 29.4 34-:2 J9.) 7DExisting Diesel(75% Plt.Fac.) 116 112 112 108 108 lOR 100 100 88 88 88 88 76 76 0Dem<strong>and</strong> <strong>and</strong> C3~3city(MW)Peak Dem<strong>and</strong> 9.8 1l.5 14.5 14.6 14.9 15.6 16.4 17.2 17.7 18.7 19.5 20.3 21.2 22.1 29.2Solomon Gulch 12.0 12.0 12.0 12.0 12.0 12.0 12.0 12.0 12.0 12.0 12.0 12.0 12.0 12.0PeAk Need ~ -0.5 2"":S 2:6 2.9 3.6 ~ 5.2 5.7 ----r;:'i 7.5 8:3 ~ 10.1 17.2Allison Creek 8.0 8.0 8.0 8.0 8.0 8.0 8.0 8.0 8.0 8.0Fur<strong>the</strong>r Peak Need 9.8 -0.5 2.5 2.6 2.9 -4.4 -3.6 :'2.8 -2.3 -1.3 -0.5
Table VII-2<strong>Valdez</strong>/Glennallen Forecast with PRT SupplyEners:!:: (GWH) 1980 <strong>1981</strong> 1982 1983 1984 1985 1986 1987 1988 1989 1990 1991 1992 1993 2000Energy Forecast 47.9 55.0 69.5 72.0 73.7 77.5 81.4 85.5 88.7 93.1 97.6 102.3 107.1 112.2 146.0Solomon Gulch(firm) 38.6 38.6 38.6 38.6 38.6 38.6 38.6 38.6 38.6 38.6 38.6 38.6 38.6 38.6Energy Need 47.9 16.4 30.9 33.4 35.1 38.9 42.8 46.9 50.1 54.5 59.0 63.7 68.5 73.(; 107.4PRT (80% capacityfactor) 56.0 56.0 56.0 56.0 56.0 56.0 56.0 56.0 56.0 56.0 56.0Fur<strong>the</strong>r Need 47.9 16.4 30.9 33.4 -20.9 -T7.l -13.2 =-9:1 -5.9 -1.5 J":O 7--:7 12.5 17.6 51.4Existing Diesel(75% Plt.Fac.) 116 112 112 108 108 108 100 100 88 88 88 88 76 76 0Dem<strong>and</strong> <strong>and</strong> CaEacitl (HW)wNPeak Dem<strong>and</strong> 9.8 11.5 14.5 14.6 14.9 15.6 16.4 17. 2 17.7 18.7 19.5 20.3 21.2 22.1 29.2Solomon Gulch 12.0 12.0 12.0 12.0 12.0 12.0 12.0 12.0 12.0 12.0 12.0 12.0 12.0 12.0Peak Need 9:8 -0.5 2-:s 2:6 ~ 3.6 4":4 5.2 5-:7 6":7 1"":5 --s:J 9:2 10.1 17.2PRT 8.0 8.0 8.0 8.0 8.0 8.0 8.0 8.0 8.0 8.0 8.0Fur<strong>the</strong>r Need 9:8 o:s 2.5 2.6 -5.1 -4.4 -3.6 -2.8 -2.3 -1.3 -0.5 o.J 1":2 2.1 9:2Reserves Required* 3.3 3.8 4.8 4.9 5.0 5.2 5.5 5.7 5.9 6.2 6.5 6.8 7.1 7.4 9.7Capacity Need 13.1 3:J 7-:J 7-:s -0.1 ----o.a .--:9 ~ ~ l;"-:9 6":0 ----r:l" --s:J 9-:s 111.9ExistingDiesel Capacity 17.7 17.1 17.1 16.5 16.5 16.5 15.3 15.3 13.5 13.5 13.5 13.5 11.6 11.6 0*Reserves s(Peak Dem<strong>and</strong> + 75%) - Peak Dem<strong>and</strong>
Table Vll-3<strong>Valdez</strong>/Glennallen Forecast with Allison Creek <strong>and</strong> PRT SupplyEnerSI (GWH) 1980 <strong>1981</strong> 1982 1983 1984 1985 1986 1987 1988 1989 1990 1991 1992 1993 2000Energy Forecast 47.9 55.0 69.5 72.0 73.7 17.5 81.4 85.5 88.7 93.1 97.6 102.3 107.1 112.2 . 146.0Solomon Gulch(firm) 38.6 38.6 38;6 38.6 38.6 38.6 38.6 38.6 38.6 38.6 38.6 38.6 38.6 38.6Energy Need 47.9 16.4 30.9 33.4 35.1 38.9 42.8 46.9 50.1 54.5 59.0 .63:7 68.5 13.6 107.4Allison Creek 34.3 34.3 34.3 34.3Fur<strong>the</strong>r Need 29.4 34.2 39.3 73.1PRT 56.0 56.0 56.0 56.0 56.0 56.0 56.0 56.0 56.0 .56.0 56.0Fur<strong>the</strong>r Need 47.9 16.4 30.9 33.4. -20.9 -17.1 -13.2 -9.1 -5.9 -1.5 ~ 26.6 -21.8 -16.7 T7.TExisting Diesel 116 112 112 108 108 108 100 100 88 88 88 88 76 76 0Dem<strong>and</strong> <strong>and</strong> CaEacitI (HW)Peak Dem<strong>and</strong> 9.8 11.5 14.5 14.6 14.9 15.6 16.4 17.2 17.7 18.7 19.5 20.3 21.2 22.1 29.2Solomon Gulch 12.0 12.0 12.0 12.0 12.0 12.0 12.0 12.0 12.0 12.0 12.0 12.0 12.0 12.0Peak Need --u -0.5 ~ ~ 2:9 J":6 4":4 ---s:2 s:7 ~ 7-:s a:J ~ 10.1 17 .2Allison Creek 8.0 8.0 8.0 8.0\..,) Fur<strong>the</strong>r Need ---o.J l.2 ~ 9":2\..,)PRT 8.0 8.0 8.0 8.0 8.0 8.0 8.0 8.0 8.0 8.0 8.0Fur<strong>the</strong>r Need --u -0.5 ~ ~ -5.1 -4.4 -3.6 -2.8 -2.3 -1.3 -0.5 -7.7 -6.8 -5.9Reserves Required* 3.3 3.8 4.8 4.9 5.0 5.2 5.5 5.7 5.9 6.2 6.5 6.8 7.1 7.4 9.7Capacity Need 13.1 3.J 7:J --=r:s -0.1 0.8 1:9 2:9 J":6 4:9 6.0 -0.9 0.3 --y:s 10 .. 9ExistingDiesel Capacity 17.7 17.1 17.1 16.5 16.5 16.5 15.3 15.3 13.5 lJ.5 lJ.5 13.5 11.6 11. 6 0*Reserves -(Peak Dem<strong>and</strong> + 75%) - Peak Dem<strong>and</strong>
40VALDEZ/GLENNALLENCAPACITY/RESOURCE DIAGRAMFigure VII':"'l38.935Plan 1plan 2Allison Creek Alternative lor 2Pressure Reducing Turbine(Includes 25% Reserves) .3025UNSPECIFIEDADDITIONALCAPACITY!>'"HHU~ 20
40·Figure VU-235Plan 3VALDEZ/GLENNALLENCAPACITY/RESOURCE DIAGRAM(Includes 25% Reserves)Continuing Thermal Generation3025Additionaldiesels <strong>and</strong>gas turbines105Existing diesels <strong>and</strong>gas turbine-retiredat end of amortized lifeHistory F recasto--------~~--------~------~~------~--~~~~1975 1980 1985 1990 1995 2000APA 9-3035YEARS
150Figure VII-3140VALDEZ/GLENNALLENNET ENERGY/RESOURCEPlan 1120100......,~~ 800.,-l..-l..-l.,-lf3'-'>
150Figure VII-4140VALDEZ/GLENNALLENNET ENERGY/RESOURCEPlan 2120100Pressure ReducingTurbine56 GWH at 80% Capacityfactor40~I U)I"r-! ~ l..-i Q)U) U)20 or-! Q)01975I HistoryAPA 9-30w c:l>< I"r-!II1 Forecast38.655.01985Solomon GulchHydroprojectGWH firm energyGWH average annual energy37YEARS1990 199538.62000
150·Figure VII-5140VALDEZ/GLENNALLENN'ET.ENERGY/RESOURCE120100Existing Diesels <strong>and</strong>Gas Turbine-Retired atEnd of Amortized LifeAdditionalDiesel <strong>and</strong>Gas TurbineGeneration>-
CHAPTER VI II .FINANCIAL ANALYSISThe costs developed in this chapter compare <strong>the</strong> alternatives identifiedin Chapte~ VI as future energy supply possibilities: . (1) Allison CreekNo.1 or No.2, (2) pressure reducing turbines (PRT's) in .<strong>the</strong> A1yeskaPipeline, <strong>and</strong> (3) <strong>the</strong> Railbe1t interconnection. An indication of <strong>the</strong>expenses related to continued use of diesels is also presented. Costs<strong>for</strong> <strong>the</strong> PRT's are taken from <strong>the</strong> January 1980CVEA power cost study.Chapter VII indicated <strong>the</strong> PRT's <strong>and</strong> Allison Creek are more complimentarythan a1ternative--<strong>the</strong>y are both needed. There<strong>for</strong>e, costs are presentedmore <strong>for</strong> prospective than comparison. The Rai1be1t interconnectionappears a close alternative to Allison Creek asa follow-up to <strong>the</strong>PRT's. Costs come from <strong>the</strong> March 1979 Susitna <strong>Power</strong> Market Study.Cost SummaryCost summaries are shown <strong>for</strong> all of <strong>the</strong> above possibilities. Thesesummaries include investment, OM&R, <strong>and</strong> interest during construction(IDC). Investment <strong>and</strong> IDC total costs are converted to average annualcosts by use of a capital recovery factor at 8 percent discount rate <strong>and</strong>50-year repayment <strong>for</strong> Allison Creek <strong>and</strong> 30-year <strong>for</strong> <strong>the</strong> PRT's. AllisonCreek investment costs were submitted by <strong>the</strong> Corps of Engineers inAugust 1980 with an October 1980 price level. Project OM&R is takenfrom Mahoney Lake criteria (see bibliography item 12). Annual costs areassumed to inflate at <strong>the</strong> same rate <strong>for</strong> all alternatives; <strong>the</strong>re<strong>for</strong>e noinflation has been applied. A busbar (losses included) cost comparisonvalue is computed by adding OM&R to annual investment costs, <strong>the</strong>n dividing<strong>the</strong> sum by firm annual energy. Tables VIII-1A <strong>and</strong> VIII-1B give <strong>the</strong>Allison Creek cost summary <strong>for</strong> alternate powerp1ant sites 1 <strong>and</strong> 2.The pressure reducing turbine cost estimates are shown on Table VIII-2.The investment <strong>and</strong> OM&Rcosts are given in <strong>the</strong> January 1980 CVEA <strong>Power</strong>Cost Study. They have been given an increase to reflect an October 1980price level. Amortized life was assumed to be 30 years, as suggested in<strong>the</strong> CVEA study. A cost comparison value was computed similarly toAllison Creek. Annual energy assumes an 80 percent capacity factor.Table VIII-3 adapts costs of <strong>the</strong> CVEA-Rai1be1t interconnection in <strong>the</strong>March 1979 Susitna <strong>Power</strong> Market study to this <strong>Valdez</strong>/Glennallen study.The October 1978 prices have been raised 10 percent to agree with <strong>the</strong>Allison Creek level of October 1980. However, an 8 percent ra<strong>the</strong>r than<strong>the</strong> Susitna study 7.5 percent was used to calculate annual costs. TheSusitna study used 100,000 to 300,000 MWh per year energy transfer.However, 50,000 MWh annually compares better with Allison Creek, <strong>the</strong>PRT's, <strong>and</strong> <strong>the</strong> load requirements. Unit costs, <strong>the</strong>re<strong>for</strong>e, of <strong>the</strong> transmissionline have more than doubled. Costs of purchasing Rai1be1tenergy come from average rate determinations as shown in Table VIII-3A.39
TABLE VIII-IASummary Cost EstimateOctober 1980 Price LevelAllison Creek (Lake Tap) Alternate No. 18 MW; 34,300 MWh firm annual energy; 39,350 MWh average annual energy.L<strong>and</strong>s <strong>and</strong> DamagesHydraulic Works<strong>Power</strong>plant, Switchyard, <strong>and</strong>.Transmission System*Miscellaneous (Mobilization, Buildings, etc.)Contingencies (20%)Engineering <strong>and</strong> Design (8%)Supervison <strong>and</strong> Administration (8%)Subtotal - Contract CostInterest During Construction (8% <strong>for</strong> 2 years)Total Investment Cost$ 700,00020,074,0004,009,0001,830,0005,323,0002,555,0002,759,00037,250,0002,980,000$40,230,000or $5,029/kWAverage Annual Cost (8% <strong>for</strong> 50 years)=Total Investment x 0.081743Operation, Maintenance, <strong>and</strong> ReplacementTotal Average Annual Cost3,288,521201,000$ 3,489,521=10.2¢/kWh (firm)* Allison Creek powerplant to Solomon Gulch transmission line tap; 3 miles.40
TABLE VIII-1BSummary Cost EstimateOctober 1980 Price LevelAllison Creeek (Lake Tap) Alternate No. 28 MW; 32,200 MWh firm annual energy; 37,250 MWh average annual energy.L<strong>and</strong>s <strong>and</strong> Damages $ 724,000Hydraulic Works 17,563,000<strong>Power</strong>p1ant, Switchyard, <strong>and</strong> Transmission System* 4,629.000Miscellaneous (Mobilization, Buildings, etc.) 1,590,000Contingencies (20%) 4,901,000Engineering <strong>and</strong> Design (8%) 2,353,000Supervision <strong>and</strong> Administration (8%)2,54l,000Subtotal - Contract Cost $34,301,000Interest During Construciton (8% <strong>for</strong> 2 years) 2,744,080Total Investment Cost $37,045,080Average Annual Cost (8% <strong>for</strong> 50 years)or $ 4,631/kW=Tota1 Investment x 0.081743 $ 3,028,176Operation, Maintenance, <strong>and</strong> Replacement 201,000Total Average Annual Cost $ 3,229,176=10.0C/kWh (firm)* Allison Creek powerp1ant to Solomon Gulch transmission line tap;3.5 miles.41
TABLE VIII-2Summary Cost EstimatePressure Reducing Turbines (PRT)Cost from January 1980 CVEA <strong>Power</strong> Cost Study(Inflated to October 1980)8 MWj 56,000 MWh at 80 percent capacity factorTotal Investment Cost ($9,727,300 + 8% inflation* $10,500,000from January 1980 to October 1980)Average Annual Cost (8% <strong>for</strong> 30 years)= Total Investment X 0.088827Operation, Maintenance, <strong>and</strong> Replacement Assumed**Total Average Annual Cost932,684432,316$1,365,0002.4¢/kWh (firm)* Water <strong>and</strong> <strong>Power</strong> Resources Service Cost Index indicates a 6.5% increasein pump <strong>and</strong> prime mover costs between January 1980 <strong>and</strong> July 1980.** Agrees with average of escalating costs used in CVEA <strong>Power</strong> CostStudy, January 1980.42
TABLE VIII-3Summary Cost EstimateOctober 1978 Prices from March 19}9 Susitna <strong>Power</strong> Market Study(Inflated 10% t~ October 1980)*Rai1be1t Area (Palmer) to Glennallen Intertie138 kV; 136 miles; 50,000 MWh. at 8 MW <strong>and</strong> 70 percent load factor.T~ansmission Line ($33,100,000 + 10%)$36,410.000Switchyards <strong>and</strong> Substatioris ($4,800,000 + 10%)Subtotal·Interest During Construction ($2,900,000 + 10%)Total Investment CostAverage Annual Cost (8%; 50 years)= Total Investment X 0.081743Operation, Maintenance, <strong>and</strong> Replacement ($131,000 + 10%)Total Average Annual Cost $= 7.6¢/kWhCost of Rai1belt energyTotal Cost5,280,00041,690,0003,190,000$44,880,0003,669,000144,0003,813,0005¢ to 6¢/kWh**12.5¢ to 14¢/kWh* The. Corps of Engineers inflated <strong>the</strong> powerp1ant <strong>and</strong> transmission linecosts of Allison Creek, alternative two, about 10% between January 1979<strong>and</strong> October 1980. Alternative one costs were decreased in that period.** Wholesale energy prices in <strong>the</strong> Anchorage area were about 1.5¢/kWh in1979. See also Table VIII-3A.43
Table VIII-3AAverage Rate DeterminationAnchorage Portion of Rai1be1t System8% Discount RateLow Case 1 Case 2 Medium Case 1 Case 2 High Case 1Energy System System Energy System System Energy SystemYear Forecast Costs Costs Forecast Costs Costs Forecast Costs(GWH) (GWH)* * *(GWH)* *1985 3,433 84.1 84.1 4,329 187.6 187.6 6,849 317.01986 3,594 84.8 84.8 4,657 193.7 193.7 7~357 368.61987 3,754 141.0 141.0 4,985 233.0 233.0 7,864 375.01988 3,915 136.6 136.·6 5,313 231.9 231.9 8;372 454.81989 4,075 173.4 173.4 5,641 272.0 254.5 8,879 457.71990 4,285 175.0 175.0 6,063 274.2 293.8 9,589 463.31991 4,495 185.7 185.7 6,485 324.2 343.8 10,298 541.01992 4,705 223.3 223.3 6,907 387.5 409.9 11,008 606.21993 4,915 227.2 227.2 7,329 391. 7 414.1 11,717 615.21994 5,125 270.9 252.4 7,751 398.9 421.3 12,427 686.7~1995 5,385 306.6 290.2 8,311 463.7 486.1 13,477 778.6~1996 5,645 367.3 327.9 8,871 549.0 571.5 14,526 852.31997 5,904 369.4 389.8 9,431 615.9 578.7 15,576 927.71998 6,164 376.4 396.7 9,991 627.7 650.2 16,625 1,008.21999 6,424 457.2 397.9 10,551 694.4 657.2 17,675 1,102.62000 6,489 450.2 470.6 10,863 691.8 714.3 18,584 1,169.82001 6,555 452.1 472.5 11,175 698.6 721.1 19,493 1,187.82002 6,620 449.4 469.8 11,487 760.3 723.1 20,402 1,260.12003 6,686 452.3 472.8 11,799 767.9 789.8 21,311 1,339.92004 6,751 454.4 474.8 12,111 776.0 798.5 22,220 1,359.62005 6,817 517.1 477.8 12,423 864.0 807.1 23,129 1,460.32006 6,882 520.2 480.9 12,735 872.8 815.9 24,038 1,541.92007 6,948 523.3 484.0 12,047 881.9 904.4 24,947 1,564.32008 7,013 526.4 487.1 13,359 891.1 913.6 25,856 1.,647.02009 7,079 529.6 490.3 13,671 901.6 932.1 26,765 1,730.32010 7,144 532.9 493.6 13,983 969.9 932.7 27,674 . 1,754.5Average ~/kWh 5.3 5.2 5.7 5.7 5.7*Millions of dollars.Case 1 is without Anchorage to Fairbanks interconnection <strong>and</strong> without <strong>the</strong> Susitna hydro project.Case 2 is with <strong>the</strong> Anchorage to Fairbanks interconnection <strong>and</strong> without <strong>the</strong> Susitria hydro project.Case 3 is with both <strong>the</strong> interconnection <strong>and</strong> Susitna but is not shown because its costs are lower.The higher cost comparisons are adequate.Source: March 1979 Susitna <strong>Power</strong> Market Study - 0 percent inflation values.
Diesel costs came from historical data up throt,lgh 1979. TableVIII-4shows expenses <strong>for</strong> several years. Fuel costs per kWh generated haveaveraged almost 14 percen~ growth per year <strong>for</strong> <strong>the</strong> last 5 years; <strong>the</strong>re<strong>for</strong>e,it is assumed to continue increasing'at something above <strong>the</strong> inflationrate. The study used 5 percent <strong>and</strong> 2 percent fuel cost escalation ratesas shown in TableVIII-4A.TableVIII-5 gives a summary comparison of Allison Creek <strong>and</strong> its alternatives.ThePRT undoubtedly does not include all costs. Never<strong>the</strong>less,it seems to be <strong>the</strong> most economical. The diesel comparison value isgiven <strong>for</strong> 1979 <strong>and</strong> estimated <strong>for</strong> 1980. Figure VIII-1 graphs <strong>the</strong>serelationships. .Average RatesTables VIII-6through VIII-9 indicate project payback rates <strong>for</strong> <strong>the</strong>different alternatives. For comparison, continuation of diesel generationat 5 <strong>and</strong> 2 percent fuel escalation is shown in tables VIII-10 <strong>and</strong>VIII-lOA. The rates, summarized below, are not much different thanthose shown in Table VIII-S.45
Table VIII-4CVEA Diesel Generation Expenses - HistoricAnnual EXEenses ($)EXEense Items 1974 1975 1976 1977 1978 1979Production Operationw/o fuel 117,698 284,556 473,161 653,248 778,609 713,288fuel 344,038 695,218 1,069,900 1,479,667 1,363,869 1,733,009Total Production 461,736 979,774 1,543,061 2,132,915 2,142,478 2,506,297OperationProduction Maintenance 33,732 57,370 83,752 102,218 116,088 114,117Total Production O&M 495,469 1,037,144 1,626,813 2,235,133 2,258,566 2,620,414Production Plantin-Service(2,239,181) (3,392,115) (8,025,424) (7,593,779) (7,712,880) (7,718,781)Annual Investment.po.a-Cost (at 7.5% <strong>and</strong>20-year Life) 219,646 332,740 787,231 744,890 756,570 757,150Total Annual Costs 715,115 1,369,884 2,414,044 2,980,023 3,015,136 3,377,564Net Generation (kWh) 15,624,140 26,886,515 39,286,690 47,461,390 ·43,835,350 41,498,633Energy Production Expense Rates (¢/kWh)O&M Excluding Fuel 1.0 1.3 1.4 1.6 2.0 2.1Total O&M Including Fuel 3.2 3.9 4.1 4.7 5.2 6.3Annual Investment Cost 1.4 1.2 2.0 1.6 1.7 1.8Total Annual Cost 4.6 5.1 6.1 6.3 6.9 8.1Note:Preliminary in<strong>for</strong>mation indicates 1980 annual generation cost may be close to 10¢/kWb.
TAHLE VIII-4ACVEA Diesel Generation Expenses - Future ContingenciesFuel Energy Fuel Cost----------Generation Cost O&H Cost OMI + FuelYear Used ollq~ut Efficie~ Historic Escalated For Fuel w/o Fuel Total Costs(Gab;) (kWh) (kWh/G,~l) (S/Gal) ($/G,~l) (S/Gal) (s/kwhf----(S/kWh) (S /kWh) ($/kl~h) ($/kWh)Historic1975 1,954,092 26,886,515 13.76 .356 0.026 0.0131976 2,962,176 39,286,690 13.26 .361 0;027 0.01[,1977 3,377 ,640 47,461,390 14.05 .438 0.031 0.0161978 3,336,027 43,835,350 13.14 .409 0.031 0.0201979 3,140,000 41,[.98,633 13.22 .552 0.04.2 0.02113.49 avpragpForecastFuel Escalation Percentage: 5% 2% 5% 2% * 5% 2%1980 13.49 0.900 0.900 0.067 0.067 0.040 0.107 0.107<strong>1981</strong> 13.49 0.945 0.918 0.070 0.068 0.040 0.110 0.1081982 13.49 0.992 0.936 0.074 0.069 0.040 0.114 0.10919R3 13.49 1. 0[,2 0.955 0.077 0.071 0.040 0.117 0.1 Ll1984 13.49 1.094 0.974 0.081 0.072 0.040 0.121 0.1121985 13.49 1.149 0.994 0.085 0.074 0.040 0.125 0.1141986 13.49 1.206 1.014 0.089 0.075 0.040 0.129 0.1151987 13.49 1. 266 1.034 0.094 0.077 0.040 0.134 0.1171988 13.49 ).330 1.054 0.099 0.078 0 .. 040 0.139 0.1181989 13.49 1.396 1.076 0.103 0.080 0.01.0 0.143 0.120.p. 1990 13 ,1,9 1.466 1.097 0.109 0.081 0.040 0.149 0.121-...J 1991 13.49 1.539 1.119 0.114 0.083 0.040 0.154 0.1231992 13.49 1. 616 1.141 0.120 0.085 0.040 0.160 0.1251993 13.49 1. 697 1.164 0.126 0.086 0.040 0.166 0.1261994 13.49 1.782 1.188 0.132 0.088 0.040 0.172 0.1281995 13.49 1.871 1. 211 0.139 0.090 0.0[.0 0.179 0.1301996 13.49 1. 965 1. 236 0.146 0.092 0.040 0.186 0.1321997 13.49 2.063 1.260 0.153 0.093 0.040 0.193 0.1331998 13.49 2.166 1.285 0.161 0.095 0~040 0.201 0.1351999 13.49 2.274 1.311 0.169 0.097 0.040 0.209 0.1372000 13.49 2.388 1. 337 0.177 0.099 n.040 0.217 0.139*Note that <strong>the</strong>se costs include annual investment costs of 1.8e/kWh.
Table VIII-5Average Rate ComparisonsAnnual Firm AnnualCost Energy RateAllison Creek 1 $3,489,521 34.3 GWh 10.2¢/kWhAllison Creek 2 3,229,176 32.2 10.0PRT 1,365,000 56 2.4Railbelt Interconnection 3,813,000 50 12.5 to 14Diesels - 1979 3,377,564 41.5 8.1- 1980 estimate 10.7From Chapter IV:1979 Residential Rate <strong>for</strong> 1,000 kWh/month Use<strong>Valdez</strong> 14.015.71979 Revenue Received per Energy Unit SoldCVEA Residential 13.1CVEA Total 12.4<strong>Valdez</strong> Total 11.548
Figure VIII-114..
Table VIII-6Average Rate DeterminationValdp.z/Glennallen SystemAllison Creek Hydro Project - Alternative 1V10Need* Project Project Present 1st Year AnnualYear (Table VII-I) Capabilit~ Output Worth Factor Energ~ Eg,uivalent(GWH) (GWH) Firm (GWH)(@ 8%; 50 yrs)(GWH)1980 47.9<strong>1981</strong> 16.41982 30.91983 33.41984 35.11985 38.9 16** 16.961515.381986 42.8 34~3 34.31987 46.9 34.3 34.31988 50.1 34.3 34.31989 54.5 34.3 34.31990 59.0 34.3 34.31991 63.7 34.3 34.31992 68.5 34.3 34.31993 73.6 34.3 34.31994 34.3 34.31995 34.3 34.31996 34.3 34.31997 34.3 34.31998 34.3 34.31999 34.3 34.32000 107.4 34.3 34.32001-2035 34.3 annually 34.3 11.3076***Annual Energy= Capital Recovery Factor X Sum of Yearly Energies= .081742 X 403.2 = 33.0 GWH per YearAnnual CostAverage Rate = Annua1 Energy$3.489.521 = 10.6¢/kWh33.0* After Solomon Gulch output is subtracted from <strong>for</strong>ecast - includes losses.** Assumed output <strong>for</strong> last half of year.*** Present worth factor <strong>for</strong> 1986-2035.387.85403.2
VI.....Table VIII-7Average Rate Determination<strong>Valdez</strong>/Glennallen SystemAllison Creek Hydro Project - Alternative 2Need* Project ProjectYear (Table VII-I) CaEabilit~ Output(GHW) (GWH) Firm (GHW)1980 47.9<strong>1981</strong> 16.41982 30.91983 33.41984 35.11985 38.9 15** 151986 42.8 32.2. 32.21987 46.9 32.2 32.21988 50.1 32.2 32.21989 54.5 32.2 32.21990 59.0 32.2 32.21991 63.7 32.2 32.21992 68.5 32.2 32.21993 73.6 32.2 32.21994 32.2 32.21995 32.2 32.21996 32.2 32.21997 32.2 32.21998 32.2 32.21999 32.2 32.22000 107.4 32.2 32.22001-2035 32.2 annually 32.2Annual Energy= Capital Recovery Factor X Sum of Yearly Energies= .081742 X 378.5 = 30.9 GWH per YearAnnual Cost $3,229,176 10.4~/kWhAverage Rate = = ~Annual Energy 30.9PresentWorth Factor(@ 8%; 50 yrs).961511.3076***1st Year AnnualEg,uivalent(GWH)Ener~~14.42364.10378.5* After Solomon Gulch output is subtracted from <strong>for</strong>ecast - includes losses.** Assumed output <strong>for</strong> last half of year.*** Present worth factor <strong>for</strong> 1986-2035.
Table VIII-8Average Rate Determination<strong>Valdez</strong>/G1enna11p.n SystemPressure Reducing TurbineYearNeed*(Table VII-I)(GHW)ProjectCapabili ty(GWH)80% Plant Fac.ProjectOutput(GHW)PresentWorth Factor(@ 8%; 50 yrs)1st Year AnnualEnergy Equivalent(GWH) .VIN1980<strong>1981</strong>19821983198419851986198719881989199019911992199319941995199619971998199920002001..;..2012Annual Energy47.916.430.933.435.138.942.846.950.154.559.063.768.573.6107.45656565656565656565656565656565656565633.435.138.942.846.950.154.5565656565656565656565656= Capital Recovery Factor X Sum of Yearly Energies= .081742 X 557.5 = 49.5 GWH per YearAverage Rate =Annual Cost=$1,365,000 = 2.8¢/kWhAnnual Energy 49.5.9259.8573.7938.7350.6806.6302.58356.0514**30.9330.0930.8831.4631.9231.5731.80338.88557.50* After Solomon Gulch output is subtracted from <strong>for</strong>ecast - includes losses.** Present worth factor <strong>for</strong> 1990-2012.
Table VIII-9Average Rate Determination<strong>Valdez</strong>/Glennallen SystemInterconnection with Rllilbelt System(PIIlmer-Glennallen Transmission Line)8% Discount RateYearNeed*(Table VII-l)(GWH)RequiredFromIntertie(GWll)RIIUbelt**EnergyRate(C/kWh)CostofEnergy$1,000CostofIntertie$1,000TotlllCostAnnually$1,0001st YeltrAnnualCost. Equivalent$1,0001st Year AnnulllEnergy Equivalent(MloIH)V1w1980 47.9<strong>1981</strong> 16.41982 30.91983 33.41984 35.11985 38.91986 42.81987 46.91988 50.11989 54.51990 59.01991 63.71992 68.51993 73.61994 78.41995 84.41996 88.71997 93.11998 97.71999 103.52000 107.438.942.846.950.154.559.063.768.573.678.484.488.793.197 .• 7103.5107.44.3 1,672.7 3,8134.2 1,797.6 3,8134.7 2,204.3 3,8134.4 2,204.4 3,8134.5 2,452.5 3,8134.8 2,832.0 3,8135.3 3,376.1 3.8135.9 4,041.5 3,8135.6 4,121.6 3,813·5.4 4,233.6 3,8135.8 4,895.2 3,8136.4 5,676.8 3,8136.1 5,679.1 3.8136.5 6,350.5 3,8136.2 6,417.0 3,8136.6 7,088.4 3,8135.485.75,610.66,017 .36,017.46.265.56.645.07,189.17,854.57,934.68,046.68,708.29,489.89,492.110,163.510,230.010,901.45,079.44,810.21.,776.74,423.04,264.24,187.54,194.84,243.53,969.33,727.13,734.8. 3,768.53,490.2·3,460.33,224.9.3,182.036,01.8.5.36,6
Table VIII-IOAverage Rate Determination<strong>Valdez</strong>/Glennallen SystemContinued Diesel Generation(5% Fuel Escalation)8% Discount RateNeed* Existing Required PresentYear (Table VII-I) CaEabilitl': OutEut Worth Factor(GWlI) (GWH) (GWH) (at 8%)1st Y .. ar AnnualEnersl': Eguivalent(GWH)Yearly Cost ofOt.M <strong>and</strong> Fuel with 1st Year'Annual5% Fuel Escalation Cost Eguivalent(SI,OOO) (w/fuel escalationof 5%/yr) (SI,OOO)V1~1980 47.9 116 47.9 0.9259<strong>1981</strong> 16.4 112 16.4 0.85731982 30.9 112 30.9 0.79381983 33.4 108 33.4 0.73501984 35,1 108 35.1 0.68061985 38.9 108 38.9 0.63021986 42.8 100 42.8 0.58351987 46.9 100 46.9 0.54031988 50.1 88 50.1 0.50021989 54.5 88 54.5 0.46321990 59.0 88 59.0 0.42891991 63.7 88 63.7 0.39711992 68.5 88 68.5 0.36771993 73.6 69 73.6 0.34051994 78.4 69 78.4 0.31521995 84.4 62 84.4 0.29191996 88.7 62 88.7 0.27031997 93.1 11 93.1 0.25021998 97.7 0 97.7 0.23171999 103.5 0 103.5 0.21452000 107.4 0 107.4 0.198744.3514.0624.5324.5523.8924.5124.9725.3425.0625.2425.3025.3025.1925.0624.7124.6423.9723.3022.6422.2121. 34520.165,112 4.733.1I,R05 1,547.43,509 2,785.43,916 2,878.14,250 2,892.74,868 3,067.85,539 3,231. 76,279 3,392.26,942 3,472. 'J7,821 3,622.58,772 3,762.09,817 3,898.310,947 4,025.212,203 4,154.713,492 4,253.315,082 4,402.316,466 4,450.117,960 4,494.619,595 4,540.321,589 4,631.923,308 4,630.278,866.8Annual Energy ~ Capital Recovery Factor X Sum of Yearly Energiesz .099832 X 520.2 ~ 51.9 GWh per YearAnnual Cost ~ Capital Recovery Factor X Sum of Yearly Costs ~ S7,873,500/yearAverage Rate = Annual Cost ~ $7,873,500/l':ear =15.~/kWhAnnual Energy 51.9 GWh/year* After Solomon Gulch output is subtracted from <strong>for</strong>ecast - includes losses.** Output from 1993 thru 2000 includes diesel additions to <strong>the</strong>rmal generators existing in 1980.
Table VIII-lOAAverage Rate Determination<strong>Valdez</strong>/Glennallen SystemContinued Diesel Generation(2% Fuel Escalation)8% Discount RateNeed* Existing Required PresentYear (Table VII-I) Ca~abilit~ Output Worth Factor(GWH) (GW\l) (GWH) (at 8%)1st Year AnnualEguivalent(GWH)Energ~Yearly Cost ofO&H -<strong>and</strong> Fuel with 1st Year Annual2% Fuel Escalation Cost Egu.ivalent($1,000) (w/f"el escalationof 2%/yr) ($1,000)\J1\J11980 47.9 116 47.9 0.9259<strong>1981</strong> 16.4 112 16.4 . 0.85731982 30.9 112 30.9 0.79381983 33.4 108 33.4 0.73501984 35.1 108 35.1 0.68061985 38.9 108 38.9 0.-63021986 42.8 100 42.8 0.58351987 46.9 100 46.9 0.54031988 50.1 88 50.1 0.50021989 54.5 88 54.5 0.46321990 59.0 88 59.0 0.42891991 63.7 88 63.7 0.39711992 68.5 88 68.5 0.36771993 73.6 69 73.6 ** 0.34051994 78.4 69 78.4 0.31521995 84.4 62 84.4 0.29191996 88.7 62 88.7 0.27031997 93.1 11 93.1 0.25021998 97.7 0 97.7 0.23171999 103.5 0 103.5 0.21452000 107.4 0 107.4 0.198744.3514.0624.5324.5523.8924.5124.9725.3425.0625.2425.3025.3025.1925.0624.7124.6423.9723.3022.6422.2121.34520.165,112 4,733.1 -1,772 1,519.23,381 2,683.83,701 2,720.13,939 2,680.74,421 2;786.24,928 2,875.35,470 2,955.45,920 2,961.66~525 3,022.57,158 3,070.17,832 3,110.28,536 ,3138.69,296 3,164.910.038 3,164.310,954 3,197.511,672 3,154 • .512,421 3,108.413,218 3,062.714,199 3,046.514,943 2,968.663,124.1Annual Energy ~ Capital Recovery Factor X Sum of Yearly Energiesa .099832 X 520.2 : 51.9 GWh per YearAnnual Cost = Capital Recovery Factor X Sum of Yearly Costs = $6,30l,820/yearAverage Rate ~ Annual Cost = $6,301,820/year =12.l/kWhAnnual Energy 51.9 GWh/year* After Solomon Gulch output is subtracted from <strong>for</strong>ecast - includes losses.** Output from 1993 thru 2000 includes diesel additions to <strong>the</strong>rmal generators existing in 1980.
----~------T'lble VIII-J 1Average Ra te Determination - Allison Creek Case (A 1 tern;)te 2)Va1dez/G1ennallpn SystemVI0'\EnergyCostEnergy Su!:,!:,ly <strong>for</strong> Need PreSE'nt Annual Cost of GE'Tlera t iOTl ·PrE'sen t Cost -Year Need'~ PRT Allison Cr. Diesels Worth 1980 PRT Allison Cr. DieselS Total Worth 1980 Energy(GWH) (GWll) (GWH) (GWH) (GWH) ($1,000) ($1,000) ($1,000) (IT, 000) ($1,000) (C/kWh)**1980 47.9 47.9 44.35 5,112 5, J 12 4,733.3 10.67<strong>1981</strong> 16.1. 16.4 14.06 1,805 1,805 1,547.5 11. 011982 30.9 30.9 24.53 3,509 3,509 2,785.6 11. 361983 33.4 33.4 24.55 1,365 ],365 1,003.3 4.091984 35.1 35.1 23.89 1,365 1,365 929.0 3.891985 3R.9 38.9 24.51 1,365 1,365 860.2 3.51198f> 42.8 42.8 24.97 1,365 1,365 796.5 3.191987 46.9 46.9 25.34 1,365 1,365 737.5 2.911988 50.1 50.1 25.06 1,365 1,365 682.R 2.721989 54.5 54.5 25.24 1,365 1,365 632.3 2.50] 990 59.0 56.0 3.0 25.30 1,365 3,22':1 4,594 1,970.3 7.791991 63.7 56.0 7.7 25.30 1,365 3,229 4,594 1,824.3 7.211992 68.5 56.0 12.5 25.19 1,365 3,229 4,594 1,689.2 6.711993 73.6 56.0 17.6 25.06 1,365 3,229 4,594 1,564.1 6.241994 78.4 56.0 22.4 24.71 1,365 3,229 4,591, 1,448.2 5.861995 84.4 56.0 28.4 24.64 1,365 3,229 4,594 1,340.9 5.441996 88.7 56.0 32.7 23.97 1,365 3,229 4,594 1,241.6 5.181997 93.1 56.0 34.3 2.8 23.30 1,365 3,229 540 5,134 1,284.8 5.511998 97.7 56.0 34.3 7.4 22.64 1,365 3,229 1,481, 6,078 1,408.3 6.221999 103.5 16 .0 31, • 3 13.2 22.21 1,365 3,229 2,759 7,353 1,577 .6 7.102000 107.4 56.0 34.3 17.1 21.34 1,365 3,229 3,711 8,305 1,649.8 7.73Sum 520.16 31,707.1Sum X Capital Recovery Factor 51.93 3,165,1.Sum X CRF Cost $3,165,400Average Rate = Sum X CRF Energy 51,930,000= 6.l/kWh* Energy need = <strong>for</strong>ecast ~ Solomon Gulch firm energy output.1,* From table VIII 4A. 2nd to last column X diesel supply in 5th column of this table (VIII-ll.
T
CHAPTER IXBIBLIOGRAPHY1. <strong>Power</strong> Cost Study, 1980-1993; <strong>Copper</strong> Valley Electric AssociationInc.; January 1980 •2. "Total Housing Units Authorized by Building Permits <strong>and</strong> PublicContractors in Selected Alaska Urban Areas"; Department of Housing <strong>and</strong>Urban Development; 1979.3. <strong>Power</strong> Requirements Study; <strong>Copper</strong> Valley Electric Association, Inc.;March 1979.4. Phase I Technical Memor<strong>and</strong>um, Electric <strong>Power</strong> Needs Assessment;Electric <strong>Power</strong> Work Plan Committee; draft report, March 1979.5. Upper Susitna <strong>River</strong> Project <strong>Power</strong> Market Analysis; Department ofEnergy, Alaska <strong>Power</strong> Administration; March 1979.6. Southcentral Alaska's Economy <strong>and</strong> Population, 1965-2025: A Base Study<strong>and</strong> Projections; a report of <strong>the</strong> Economics Task Force; SouthcentralAlaska Water Resources Study (Level B); Alaska Water Study Committee;February 1979.7. Alaska Labor Force Estimates by Area: revised 1974-1977; AlaskaDepartment of Labor, Research <strong>and</strong> Analysis Division; November 1978.8. Transcript of Proceedings - Report on <strong>Valdez</strong> Hydropower PublicMeeting; Corpos of Engineers; 24 July 1978.9. The Proposed Glennallen-<strong>Valdez</strong> Transmission Line - an Analysis ofAvailable Alternatives; <strong>Copper</strong> Valley Electric Association, Inc. byRobert W. Re<strong>the</strong>r<strong>for</strong>d Associates; May 1978.10. Hydroelectric <strong>Power</strong> <strong>and</strong> Related Purposes <strong>for</strong> <strong>Valdez</strong>, Alaska -Southcentral Railbelt Area, Alaska, Stage II Checkpoint Report; AlaskaDistrict, Corps of Engineers; April 1978.11. Solomon Gulch Project No. 2742 - Alaska: Final Environmental ImpactStatement; Federal Energy Regulatory Commission, Office of Electric<strong>Power</strong> Regulation; March 1978.12. Operation <strong>and</strong> Maintenance Plans <strong>and</strong> Costs - Mahoney Lake, Swan Lake,Lake Grace; Alaska <strong>Power</strong> Administration; February 1978.13. Alaska Regional Enf'.rgy Resources, Planning Project - Phase I:Findings <strong>and</strong> Analysis; volume 1; Alaska Division of Energy <strong>and</strong> <strong>Power</strong>Development, Department of Commerce <strong>and</strong> Economic Development; October1977 •59
14. Quarterly Statistics; Alaska Department of Labor, Research <strong>and</strong>Analysis Division; 1970-1977.15. Environmental Report <strong>for</strong> Solomon Gulch Hydroelectric Project -Exhibit W FPC Project No. 2742; <strong>Copper</strong> Valley Electric Association,Inc.; by R.obert W. Re<strong>the</strong>r<strong>for</strong>d Associates; 1976. .16. Current Population Estimates by Census Division; Alaska Departmentof Labor, Research <strong>and</strong> Analysis Division; 1970-1976.17. Definite Project Report -: Solomon Gulch Hydroelectric Project -Exhibit·T FPC Project No. 2742; <strong>Copper</strong> Valley Electric Association, Inc.by Robert W. Re<strong>the</strong>r<strong>for</strong>d Associates; March 1975.18. IS-Year <strong>Power</strong> Cost Study- Hydro/Diesel; <strong>Copper</strong> Valley ElectricAssociation, Inc.; by Robert W. Re<strong>the</strong>r<strong>for</strong>d Associates; October 1974.19. A Proposed Electric Generation <strong>and</strong> Transmission Intertie System <strong>for</strong>Interior <strong>and</strong> SouthcentralAlaska - Phase I; Trans-Alaska Electric Generation<strong>and</strong> Transmission Cooperative, Inc. by CH2M.Hill; April 1972.60
: I,B'III Ii ::1: iii,APPENDIX JPUBLIC VIEWS AND RESPONSES
Recipients of <strong>Valdez</strong> Draft Interim Feasibility Report <strong>and</strong>Environmental Impact StatementFederalSenator Ted StevensFormer Senator Mike GravelConqressman Don YounqDir~ctor, Office of ~nvironmental Project Review, U.S. Dept. of InteriorDeputy Assistant, Secretary <strong>for</strong> <strong>the</strong> Environment, U.S. nept. of CommerceEnvironmental Protection Agency, Washington, D.C.Environmental Protection Agency, Region XDirector, Alaska Operations Office, Environmental Protection AgencyDirector, Environmental Impact Division, Office of Environmental ProgramsAdvance Council on Historic PreservationHeritage Conservation <strong>and</strong> Recreation Service, Washington, D.C.Area Director, Heritage Conservation <strong>and</strong> Recreation ServicePacific Northwest Region, Heritage Conservation <strong>and</strong> Recreation ServiceU.S. Department of Commerce, Economic Development Administration.l\rea Director, Bureau of Indian AffairsRegional Director, National Marine Fisheries ServiceRegional Forester, U.S. Forest ServiceU.S. Department of Energy, Alaska <strong>Power</strong> AdministrationNational Park ServiceNational Oceanographic Data Center, Environmental Data Service, NOAAU.S. Department of Transportation, Federal Highway Administration, Re~ion XState Director, Bureau of L<strong>and</strong> ~anagementDirector, Bureau of L<strong>and</strong> Management, District OfficeManager, Alaska Outer Continental Shelf, Bureau of L<strong>and</strong> ManagementArea Director, U.S. Fish <strong>and</strong> Wildlife ServiceField Supervisor - WAES, U.S. Fish <strong>and</strong> Wildlife ServiceField Supervisor - NAES, U.S. Fish <strong>and</strong> Wildlife ServiceU.S.h.S. Water Resources DivisionSpecial Assistant to <strong>the</strong> Secretary, U.S. Department of Interior, AnchorageStudy Director, Water Resources Studies, U.S. Department of <strong>the</strong> InteriorPipeline Coordination OfficeAlaska Resources Library, Federal BuildingStateGovernor Jay HammondExecutive Director, Alaska <strong>Power</strong> AuthorityDept. of Commerce <strong>and</strong> Economic Development, Div. of Energy <strong>and</strong> <strong>Power</strong> DevelopmentDepartment of Natural Resources, Southcentral DistrictDirector, Division of L<strong>and</strong> <strong>and</strong> Water ManagementCommissioner, Department of Natural ResourcesDirector, Division of Community PlanningCommissioner, Department of Community <strong>and</strong> Regional AffairsCommissioner, Department of Fish <strong>and</strong> GameDepartment of Fish <strong>and</strong> Game, AnchorageDepartment of Natural Resources, Division of ParksDepartment of Environmental Conservation, S.C. Regional OfficeAlaska Denartment of Environmental ConservationState-Federal Coordinator, A-95 Clearinghouse
Recipents of <strong>Valdez</strong> Draft Interim feasibility Report <strong>and</strong>Environmental Impact Statement (cont'd)OrganizationsDr. Paul Friesema, Butler UniversityPaul Johnson, Knik Group/Sierra ClubRol<strong>and</strong> Shunks, Denali Group/Sierra ClubAlaska Native FoundationExecutive Secretary, Alaska Conservation SocietyAnchorage Audubon SocietyPresident, iHaska Geological SocietyAlaska Society of Professional EngineersLin Sonnenburg, Sierra Club-RCCAHTNA Inc.Institute of Marine Sciences, University of Alaska, FairbanksLibrary, University of Alaska, FairbanksLibrary, University of Alaska, AnchorageZ.J. Loussac Library, AnchorageDirector, Institute of Water Resources, University of Alaska, FairbanksArctic In<strong>for</strong>mation <strong>and</strong> Data CenterState Representative, Friends of <strong>the</strong> EarthExecutive Director, Fairbanks Environmental CenterTrustees <strong>for</strong> AlaskaAmerican Society of Civil EngineersAlaska Center <strong>for</strong> <strong>the</strong> EnvironmentAtomic Industrial ForumIndiana University- Political Science-Public <strong>and</strong> Environmental AffairsMarine Biological ConsultantsBlack <strong>and</strong> Veatch, Consulting EngineersMr. Jay Greenwalt, Tenneco BuildingMr. Sherman FeherTechnical In~rmationLibrarian, Energy Impact AssociatesFluor Ocean ServicesFred Schmidt, Colorado State UniversityLarry !~i 1 ki nson, Foundation Sci encesLocalMayor of <strong>Valdez</strong><strong>Valdez</strong> City ManagerPostmaster, GlennallenPostmaster, CordovaPostmaster, <strong>Valdez</strong>Postmaster, <strong>Copper</strong> CenterMr. <strong>and</strong> Mrs. Robert B. CliftonHo 11 i s Henri chsCenter, Stone <strong>and</strong> Webster Engineering Corp.
Recipients of <strong>Valdez</strong> Draft Interim Feasibility Study<strong>and</strong> Environmental Impact Statement (cont'd)Charles F. LaPageMr. Herbert W. LehfeldtMr. Perry LovettMr. Chalres E. MaxwellMr. Frank H. TatroThe <strong>Valdez</strong> Vanguard, <strong>Valdez</strong>The <strong>Valdez</strong> Vanguard, CordovaThe Cordova TimesStation KCAM, GlennallenMr. Max Faucher, Executive Director, <strong>Copper</strong> Valley Native Association<strong>Copper</strong> Valley Electric AssociationGeneral Manager, <strong>Copper</strong> Valley Electric Association, Glennallen<strong>Valdez</strong> Chamber of Commerce<strong>Copper</strong> Valley Telephone Co-opChief, Volunteer Fire Deaprtment
u. s. ENVIRONMENTAL PROTECTION AGENCYREGION X1200 SIXTH AVENUESEATTlE. WASHINGTON 981013 DEC ~Colonel Lee R. NunGDistrict EnginEerAlaska District, Cerps of EngineersP. O. Box 7002Anchorage, Alaska Q9510RE: <strong>Electrical</strong> Po~er <strong>for</strong> <strong>Valdez</strong>, Draft Interim Feasibility Report<strong>and</strong> Environmer.tal Impact StatementDear Colonel Nunn:The Environmental Protection Agency (EPA) has ccmpletea its reviewof <strong>the</strong> Draft Interim Feasibility Report <strong>and</strong> Environmental ImpactStatement on Electri:al <strong>Power</strong> <strong>for</strong> <strong>Valdez</strong> <strong>and</strong> <strong>the</strong> <strong>Copper</strong> <strong>River</strong> <strong>Basin</strong>.1. We believe Jhat <strong>the</strong> two tailrace system below <strong>the</strong> powerhouse <strong>and</strong> <strong>the</strong>plannea use: of <strong>the</strong> pressure reducing turbine are desirable aspectsof <strong>the</strong> plan.- We also appreciate <strong>the</strong> discussion of alternative powersources <strong>and</strong> :locaticr,s <strong>for</strong> nydropower. However, we believe that <strong>the</strong>[IS lacks adequate in<strong>for</strong>mation regard>-,g <strong>the</strong> impacts expected fromlake arawaO\'m, durr'ring of tunnel tailings, ana -..ater temperaturemodification by <strong>the</strong> tailrace section. We also believe that publicinvolvement <strong>and</strong> en=rgy conservation shiluld be exp<strong>and</strong>ed ana discussedin greater detail, ~nd that transmiss'on corridors <strong>and</strong> mitigationmeasures should be ;'inal izea. Our specific cCI1'rr:ents 01' <strong>the</strong>se issuesare enclosed as an attachment.We have rateo this oIS as ER-2 due to this lack af in<strong>for</strong>mation <strong>and</strong><strong>the</strong> project's potential impact on water quality. This ER-2 ratingwill be Dub"tished i~ <strong>the</strong> FedEral ReqistEr in accoroance 'Hith ourresDcnsiblity to in<strong>for</strong>m <strong>the</strong> public of our views as required inSection 309 of <strong>the</strong> Clean Air Act.If you have any questions regarding our C()OOlents or would 1 ike todiscuss <strong>the</strong>m, please feel free to contact ei<strong>the</strong>r me or Scott Berg ofmy staff at (206) 4~2-1285 or (FTS) 399-1285.Sincerely yours,~Lkrl;Gu~r--Elizabeth Coroyn, C~iefEnvironmental Evaluation Branch1. Report findings were based on available data including hydrologiC computeranalyses, recording <strong>the</strong>rmographs <strong>and</strong> a field check of <strong>the</strong> Allison Laketemperature profile. In<strong>for</strong>mation on fisheries resources was obtained from<strong>the</strong> Alaska Department of Fish <strong>and</strong> Game. In all cases where detailedin<strong>for</strong>mation was lacking, a worse case basis was assumed. The section onlake drawdown, disposal of tunnel tailings, <strong>and</strong> transmission corridorshave been revised <strong>for</strong> clarification. Data collecton measures are now inprogress <strong>and</strong> several more are proposed <strong>for</strong> <strong>the</strong> near future. During <strong>the</strong>Advanced Engineering <strong>and</strong> Design (AE&D) phase, intensive ef<strong>for</strong>t by <strong>the</strong>Alaska District <strong>and</strong> <strong>the</strong> U.S. Fish <strong>and</strong> ~ildlife Service would beaccomplished to obtain detailed in<strong>for</strong>mation necessary prior to projectimplementation. During <strong>the</strong> AE&D phase, an environmental document will beprepared as appropriate. The Alaska District is looking <strong>for</strong>ward tocontinued close coordination with your agency as "'ell as o<strong>the</strong>r interestedresource agencies in assuring environmentally sound development whichwould preserve <strong>the</strong> fisn <strong>and</strong> wildlife resources <strong>and</strong> also providehydroelectrical generation to <strong>the</strong> project area.Attachment
PUBLIC INVOLVEMENT2. Involvement in <strong>the</strong> project by Federal, State, <strong>and</strong> local governmentsappears to be extensive. However, we find no mention nor indicationthat <strong>the</strong> public has been involved in <strong>the</strong> scoping process. Webelieve that agressive public involvement is essential <strong>and</strong> should beconducte
25. ~e str?ngly recOTmend that an alternate disposal site <strong>and</strong> methods be1nvest1gated. It appears from <strong>the</strong> photo on page ii that a benchne~r <strong>the</strong> portal could serve as a disposal area. Re~egetation ofth1S area would be much easier than <strong>the</strong> cliff. In addition, if ahaul roa? could safely be constructed down <strong>the</strong> most gentle slope,<strong>the</strong> ta111ngs could represent a source of fill or ballast.WATER TEMPERATUR~MITIGATION6. We note that <strong>the</strong> rationale behind <strong>the</strong> two tailrace system is todi~ert win~er powerhouse releases directly to Port <strong>Valdez</strong>, <strong>the</strong>rebynot affect1ng water temperature 1n All1son Creek d~ring salmon egg1ncubat1on. ,However, <strong>the</strong> most critical months, because of spawningsalmon, are uuly <strong>and</strong> August. The lake tap would sUbstantially lowerwater Lemperature~ at <strong>the</strong> time of spawning, <strong>the</strong>reby delayingdevelopment. It 1S not clear what flow regimes will occur in <strong>the</strong>stream channel be~ow <strong>the</strong> powerhouse during <strong>the</strong>se critical months.What proport10n or <strong>the</strong> total flow would originate from to <strong>the</strong>powerhouse ve~sus <strong>the</strong> natural channel <strong>and</strong> what temceratures could beexpected? What provisions will be made <strong>for</strong>t low water years?t;PRESSURE REDUCING TuRBINE i!7.8.The feasibili~y stud~ <strong>for</strong> <strong>the</strong> pressure reducing turbine states thatone.of 1ts pr1mary d1sadvantages is that "it would only functionunt1l <strong>the</strong> 011 runs out." It would appear that once <strong>the</strong> oil Goes runout, <strong>the</strong> refinery <strong>and</strong> most otner economic activity dependent JPon<strong>the</strong> oil resource will .also cease. The PRT would <strong>the</strong>n supply energyf?r <strong>the</strong> 11fe ?f <strong>the</strong> p1pellne <strong>and</strong> woula efficiently cease just at <strong>the</strong>t1me wnen 1t 1S no longer needed. An explanation of why this isseen as a disadvantage should be included ~n future reports.WATER (JUALITYIA lake level fluctuation of 100 feet could ~ause sUDstantial erosionof eX1st1ng Deltas <strong>and</strong> <strong>the</strong> lake shore. Tht effects of sedimentreaistribution can be deleterious because of <strong>the</strong> excessiveresusoension of sediments into <strong>the</strong> water column. This increasedturbidity could result in adverse fish impacts downstream from <strong>the</strong>powerhouse: ~hes;, impacts are briefly mentioned but not adequatelyd1scussed 1n .he C1S sect10n. Future reoorts should discuss :hePOSS1~111ty of clogging <strong>the</strong> intake with sediment, expected levels ofd1ssolve~ oxyqe~: <strong>the</strong> cegre~ of fisheries aegradctior: resulting from1ncreas~~ rurD1D1ty anc sed1mentat10n, <strong>and</strong> possible mitigationr::c-~sti!'es •5. The text has been revised <strong>for</strong> clarification. Refer to section D.2.a. of<strong>the</strong> FEIS. Alternative disposal sites have been investigated <strong>and</strong>eliminated mainly due to engineering constraints. Although a bench may beinterpreted from <strong>the</strong> photo in <strong>the</strong> Feasibility Report, that area is steep<strong>and</strong> would require extensive diking to contain <strong>the</strong> tailings. It is <strong>the</strong>opinion of <strong>the</strong> biologists who have visited <strong>the</strong> site that <strong>the</strong> proposeddisposal area is <strong>the</strong> least environmentally damaging alternative.6.7.8.As stated in <strong>the</strong> DEIS <strong>and</strong> FEIS, 40C temperature was employed as a worsecase basis because of <strong>the</strong> lack of specific data at Allison Lake <strong>for</strong> thistime period. Temperature data from similar Alaskan lakes indicate thattemperatures at <strong>the</strong> depth of <strong>the</strong> lake tap would probably be 2 to 30Chigher. Tables 2 B<strong>and</strong> 3 of Appendix E are calculated flows of bothpowerhouse discharge <strong>and</strong> <strong>the</strong> contribution of <strong>the</strong> watershed below <strong>the</strong>lake. Estimated percentages of <strong>the</strong> regulated water from <strong>the</strong> tailrace are33 percent <strong>for</strong> July <strong>and</strong> 40 percent <strong>for</strong> August of <strong>the</strong> total Allison Creekflow. When actual intake temperatures are obtained <strong>for</strong> Allison Lakeduring July <strong>and</strong> August, provisions to refine <strong>the</strong> mitigative measures wouldbe employed."Although <strong>the</strong> stUdy area may enter an economic slump when <strong>the</strong> ofl isdepleted, <strong>the</strong> extent <strong>and</strong> long tenn effects are impossible to assess. Itis probable that if <strong>the</strong> pipeline did cease to operate <strong>for</strong> lack of oil, <strong>the</strong>refinery would remain open <strong>and</strong> receive oil from elsewhere. Even if loadsdropped significantly. additional energy would be needed above SolomonGulch's output. This would have to come from o<strong>the</strong>r sources, most likelydiesel or possibly a railbelt intertie. In ei<strong>the</strong>r case <strong>the</strong> cost would behigher than <strong>the</strong> PRT.Text has been revised fer clarification. The shoreline of Allison Lake iscomposed mainly of large boulders with little fine grain materjal presentexcept <strong>for</strong> <strong>the</strong> delta at <strong>the</strong> head of <strong>the</strong> lake. Although <strong>the</strong> erOSionpossibilities of this delta are unknown, <strong>the</strong> Alaska District believes itwould react similarly to <strong>the</strong> delta at Long Lake near Juneau. Long Lake isa glacial fed lake of similar configuration to Allison Lake. The lake wastapped <strong>for</strong> hydroelectric power generation several years ago <strong>and</strong> <strong>the</strong> AlaskaDepartment of Fish <strong>and</strong> G~€ has established a hatchery in its tailrace.Water quality parameters are monitored regularly <strong>and</strong> no degradation hasoccurred. The shoreline has not experienced erosion <strong>and</strong> <strong>the</strong> deltaunderwent a change in slope <strong>and</strong> stablized after <strong>the</strong> first year.
39.10.TAAN5~!SSJO~CORRIDORine ·1 Dcati on of tne transrrlss lon I ine <strong>for</strong> <strong>the</strong> PRT has not beenoetermi'lf'Cl at this time. We believe that <strong>the</strong> locatio~. ~nould be .finalized as ,oon as possible. Visual sersitivity ShOUlD bea maJorconsideration, Wltr tnE clearing of vegetatiofl kept to ~ mlnlmum.hgf' US-l1 states that 3.S miles ~f dense conifer ~orest would bec.ieared <strong>for</strong> tne transmission line Trom <strong>the</strong> Alllson lreeK prOJect.It dPoears tr-,at <strong>the</strong> transmission 1 ire could parallel <strong>the</strong> roadthP~eby eliminatinG <strong>the</strong> n
UNITED STATES DEPARTMENT OF CO!'!MERCEThe Assistant SecrHary fDr Policy:. =1-"- -:;l:'~" [ :. ::- - --Colonel Lee R. ~~unnAlaska District. Corps of EugineersDepartment of <strong>the</strong> ArmyPost Office Box 7002Anchorage, Alaska 99510[lear Colonel :iunn:This is in reference'·to your draft environmental impact statecent entitled,"<strong>Electrical</strong> <strong>Power</strong> <strong>for</strong> <strong>Valdez</strong> <strong>and</strong> <strong>the</strong> <strong>Copper</strong> <strong>River</strong> <strong>Basin</strong>." The enclosedCOOlI!lents from <strong>the</strong> National Oceanic <strong>and</strong> Atmospheric Administration are<strong>for</strong>warded <strong>for</strong> your consideration.Thank you <strong>for</strong> giving uS an opportunity to provide <strong>the</strong>se co~ents, which wehope will be of assistance to you. ~e would appreciate receiving five (5)copies of <strong>the</strong> final statement.Sincerely,Robert T. MikiDeputy Assistant Secretary <strong>for</strong>Regulatory Policy (Acting)Enclosures: ~emo from Hr. Robert \J. HcVeyNational Marine FisheriesService - NOAAMr. Robert B. RollinsNational Ocean Survey -NOAA
UNITED STATES DEPARTMENT OF COMMERCENational Oceanic <strong>and</strong> Atmospheric AdministrationNational Marine Fisheries Se1"'JiceP.o. Box 1668Junea~, Alaska· 99802OateNovember :;, 1980Reply to A 1::n. at:ToFromSubiect:PP/EC - ;,et::~ ff b-,~y/AKR i./Ir;w. McVeyReview of :casibi1ity Report <strong>and</strong> DEIS No. 8010.0S - <strong>Electrical</strong> <strong>Power</strong> <strong>for</strong><strong>Valdez</strong> anc <strong>the</strong> <strong>Copper</strong> <strong>River</strong> <strong>Basin</strong> Southcentral Railbelt Area, AKWe have re7iewed <strong>the</strong> sUbject document <strong>and</strong> offer <strong>the</strong> following comments:Feasibil ~:->ReportThe inter~ feasibility report appears to have adequately investigated<strong>the</strong> vario~ alternatives <strong>for</strong> energy production in <strong>the</strong> <strong>Valdez</strong> area <strong>and</strong> tohave reac~2d a logical conclusion. We have no additional comments tooffer on :iis·report.Draft Env::onmental Impact StatementGENERAL C~ENTS1. a)2. b)It is apF~rent from reviewing <strong>the</strong> DEIS that additional data are neededon Allis,,:: Creek be<strong>for</strong>e sound decisions can be made.Allio0n Creek does not have a gauging station so flows have beencalc~~ated <strong>for</strong> <strong>the</strong> drainage basin using meteorological data. Itmay :e beneficial to p.stablish a gauging station on <strong>the</strong> stream toobtc~"1 some recorded streamflow data. Even if data would becol:'~cte.d <strong>for</strong> only a few years prior to project construction, <strong>the</strong>ywoc:: provide a basis of comparison <strong>for</strong> determining <strong>the</strong> accuracy of<strong>the</strong> ::eteorological data <strong>for</strong> <strong>the</strong> area.Add::ional temperature data should be collected prior to project,:ono:ruction. Table lA in Appendix E provides temperature data <strong>for</strong>Allioon Creek from June 26, 1979 through February 27, 1980. Temperaturedat~ from Allison Lake have been collected on only one occasion.Th"~,, data provide an inadequate base from which to draw soundcon::"J.sions.SPECIFIC :OMMENTS1. A recording stream gage was established in Allison Creek in March <strong>1981</strong> <strong>and</strong>will continue to operate through project construction.2. The temperature data from Allison Creek has been updated (refer toAppendix E, Table 1). Two additional <strong>the</strong>rmographs are proposed <strong>for</strong>Allison Creek, one to record intergravel temperatures within <strong>the</strong> stream,<strong>and</strong> <strong>the</strong> second to be placed in <strong>the</strong> intertidal area to record intergraveltemperatures <strong>and</strong> <strong>the</strong> changes due to tidal influence. The <strong>the</strong>romographswill be installed prior to <strong>the</strong> <strong>1981</strong> spawning season. During <strong>the</strong> AdvancedEngineering <strong>and</strong> Design (AE&D) phase, numerous temperature profiles ofAllison Lake would be accomplished during all seasons.Section :, Subsection Ib, page EIS-9, paragraph 3It is st~:ed that ..... <strong>the</strong> natural flushing process will be eliminated<strong>and</strong> poss::le sedimentation of spawning gravels may occur. During highwater yE~:3, it may be necessary to spill quantities of water, this may
3. have adequate flows <strong>for</strong> flushing of <strong>the</strong> gravels." Does <strong>the</strong> Corps haveany additional mitigating measures, such as mecha~ical flushing, planned<strong>for</strong> cleaning spaw~ing gravels if necessary? This topic needs to bediscussed in greater detail in <strong>the</strong> FEIS.Section E, page EIS-154. This section discusses, among o<strong>the</strong>r things, <strong>the</strong> concept of a two tailracesystem to regulate <strong>the</strong> quantity of water being released into AllisonCreek. It appears that water from <strong>the</strong> powerhouse .... ill be available tosupplement <strong>the</strong> flow in Allison Creek as needed. It is imperative thatthis water does not differ substantially from <strong>the</strong> normal flow in AllisonCreek with respect to temperature, dissolved oxygen, etc. This projectshould be designed to ensure that adequate natural stream flows areavailable if needed (Le. if <strong>the</strong> powerhouse is shut down or if <strong>the</strong>quality of water from <strong>the</strong> powerhouse is inadequate with respect totemperature, etc.).5. This section also contains a brief discussion of <strong>the</strong> potential <strong>for</strong>cumulative impacts resulting from construction of <strong>the</strong> ALPETCO facility<strong>and</strong> dock, <strong>the</strong> city dock expansion, <strong>the</strong> Solomon Gulch hydroelectricproject <strong>and</strong> some proposed development on Mineral Creek. This sectionshould be exp<strong>and</strong>ed to include a description of each of <strong>the</strong>se projects<strong>and</strong> some discussion of <strong>the</strong> potential impacts.3. Allison Creek is relatively free of small grain materials <strong>and</strong> fines. Theperiodic spilling of Allison Lake <strong>and</strong> <strong>the</strong> expected SUrm1er flo .. s '.;auldprobably be sufficient; <strong>the</strong>re<strong>for</strong>e, no sedimentation of <strong>the</strong> stream isanticipated. However, if additional studies show that sedimentation ofspawning gravels does occur, <strong>the</strong> problem would be rectified by methodsagreeded upon during <strong>the</strong> AE&D phase prior to construction.4. If a moderate to large percentage of <strong>the</strong> flow is discharged from <strong>the</strong>powerhouse it is possible that a temperature change could occur. Most of<strong>the</strong> spawning occurs intertidally <strong>and</strong> <strong>the</strong> effects of <strong>the</strong> warmer dischargeon incubation is unknown. The planned installation of an intergravel,intertidal <strong>the</strong>rmograph <strong>and</strong> exp<strong>and</strong>ing knowledge of <strong>the</strong> winter flow regimewill aid in refining mitigative measures. Adequate flows would bemaintained by scheduling turbine maintenance during times when sufficientnatural stream flow <strong>for</strong> egg incubation is available.5. The Alaska District agrees <strong>the</strong> cumulative impacts in <strong>the</strong> <strong>Valdez</strong> area arean important aspect to fur<strong>the</strong>r development. Environmental ImpactStatements or Environmental Assessments have been published <strong>for</strong> <strong>the</strong>seprojects <strong>and</strong> are reasonably available. In accordance with NEPAguidelines, this in<strong>for</strong>mation has been incorporated by reference.CLEARANCE:;!,/~TIJREF/HP: Ken ROberts~\ rt, U---z"¥----=tUm DATE:Ii-,: .
fS>\\....- ,';',~1\\:~~, ~~UNITED STATES DEPARTMOJT OF COMMERCENational Oceanic <strong>and</strong> A.tmospheric Administratiol:"jA::C'.:"L I~
Cnitc:d Srat6 [)c'~,artmcnt of <strong>the</strong>: I:-::-;::riorF () Bo\ 120\f,c-i't ·r,,!.,!y \1.1\l ... l..~r5HIER-SCo/ 1:51 :'t~e!:lber Lt, 1.980COlO:l~: Lee n. N~...rln~i5t!"ic~ EngineerAlask~ District, Corps of E~~~neersP. G. Box 7002Ancnorage, Alaska 99510~earCelonel Nunn"In response to yoOJr Sep"tembe!" 8, 1980, rectuest 'We flE.,"e reviewed <strong>the</strong> DraftIn"te:-':'!: Feasibility ::tepor:. ar::' Environmental :z::.pac-: ::..a:~ement (r:EIS) <strong>for</strong>Elec~rical <strong>Power</strong> <strong>for</strong> <strong>Valdez</strong> <strong>and</strong> <strong>the</strong> <strong>Copper</strong> <strong>River</strong> Eao~~. We offer <strong>the</strong> followingC-Ol!lDenT..S <strong>for</strong> yOlU' consideration.Gener~lCo~ents1. From our perspective, projec: in<strong>for</strong>mation anG <strong>the</strong> dis~ussion of alterna~ivesin <strong>the</strong> repor"!. <strong>and</strong> DEIS appea:- ~o be gene:-ally aae,:;.u.c.:e. Hoyever, "e believeboth aocumen"!.s are lacking i~ specific info~tio~ related to fisheriesresources <strong>and</strong> vater quality, flows, <strong>and</strong> temperatures. We underst<strong>and</strong> thatadditional studi~s are bein, Flanned as per reconoer.:ations contained in<strong>the</strong> Fish <strong>and</strong> Wildlife Service's May 21, 1980 Fish a~d Wildlife CoordinationAct Report. Upon:. completion of <strong>the</strong>se studies, a SUFplemental CoordinationAct Report ,till be prepared ty <strong>the</strong> Fish a"d Wildlfie Service.1. Refer to response No.1, EPA CommentsSpecific Comments2.FeaSibility Report:Page 32, lmnact Assessment:oil spill be addressed.We suggest that <strong>the</strong> possibility of an3. Page 36, Impact Assess~ent: We believe an assesssment of <strong>the</strong> impactscf Alternative 1 should also be discussed in this section.2. The installation of <strong>the</strong> Pressure Reducing Turbine~robability.of an oil spill because <strong>the</strong> necessaryl~stalled wlth <strong>the</strong> construction of <strong>the</strong> pipeline.plpeline would be required.3. Text revised. Refer to page 36 of <strong>the</strong> Feasibility Report.should not increase <strong>the</strong>piping <strong>and</strong> valves wereNo alteration of <strong>the</strong>Environmental Impact S~atement:4. Page 9, Hydrology <strong>and</strong> ~ater Quality: We sugges~ that <strong>the</strong> EIS discuss<strong>the</strong> design of features ~d methods <strong>for</strong> providi~g vater release shouldit be necessary to spill excess vater during bigh vater years.4. Text revised. Refer to section D.l.b of <strong>the</strong> FEIS.
5. Pag" lU, Hydr~log\'
AdvisoryCouncil OnHistoricPreservation1 ~Z2 K Street. NWW.shlO~lon . .oC 20005Lake Ptaza South. SUIte 6:44 Umon Boule~ardLHkPwood. CO 80228Occober 24, 1900,.ri~:!'"ict. E:-:.~inee!"Cc!"'ps of E:lgineers, _lJ.as~c.. J:'strictDE';B.!'""Cme:i..'t 0: <strong>the</strong> ArmyP. C. Box 7002~chorage, ~~aska 99510Llee.r CoJ.ODel Nun~:r.l'h5.:J.}: you fo!" yOUl~ requf'st of ~,~;)"Le:::"~er 30, :980, <strong>for</strong> c~:;:nments ont ne Draft Irl"teriI!. Feasi bil:' ty Repor~_ <strong>and</strong>: t.he Envircnrne~talsts.7.~ment <strong>for</strong> Soutbcent:-al Railbel:. Area, Alaska, fo!" electrical"Do-,e!" <strong>for</strong> "valdez <strong>and</strong> <strong>the</strong> COPDer Rive!" E2.sin. p...J.rsli.ant to Sectioni02(2)(C) of <strong>the</strong> National E~:"i,·on:;tenccal Folicy Act of 1969 <strong>and</strong><strong>the</strong> CQuncil' s regulc.tj o~~s, "P:LD:'e27. _G.:: of Historic <strong>and</strong>- CU: tural?ro:;.ercies 1t (36 CFR Part 300), we '":.2..1/2 de~,er~ined that yOll!"e:-.v.: ..:'0!1ID.P!1tal sta--:'e!Ilent fl.;Jpear-s adJ?q'L.a'"e cancer-nine; our area ofiL~erest, find ~w.:: have no ~ur<strong>the</strong>r co:r..m.en'ts at this tiDe,1. Comment Noted •Sincer,> ly,~~~ .1/C{e!(~fChief, Western Divisiono~ Frojec'"V Review
JA r s. HAIIIIOIilD. 60YfRIIOIINovember 4, 1980Col. Lee R. NunnDistrict Engineer'Alaska uistrict, Corps of EngineersPost Office Box 7002Anchorage, Alaska 99510Dear Colonel Nunn:Re:<strong>Electrical</strong> <strong>Power</strong> <strong>for</strong> <strong>Valdez</strong> - Draft Feasibility Report <strong>and</strong>Environmental Impact StatementThe Alaska Department of Fish <strong>and</strong> Game has reviewed <strong>the</strong> referenced draftfeasibility report <strong>and</strong> Environmental Impact Statement (EIS).In general. we feel <strong>the</strong> report <strong>and</strong> EIS provide an adequate descriptionof <strong>the</strong> proposed project, potential environme'1tal impacts <strong>and</strong> mitigationmeasures.1. Our biggest concern re1~tes to <strong>the</strong> potential impacts on <strong>the</strong> anadromousfisheries resources in Allison Creek. While we have no objection to <strong>the</strong>project as proposed this Department will require measures to mitigateconflicts. We support <strong>the</strong> concept of <strong>the</strong> U.S, Fish <strong>and</strong> Wildlife Servicerecommendations; however, we feel <strong>the</strong> additional studies described inboth <strong>the</strong> Coordination Act Report (page 17) <strong>and</strong> <strong>the</strong> EIS (page EIS-16)should be conducted be<strong>for</strong>e any specific recommendation on mitigation ismade. The Department of Fish <strong>and</strong> Game desires to participate in both'<strong>the</strong> scoping <strong>and</strong> actual conduct of <strong>the</strong> studies which should be accom- .plished during <strong>the</strong> advanced engineering <strong>and</strong> design phase of <strong>the</strong> project.~, The ~laska District will be ga<strong>the</strong>ring additional physical <strong>and</strong> bio10 icalln<strong>for</strong>matl0n,durlng <strong>the</strong>,Advanced Engineering <strong>and</strong> Design (AE&D) phase /streamgage on All1son Creek 1S now operational <strong>and</strong> two intergrave1 recordint~erm?grap~s are p~oposed <strong>for</strong> installation in <strong>the</strong> near future. The A~askaD1strlct w11l cont~n~e close coordination of all future studies with yourdep~rtment <strong>and</strong> SOllC1t your recommendations to assure <strong>the</strong> project isenv1ronmenta11yacceptab1e.In addition to <strong>the</strong>se general comments on <strong>the</strong> report <strong>and</strong> EIS we have somespecific input which will be transmitted directly to your staff.
Corps Of Engineers - 2 -11/4/80Thank you <strong>for</strong> <strong>the</strong> opportunity to comment.Sincerely,Ronald O. Skoog, Commissioner~~ '\27 ~A"R7 /t.,1BY: Bruce M. BarrettProject Keview Coorci,latorHabitat Protection SectionTelephone 3440541cc:R. Logan, ADFGM. Whitehead, OPOP(State 1.0. # 80101501ES)
" I"\:'~ VI" ,,In,I,I, vr i,~ m,r, 'II, ,I,'r- I., n I'" ~'riJ rv7 ~LJ" r II := - ,,} \ !, t~ I, \,' I,'r\J '\\' ; ..... i I (, 'J~' I r' U v r I, , i ! '\ I I \ I .;~ L: Lf'J U,~ v U L:lJ b Lr'J ,_/ L. \j u\..lOFFICE OF THE GO~'ERNORDIVISION OF POLICY DEVELOPMENT AND PlANNINGDecember 29, 1980JAY 5 HAMMO'-ID, Go •• rnorPOUCH AOJUNEAU. ALASKA 99817PHONE,' 465~573Mr. Loran BaxterU.S. Department of <strong>the</strong> ArmyAlaska Corps of EngineersP.O. Box 7002Anchorage, Alaska 99510SUBJECT:Dear Mr. Baxter:COE <strong>Electrical</strong> <strong>Power</strong> <strong>for</strong> <strong>Valdez</strong> Renewable Energ;- Project DEISState lOt FD214-80101501ESThe Alaska State Clearinghouse (SCH) has completed re~iew of <strong>the</strong> referencedDElS.The City of <strong>Valdez</strong> commented:L"The City of <strong>Valdez</strong> has reviewed <strong>the</strong> COE DIFR/EIS <strong>and</strong>found it consistent with community objectives. The impactof <strong>the</strong> recon~ended action upon <strong>Valdez</strong> will be positivein supplying energy to meet <strong>for</strong>ecast power dem<strong>and</strong>s':,"The growth that is projected <strong>for</strong> Valuez in this decadewill surpass <strong>the</strong> capacity of <strong>the</strong> current power generationsys tem. The proposed acti on of <strong>the</strong> CDE wi 11 benefit Va 1 dez<strong>and</strong> <strong>the</strong> <strong>Copper</strong> <strong>River</strong> <strong>Basin</strong> through ad~anced planning <strong>for</strong><strong>for</strong>ecast energy dem<strong>and</strong>s <strong>and</strong>, ultimately, supplying powerin advance of critical shortages."Considering <strong>the</strong> amount of power generated by <strong>the</strong> proposedaction, relatively little environmental impact will result.We feel that <strong>the</strong> COE has adequately addressed <strong>the</strong>' environmentalimpacts of <strong>the</strong>ir EIS section."The following comment was received from <strong>the</strong> Department of NaturalResources (DNR):"1. Of <strong>the</strong> various alternatives presented to help meet <strong>the</strong>needs -of <strong>the</strong> electrical power as projected in <strong>the</strong> report.a combination of <strong>the</strong> hydro-electrical facility atAllison Lake <strong>and</strong> <strong>the</strong> Pressure Reducing Turbine to beinstalled in <strong>the</strong> Trans-Alaska Pipeline along withincreased conservation programs appear to be <strong>the</strong>most reasonable methods if it can be demonstratedthat <strong>the</strong> need <strong>for</strong> additional electrical powersources ex is ts.1. COiTr.ient Noted1. Based upon current in<strong>for</strong>mation th t' t 'are <strong>the</strong> best available' Ho • \ e~ lma ,ed future energy requlrementsfuture dem<strong>and</strong> COuld be'eith~~v~~'h~r ~s ~ulte Possib~e that <strong>the</strong> actualhappens versus What is prOjected~ rower dependlng on what actually
-2-'2. Most of <strong>the</strong> State 1 <strong>and</strong> encompass i ng <strong>the</strong> project atAllison Lake is classified Watershed under <strong>the</strong> StateClassification system. This area was identified asan alternative source of water <strong>for</strong> <strong>the</strong> City of <strong>Valdez</strong>."3. The t~ansmission line now under construction by<strong>Copper</strong> Valley Electric Association was finallypermitted following widespread controversy <strong>and</strong> wassubject to numerous stipulations pertainina toenvironmental impact. Would this line as it isnow being constructed be sufficient to h<strong>and</strong>le <strong>the</strong>additional power to be generated by <strong>the</strong>se additionalsources, or would it have to be upgraded or alteredin any way?"4. It apPears that <strong>the</strong>re would be a significant impacton <strong>the</strong> fisheries resource th~t utilizes this stream.This aspect of <strong>the</strong> project needs to be more thoroughlyreviewed."5. Installation of a Pressure Reducing Turbine in <strong>the</strong>lrans-Alaska Pipeline <strong>for</strong> electrical powe~ generationshould certainly be taken advantage of <strong>for</strong> <strong>the</strong> reasonsstated in <strong>the</strong> report. In light of <strong>the</strong> potential powerthJt can be developed from this source, a closer lookshould be given to <strong>the</strong> projected popula.tion <strong>and</strong> powerdem<strong>and</strong>s in <strong>the</strong> near future. It is rep~rted that <strong>the</strong>facility being constructed at <strong>Valdez</strong> by Alpetco willgenerate, via gas turbines run by by-products of <strong>the</strong>petro-chemical process, more power than could beconsumed by <strong>the</strong> operation of that facility. There<strong>for</strong>e,during <strong>the</strong> life of that project, no additional electricalpower would be required <strong>for</strong> its operation. Giventhat <strong>the</strong> Alpetco facility as well as much of <strong>the</strong>o<strong>the</strong>r development in this area is based on <strong>the</strong>existence of <strong>the</strong> Trans-Alaska Pipeline, <strong>and</strong> given<strong>the</strong> finite amount of oil available <strong>for</strong> transportthrough <strong>the</strong> pipeline, it follows that after <strong>the</strong> oilis depleted, such facilities as Alpetco <strong>and</strong> <strong>the</strong>Pipeline Terminal will no longer exist to support <strong>the</strong>populations of this area. It is conceivable thatelectrical power requirements will decrease ra<strong>the</strong>rthan increase as projected."6. The location of <strong>the</strong> power tunnel <strong>and</strong> appurtenances<strong>for</strong> <strong>the</strong> Allison Lake Project is within an active faultzone identified during pipeline construction. Hasthis been taken into account in <strong>the</strong> design of thisproject?2. If <strong>the</strong> water from Allison Creek were needed at a future date Dy <strong>the</strong> cityof <strong>Valdez</strong>, it would be possible to extract it from <strong>the</strong> tailrace.3. Tnf power line between <strong>Valdez</strong> <strong>and</strong> Glennallen would be a6~q~ate <strong>for</strong>transmitting power from <strong>the</strong> proposed projects without rurtner upgrading.4. The Alaska District will per<strong>for</strong>m physical <strong>and</strong> biological studies during<strong>the</strong> Advanced Engineering <strong>and</strong> Design (AE&D) p~ase when a thorOllgh analysisof <strong>the</strong> fishe~ies impacts will be accomplished.5. It is possible that <strong>the</strong> energy dem<strong>and</strong> <strong>for</strong> <strong>the</strong> study area would decreaseafter <strong>the</strong> oil is depleted; however, it is doubtful that ~em<strong>and</strong> would fallto present levels when considering increases in o<strong>the</strong>r business activitiesin <strong>the</strong> study area such as <strong>the</strong> port expansion. Even if dem<strong>and</strong> did fall to<strong>the</strong> current level, <strong>the</strong> output from <strong>the</strong> Solomon Gulch hydroelectric projectwould be exceeded, <strong>for</strong>cing <strong>the</strong> study area to once again depenq on dieselgeneration as a primary source of power. Also, with construcUion of a newoil refinary in <strong>Valdez</strong>, it is likely that oil would be brough~ in fromelsewhere ra<strong>the</strong>r than allow <strong>the</strong> refinary to lie idle after ju~t a fewyears of operation.6. The fault zone has been taken into account in <strong>the</strong> feasibility study.Additional detailed geotechnical work will be undertaken during <strong>the</strong>Advanced Engineering <strong>and</strong> Design Phase to identify specific problem areas.To date, <strong>the</strong> primary problem is with tsunamis ra<strong>the</strong>r than rupturedbedrock. Because of this, <strong>the</strong> powerhouse is located at +100 feet MLLW.Appendix G, Foundations <strong>and</strong> Materials includes additional in<strong>for</strong>mation.
-3-"while <strong>the</strong>re is a significant amount of inTermation provided in<strong>the</strong> DEIS, <strong>and</strong> from a cost/benefit point of view it has beenshown .that <strong>the</strong> Allison Lake Project along with <strong>the</strong> installationof a PRT in <strong>the</strong> lrans-hlaska Pipeline appears to be <strong>the</strong> mostfeasible, some basic questions as discussed snould be addressedin future planning <strong>for</strong> <strong>the</strong> <strong>Copper</strong> <strong>River</strong> <strong>Basin</strong>."The Department of Fish <strong>and</strong> Game (DF&G) commented:"The Alaska Department of Fish <strong>and</strong> Game has reviewed <strong>the</strong>referenced draft feasibility report <strong>and</strong> Environmental ImpactStatement (EIS).7."In aeneral, we feel <strong>the</strong> report <strong>and</strong> EIS provide anadequate description of <strong>the</strong> proposed project, potentialenvironmental impacts <strong>and</strong> mitigation measures."Our biggest concern relates to <strong>the</strong> potential impacts on<strong>the</strong> anadromous fisheries resources in Allison Creek. Whilewe have no objection to <strong>the</strong> project as proposed thisDepartment will require measures to mitigate conflicts.We support <strong>the</strong> concept of <strong>the</strong> U.S. Fish <strong>and</strong> WildlifeService recommendations; however, we feel <strong>the</strong> additionalstudies described in both <strong>the</strong> Coordination Act Report (page17) <strong>and</strong> <strong>the</strong> [IS (page EIS-16) should be conducted be<strong>for</strong>e anyspecific recommendation on mitigation is made. TheDepartment of Fish <strong>and</strong> Game desires to participate inboth <strong>the</strong> scoping <strong>and</strong> actual conduct of <strong>the</strong> studies whichshould be accomplished during <strong>the</strong> ad~anced engineering <strong>and</strong>design phase of <strong>the</strong> project."This comment was received from <strong>the</strong> Office of Coastal Management:8. "The Office of Coastal Management (OCM) has reviewed <strong>the</strong>'<strong>Electrical</strong> <strong>Power</strong> <strong>for</strong> <strong>Valdez</strong> <strong>and</strong> <strong>the</strong> <strong>Copper</strong> <strong>Basin</strong>' DraftFeasibility Report <strong>and</strong> Environmental Statement (State 1.0.No. 80101501; COE No. 800930). OCM has no comments at thistime concerning <strong>the</strong> consistency of this project with <strong>the</strong>Alaska Coastal Management Program (AC~'P). Reviewing agencieshave not brought up any major ACMP-related issues in<strong>the</strong>ir review. OCM will issue a consistency determinationwhen <strong>the</strong> Final Environmental Impact Statement is submittedto DPDP <strong>for</strong> review."7. Refer to answer Number I to <strong>the</strong> Alaska Department of Fish & Game.8. Comment Noted//
-~-The SCH has no objection to this proposal; however, DF&G an~ DNR havespecific concerns which should be addressed as fur<strong>the</strong>r studles areconducted. we would like to rec:orrmend that <strong>the</strong> COE coordinates futurestudies <strong>and</strong> planning with DNR <strong>and</strong> DF&G prior to completion of <strong>the</strong> FinalEnvironmental Impact Statement (FEIS).when <strong>the</strong> FEIS is submitted to <strong>the</strong> SCH, it will be placed in review <strong>for</strong>consistency with <strong>the</strong> Alaskan Coastal Management Program (ACMP) <strong>and</strong> <strong>for</strong>final A-95 review.Thank you <strong>for</strong> your cooperation with <strong>the</strong> review process. 1.cc:Commissioner Skoog, DF>orn Barnes, OCMRob Ridgway, City of <strong>Valdez</strong>L.A. Dutton, DNRBruce Barrett, DF&GSincerely, 1J,~kL~Mi\hael Whitehead .State-Federal Coordinator9. Tne Corps will work closely with <strong>the</strong> Departments of Fish an: ~ame <strong>and</strong>Natural Resources during <strong>the</strong> Aovancea Engineering <strong>and</strong> Desi~' ~hase of <strong>the</strong>Project. At tnat point <strong>the</strong> specific detailed studies neces!!py will be.conoucted to refine <strong>the</strong> project design <strong>and</strong> mitigative plan.
.. '-.' :,~'- .~.:/~·23j;
ALASKA POWER AUTHORITY333 WEST 4th AVENUE - SUITE 31 - ANCHORAGE, ALASKA 99501Phone: (907) 277-7641(907) 276-2715February 25, <strong>1981</strong>Colonel Lee R. NunnAlaska District EngineerU. S. Army Corps of EngineersPost Office Box 7002Anchorage, Alaska 99510Dear Colonel Nunn:The Alaska <strong>Power</strong> Authority would support state funding of 10% of <strong>the</strong>costs of construction of <strong>the</strong> Allison Creek Hydroelectric Project near<strong>Valdez</strong>, Alaska if <strong>the</strong> project is determined to be feasible <strong>and</strong> <strong>the</strong> bestfuture source of power <strong>for</strong> <strong>the</strong> market area. As you know, <strong>the</strong> State ofAlaska is currently completing feasibility studies of Susitna <strong>and</strong> a Railbelttransmission line, <strong>and</strong> ei<strong>the</strong>r <strong>the</strong> <strong>Copper</strong> Valley Electric Associationor <strong>the</strong> City of <strong>Valdez</strong> may install a pressure reducing turpine on <strong>the</strong>Alyeska oil pipeline. There<strong>for</strong>e, <strong>the</strong> definite decision to proceed withdevelopment of Allison Creek should await decisions on <strong>the</strong>se projects <strong>and</strong>refinement of dem<strong>and</strong> <strong>for</strong>ecasts in <strong>the</strong> market area.State funding participation in <strong>the</strong> project would require legislativeappropriation once a clear decision can be made. With this in mind, Iwill request that Governor Hammond prepare a letter of support <strong>for</strong> continuedfield investigations <strong>and</strong> preparation of a General Design Memor<strong>and</strong>um<strong>for</strong> Allison Creek, with <strong>the</strong> underst<strong>and</strong>ing that State funding of a portionof construction costs must be delayed until o<strong>the</strong>r studies are completed<strong>and</strong> <strong>the</strong> need <strong>for</strong> <strong>the</strong> project becomes more definite.cc:Governor HammondSincerely,cc..~.\J~Eric P. Yould "\Executive Director