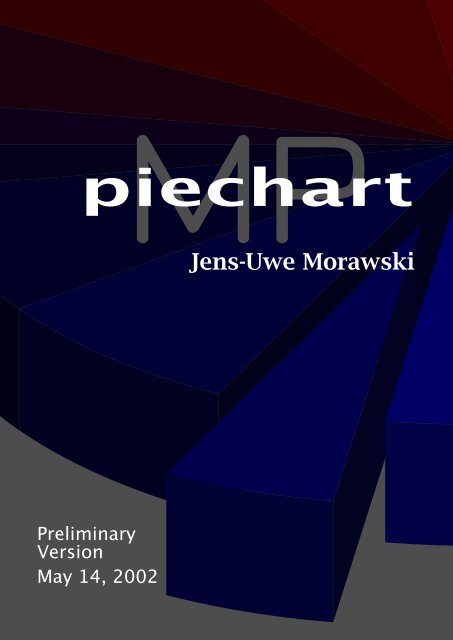
piechartMP Manual
piechartMP Manual
piechartMP Manual

You also want an ePaper? Increase the reach of your titles
YUMPU automatically turns print PDFs into web optimized ePapers that Google loves.
1 Getting started1 Getting startedIn order to draw your first pie-chart you have to write an input-file for METAPOST; herecalled pcfirst.mp. Then you can start METAPOST; this will convert your input in a META-POST graphic. In order to pre-view your pie-chart, you have to embed the graphic into adocument, since only in this way labels and other text-elements will show up correctly.An easy way for the preview is the MPtoPDF converter, see section 5.2.Let’s start with a simple input file. The colored lines are <strong>piechartMP</strong> commands, theothers are plain METAPOST.input piechartmp ;SetupPercent(this, "%") ;DefinePattern(1, 1, blue, red, (8mm, 2pt)) ;Segment( 32.5, "first" , 1 ) ;Segment( 12.8, "second" , auto ) ;Segment( 22.4, "third" , (0,0.7,0.7) ) ;Segment( 18.2, "fourth" , auto ) ;SegmentState(2, hidden, this) ;beginfig(1);PieChart(3cm, 0.1, 65, 0, 0);Label(0)(percent)(inwards,0) withcolor white;Label.auto(0)(name)(outwards,0) ;endfig;endNow you can convert this file using METAPOST. The program-name mpost can be differentat some systems, e.g. mp or metapost.mpost pcfirstThe result is a METAPOST-graphic in the file pcfirst.1. Depending on the T E X macropackage you are using, the graphic can now be embedded in your document. In a L A T E Xdocument using the graphicx package it is simply:\includegraphics{pcfirst.1}When you use pdfL A T E X the file-extension .1 is not known to the graphicx package.\DeclareGraphicsRule{*}{mps}{*}{}in the preamble of your L A T E X document declares all unknown extension to be METAPOSTgraphics.You should get the graphic shown in figure 1. If you try it yourself you will find differentfonts in your chart compared to this chart , since here the fonts of this document are used.How you can change fonts and font attributes will be discussed in an extra section.As you can see the input file loads first the <strong>piechartMP</strong> module using input. Thereuponfollows code one would call setup section. Here you can modify defaults withSetup... commands or define fill-patterns with DefinePattern.Next the segments are declared. The segments are numbered according to the orderof their declaration. In the example four segments have been declared. The following4
1 Getting started44%firstthird31% 25%Figure 1: The first pie-chartfourthSegmentState(2, ...) modifies the state of the 2 nd segment, making it hidden. Thismeans that the segment will be ignored when you draw the chart or labels.Between beginfig and endfig the drawing and labeling commands follow. Everybeginfig-endfig group creates one graphic. This can be used in order to create multiplegraphics sharing the same segment data.If you extend the initial example with another graphics-group, this will give two META-POST graphics pcfirst.1 and pcfirst.2. The graphics can be seen in figure 2.input piechartmp;SetupPercent(this, "%");DefinePattern(1, 1, blue, red, (8mm, 2pt)) ;Segment( 32.5, "first" , 1 ) ;Segment( 12.8, "second" , auto ) ;Segment( 22.4, "third" , (0,0.7,0.7) ) ;Segment( 18.2, "fourth" , auto ) ;SegmentState(2, hidden, this) ;beginfig(1);PieChart(3cm, 0.1, 65, 0, 0);Label(0)(percent)(inwards,0) withcolor white;Label.auto(0)(name)(outwards,0) ;endfig;SegmentState(2, normal, this) ;SegmentState(4, invisible, this) ;beginfig(2);PieChart(3cm, 0.1, 65, 0, 0);Label(0)(name)(inwards,0) withcolor white;endfig;endIn the following sections all <strong>piechartMP</strong> commands will be introduced. The examplessometimes include commands which still are unknown to you. Please refer to followingsections when necessary.5
2 Basic CommandsFigure 3: Automatic color specification1...X the numeric ID of an already defined pattern, see 4.1red, blue... one of the default METAPOST colors(R,G,B) a color specification in the Red-Green-Blue color spaceauto depending on the position of the segment in the chart<strong>piechartMP</strong> calculates the color, see figure 3. The appearancecan be modified with SetupColors, see section3.2AltValue [Type: string] an alternate Value that is used when the segment-value is displayedin label-commands.Compared to other <strong>piechartMP</strong> commands the Segment command has not a fixednumber of parameters. At least the Value has to be specified. All other parameters canbe omitted if the parameter is the most right in the parameter order. An omitted AltValueparameter is substituted by the Value converted in a text string. An ommited FillStyle issubstituted by auto and if the Name is ommited too, then the segment name is a stringincluding the segment number.If one of the following declarations is the third Segment command, then all declarationsare equivalent:Segment(32.5, "3", auto, "32.5") ;Segment(32.5, "3", auto) ;Segment(32.5, "3") ;Segment(32.5) ;But even it means that when the parameter AltValue has to be specified, then the parametersName and FillStyle cannot be omitted; or if you want specify the FillStyle thenthe Name has to be given too.2.1.2 Segment StatesChart segments can have three different states. The main purpose is to support differentappearances of one set of segment data in one input file. This can be used in order to builda chart segment by segment in a presentation or emphasize one segment via displacementin one but not in the following chart.7
2 Basic CommandsSegmentState(SegmentID,State,Offset)SegmentID [Type: numeric] this parameter is the identifier of the segment you wantchange the state. As you already know the identifier depends on the declarationorder, thus for example you have to give here the value 2 to change the state of thesegment declared as second.State [Type: numeric] one of the three supported statesnormalinvisiblehiddenthissegment is visiblesegment is not visible, but space is inserted instead whenPieChart draws the chartsegment will be ignoredif you want change the Offset but not StateOffset [Type: numeric] this parameter specifies the radial displacement of a segment.The displacement depends in this parameter and the radius of the chart. A value of0 means no displacement and a value of 1 means that the segment is shifted radialthe full radius of the chart.0 no displacement1 full radial displacementX any other displacement factorthis if you want change the State but not OffsetThe value of Offset will be added to the global offset, specified in PieChart, thusyou can use a global offset and using a negative segment Offset you can reset thedisplacement for a segment.input piechartmp ;SetupColors( (0.7,0.7), this, this) ;Segment( 52.234, "first" , auto, "52234") ;Segment( 8.5 , "second", auto, "8500") ;Segment(101.111, "third" , auto, "101111") ;Segment( 20.222, "fourth", auto, "approx. 20000") ;SegmentState(2, invisible, this) ;SegmentState(4, this, 0.3) ;beginfig(1);PieChart(4cm, 0.15, 60, 0, 0) ;Label.auto(0)(value)(outwards,0) ;endfig;end8
2 Basic Commands52234101111approx. 200002.2 Drawing Chart and LabelsThe commands which create real output are only two. The first mentioned PieChart hasto be the first drawing command in a beginfig-endfig-group, since it performs someimportant setup and calculations for the following label commands.2.2.1 Drawing the Pie-ChartPieChart(Radius,Height,Observation,Rotation,Offset)Radius [Type: numeric] That parameter specifies the radius of the pie-chart.2cmXdraws a pie-chart with radius 2 cmany other valid METAPOST numeric expressionHeight [Type: numeric] The height or thickness of the pie-chart can be specified with thisparameter. In contrast to Radius the parameter Height does not specify the heightdirectly but moreover the height is the result of the multiplication of Radius andHeight.Observation [Type: numeric] The observation angle in degrees can be specified usingthis parameter.0 minimum value; since the observation on the pie-chart isfrom above, this results in a simple 2D-chart1...89 draws the pie-chart in 3D-parallel-projection; 89 is maximumvalueRotation [Type: numeric] The angle of rotation around the center of the pie-chart.0...359 any numeric value in that rangeOffset [Type: numeric] The third parameter of the command SegmentState specifies theradial displacement for a single segment. Using Offset in the PieChart command anoffset is applied for all segments.0 no displacement1 full radial displacementX any other displacement factor9
2 Basic Commandswill result for a segment with name first and a percent-value of 22.5 to the stringfirst; \textbf{22.5\,\%}before the whole string will be typeset. For this special example you have to switchin L A T E X text mode, see section 3.3.3.SegmentPoint [Type: pair] Specifies the location of the label in a segment-specific systemof co-ordinates. The x-co-ordinate is along the radius of the segment, whereby 0specifies the center and 1 is at the out-side. You can give values greater than 1. They-co-ordinate is along the angle the segment is spawning in the chart. 0 is at beginand 1 is at the end of the segment. For the y-co-ordinate only values in range 0 upto1 are allowed. Figure 4 illustrates the co-ordinate system.(X,Y) any valid co-ordinateinwards predefined; equal to (0.7,0.5)outwards predefined; equal to (1.1,0.5)Y 10.25 0.5 0.75 10.750.50.2501.25 1.5XFigure 4: The segment-specific system of co-ordinatesShift [Type: pair, numeric] If you give here a pair, that means a specification like (x,y),the label will not be drawn at the position specified in SegmentPoint, but moreoverat the position of SegmentPoint shifted by the amount of Shift. Additionally a lineis drawn between the SegmentPoint and the shifted SegmentPoint. The line uses thedefinition of defaultpen, thus you can change the linethickness using:pickup pencircle scaled 2ptin order to set the thickness to 2 pt.0 this value disables the shifting and the line(0,0) this results in no shift, but it draws a line of length 0(0,-1cm) shifts the position 1 cm down(-5mm,1cm) shifts the position 1 cm up and 5 mm left(x,y) any other valid METAPOST pairThat feature is mainly implemented in order to label small segments, which give notenough space for labels.11
2 Basic CommandsIf you use the Label command the way as mentioned before all labels will be drawncentered at the point. In order to align the label an extended definition has to be used.Label.Alignment(Segments)(Data)(SegmentPoint,Shift)Alignment specifies the alignment of the label. You can use the well known METAPOSTalignments top, bot, lft, rt, llft, lrt, ulft and urt or the alignment auto, whichenables <strong>piechartMP</strong> to calculate a placement according to the specific situation.top, bot, ... one of the default METAPOST alignments, see figure 5auto some magiculft top urtlft • rtllft bot lrtFigure 5: Default METAPOST alignmentsinput piechartmp ;SetupColors((.7, .7),this, this) ;SetupName("the ", " segment") ;SetupPercent( this, " %") ;Segment( 50, "first" ) ;Segment( 30, "second") ;Segment( 10, "third" ) ;Segment( 20, "fourth") ;Segment( 20, "fifth" ) ;SegmentState(4, this, 0.3) ;beginfig(1);PieChart(4cm, 0.15, 60, 0, 0) ;Label.auto(0)(name)(outwards,0) ;Label(3,4,5)(value)(inwards,0) withcolor white;Label(1,2)(percent)(inwards,0) withcolor (1,1,0);Label.lrt(4)("a segment with ",percent)( (0.9,0.8), (2cm,-1cm) )withcolor 0.8red ;pickup pencircle scaled 2pt ;Label.auto(1)("a green label")( (0.9,0.1), (2cm,1.5cm) )withcolor 0.8green ;endfig;end12
3 <strong>piechartMP</strong> Setupthe first segmenta green label38 %the second segment23 %the third segment102020the fifth segmentthe fourth segmenta segment with 15 %3 <strong>piechartMP</strong> SetupThis section introduces the setup commands of the <strong>piechartMP</strong>-module. All setupcommands configure more than one property. Since you should not be forced to knowthe current value, all setup commands support the value this, which can be given forproperties that shall be unmodified.3.1 NumbersSetupNumbers(precision,delimiter)precision [Type: numeric] this parameter allows to set the precision of calculated percentvalues-1 value is not rounded0...3 rounds at given precision; 0 is defaultthis current valuedelimiter [Type: string] the representation of numbers is different between languages;here you can give your decimal delimiter"." default"," german users might like this"?" any other string of length 1this current valueNormally, all setup commands can be placed at any position in the input file and modifythe behaviour of the following commands. In contrast, the specification of the decimaldelimiter has to be set before you declare segments using the Segment command.13
3 <strong>piechartMP</strong> Setupfill color0side colormaxV= 0.4reducesaturation0 reduce 1valuemaxS= 0.61factor= 0.4Figure 6: Shading process of side-colors3.2 ColorsSetupColors(auto-SV,shading-SV,grayscale)auto-SV [Type: pair] if you set the fill style of segments, you can say auto. This willcalculate a fill color for the segment using the HSV color model. The Hue (H) is takenfrom the position of the segment in the chart, the values of saturation (S) and value(V) you can set here.(1,1) the default(S,V) any other combination of saturation and value; S and V arebetween 0 and 1this current valueshading-SV [Type: pair] when <strong>piechartMP</strong> draws the side areas of segments in 3Dmode, it calculates the colors in a 2-step process. Depending on the observationangle at a side a factor is calculated. In the first step the saturation of the fill coloris reduced depending on the factor, but only upto a maximum value. In the secondstep the resulting color is darkened depending also on the factor but again only uptoan maximum value. These both maximum values you can set here. A value of 0means in both cases no change of the color, that is useless. A saturation maximumof 1 allows colors become gray. A value maximum of 1 allows colors become black.Figure 6 illustrates the color conversion.(0.4,0.3) the default(maxS,maxV) any other combination of maximum reduction values;maxS and maxV are between 0 and 1this current valuegrayscale [Type: boolean] all colors calculated and used for segment-fills can be switchedin grayscale mode. This may help to see if the contrast for grayscale printing is sufficient.false no grayscale colors; defaulttrue grayscale colorsthis current value14
3 <strong>piechartMP</strong> SetupdefaultSetupColors((.4,.6), this, this)SetupColors(this, (.6,.7), this)SetupColors(this, this, true)Figure 7: Examples of different color settingsIn figure 7 you can see some examples outgoing from the segment definitions in theintroduction. Here all segments are in normal state.3.3 Text3.3.1 Metapost TypesettingBefore the text setup is discussed some words about METAPOST typesetting capabilitiesare needed. METAPOST knows two ways of typesetting text; both shall be illustrated onthe METAPOST command label.label ("this is the text", origin) ;That command writes this is the text at a position in the graphic, here it is the origin(0,0). This way has the disadvantage that you cannot modify text attributes of the text.You can only modify the font of the whole text and its size. Therefore you must set theMETAPOST variables defaultfont and defaultscale. For example:defaultfont:="ptmr8r" ; defaultscale:=1.2 ;label ("this is the text", origin) ;typesets the text in Times-Roman at 1.2 of the default size. Since the default size is inmost cases 10 pt it will be 12 pt. The font name ptmr8r is the name of the Times-Romantfm-file. Here the filename according to the Karl Berry naming-scheme was used.As you will see, this way has some advantages. It is fast and the text string can beconcatenated from multiple strings, which is required for <strong>piechartMP</strong>.The second way uses T E X in an external process, thus you can use T E X-commands insidethe text.label (btex this is $\sin{x}$ etex, origin) ;15
3 <strong>piechartMP</strong> SetupThe main disadvantage is that it is impossible to expand a variable between btex ...etex, that means strings can not be concatenated.One advantage is the enhanced typesetting capabilities, an other useful property is tosend T E X configurations to the external process.verbatimtex\documentclass{article}\begin{document}etexlabel ( btex this is \textbf{bold} text etex , origin) ;sends a L A T E X header to the T E X process. If you now configure METAPOST to use L A T E Xinstead of T E X you can use L A T E X commands.In general to setup METAPOST for L A T E X an environment variable with name TEX must beset to latex. On a system with Bash shell this would be:export TEX=latexSome METAPOST version or T E X-systems support the definition of the T E X-format in theinput file.verbatimtex%&latex\documentclass{article}\begin{document}etexlabel ( btex this is \textbf{bold} text etex , origin) ;This will use L A T E X without the need to set the environment variable. Not all systemssupport this, but it should work on the systems 1 teT E X, fpT E X, MikT E X, OzT E X and CMacT E X.Systems not supporting this feature are emT E X, DECUS-T E X and VT E X. The last mentionedVT E X has no METAPOST included, thus you have to take METAPOST from another system.The specification of the T E X-format shall be called TeXFormat and the following settingsin the verbatimtex...etex block shall be called TeXSettings.3.3.2 Extended Typesetting Capabilities<strong>piechartMP</strong> requires that text-strings can be concatenated from multiple strings. Thisis no problem with the in the previous section first mentioned string-based typesetting.But there is still a problem with T E X-based typesetting, since everything between btexetex is typeset directly and a string-variable containing a concataneted string can not beexpanded.The only solution is to write an external file including a verbatimtex...etex blockand the btex etex typesetting commands, since in this step everything is only a stringfor METAPOST. This file can be input again and results in the typeset text. Since everyMETAPOST input file has its own verbatimtex...etex block, the block of your input-filecan not be used, and you have to give your settings <strong>piechartMP</strong>, thereby <strong>piechartMP</strong>can write your settings in the external file.1 Thanks to Martin Buchmann, Jürgen Göbel, Rolf Niepraschk, Henning Hraban Ramm and Walter Schmidt, whomade up that list.16
3 <strong>piechartMP</strong> SetupSuppose a command called TeXText which takes a string as argument. Furthermorethere are two string variables TeXFormat and TeXSettings. The command takes thesethree strings in order to write an external file, inputs the file again and returns the typesettext.TeXFormat := "%&latex"TeXSettings := "\documentclass{article}\begin{document}"label ( TeXText("this is \textbf{bold} text") , origin) ;The external file based on this METAPOST code will look like this:verbatimtex%&latex\documentclass{article}\begin{document}etexbtex this is \textbf{bold} text etexAs you can see this corresponds with the code where btex ... etex are used in thelabel command. Now it is possible to concatenate the text from multiple strings, sincethe text including the T E X commands is for METAPOST only a simple string. But it has adisadvantage: it is very slow!3.3.3 <strong>piechartMP</strong> Text SetupNot all chart labels need advanced typesetting features. Therefore <strong>piechartMP</strong> supportsin general two ways of typesetting labels: the first mentioned string-based and the lastmentioned external way.SetupText(Mode,TeXFormat,TeXSettings)Mode [Type: numeric] this parameter sets which way of typesetting <strong>piechartMP</strong> utilizes0 string based typesetting; default1 external T E X based typesetting; a verbatimtex...etexblock is written using TeXFormat and TeXSettings2 the same as 1 but \documentclass{minimal} and\begin{document} are written in the external file automatically3 the same as 2 but TeXFormat defaults to %&latex; see section3.3.1 for a list of systems supporting this format setupthis the current valueATTENTION: using T E X based text modes can damage data, since in these modesan external file with name .pct will be created. Here isthe name of your input file without extension. In case of the file name used inthe introduction the external file will have the name pcfirst.pct.TeXFormat [Type: string] the T E X format string to be written on top in the externalverbatimtex block.17
3 <strong>piechartMP</strong> Setup"" empty string; default"%&latex" some systems support this"?????" any other string, depending on your systemthis the current valueTeXSettings [Type: string] a string including T E X commands which will be written afterthe T E X format in the external file."" empty string; default"?????" any string including T E X and L A T E Xpreamble commandsthis the current valueIf you set the text mode to 0 the string based typesetting is active. That means youcannot use T E X commands in the strings. You have only the posibility to change the fontand its size using the METAPOST variables defaultfont and defaultscale.Text mode 1 is the most general setting. Here you have the full control and you can doanything required for your system.Text mode 2 gives you control over the T E X format as mode 1, but it saves you fromthe L A T E X specification, since it loads a minimal L A T E X setup. This does not mean that theparameter TeXSettings is useless, since the content of this parameter is written between\documentclass and \begin{document}.Suppose the setup:SetupText(2, "%&latex", "\usepackage[latin1]{inputenc}")The verbatimtex block written based on these settings will be:verbatimtex%&latex\documentclass{minimal}\usepackage[latin1]{inputenc}\begin{document}etexIf you need more packages or in general a long setup it makes no sence to give all in theparameter TeXSettings. It is easier to write everything in an extra T E X file and input them.If you need for example Latin-1 input encoding, the labels shall be written in Times andyou need some symbols from Martin Vogel’s symbol font, you can write this T E X file namedpcset.tex:\usepackage[latin1]{inputenc}\usepackage{times}\usepackage{marvosym}and use the following <strong>piechartMP</strong> text setup:SetupText(2, "%&latex", "\input{pcset}")The following descriptions of the label setup commands correspond to the text setup,therefore examples can be found in section 3.4.23.4 Labels18
3 <strong>piechartMP</strong> Setup3.4.1 Label SetupThe <strong>piechartMP</strong> module knows three label types: segment names, segment values andpercent values. Segment names and values are declared using Segment and the percentvalue is calculated by <strong>piechartMP</strong>.The purpose of the label setup commands is to specify strings that will be attachedbefore and after the data string prior to the whole string will be typeset.SetupPercent(PreString,PostString)PreString [Type: string] a string attached before the string of the percent value"" empty string; default"?????" any stringthis the current valuePostString [Type: string] a string attached after the string of the percent value"" empty string; default"?????" any stringthis the current valueFor example you can use this in order to append a percent unit to the percent value. Intext mode 0 the setup is:SetupPercent(this, " %")But take care of text modes. In text modes using T E X this setup uses the commentsymbol. In case of a T E X based text mode the setup has to be:SetupPercent(this, " \%")or if want the percent value to be typeset bold-italic in L A T E X mode:SetupPercent("\textbf{\itshape ", "\,\%}")SetupValue(PreString,PostString)PreString [Type: string] a string attached before the string of the segment value"" empty string; default"?????" any stringthis the current valuePostString [Type: string] a string attached after the string of the segment value"" empty string; default"?????" any stringthis the current valueAn example could be that the unit of the segment values is million Euro and you want thecurrency symbol from the L A T E X marvosym package 2 .2 take care that the package is loaded via TeXSettings of the SetupText command19
3 <strong>piechartMP</strong> SetupSetupValue( this, " million \EUR")SetupName(PreString,PostString)PreString [Type: string] a string attached before the string of the segment name"" empty string; default"?????" any stringthis the current valuePostString [Type: string] a string attached after the string of the segment name"" empty string; default"?????" any stringthis the current value3.4.2 Label and Text Setup ExamplesIn both examples a T E X or more concrete L A T E X input file will be used. This file has thefollowing contents, its name is for example timessym.tex. The purpose of the \Ordmacro is to typeset correct ordinal numbers.\usepackage{times}\usepackage{marvosym}\newcommand*{\Ord}[1]{%\ifcase #1\relax%#1\textsuperscript{th}%\or%#1\textsuperscript{st}%\or%#1\textsuperscript{nd}%\or%#1\textsuperscript{rd}%\else%#1\textsuperscript{th}%\fi}A Basic Chart As usual, in the METAPOST input file first the <strong>piechartMP</strong> module isloaded. The font for text in text mode 0 is set by assigning the name of the Times-BoldItalic metric-file to the METAPOST variable defaultfont. Next the precision of thepercent values is set to 1 and the decimal delimiter to ,, which is more useful for germanpeople. The fourth statement appends the % symbol on the percent value, since the unitshould be displayed too. As you will see the percent values will be typeset in text mode 0,thus a real % symbol is used and not the T E X command \%.input piechartmp;defaultfont := "ptmbi8r" ;SetupNumbers(1, ",") ;SetupPercent(this, " %") ;20
3 <strong>piechartMP</strong> SetupNext four segments are declared. The segment names are not specified, thus they defaultto the segment number.Segment(32.5) ;Segment(12.8) ;Segment(22.4) ;Segment(18.2) ;Starting the first figure, the first task is always to draw the pie-chart with PieChart.Since the text mode is still 0, that means string based typesetting, the percent values(Label(..)(percent)(...)) will be typeset in the font declared by defaultfont.beginfig(1);PieChart(4cm, 0.1, 65, 0, 0);Label(0)(percent)(inwards,0) ;Now the L A T E X text mode becomes active. You see, the Setup... commands can beplaced anywhere, and modify the behaviour starting from this moment. The commandSetupName declares the string to be attached to the segment name, thus prior to typesettingthe name string for example of the first segment is: the \Ord{1} segment. InSetupName the \Ord command from the L A T E X file is used, thus the name labels have to betypeset in L A T E X mode.SetupText (3, this, "\input{timessym}") ;SetupName ("the \Ord{", "} segment")Label.auto(0)(name)(outwards,0) ;endfig;The command Label(0)(name)(...) draws the name labels for all segments. Theresult is the following figure.the 1 st segmentthe 2 nd segment14,9 %37,8 %the 3 rd segment26,1 %21,2 %the 4 th segmentThe second figure starts as usual. Since the L A T E X text mode is still active all typesettingwill be done in this mode. In the chart the segment values shall be printed. Supposethese values are in unit million Euro, the SetupValue command declares the unit to beattached to the value string. Furthermore L A T E X font commands modify the appearanceof the text, in order to make them bold-italic. Since the Times font is used here too(\usepackage{times} in the L A T E X file), the font of the value labels is the same as ofthe percent labels in the previous graphic.beginfig(2);PieChart(4cm, 0.1, 65, 0, 0);SetupValue ( "\textbf{\itshape ", " million} \EUR") ;Label(0)(value)(inwards,0) ;Label.auto(0)(name)(outwards,0) ;endfig;21
3 <strong>piechartMP</strong> Setupthe 1 st segmentthe 2 nd segment12,8 million ¤32,5 million ¤the 3 rd segment22,4 million ¤18,2 million ¤the 4 th segmentAn Advanced Example One thing not mentioned before is that in the T E X commandsonly commands can be used which do not need T E X specials. Since, for example, coloris not supported by the T E X DVI-format, this is implemented driver specific using T E Xspecials. Here an example shall be given where in the text the color changes, in particularthe ordinal numbers of the previous figure shall be appear in red.The first part is equal to the previous figure.beginfig(3);PieChart(4cm, 0.1, 65, 0, 0);SetupValue ( "\textbf{\itshape ", " million} \EUR") ;Label(0)(value)(inwards,0) ;Next the segment name is setup again. Here the basic segment name is enclosed inthe T E X \phantom command. This command does not typeset the T E X code but insertsappropriate space, therefore in this step the command Label(..)(name)(...) typesetthe label with the ordinal number replaced by space.SetupName ("the \phantom{\Ord{", "}} segment") ;Label.auto(0)(name)(outwards,0) ;In the second step the name label is setup again, but here the other parts of the declarationare enclosed in the \phantom command, thus only the ordinal number will be printedout. Using withcolor red, the label is typeset in red.SetupName ("\phantom{the} \Ord{", "} \phantom{segment}") ;Label.auto(0)(name)(outwards,0) withcolor red ;endfig;endthe1 stsegmentthesegment12,8 million ¤32,5 million ¤2 nd 3 rd 4 th22,4 million ¤18,2 million ¤thesegmentthesegment22
4 Fill Patterns4 Fill Patterns4.1 Defining PatternsSegments can be filled in two major modes: solid color or pattern fill. Both modes havetwo minor modes: direct-color and auto-color. Direct-color means that the user specifiesthe color, auto-color lets <strong>piechartMP</strong> calculate the colors. Patterns have to be definedbefore they can be used in the segment declaration Segment.DefinePattern(ID,Method,FillColor,PatternColor,Dimen)ID [Type: numeric] this parameter is the unique identifier of the pattern. The best way isto number all patterns starting from 1.1...Xnumeric identifierMethod [Type: numeric] this parameter specifies which pattern method shall be used todraw the pattern. You can choose between 10 basic methods and can define oneprivate method (see 4.2).0 private method1...10 basic methods; see figure 81 2 3 4 56 7 8 9 10Figure 8: Basic pattern-fill methodsFillColor [Type: color] the color used to draw the pattern background. It is the maincolor of the segment.auto <strong>piechartMP</strong> calculates the color for youred, blue... one of the predefined METAPOST colors; these can be usedmultiplied with a factor: 0.4*red in order to get dark-red(R,G,B) a direct color specification in Red-Green-Blue color spacePatternColor [Type: color] the color used to draw the pattern foreground23
4 Fill Patternsautored, blue...(R,G,B)<strong>piechartMP</strong> calculates the color for you; the methodused here is different compared to the FillColor. In mostsituations it should result in a good contrast between foregroundand backgroundone of the predefined METAPOST colors; these can be usedmultiplied with a factor: 0.4*red in order to get dark-reda direct color specification in Red-Green-Blue color spaceDimen [Type: pair] the parameter specifies the spacing (S) between pattern elements andthe linewidth (W); see figure 9 for some examples.(5mm, 2pt) the parameter used in figure 8(S,W) any other combination of spacing and linewidth(7mm,4pt) (1mm,0.2mm) (8mm,6mm) (8mm,3mm) (3mm,1.5mm)Figure 9: Examples of different Dimen parameters4.2 Defining a Private Pattern MethodWhen you set the Method in the DefinePattern command to the value 0, then every time<strong>piechartMP</strong> needs a pattern with this number it calls the macro PrivatePattern.There is already a definition included in <strong>piechartMP</strong> that defaults to the examplegiven below, but with some METAPOST experience you can re-define PrivatePattern inorder to employ a pattern that suits to your needs.The macro has to return a METAPOST picture including the pattern, therefore it has tobe a METAPOST vardef macro. The macro is called with four parameters:PrivatePattern(ULC,LRC,Spacing,Linewidth)The macro has to draw the pattern in a rectangular area. The co-ordinates of the area’supper left corner are the first parameter ULC, LRC is accordingly the lower right corner.The Spacing parameter is the first value of the Dimen parameter in DefinePattern whichshould define the spacing between pattern elements. Linewidth is the second value of theDimen parameter. What you do with this data depends on what you want get, but themacro always has to return a picture element.A prototype of the macro can be:vardef PrivatePattern (expr ulc, lrc, spc, lwd ) =save pic ; picture pic ; pic := nullpicture ;...picenddef;Since you not operate on currentpicture but on an own picture variable, you cannotuse direct drawing commands. Instead of draw or fill you can use addto pic ...,which is described in detail in the METAPOST manual[Hob].24
4 Fill PatternsThe following private pattern method draws a fill pattern based on circles. The input filestarts as usual loading <strong>piechartMP</strong>. Next starts the declaration of the private patternmethod. In contrast to the previous mentioned prototype, here some additional variablesare declared. The variable cntr gets the co-ordinates of the center of the rectangulardrawing-area. The number of circles to draw is saved in c and a path description of thecircle will be saved in k.input piechartmp;vardef PrivatePattern (expr ulc, lrc, spc, lwd ) =save pic, cntr, c, k ;picture pic ; pic := nullpicture ;pair cntr ; numeric c ; path k ;As mentioned before here in the first step the co-ordinates of the center are assigned tocntr and for c is calculated how many circles are needed to fill the whole area.cntr := 0.5*( lrc + ulc ) ;c := ((xpart (ulc - cntr))++(ypart (ulc - cntr))) / spc ;c := floor c ;Next a loop starts, wherein first a circular path is declared which has an appropriateradius depending on spc and the circular path is shifted to the co-ordinates of cntr.Then the path with an appropriate linewidth (lwd) is added to the picture pic.for i=1 upto c:k := fullcircle scaled (i*2*spc) shifted cntr ;addto pic doublepath k withpen pencircle scaled lwd ;endfor;The last step of the macro is returning the picture. The area marked by the both cornerco-ordinates and the content of the picture pic can be seen on the left side in figure 10.picenddef;Now a pattern method 0 can be used.defined.Here two patterns based on this method areDefinePattern(1, 0, blue, red, (5mm, 3mm)) ;DefinePattern(2, 0, auto, white, (3mm, 1pt)) ;The following segment declaration uses these patterns in segments 1 and 3. Drawingthe pie-chart results in figure 10. As you can see the pattern picture is clipped and coloredautomatically.Segment(32.5, "", 1) ; Segment(12.8, "", auto ) ;Segment(22.4, "", 2) ; Segment(18.2, "", red ) ;beginfig(1);PieChart(4cm, 0.1, 65, 0, 0);endfig;end25
5 Special Features5 Special Features5.1 BoundingBox for PresentationsFigure 10: A private pattern methodWhen you want use <strong>piechartMP</strong> for for presentations in order to build charts segmentby segment, you will have the problem that with some segments invisible the graphicshave a different size. This may cause extra work to place the graphics so that they occuralways in the same place on the page. If you declare a numeric variable with the namePiechartBBox before the <strong>piechartMP</strong>-module is loaded, then <strong>piechartMP</strong> adds extracode to fit all figures in the same bounding box. Since <strong>piechartMP</strong> does not know thesize of following figures when it draws the first figure it requires two METAPOST runs for acorrect result. In the first METAPOST run a file with name .pcb will be written,which contains the maximum bounding box of all figures. is the name of yourMETAPOST input file without extension (.mp), thus take care that not an important filewith the same name is in the directory you are running METAPOST. In the second run thisbounding box will be used for all figures.PiechartBBox := 1 ;input piechartmp ;SetupColors((.7, .7),this, this) ;Segment( 50, "first" ) ;Segment( 30, "second") ;Segment( 10, "third" ) ;Segment( 20, "fourth") ;Segment( 20, "fifth") ;for i=2 upto 5:SegmentState(i, invisible, this);endfor;beginfig(1);PieChart(2cm, 0.15, 60, 0, 0) ;Label.auto(0)(name)(outwards,0);endfig;SegmentState(3, normal, this);26
5 Special Featuresbeginfig(2);PieChart(2cm, 0.15, 60, 0, 0) ;Label.auto(0)(name)(outwards,0);endfig;SegmentState(4, normal, this);beginfig(3);PieChart(2cm, 0.15, 60, 0, 0) ;Label.auto(0)(name)(outwards,0);endfig;SegmentState(2, normal, this);beginfig(4);PieChart(2cm, 0.15, 60, 0, 0) ;Label.auto(0)(name)(outwards,0);endfig;SegmentState(3, this, 0.3) ;SegmentState(5, normal, this);beginfig(5);PieChart(2cm, 0.15, 60, 0, 0) ;Label.auto(0)(name)(outwards,0);endfig;endThe resulting figures you can see below. On the left side is the figure for the case whenPiechartBBox was not specified.firstfirstfirstfirstthirdthird27
5 Special Featuresfirstfirstthirdfourththirdfourthfirstfirstsecondsecondthirdfourththirdfourthfirstfirstsecondsecondfifthfifththirdfourththirdfourth5.2 Enhanced Graphics with MetaFunIf you look on a real round 3D object you will see, that the round outside is not a solidcolor. With the help of some other packages <strong>piechartMP</strong> is able to draw the segmentoutsides as gradients, in order to give the chart a more realistic look.Most recent T E X distributions include pdfT E X and ConT E Xt. ConT E Xt includes a META-POST package called MetaFun. That package enables METAPOST, besides many other interestingfeatures, to draw gradients 3 . The package should work out of the box, thus noConT E Xt setup is required, but the gradient-feature only works with pdfT E X.MetaFun writes some special statements in the METAPOST output. This requires an extensionto interpret those specials. The extension is loaded in the ConT E Xt macro packageautomatically, thus ConT E Xt users can embed the figure directly.The L A T E X graphics package does not load that extension. Thus L A T E X users have to go adifferent way. ConT E Xt includes a pdfT E X format called mptopdf . It can be downloadedfrom the ConT E Xt homepage [Con] as a independent package, called MPtoPDF. That formatcan be used stand-alone in order to convert your METAPOST output to PDF. This is eventhe best way to preview your METAPOST figures.Since that pdfT E X format loads the graphics extension resulting PDF-graphics have thesegment’s outside drawn as gradients. Next L A T E X users can include that PDF directly usingpdfL A T E X or convert the PDF back to EPS for the L A T E X-dvips way.<strong>piechartMP</strong> automatically detects MetaFun when the package is loaded prior <strong>piechartMP</strong>.See figure 11 to compare both ways of drawing segment outsides.input metafun;input piechartmp;3 The current version 1.0 of the PDF-Reader XPDF lacks support to display those gradients.28
6 Tips for PresentationsFigure 11: Segment outsides with and without MetaFunSetupColors(this, (.6,.5) , this) ;Segment(7) ; Segment(18) ; Segment(2) ; Segment(5) ;beginfig(1); PieChart(4cm, 0.15, 60, 0, 0) ; endfig;end6 Tips for Presentations6.1 Presentations with minimum effortThe purpose to develop the <strong>piechartMP</strong> package was to be able drawing pie-chartssegment by segment for presentations. With some METAPOST experience this can be donevery easily.The commands PieChart and Label draw segments and labels only for visible segments.That means that you can use the command Label(1,2,5)(...)(...) and whenonly the segments 1 and 5 are visible no label for segment 2 will be drawn.On page 12 you can see a complex pie-chart. Creating multiple figures for a step-by-steppresentation needs some work since many code has to be written.With the explanation above one may have the idea that the beginfig-endfig-block onlyhas to be copied and occasionally SegmentState makes the next segment visible. But, itis easier!PiechartBBox := 1 ;input piechartmp ;SetupColors((.7, .7),this, this) ;SetupName("the ", " segment") ;SetupPercent( this, " %") ;Segment( 50, "first" ) ;Segment( 30, "second") ;Segment( 10, "third" ) ;Segment( 20, "fourth") ;Segment( 20, "fifth") ;29
6 Tips for PresentationsSegmentState(4, this, 0.3) ;The first part is already well known from page 12 where the label alignment has beendiscussed. Next a loop can be used in order to switch all segments in state invisible.for i=1 upto 5:SegmentState(i, invisible, this) ;endfor;Then the whole figure expression preceded by the command that will change the segmentstateto normal has to be packed in a METAPOST command called, for example, MyChart.The command has the parameter s to specify the segment and figure number.def MyChart (expr s) =SegmentState (s, normal, this) ;beginfig(s);PieChart(4cm, 0.15, 60, 0, 0) ;Label.auto(0)(name)(outwards,0) ;Label(3,4,5)(value)(inwards,0) withcolor white;Label(1,2)(percent)(inwards,0) withcolor (1,1,0);Label.lrt(4)("a red label")((0.9,0.8), (2cm,-1cm)) withcolor 0.8red ;pickup pencircle scaled 2pt ;Label.auto(1)("a green label")((0.9,0.1), (2cm,1.5cm)) withcolor 0.8green ;endfig;enddef;The last step is again a loop which ships out five figures, each with one more segmentvisible. Since only segments and labels of visible segments will be drawn you can firstcreate the whole pie-chart and pack it in a METAPOST command. Thus there is no need tobother with appropriate segment-specification in the Label commands.for i=1 upto 5:MyChart(i) ;endfor;end30
6 Tips for Presentationsthe first segmenta green labelthe first segmenta green label38 %38 %the second segment23 %the first segmenta green labelthe first segmenta green label38 %38 %the second segment23 %the second segment23 %1010the third segmentthe third segment20the fourth segmenta red labelthe first segmenta green label38 %the second segment23 %the third segment102020the fifth segmentthe fourth segmenta red label(The figures are scaled by factor 0.5.)6.2 Presentations in different orderThe example of the previous section has a disadvantage, since the segments have to bepresented in the order of their declaration. But what is about the order 1, 3, 5, 2, 4?The first part is already known from the previous example. Thus this example startsafter the first loop. The order of the METAPOST figures has always to be 1, 2, 3. . . , thusan additional counter for the figures is needed. That counter FigCounter is set to 0 andused as figure number in the METAPOST command MyChart.FigCounter := 0 ;def MyChart (expr s) =SegmentState (s, normal, this) ;beginfig(FigCounter);PieChart(4cm, 0.15, 60, 0, 0) ;Label.auto(0)(name)(outwards,0) ;Label(3,4,5)(value)(inwards,0) withcolor white;Label(1,2)(percent)(inwards,0) withcolor (1,1,0);Label.lrt(4)("a red label")((0.9,0.8), (2cm,-1cm)) withcolor 0.8red ;pickup pencircle scaled 2pt ;Label.auto(1)("a green label")( (0.9,0.1), (2cm,1.5cm)) withcolor 0.8green ;endfig;enddef;In the final loop the FigCounter is incremented with each loop-step. The loop-parameteri is only used for the segments in order to change their state.for i=1,3,5,2,4 :FigCounter := FigCounter + 1 ;MyChart(i) ;endfor;31
6 Tips for Presentationsendthe first segmenta green labelthe first segmenta green label38 %38 %10the third segmentthe first segmenta green labelthe first segmenta green label38 %38 %the second segment23 %1020the fifth segment1020the fifth segmentthe third segmentthe third segmentthe first segmenta green label38 %the second segment23 %the third segment102020the fifth segmentthe fourth segmenta red label(The figures are scaled by factor 0.5.)6.3 Presentations not segment by segmentNot all presentations need a segment-by-segment order. The following example presentsGermany’s most important trade partners. The first slide should only show the pie-chartand the names of the countries. The second chart adds the percent values. Then in thefollowing slides every country should be discussed. Therefore the segment of the countrywill be emphasize by a radial displacement.PiechartBBox := 1 ;input piechartmp ;SetupNumbers (1, this) ;SetupPercent( this, " %") ;Segment( 11.1, "France" , .6blue ) ;Segment( 10.6, "USA" , (.4, .5, 0) ) ;Segment( 8.4, "Great Britain", (.7, .7, 0) ) ;Segment( 7.4, "Italy" , (.6, .4, 0) ) ;Segment( 6.2, "Netherlands" , .7green ) ;Segment( 5.1, "Austria" , .6red ) ;Segment( 51.2, "others" , .5white ) ;FigCounter := 0 ;The first part declares the segments and defines the figure counter. Next the META-POST commands DoIf and ResetSegShift are defined. DoIf evaluates the expressione and performs a test whether the result is true or false. If the result is true thecommand executes the statement given in the second parameter c. The DoIf is not really32
6 Tips for Presentationsnecessary, since a normal if...fi expression can be used too, but it can make the codemore readable. ResetSegShift sets in a loop the displacement of all segments to 0.def DoIf(text e)(text c) =if e:c ;fi;enddef;def ResetSegShift =for j=1 upto 6:SegmentState(j, this, 0) ;endfor;enddef;In the command MyChart the DoIf statement is used in order to decide what segmenthas to be displaced and to show the percent values starting with the second figure.def MyChart =DoIf(FigCounter = 3)( SegmentState(1, this, 0.3) ) ;DoIf(FigCounter = 4)( SegmentState(2, this, 0.3) ) ;DoIf(FigCounter = 5)( SegmentState(3, this, 0.3) ) ;DoIf(FigCounter = 6)( SegmentState(4, this, 0.3) ) ;DoIf(FigCounter = 7)( SegmentState(5, this, 0.3) ) ;DoIf(FigCounter = 8)( SegmentState(6, this, 0.3) ) ;beginfig(FigCounter);PieChart(4cm, 0.15, 60, 90, 0) ;Label.auto(0)(name)(outwards,0) ;DoIf (FigCounter > 1)(Label(0)(percent)((.8,.5),0) withcolor white) ;endfig;enddef;In the final loop the eight figures are drawn. In each loop-step the segment displacementsare reset using ResetSegShift.for i=1 upto 8:FigCounter := i;ResetSegShift ;MyChart ;endfor;end33
7 <strong>piechartMP</strong> InternalsFranceFranceUSAUSA10.6 %11.1 %Great BritainItalyothersGreat BritainItaly8.4 %7.4 %6.2 % 5.1 %51.2 %othersNetherlandsAustriaFrance11.1 %USA10.6 %USANetherlandsAustriaFrance11.1 %10.6 %Great BritainItaly8.4 %7.4 %6.2 % 5.1 %51.2 %othersGreat BritainItaly8.4 %7.4 %6.2 % 5.1 %51.2 %othersNetherlandsAustriaNetherlandsAustriaFranceFranceUSA10.6 %11.1 %USA10.6 %11.1 %Great Britain8.4 %ItalyNetherlands7.4 %6.2 % 5.1 %51.2 %Austriaothers8.4 %51.2 %Great Britain7.4 %6.2 % 5.1 %ItalyNetherlandsAustriaothersFrance11.1 %USA10.6 %8.4 %Great Britain7.4 %Italy5.1 %6.2 %51.2 %othersGreat BritainUSAItaly10.6 %8.4 %NetherlandsFrance7.4 %6.2 %11.1 %5.1 %51.2 %othersNetherlandsAustriaAustria7 <strong>piechartMP</strong> InternalsThis section describes some internal variables and macros which can be useful when youneed some information about the chart for more advanced graphics.R is a numeric variable containing the radius of the pie-chart, that was specified in PieChart.Thus the variable is only valid after the PieChart command has been used.pc_Centre is a METAPOST variable of type pair which contains the centre of the pie-chart.Normally this is the origin of the METAPOST co-ordinate system, but you can modifythe value in order to place the chart somewhere. It is a matter of course that youshouldn’t change this value between PieChart and the label commands.pc_Count is a numeric variable containing the number of defined segments. For exampleits value can be used in own loops. But even you can set this value to 0 in orderto start a completely new set of segment data. <strong>piechartMP</strong> defines the macroResetSegments which does exactly this.SegmentPoint(s,sp) is a macro returning a METAPOST pair. The command Label hasa parameter SegmentPoint. If you use this specification as parameter sp and a valid34
7 <strong>piechartMP</strong> Internalssegment number for s in the SegmentPoint command then the returned pair will bethat point in the real METAPOST system of co-ordinates.SegmentColor(s) is a <strong>piechartMP</strong> macro returning the color of the segment specifiedas s.For example the following METAPOST loop labels all visible segments in their specificsegment color.for i=1 upto pc_Count:Label.auto(i)(name)(outwards,0) withcolor SegmentColor(i) ;endfor;35
ReferencesReferences[Hob] John D. Hobby; A User’s <strong>Manual</strong> for METAPOST, Computing Science Technical ReportNo. 162; AT&T Bell Laboratories, Murray Hill, New Jersey; April 1992[Con] Hans Hagen; MPtoPDF converter; http://www.pragma-ade.com36
Indexaddto (command), 24alignments, 12bounding box, 26chartdrawing, 9co-ordinatespattern area, 24predefined, 11segment, 11colorautomatic, 6, 14conversion, 14grayscale, 14saturation, 14segment sides, 14commandsaddto, 24DefinePattern, 23Label, 10label, 15pickup, 11PieChart, 9PrivatePattern, 24Segment, 6SegmentState, 8SetupColors, 14SetupName, 20SetupNumbers, 13SetupPercent, 19SetupText, 17SetupValue, 19currentpicture (variable), 24declaration, 23private method, 23, 24pencircle (variable), 11pickup (command), 11PieChart (command), 9PiechartBBox (variable), 26PrivatePattern (command), 24Segment (command), 6segmentcolor, 6declaration, 6states, 8SegmentState (command), 8setupcolor, 14name, 20numbers, 13percent, 19text, 17value, 19SetupColors (command), 14SetupName (command), 20SetupNumbers (command), 13SetupPercent (command), 19SetupText (command), 17SetupValue (command), 19variablescurrentpicture, 24pencircle, 11PiechartBBox, 26DefinePattern (command), 23formatL A T E X, 16mptopdf, 28Label (command), 10label, 10alignment, 12setup, 17, 19, 20typesetting, 15label (command), 15linethickness, 11pattern37
<strong>piechartMP</strong> - drawing 2D/3D pie-chartswith METAPOST | Jens-Uwe Morawski |morawski@gmx.net | May 14, 2002