Compaction Research: Frequency, Amplitude and Speed QEDQ9874
Compaction Research: Frequency, Amplitude and Speed QEDQ9874
Compaction Research: Frequency, Amplitude and Speed QEDQ9874

You also want an ePaper? Increase the reach of your titles
YUMPU automatically turns print PDFs into web optimized ePapers that Google loves.
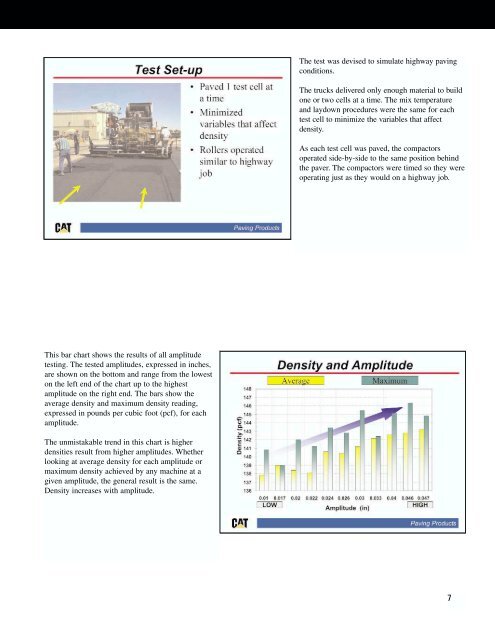
The test was devised to simulate highway pavingconditions.The trucks delivered only enough material to buildone or two cells at a time. The mix temperature<strong>and</strong> laydown procedures were the same for eachtest cell to minimize the variables that affectdensity.As each test cell was paved, the compactorsoperated side-by-side to the same position behindthe paver. The compactors were timed so they wereoperating just as they would on a highway job.This bar chart shows the results of all amplitudetesting. The tested amplitudes, expressed in inches,are shown on the bottom <strong>and</strong> range from the loweston the left end of the chart up to the highestamplitude on the right end. The bars show theaverage density <strong>and</strong> maximum density reading,expressed in pounds per cubic foot (pcf), for eachamplitude.The unmistakable trend in this chart is higherdensities result from higher amplitudes. Whetherlooking at average density for each amplitude ormaximum density achieved by any machine at agiven amplitude, the general result is the same.Density increases with amplitude.7