- Page 1: Please answer the following questio
- Page 5 and 6: @ samplinghow do you get your subje
- Page 7 and 8: 1.4 sources of errorself-selecting
- Page 9 and 10: 1.5 designing an experimentex) find
- Page 11 and 12: suggested experiments1 objective: e
- Page 13 and 14: suggested experimentsex)objective:
- Page 15 and 16: ch2 - organizing and presenting dat
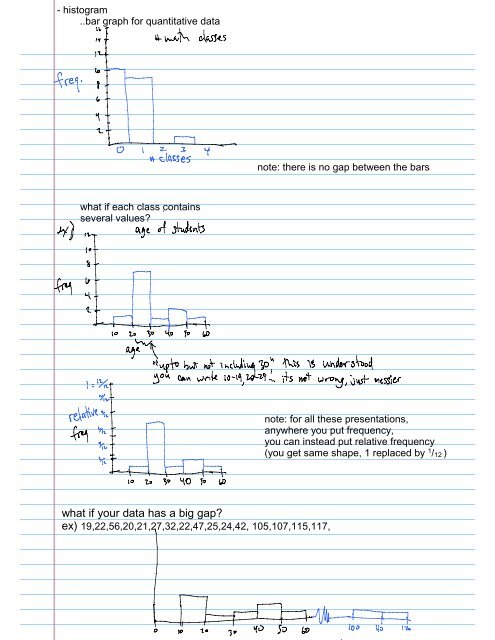
- Page 17: 2.2 presenting quantitative datafre
- Page 21 and 22: 2.4 misleading representations- a g
- Page 23 and 24: ch 3: numerically summarizing data3
- Page 25 and 26: 3.2 Measures of Dispersionhow sprea
- Page 27 and 28: sample populationmean x µ "mu"st.d
- Page 29 and 30: whats the standard deviation? [extr
- Page 31 and 32: 3.4, 3.5 measures of position- rank
- Page 33 and 34: oxplot- picture of the 5 numbersumm
- Page 36 and 37: hw 3.2 questions3.2 online #1) find
- Page 39 and 40: a man is 68" tall, for men the mean
- Page 41 and 42: hw questions3.4online #4
- Page 43 and 44: 45 47 48 56 57 59 60 62 63 64 64 65
- Page 45 and 46: what is the mean in our example?not
- Page 47 and 48: the normal probability distribution
- Page 49 and 50: ex) find P(z 1.37) ?the TOTAL has t
- Page 51 and 52: finding a z-score (or data value)gi
- Page 53 and 54: ex) find P(z < 1.75)have:want:ex) f
- Page 55 and 56: hw questions 6.1#8
- Page 57 and 58: hw questions 7.2, 7.37.3 #7
- Page 59 and 60: hw questions ch7
- Page 61 and 62: hw questions ch77.2 #4
- Page 63 and 64: for adult salmon length, µ=42" and
- Page 65 and 66: 17% of Americans have high choleste
- Page 67 and 68: ex) if p=.28, find P( > .32) with a
- Page 69 and 70:
hw questions ch8
- Page 73 and 74:
hw questions ch88.1probability that
- Page 75 and 76:
hypothesis testing (formally)1. a c
- Page 77 and 78:
ex) pollution level in a riveran en
- Page 79 and 80:
ex) a drug company is trying to mak
- Page 81 and 82:
hypothesis test about µ, what if w
- Page 83 and 84:
σhave σ dont have σ, have snote:
- Page 85 and 86:
ex)H 0 : µ=4H 1 : µ
- Page 87 and 88:
ex) does the public believe the dea
- Page 89 and 90:
hw questions - ch 10
- Page 91:
hw questions - ch10
- Page 95 and 96:
10.6 summary of ch10we have to iden
- Page 97 and 98:
ex) you need to know if proposition
- Page 99:
hw questions ch1010.3 #2 online
- Page 103 and 104:
10.3-online #2)Ho: µ = 1.67H 1 :
- Page 105 and 106:
why might we wind up with two equal
- Page 107 and 108:
lets analyze the margin of error:CI
- Page 109 and 110:
ex) find the 96% CI for µ when x =
- Page 111 and 112:
lets do a confidence interval....fo
- Page 113 and 114:
elationship between confidence leve
- Page 115 and 116:
ex) are the people in support of st
- Page 117 and 118:
hw questions ch99.3#1 construct a C
- Page 119 and 120:
hw questions ch9online 9.1#2confide
- Page 121 and 122:
hw questions ch9online 9.2#4constru
- Page 123 and 124:
ex) are men paid a higher salary (f
- Page 125 and 126:
to do a confidence interval for the
- Page 127:
hw questions - ch1111.1 #14x: .582
- Page 131 and 132:
linear correlation and regression [
- Page 133 and 134:
Doing Regression and Correlation us
- Page 135 and 136:
Probability [ch5]...from a more mat
- Page 137 and 138:
finding probabilities from real-wor
- Page 139:
ex) roll a dieP(roll a 6, then a 3,