Please answer the following questions:
Please answer the following questions:
Please answer the following questions:

Create successful ePaper yourself
Turn your PDF publications into a flip-book with our unique Google optimized e-Paper software.
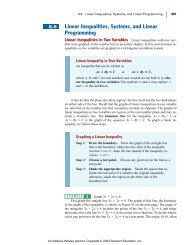
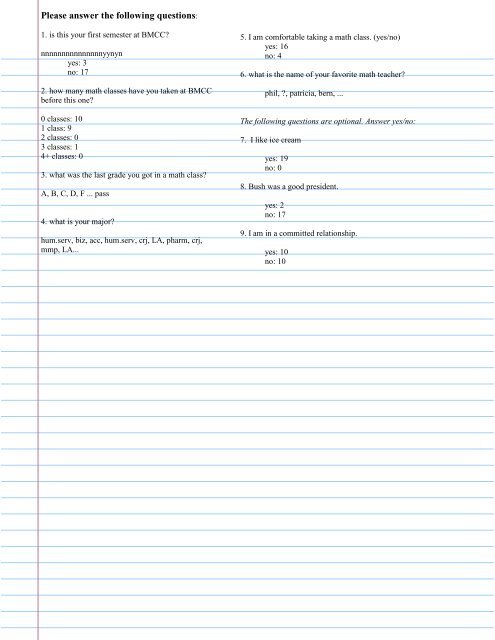
<strong>Please</strong> <strong>answer</strong> <strong>the</strong> <strong>following</strong> <strong>questions</strong>:1. is this your first semester at BMCC?nnnnnnnnnnnnnnnyynynyes: 3no: 172. how many math classes have you taken at BMCCbefore this one?0 classes: 101 class: 92 classes: 03 classes: 14+ classes: 03. what was <strong>the</strong> last grade you got in a math class?A, B, C, D, F ... pass4. what is your major?hum.serv, biz, acc, hum.serv, crj, LA, pharm, crj,mmp, LA...5. I am comfortable taking a math class. (yes/no)yes: 16no: 46. what is <strong>the</strong> name of your favorite math teacher?phil, ?, patricia, bern, ...The <strong>following</strong> <strong>questions</strong> are optional. Answer yes/no:7. I like ice creamyes: 19no: 08. Bush was a good president.yes: 2no: 179. I am in a committed relationship.yes: 10no: 10
1.2 different types of study<strong>the</strong>re are two major types of studies1. observational studyex) just ask 'who is comfortable taking a math class?'2. experiment (or designed experiment)ex) one class i say every gets $1000 and an A, in ano<strong>the</strong>r class i say everyone is stupidand will fail<strong>the</strong>n i ask 'who is comfortable taking a math class?'observational study- observe and measure (watch, ask question, etc)ex) "l like ice cream" yes/noex) watch ice cream shop, see how many people go inexperiment - apply a "treatment" to your subject and measure resulttreatment: what you do to <strong>the</strong> subjectsubject: each person in <strong>the</strong> studyex) what flavor of ice cream do people like?observational study- sit in a store, watch what flavor people buy OR surveyexperiment - make a suggestion, see what <strong>the</strong>y buyQ - does making a suggestion change <strong>the</strong> flavor people order?-> need to make a comparison to see <strong>the</strong> effect of <strong>the</strong> treatmentexperimental group:make suggestion (this group gets <strong>the</strong> treatment)control group:do nothingsubjects:customers in <strong>the</strong> storetreatment:make a suggestionobserved behavior: <strong>the</strong> result you want to look atwhich flavor <strong>the</strong>y buy (this is also called <strong>the</strong> response variable)question/ research objective:does suggestion affect flavor <strong>the</strong>y buyobservational studygood - watch subjects in natural environment(realistic)bad - never same conditionsexperimentbad - may be unwanted experimenterinfluencegood - can do exact same thing for eachsubject(control)
@ samplinghow do you get your subjects?@ (simple) random sample - every member of population has equal chance of beingin <strong>the</strong> sampleex) roll a dieex) have computer randomly generate phone #'snote: we will not discuss <strong>the</strong> difference between a random sample and a simplerandom sample@ convenience sampling - choose sample that is convenientex) reporter chooses people on a corner@ systematic sampling- choose a starting point select every k th person (could have alist of your population)ex) choose every 100th name in <strong>the</strong> phone book@ stratified sampling - choose different groups within your population, and select fromeach oneex) presidential panel includes women, minority, Dem, Repprecisely, choose one or more characteristics (wealth, race, gender, etc) and selectpeople with different values of that characteristicnote: which characteristics do you choose? how do you break that up into subgroups?@ cluster sampling - break your population into regions, choose a couple of thoseregions, <strong>the</strong>n sample from each of those selected regionsex) exit polls after an electionreason - cant travel everywhereex) at a high school, when voting for where to go on <strong>the</strong>school trip, a newspaper reporter asks 20 freshmen, 20sophmores, 20 juniors, 20 seniorsQ: what kind of sampling is this?stratifiedcharacterisic:values:
hw <strong>questions</strong>1.1 #42 US Census Bureau survey 50000 US households for characteristics like incomepopulation: US householdssample: 50000 households surveyed1.2 #20 get a simple random sample -> names from a hat
1.4 sources of errorself-selecting sample (or) nonresponseex) announcer on radio station asks callers to voice <strong>the</strong>ir opinion,it will appeal to people who care stronglyex) web pollex) customer service surveywho is going to respond? people who had bad customer service, so survey resultswill always be badwhat is a good sample?a sample which is representative of <strong>the</strong> target populationis this a good survey question: (to find out people's opinion of his leadership)?Q: John McCain's honored military experience makes him a good leader. (yes/no)yesno* loaded questionleads you to <strong>answer</strong> one wayex) people usually associate military service with leadershipfix it:is John McCain a good leader? ...now its neutralex) abortion (pro-choice V pro-life) ... find out where someone stands on <strong>the</strong> issueask a question that is: neutral ... loaded towards pro-choice ... loaded towards pro-lifeneutral:loaded towards pro-choice:loaded towards pro-life:Q: (neutral) do you think abortion should be legal?Q: (neutral) would you say you are pro-choice or pro-life?Q: (biased towards pro-choice) should <strong>the</strong> government be allowed to take away awoman's constitutional right to choose whe<strong>the</strong>r she can have a child?Q: (favoring prochoice) Should <strong>the</strong> woman have <strong>the</strong> right to choose to end herpregnancy taken away by politicians?Q: (biased towards pro-life) Should a woman be allowed to kill her baby before itsborn?
* self-interest studystudy conducted by someone who has an interest inThe results turning out a particular wayex) be skeptical about a survey about GM cars conducted by GM(every car is #1 ?)* small sampleex) a Newsweek reporter goes to <strong>the</strong> corner and asks 12 peoplewhat <strong>the</strong>y think about what happened with Tiger Woods?Q: would you go buy products he endorsed, given what he did?* interviewer error- when <strong>the</strong> interviewer is inappropriate in some wayex) cops ask <strong>questions</strong> about opinion of police dept@ word order / question orderex) Q: what do you think causes more pollution in <strong>the</strong> US, traffic, or industry?even more biased: Do you think traffic causes more pollution in <strong>the</strong> US,or industry?solution: half <strong>the</strong> time "traffic or industry", half <strong>the</strong> time "industry or traffic"@ correlation V. causationex) survey results show that people who drive BMW's live longer than driving o<strong>the</strong>r cars- if you want to live longer, should you buy a BMW?no, BMW owners are - on average - more wealthy, so <strong>the</strong>y can afford better healthinsurance and take better care of <strong>the</strong>ir health<strong>the</strong> only way to determine causation is with an experiment, where you have control, andyou can apply a treatment and measure <strong>the</strong> effect (response variable)ex) take 100 people, give 50 BMWs and 50 Toyotas, and see what <strong>the</strong>ir lifespans are
1.5 designing an experimentex) find out <strong>the</strong> effect of which car you drive on your lifespan:get a sample of 100 people, give 50 BMWs and 50 Toyotas, and see what<strong>the</strong>ir lifespans areobjective: find out <strong>the</strong> effect of which car you drive on your lifespantreatment: BMWs, Toyotasfactor: what type of car subjects drive (explanatory variable) [input]response variable: lifespan [output]sample: 100 people (driving cars)<strong>the</strong> steps:1. identify <strong>the</strong> issue to be studied2. determine <strong>the</strong> factors that (you think) affect <strong>the</strong> response variableex) one factor- which car <strong>the</strong>y drive3. deterine <strong>the</strong> level of each factor- levels: different values each factor takes onex) levels are BMW, Toyota (this is similar to specifying <strong>the</strong> treatments)4. determine <strong>the</strong> number of subjects5. conduct <strong>the</strong> experiment6. analyze <strong>the</strong> data and reach a conclusion (see if your claim is true or not)after you have selected your sample, you must assign subjects (to different treaments)and conduct <strong>the</strong> experimentex) who gets BMWs, who gets Toyotas?- completely randomex) 50 names from a hat get BMWs- randomized block designex) take <strong>the</strong> rich men, give half BMWs and half Toyotastake <strong>the</strong> rich women, give half BMWs and half Toyotastake <strong>the</strong> poor women, give half BMWs and half Toyotas, etcdef: divide your sample into blocks of subjects who are similar according to certaincharacteristics, <strong>the</strong>n from each block randomly assign subjects to each treatment- matched pairs designex) pair up similar people (e.g. two 37-year old rich women), and give one a BMWand one a Toyotaall ways of making sure that both treatment groups are <strong>the</strong> same, except for <strong>the</strong> factorwhose effect you want to measurenote, sampling: starting with a population and selecting subjectsassigning subjects: once you have your sample, choosing which treatment eachgets
ex) suppose you give subjects a combination of st johns wort and gingko tosee <strong>the</strong> effect on how much <strong>the</strong>y sleepsjw: you ei<strong>the</strong>r give <strong>the</strong>m 0mg, 10mg, 20mggingko: you give <strong>the</strong>m ei<strong>the</strong>r 0mg, 25mg, 40mgwhat could we do/give to a subject?25mg gingko, 10mg sjw ...this is one treatmentfactors: gingko, sjwtreatments: 0gi,20sjw 40gi,10sjwgingko: 3 different levelssjw: 3 different levelstreatments: 9 possibilitiesnote: medicine is an example of a field where you would use two factors, notjust one- why?because <strong>the</strong>y might interactex) gingko does nothing by itself, sjw does nothing, but toge<strong>the</strong>r <strong>the</strong>y solve <strong>the</strong>problem
suggested experiments1 objective: effect of coffee and redbull on energy levelfactors: coffee, redbullsample: 160 peopletreatments: 16 of <strong>the</strong>mresponse variable: amount of energy(number of jumping jacks <strong>the</strong>y can do)(ask <strong>the</strong>m how energetic <strong>the</strong>y feel)2objective: which shampoo is most effective on dandrufffactor: shampoosample: 40 people (stratified sampling - 20 men, 20 women)treatments: Pantene, Head and Shouldersresponse variable: amount of dandruff OR opinion about how effective shampoo wasis your objective "effectiveness" or "are <strong>the</strong>y happy and will <strong>the</strong>y buy it again"?3objective: how does breakfast affect students gradestreatments: breakfast, no breakfastfactor: mealsample: 40 students in <strong>the</strong> same classresponse variable: grade in that classassigning subjects: randomized block design: 20 students who are good at math (10skip breakfast, 10 eat it) 20 students who are not good at math (10 skip breakfast, 10eat it)if you want to generalize, you have to have students from different schools and differentsubjects4 objective: how much caf/decaf coffee affects how long you stay upfactors: caf, decaflevels: 1,2,3,4 cups of coffeerandomized block design based on body type (big, small) and caffeine tolerance (priordrinking: 1,2,3,4 cups a day)response variable: time falling asleep5 objective: what gets you more drunkfactors: beer pong, flip cuplevels: 1, 5, 10 gamesrandomized block design: 100-149 pounds, 150+ poundsresponse variable: result of breathalyzerpopulation: BMCC students, 21+sample: stratified sample using weight (12: 100-149, 12: 150+)
objective: which alcohol gets you more drunkfactors: rum, vodkalevels: 0,1,2,3,4 shotssample: 100 mentreatments: 25 diff (1 rum, 2 vodka), etcnote: should control for body weightobjective: which condom prevents pregnancy betterfactor: condomtreatments: nyc condom, trojan condomsample: 50 couples(<strong>the</strong>y use <strong>the</strong>ir condoms for a year, see who gets preg)completely random designnote: should control for how often couples have sex
suggested experimentsex)objective: find out <strong>the</strong> best laptop for college studentssample: 1000 bmcc studentsgive each student a laptop for 60 days. at <strong>the</strong> end, fill out a survey to rate <strong>the</strong>performance of <strong>the</strong>ir laptoptreatments: HP, toshiba, panasonic, dellfactor: which laptop <strong>the</strong>y useresponse variable: <strong>the</strong> rating on <strong>the</strong> surveycomments: maybe a full semester is a better trial periodwhat exactly are you comparing? ...maybe we will compare <strong>the</strong> operating systemex) objective: does <strong>the</strong> time people eat dinner affect <strong>the</strong>ir weighthalf <strong>the</strong> subjects get dinner 4 hours before sleep, half right before sleep. same food,continue routine for 1 monthsubjects: 10 people all <strong>the</strong> same age, 2 groups of 5factor: time dinner is eatentreatments: bedtime, 4 hours before bedtimeresponse variable: change in weightcomments: same bedtime? - ned to consider sleeping habitsare <strong>the</strong>re o<strong>the</strong>r activities affecting weight gain? different metabolism?ex)objective: which shampoo causes an allergic reaction for dogstreatments: scented, unscentedsample: 200 dogsfactor: which shampooresponse variable: allergic reaction (yes/no)assign subjects: randomlyex) have women take a kind of birth control for a year, <strong>the</strong>n check <strong>the</strong>ir weight gainobjective: which birth control makes women gain weighttreatments: Yaz, Orthosample: 100 women age 18-35factor: which birth controlresponse variable: weight gainassign subjects: randomlycomment: o<strong>the</strong>r things affecting weight gain: diseases, different levels of exercise,stress, diet, etc - particularly for medical studies, make sure each treatment group iscomparableex) 250 students, age 18+, half get tylenol, half get placebo, 2.5 hours later is <strong>the</strong>irheadache goneobjective: does tylenol get rid of headaches?sample: 250 students, simple random sampletreatments: tylenol, placebofactor: <strong>the</strong> medicationresponse variable: presence of headache (yes/no)comments: how do you get a sample of people with a headache?maybe <strong>the</strong> headache will go away anyway<strong>the</strong> severity of <strong>the</strong> headache might affect <strong>the</strong> result
hw <strong>questions</strong> ch11.3#29 survey about commuter rail, how do you choose sample? why?stratified sample...and stratify by different neighborhood, since rail will affect peopleif different neighborhoods differentlycluster v stratified samplingex) survey condition of wildlife preservescan you go to everyone?no...to make it easier to get around, go to a cluster in Washington, in New York, inWyoming, etc (once youre in Wyoming, drive around to all or most)i.e. out of 50 states, pick 4 randomly, <strong>the</strong>n visit all sites in each stateex of randomized block design)experiment to find out <strong>the</strong> effectiveness of Title 5 advising program for bmcc LAstudentsget a sample of 40 bmcc LA studentsquestion:- is <strong>the</strong> Title 5 advising program effective?experimental group: goes into <strong>the</strong> programcontrol group: does not go into programtreatment: go into <strong>the</strong> advising programresponse variable:results of student surveyrate of graduationsampling method: randomrandom block design:- split <strong>the</strong>m into male and female- half <strong>the</strong> males go into <strong>the</strong> program, half dont- half <strong>the</strong> females go into <strong>the</strong> program, half dont
ch2 - organizing and presenting dataif you cant share your work with o<strong>the</strong>r people so <strong>the</strong>y understand it, <strong>the</strong>n what was <strong>the</strong>point2.1 presenting qualitative data (words)- frequency distribution (table)...how often does each data value appearex) is this your first semester at BMCC?yes 3no 17frequency: total number of occurrences of a data valuerelative frequency:acc offop humserv LA humserv acc vat LA bizLA humserv child.ed, acc ...note: relative freqency adds up to 1sometimes, because of rounding, that might nothappen on <strong>the</strong> chart
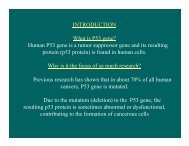
Bar Graphwhat is your major?-Pie Chartex) # of people with a particular majorlabel each slice with:category; freq (or relative freq or percentage)
2.2 presenting quantitative datafrequency distribution (table)- looks <strong>the</strong> same when you have each data value gets its own frequencywhen might it look different?ex) what is your age? i take a sample from all BMCC students19,22,56,20,21,27,32,22,47,25,24,42break data up into data classes (from low to high)(what class you choose is up to you)here, break it up into 10s, 20s, 30s 40s 50s ...this is typical for dealing with ageseach age range or "data group" is called a data class<strong>the</strong> class width is <strong>the</strong> distance between classesex) here its 10 20-10=10 or 30-20=10note: <strong>the</strong> class width must stay <strong>the</strong> same (in general)<strong>the</strong> class limits (or class boundaries) are <strong>the</strong> highest and lowest values in <strong>the</strong>classex) here <strong>the</strong> class limits on <strong>the</strong> first class are 10 and 19(note: <strong>the</strong>re are o<strong>the</strong>r technical definitions for this, but we will use this simplehow do you make a frequency distribution table with continuous data?...adjust class limits according to your precision (number of decimal places)ex) if you record people's ages with 2 decimal places (20.47years, 21.65, etc)<strong>the</strong>n write your class limits with 2 decimal places: 10-19.99, 20-29.99, 30-30.99 etc
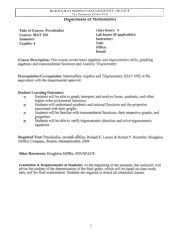
- histogram..bar graph for quantitative datanote: <strong>the</strong>re is no gap between <strong>the</strong> barswhat if each class containsseveral values?note: for all <strong>the</strong>se presentations,anywhere you put frequency,you can instead put relative frequency(you get same shape, 1 replaced by 1 /12 )what if your data has a big gap?ex) 19,22,56,20,21,27,32,22,47,25,24,42, 105,107,115,117,
19,22,56,20,21,27,32,22,47,25,24,42great for small data sets: it is visual(like a histogram)and it preserves all your dataex) 105, 107, 112, 114
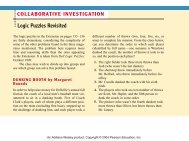
* frequency polygonhistogram, but instead of bars, connect with a line10 20 30 40 50 60* ogive (oh-jive)-uses cumulative frequency<strong>the</strong>re are lots of creative ways to represent data visually. for one guy, thats his full-time job:http://www.informationisbeautiful.net/want to see a better visual representation we can all use? how about this NYC subway map:http://www.kickmap.com/comparison/
2.4 misleading representations- a graph which is correct, but gives <strong>the</strong> wrong impression> 3-dimensional pictures exaggerate <strong>the</strong> appearance of changeex) money pile* misleading graphex) salary graph"look at <strong>the</strong> raises we give!"short y-axis range - dont start from zeroexaggerates changewe can make:bar graph using Excelpie chart using Excelhistogram using StatDisk
hw <strong>questions</strong> ch22.2 list original data(from a stem-and-leaf)4 | 0 4 7 --> 40, 44, 47etc
ch 3: numerically summarizing data3.1 measure of central tendencyor, give me one number that represents all <strong>the</strong> datacomment:2 uses of <strong>the</strong> word "control"control groupcontrolled factorconsider <strong>the</strong> number of math classes taken by math 150 students. how canwe sum it up in one number?average: add up all <strong>the</strong> numbers and divide by <strong>the</strong> amount of numbers that<strong>the</strong>re areex) suppose you score on three tests 71,75,84. what is your test average?also called <strong>the</strong> meanex) for number of math classes, mean =median: <strong>the</strong> middle numberex) suppose you score on three tests 71,75,84. what is your median testscore?median is 75interpretation: half <strong>the</strong> time <strong>the</strong> score is above 75, half <strong>the</strong> time <strong>the</strong> score isbelow 75note: you must put data in ascending order to determine <strong>the</strong> median0,0,0,0,0,0,1,1,1,1,1,1,1,1,1,1,1,1,1,2,2,2,2,2...median isex) heights of students (in inches):59,61,62,64,64,64,65,66,66,66,67,68,68,69,70,70,71,71,73what is <strong>the</strong> median height?...find middle number: <strong>the</strong>re are 19 numbers (19+1)/2=10 ...so its <strong>the</strong>number in <strong>the</strong> 10th position ...<strong>the</strong> median is 66or: 59,61,62,64,64,64,65,66,66,66,67,68,68,69,70,70,71,71,73what do you do if <strong>the</strong>re are two middle numbers? add toge<strong>the</strong>r, divide bytwo (i.e. take <strong>the</strong> average)..this will happen when <strong>the</strong>re is an even amount of datanote that, using <strong>the</strong> "+1" method, you would get (20+1)/2 = 10.5...this means <strong>the</strong> median is between <strong>the</strong> 10 th and 11 th numbers, so take <strong>the</strong>iraverage
mode: most common numberex) heights: two modes 64 and 66ex) number of math classes: 1ex) test scores: no mode (all <strong>the</strong> same frequency)Question: which of <strong>the</strong>se should we use, and why?ex) number of credits taken at BMCC in math150 class:0,0,9,12,21,22,27,32,35,38,44,50,52,56mean =median =mode = 0ex) <strong>the</strong>re can be a problem with <strong>the</strong> mean<strong>the</strong> average salary in this class is around $15,000if Bill Gates (and his $1,000,000,000 salary) walk into <strong>the</strong> room,<strong>the</strong> average salary is now around $35,000,000. does this make us allmillionaires? ...no<strong>the</strong> median salary is still around $15,000, because at most you go to <strong>the</strong>next number on <strong>the</strong> list"<strong>the</strong> Bill Gates effect"Bill Gates' salary is an outlier: it is a value far away from most of <strong>the</strong> data<strong>the</strong> average is not robust with respect to an outlier<strong>the</strong> median is robust with respect to an outlierrobust: not affected by [also known as resistant]
3.2 Measures of Dispersionhow spread out is <strong>the</strong> databecause mean & median do not tell <strong>the</strong> whole storyex) group of 5 men, heightsgroup 1: 5'8,5'10, 5'11, 6', 5'9 ... in inches: 68,69,70,71,72group 2: 4'6,7'4,4'2,6'8,6'6 ... in inches: 50,54,78,80,88find mean:group 1: 68+69+70+71+72 = 350 = 70" (or 5'10)5 5group 2: 54+88+50+80+78 = 350 = 70" (or 5'10)5 5- range(highest) - (lowest)ex) group #1: 72" - 68"=4"group #2: 88" - 50" = 38"note: affected by an outlierex) our salary range is 30000-0 = 30000with Bill Gates, range is 1000000000 - 0 = 1000000000
standard deviationex) group 1 (inches) 68,69,70,71,72" mean = 70standard deviation =you do:ex)group #2: 54, 88, 50, 80, 78 ... mean = 70find <strong>the</strong> standard deviationex) var = 4 ... st.dev. =ex) st.dev. = 9 ... var =
sample populationmean x µ "mu"st.dev. s σ "sigma"variance s 2 σ 2size n Ndepends on fixedyour samplea "statistic" a "parameter"also: "data value" = x<strong>the</strong> way that you calculate <strong>the</strong> sample mean and <strong>the</strong>population mean are exactly <strong>the</strong> same.<strong>the</strong> difference is <strong>the</strong> kind of information it gives youex) find <strong>the</strong> standard deviation of <strong>the</strong> sample 7,10,16 (and <strong>the</strong> variance)note for standard dev:for a population, divide by <strong>the</strong>number of datafor a sample, divide by <strong>the</strong>number - 1
3.3 calculating that stuff from a table(measures of central tendency and dispersion)or, what to do if we have only <strong>the</strong> table of data and not <strong>the</strong> raw dataex)whats <strong>the</strong> mean??note: <strong>the</strong> table is anapproximation, so <strong>the</strong> resultwill be an approximationFormula for aweightedmean:note: divide by 12, not 5, because12 is <strong>the</strong> total frequency (e.g. 25appears 7 times)this is similar to a weighted meanex) get three scores, 80, 95, 70but <strong>the</strong> first score is your hw grade (that counts 20%) <strong>the</strong> second score is your midtermgrade (that counts 30%) <strong>the</strong> third score is your final exam grade (that counts 50%)mean = Σ x · rel.freq(x)x or µ
whats <strong>the</strong> standard deviation? [extra credit material]s =
hw <strong>questions</strong>3.2 #14 population: 1,19,25,15,12,16,28,13,6 ... find st.dev, variance
3.4, 3.5 measures of position- rankex) New York marathon, 12,635 people run, you finished 586your rank is 586 (out of 12635)- quartilemarked off by: quarter point, half-way point, three-quarter pointhalfway: 6318quarter-mark: 3159- 5-number summarymin--Q1--Q2--Q3--max"Q1": data value that separates first quartile and second quartile5-number summary: Q 2 is in <strong>the</strong> n+1 / 2 position (<strong>the</strong>n find <strong>the</strong> data value)Q 1 is in <strong>the</strong> n+1 / 4 position (<strong>the</strong>n find <strong>the</strong> data value)Q 3 is in <strong>the</strong> (n+1)( 3 / 4 ) position (<strong>the</strong>n find <strong>the</strong> data value)ex) 14,15,16,17,18,19,20,21,22 (n=9)using <strong>the</strong> formula:Q 1 appears in which position? Q 1 =Q 2 appears in which position? Q 2 =Q 3 appears In which position? Q 3 =why do we need <strong>the</strong> "+1" ? well, if we didnt have it <strong>the</strong>n for Q 2 we wouldcalculate(9)(1/2) = 4.5but we know thats not right, its too low...<strong>the</strong> "+1" fixes that problemBoxplot- a visual representation of <strong>the</strong> 5 number summary
- percentileyou are above ? % of <strong>the</strong> datapercentile --> valueex) 3,7,9,12,15,15,16,18,19,21,24,26,28,29find <strong>the</strong> 37th percentile:(n=14)you do: find <strong>the</strong> 58th percentileex) find <strong>the</strong> 78th percentilevalue --> percentileex) at what percentile is x=24? [recall: "x" means data value]x=24 is above 10 data values (out of 14)percentile: 10/14 = .71 or 71st percentile (above 71% of <strong>the</strong> data)notation: <strong>the</strong> 71st percentile is 24P 71 = 24note that, for both problems,<strong>the</strong> middle step is to find <strong>the</strong>rank (position)note: <strong>the</strong> "+1" formula has some glitches for small data sets. this comesfrom <strong>the</strong> fact that one data value represents a large chunk of your dataset (e.g. if you have 20 numbers, each one represents 5%)...just follow <strong>the</strong> formulaex) make a 5-number summary for <strong>the</strong> example [3,7,9,12,15,15,16,18,19,21,24,26,28,29]we have modified our formula: since Q1 is at <strong>the</strong> 25th percentile, <strong>the</strong> position is (n+1)(.25)
oxplot- picture of <strong>the</strong> 5 numbersummarythis distribution shape is called "symmetric"here are some o<strong>the</strong>r shapes:
- z-score"<strong>the</strong> number of standard deviations from <strong>the</strong> mean"ex) <strong>the</strong> mean score is 77, you got an 85. is that good? how good?it depends.suppose <strong>the</strong> standard deviation is 4. how many standard dev's above <strong>the</strong> mean are you?you are 8 points above...that is 2 standard deviations (since st.dev. is 4)Jerry got a 88. how many standard deviations above <strong>the</strong> mean is his score?what is each numbercalled?Formulafor a z-score: z = x - µ(population) σfor a sample, same formula:different notationz = x - xsex) find <strong>the</strong> z-score for 47 if µ=38, σ=5what does that mean, in words? ...ex) find <strong>the</strong> z-score for 68 if µ=78, σ=4note that a positive z-score means your data value is above <strong>the</strong> meanand a negative z-score means your data value is below <strong>the</strong> meanex) which exam score is relatively better, a 75 when <strong>the</strong> class average was68 and <strong>the</strong> standard deviation was 4, or a 89 when <strong>the</strong> class average was 76 and<strong>the</strong> standard deviation was 12 ? (use <strong>the</strong> z-score)ex) find <strong>the</strong> data value which is 2 standard deviations above <strong>the</strong> mean if µ=32, σ=6Exam #1ch1,2,3formula for x: x = µ + z·σsame as <strong>the</strong> formula for z, but you solve for x
hw 3.2 <strong>questions</strong>3.2 online #1) find <strong>the</strong> sample variance and standard deviation: 19, 10, 2, 9 ,113.2#1 online) find <strong>the</strong> sample variance and standard deviation: 22 14 5 9 8
3.2 #12ex) 83,65,91,87,84find variance, standard deviation (sample)
a man is 68" tall, for men <strong>the</strong> mean is 69.6 with a st.dev. of 2.7". a woman is 62"tall, for women <strong>the</strong> mean is 64.1" and a stdev of 2.6"who is taller relative to <strong>the</strong>ir gender?3.4 #4 online: concentration in 10 soil samples. find <strong>the</strong> z-score for "10.79"...find mean and st.dev. from data, etc
<strong>the</strong> average 20-29 yearold man is 69.6" with a standard deviation of 2.7"<strong>the</strong> average 20-29 yearold woman is 64.1" with a standard deviation of 2.6"who is relatively taller, a 68" man or a 62" woman ?3.4#832-35-week gestation: mean is 2600g, st.dev. is 670g40-week gestation: mean is 3500g, st.dev. is 475g34-week baby is 3000g, 40-week baby weighs 3900gwhich baby weighs relatively less?3.3#12R1 #4f ... 20 38 38 45 48 48 49 51 53 54 59 61 62 64 65 68 71 765-number: min-Q1-Q2-Q3-max
hw <strong>questions</strong>3.4online #4
ex) z-score18, 16, 5, 9, 8
45 47 48 56 57 59 60 62 63 64 64 65 68 6869
a bit on probability and random variables (6.1)- might also fill in some o<strong>the</strong>r info, essentials of what we needa bunch of data (e.g. people's heights)some variable takes on different values...those different values are our data"x" represents our data values"x" is called a random variable(we'll be talking about quantitative data)discrete, or continuous:we have a discrete random variablewe have a continuous random variablebefore: "relative frequency"now: "probability"before: "frequency distribution"now: "probability distribution"probability:whats a probability value?- each value is between 0 and 1(if probability=0, it never happens) e.g. 0 = 0/6 "impossible event"(if probability=1, it always happens) e.g. 1 = 7/7 "certain event"- total probability = 1 (or 100%)notation:ex) <strong>the</strong> probability that a student's age is over 100= P(x > 100)ex) <strong>the</strong> probability that student's age is between 0 and 100= P(0 < x < 100)ex) <strong>the</strong> probability a student's age is 23= P(x = 23)how do you know if you have a discrete probability distribution?
what is <strong>the</strong> mean in our example?note: total probability is 1, so dontneed to divide by that<strong>the</strong> mean of a random variable is called itsexpected valueex) suppose <strong>the</strong>re is a game where you roll one die. if you roll a 6, youwin $5, o<strong>the</strong>rwise, you lose $1.what is <strong>the</strong> expected value of this game?ex) lets flip cards! when you pull a king from <strong>the</strong>deck, you win $10. for everything else, you lose$1. what is <strong>the</strong> expected value of this game?deck of cards: 52 cards4 each of A,2,3,4...10,J,Q,K (rank)13 each of spade,heart,diamond,club (suit)ex) P(x="8 of spades") =1/52ex) P(x="heart") = 13/52 or 1/4this also means...if you play through <strong>the</strong> whole deck, youwin $40 but lose $48 ... so you lose $8 on every tripthrough <strong>the</strong> deck (52 cards)
ch7: normal distributionwhat does a probability distribution look like for a continuous variable??how do we think about this?....convert a frequency polygon to being "continuous"how can we figure out probabilities (relative frequencies) from this?assume every temperature from 70 to 75 is equally likelywhat is <strong>the</strong> probability that<strong>the</strong> temperature is less than 72?notation: P(x < 72)that shades in 2/5 (or 40%) of <strong>the</strong> rectangleso, <strong>the</strong> probability is 2/5 (or .4 or 40%)note: total area = 1 ... because <strong>the</strong> total area represents <strong>the</strong>total probabilitythis is called <strong>the</strong> uniform distributionwhat is <strong>the</strong> probability that <strong>the</strong> temp isbetween 71 and 74?P(71
<strong>the</strong> normal probability distribution(also known as normal distribution, normal density, ..."bell curve"on <strong>the</strong> web page, click 'activities' ... 'Galton Machine'properties:- area = 1 (because this is <strong>the</strong> total probability)- each probability value is from 0 to 1- symmetric- highest frequency is in <strong>the</strong> middle......mode = median = meanwhat is <strong>the</strong> z-score for a male height of 72"?z=ex) if you have a man who is 70" and a woman who is 67", who is taller?...in inches? ...<strong>the</strong> man...relative to <strong>the</strong>ir gender?normal distribution, using only z-scores: <strong>the</strong> *standard* normaldistribution
within 1 standard deviation of <strong>the</strong> meanwhat percent of men are between 68" and 72" ?.....between 0 and 2 (z-values)thats 47%, or .47OR: <strong>the</strong> probability that a man is between 68" and 72" is .47notation:P(68 < x < 72)or P(0 < z < 2)
ex) find P(z 1.37) ?<strong>the</strong> TOTAL has to be 1so <strong>the</strong> area is 1 - .9147= .0853you do: [draw <strong>the</strong> picture and find <strong>the</strong> <strong>answer</strong>, to four decimal places]ex) P(z < -1.77) ex) P(z > .58) ex) P(z < 2.33) ex) P(z > 2.33) ex) P(z < -2.33)note: what determines which side youshade?note that its <strong>the</strong>same as <strong>the</strong>previous <strong>answer</strong>,because ofsymmetry
how do you find "between" area??ex) find P(1.26 < z < 2.18)<strong>the</strong> big area (purple) minus <strong>the</strong> little area (orange)gives you <strong>the</strong> area you want (blue)you do:ex) find P(-2.67
finding a z-score (or data value)given <strong>the</strong> percentile (probability)ex) what z-score is above 90% of your data?given probability,find z-scorein Excel:=NORMSINV(ex) find <strong>the</strong> z-score at <strong>the</strong> 85th percentileex) what female height is at <strong>the</strong> 90th percentile? [recall µ=64 and σ=1.5]note: we need to find <strong>the</strong> z score for <strong>the</strong> 90thpercentile, but we found it in <strong>the</strong> previousproblem, how nice for us
when you use Excel, <strong>the</strong> software will prompt you forwhich values you need to enter, and in which orderex) type =normdist( ..and it says "x,mean,st.dev,cum"...always use "true" for last value
ex) find P(z < 1.75)have:want:ex) find P(z>1.75)if µ=38 and σ=5, find <strong>the</strong> z-score of 31ex) find <strong>the</strong> probability that a man is shorter than 73.2"recall that µ=68 and σ=231 is 1.4 standard deviations below<strong>the</strong> mean of 38ex) find <strong>the</strong> z-scores which determine <strong>the</strong> middle 76% of your datanote: when <strong>the</strong> text asks if something is"unusual"to <strong>the</strong>m, that means a probability less than .05we have covered 7.1, 7.2, 7.3
hw <strong>questions</strong>
hw <strong>questions</strong> 6.1#8
hw <strong>questions</strong> ch7
hw <strong>questions</strong> 7.2, 7.37.3 #7
"area to <strong>the</strong> left is .05"or "5th percentile"note: take z to be positive
hw <strong>questions</strong> ch7
hw <strong>questions</strong>7.3 online)
hw <strong>questions</strong> ch77.2 #4
8.1 What about when you take a sample?when you take a sample size 2 or 3 or whatever, you expect a lower standard deviation(<strong>the</strong> mean is still <strong>the</strong> same)we call that <strong>the</strong> standard deviation of x (also called <strong>the</strong> standard error)notation: σ<strong>the</strong>re is also <strong>the</strong> mean of xnotation: µCentral Limit Theorem:ex) if σ=8 and you take a sample of size n=16, what standard deviation do you get? (i.e.what is σ_ ?)ex) If σ=1.9 and sample size n=20, find your standard deviation σ_note: dont round too much, that error will get bigger in each stepthis is <strong>the</strong> mean, for surethis is <strong>the</strong> standard deviation, for surebut...is <strong>the</strong> distribution of x *normal* (is it a bell curve) ?we want this because <strong>the</strong>n we can figure out all <strong>the</strong> probabilities.......lots of experimenting.....population is normal -> distribution for x is normalpopulation is not normal -> take sample of size 30 (to be safe) <strong>the</strong>ndistribution for x is normal
for adult salmon length, µ=42" and σ=6" (normal distribution), find:a) <strong>the</strong> probability that one salmon is longer than 46"...b) <strong>the</strong> probability that four salmon average longer than 46"formula for z-score: value - meanst.devyou do:ex) µ=78, σ=6, sample size n=10population has normal distributionfind P(x
8.2 distribution of sample related to proportionsex) 62% of mo<strong>the</strong>rs want increased athletic programs in <strong>the</strong> schoolswe write: .62p represents proportion of <strong>the</strong> populationrepresents <strong>the</strong> proportion of <strong>the</strong> sampleex) from a census, 51% of US residents are womennotation: p = .51ex) from a survey of 800 teenagers, 673 like Justin Timberlake's musicnotation:note: you wouldnt say "what is <strong>the</strong> average number ofpeople who like his music"what proportion of teenagers do NOT like his music?notation and formulas ... for proportions:what isnote that this is different than with <strong>the</strong> sample mean x
17% of Americans have high cholesterol. suppose we will take a survey of 80people. what is <strong>the</strong> probability that less than 12% of your sample has high cholesterol?what is µ^ ?what is σ^ ?is <strong>the</strong> distribution of p normal?so, what is <strong>the</strong> probability that less than 12% of your sample has high cholesterol?<strong>the</strong>re are lots of decimal numbers here<strong>the</strong>re are values <strong>the</strong> proportion<strong>the</strong>re are values for probabilityin this problem,proportion is .12probability is .1170be careful as you are doing problems not to confuse <strong>the</strong>m
ex) p = .47 n = 60what is P(p < .43) ?P(p
ex) if p=.28, find P( > .32) with a sample size 180ex) 62% of mo<strong>the</strong>rs want increased athletic fundingwhat is <strong>the</strong> probability that more than 40 out of 60 mo<strong>the</strong>rs will vote for funding?
ex) find P(x>32.7) ... µ=29.6 σ=8.2 n=34 ex) find P(p< .6) ... p=.55 n=80ex) a 2003 study found that medicalresidents work an average of 81.7 hoursper week. suppose <strong>the</strong> number of hoursworked is normally distributed with astandard deviation of 6.9what is <strong>the</strong> probability that <strong>the</strong> meannumber of hours worked by a team of 8residents is less than 75 hours a week?
hw <strong>questions</strong> ch8
hw quetions 8.1, 8.28.2 22a
hw <strong>questions</strong> ch88.1probability that 10 time intervals have a mean of longer than 111 minutesmean time is 96min, normally distributed, st.dev is 30min<strong>the</strong> probability is .0569
hypo<strong>the</strong>sis testing OR testing a claim (ch10)we will do <strong>the</strong> exact same calculations, but we will use it to <strong>answer</strong> a differentquestionfrom before:ex) p = .17 (high cholesterol)in <strong>the</strong> sample, with 80 people: p < .12 ... what is <strong>the</strong> probability of this happeningso far, we said- we know <strong>the</strong> population mean- we know <strong>the</strong> standard deviationOR- we know <strong>the</strong> population proportion...but <strong>the</strong>n why would we take a sample???we will now flip our perspectivewe will take a "guess" about <strong>the</strong> population mean (or proportion) andconsider it, given <strong>the</strong> results of <strong>the</strong> samplee.g. what if our sample had .02 high cholesterol....does it seemreasonable that <strong>the</strong> whole population has .17 high cholesterol?ex) recall that: p=.17 ... n=80 ... ^=.17 ... σ^ = .0420 ... normal distributionfind P(p < .02)hey! was p = .17 correct??
hypo<strong>the</strong>sis testing (formally)1. a claim is made about <strong>the</strong> population2. get data from a sample3. do calculations and assess <strong>the</strong> plausibility of <strong>the</strong> claimhypo<strong>the</strong>sis = claimwhat is a claim?(note: here, we will make claims about µ or p... could make lots of different claims...we will, but later)CLAIM:p = valueex) p = .17 "i think that 17% of Americans have high cholesterol"µ = valueex) µ =40,000 "<strong>the</strong> average income in US is $40,000"µ > valueex) µ>76 "<strong>the</strong> average basketball player is over 76"consider <strong>the</strong> claim µ = 40000if <strong>the</strong> claim is wrong, <strong>the</strong>n µ ≠ 40000set up a hypo<strong>the</strong>sis test....3 waysnote: for technical reasons, H o is always "="what about "≥" ... it gets confusing, so skip itnote that we identify <strong>the</strong> type of hypo<strong>the</strong>sistest (and <strong>the</strong> picture) using H 1
Dick Vitale claims that <strong>the</strong> average college basketball player is over 76"what do you conclude about this claim, from your sample of 40 players with x = 77" (σ =in a hypo<strong>the</strong>sis test,your probability is calleda "level of confidence"if µ=76, <strong>the</strong>n <strong>the</strong> probability that x is 77" or more is .0008 ... thats unlikelyso probably, µ > 76how probably?.9992 probablyconclusion:we are .9992 confident that µ > 76(99.92% confident)
ex) pollution level in a riveran environmental group takes 30 samples from a river, and <strong>the</strong>y get anaverage pollution level of 4.5 cc/L of a certain pollutant (σ = 1.2)<strong>the</strong>y want to claim that <strong>the</strong> average pollution level of <strong>the</strong> river exceeds<strong>the</strong> EPA regulation of 4 cc/Lwhat can you conclude about <strong>the</strong> claim, and at what confidence?heres <strong>the</strong> idea:
ex) we want to to find out if <strong>the</strong> average American family has more than 1.8kids. (because if it does, <strong>the</strong>n <strong>the</strong>re is a strain on <strong>the</strong> school system)we take a sample of 500 families, and we get x = 1.92 σ = .9what can we conclude?conclusion:confidence:we are .9986 (99.86%) confident that <strong>the</strong> average number of kids in an Americanfamily is greater than 1.8p-value:we conclude that <strong>the</strong> average number of kids is above 1.8 with p-value = .0014accept/rejectwe reject Ho, accept H 1 with .9986 confidencenote: strongest results are "100% confidence" or "pvalue=0"note: <strong>the</strong> industry standard for results:you want confidence of .95 (95%) or more ... p-value of .05, or lessQ: in this example, what can you conclude at 95% confidence? (or 5% significance)A: at 95% confidence, reject Ho & accept H 1note that .9986 confidence beats .95 confidence.0014 p-value beats .05 significanceterminology:significanceconfidencep-value = 1 - (confidence)reject/accept[its <strong>the</strong> shaded area]you reject H o and accept H 1 if:(your confidence) > (requested confidence)(your p-value) < (requested significance)
ex) a drug company is trying to make 200mg pills<strong>the</strong>y want to make sure <strong>the</strong>re are exactly 200mg in each pill<strong>the</strong>y take a sample of 500 pills, and find that x = 199.88 σ = .9is <strong>the</strong> average pill different from 200mg? what can <strong>the</strong>y conclude?conclusion:<strong>the</strong> average pill is different from 200mg with .9972 condfidence[pvalue = .0028]reject Ho, accept H1 with 99.72% confidenceQ: what can you conclude at .999 confidence (or .001 significance)?A: at .999 confidence, do not reject Ho, do not accept H 1note: we never "accept Ho"if we think <strong>the</strong> mean is 200 (µ=200), well it could also be 200.0001<strong>the</strong> best we can do is support <strong>the</strong> claim that it is not equal or lessthan or greater than (≠, )
ex) is <strong>the</strong> average fashion model under 102lbs?we asked 50 models, and <strong>the</strong>ir average weight was 97lbs. (σ = 11lbs)what can we conclude?conclusion:we conclude that <strong>the</strong> average model weighs less than 102lbs with 99.93%confidence[p-value = .0007]OR:reject Ho (and accept H1) with 99.93% confidence
hypo<strong>the</strong>sis test about µ, what if we dont know <strong>the</strong> population st.dev σ ?we have to use <strong>the</strong> sample standard deviation s instead...but <strong>the</strong>res a price to pay<strong>the</strong> distribution is no longer normal..so what is <strong>the</strong> distribution? and how do we find probabilities?<strong>the</strong> distribution of x in this case is a Student t distribution..."t distribution"its similar to <strong>the</strong> normal distribution- symmetric- middle value is 0- graph kind of looks like a bell curvewrinkle: <strong>the</strong> distribution changes depending on nwe need "degrees of freedom" = df = n-1note: <strong>the</strong> t-distribution is similar to <strong>the</strong> normal distribution in shape,but it is not <strong>the</strong> samenote: Excel does not like negative t-valuesenter <strong>the</strong> positive value, <strong>the</strong> <strong>answer</strong> is <strong>the</strong> same dueto symmetry
ex) how many M&Ms in a bag?supposed to be 1000, but I claim its more than thatsample 80 bags, get x = 1036 s = 97.3what can you conclude?conclusion:we are 99.93% confident that <strong>the</strong> average number ofM&Ms in a bag is more than 1000 [p-value = .0007]note:when we use s instead of σ,s replaces it in our formulasnote: for t-distribution, Excel requires t-value, cant use xExcel does NOT take negative t-scoresnote: <strong>the</strong> t (or z) value which you calculate from your datais known as <strong>the</strong> test statistic
σhave σ dont have σ, have snote: Excel and <strong>the</strong> t-distributionExcel calculates <strong>the</strong> area in <strong>the</strong> tail (or tails) given a positive t-valuesometimes, you will be asked "what can you conclude at 98% confidence?" OR"what can you conclude at 2% significance?"ex) we are 99.93% confident that <strong>the</strong> average number of M&Ms in a bag is morethan 1000 [p-value = .0007]are you 98% confident? ....yesat 2% significance (or at 98% confidence), reject Ho, accept H 1 , <strong>the</strong> averagenumber of M&Ms is more than 1000ex) we are 89.94% confident that a majority of Americans support <strong>the</strong> deathpenalty[p-value = .1006 or 10.06%]are we 98% confident? ....no, we cannot conclude at 98% confidence (or 2%significance) that a majority supports <strong>the</strong> death penalty - do not reject Ho, do notaccept H 1
ex) does <strong>the</strong> average person own more than 3 hats?you survey 15 people, who respond: 2 5 0 8 3 3 4 3 9 1 2 2 4 12 5what can you conclude, and at what confidence?...what do you need?you can find <strong>the</strong> mean and standard deviation using Excel:type <strong>the</strong> data values into Excel, <strong>the</strong>n...=average(=stdev(...<strong>the</strong>n highlight your data valuesconclusion: we are 91.41% confident that µ>3, <strong>the</strong> average person owns morethan 3 hats. [p-value = .0859]followup:at 10% significance, do you reject H 0 ?at 5% significance, do you reject H 0 ?
ex)H 0 : µ=4H 1 : µ
10.4 hypo<strong>the</strong>sis testing...with proportionsex) H 0 : p = .62H 1 : p < .62p = .54 ... n = 300whats your conclusion about <strong>the</strong> claim, and at what confidence?
ex) does <strong>the</strong> public believe <strong>the</strong> death penalty should be used?we want to find out if a majority of Americans support <strong>the</strong> death penaltywe survey 120 people, and 67 say yes.what can we conclude, and at what confidence?follow-up question: what can you conclude at 5% significance?conclusion:we are 89.97% confident that a majority ofAmericans support <strong>the</strong> death penaltyp > .5 with.8997 confidence[p-value = .1003, or 10.03%]reject H o , accept H 1 with .8997 confidence
ex) do more than 60% of people support legalizing gay marriage?out of 180 people surveyed, 119 said yes.what can you conclude, and at what confidence?conclusion: we are 95.25% confident that p > .6(more than 60% support legalizing gay marriage)reject Ho, accept H 1 with .9525 confidencep-value = .0475
hw <strong>questions</strong> - ch 10
hw <strong>questions</strong>10.3 #2
hw <strong>questions</strong> - ch10
hw <strong>questions</strong> 10.2#15Ho: = 20H1: < 20n=18population is normal= 3x = 18.3we are .9919 confident that < 20reject Ho accept H1 with .9919 confidencep-value = .0081also, with .05 significance, we can conclude < 20 (reject H 0 , accept H 1 )(.05 significance = .95 confidence)
10.6 summary of ch10we have to identify, given a problem, what approach to useex) <strong>the</strong> Health and Safety Board recommends at most 4 hours of tv each day.you think people watch more. you survey 130 people, who watch an average of4.5 hours a day, with a standard deviation of 1.7what can you conclude, and at what confidence?ex) you need to know if proposition 285 will pass with 2 / 3 of <strong>the</strong> vote.you survey 200 people and 141 say yeswhat can you conclude, and at what confidence?ex) gasoline regulations state that gas sold at <strong>the</strong> pump should contain exactly.18 liters of ethanol in each liter of gas. you survey 65 gas stations and find anaverage of .161 liters with a standard deviation of .06what can you conclude and at what confidence?ex) what are <strong>the</strong> average number of large-screen tv's sold at a Best Buy storeyearly?management insists <strong>the</strong>y sell more than 100 tvs. 45 stores are surveyed, and<strong>the</strong>y sell an average of 107.3 (in <strong>the</strong> industry, σ = 25.2)what can you conclude at 95% confidence?ex) <strong>the</strong> US RDA for calcium is 1000mg. <strong>the</strong> Dairy Food Association isconcerned that teens are not getting enough. <strong>the</strong>y conduct a survey of 500teens, who consume an average of 989mg of calcium. from <strong>the</strong> sample,standard deviation s = 110what can you conclude about <strong>the</strong> DFA claim, and at what confidence?ex) is <strong>the</strong> average fashion model under 102lbs?we asked 50 models, and <strong>the</strong>ir average weight was 97lbs. (σ = 11 lbs)what can we conclude?
ex) <strong>the</strong> Health and Safety Board recommends at most 4 hours of tv eachday. you think people watch more. you survey 130 people, who watch anaverage of 4.5 hours a day, with a standard deviation of 1.7what can you conclude, and at what confidence?we are .9995 confident that µ > 4reject H o , accept H 1 with .9995 confidence
ex) you need to know if proposition 285 will pass with 2/3 of <strong>the</strong> vote.you survey 200 people and 141 say yeswhat can you conclude, and at what confidence?we are 87.08% confident that proposition 285 will pass with 2/3 of <strong>the</strong> votereject Ho, accept H1 with .8708 confidencepvalue = .1292
ex) gasoline regulations state that gas sold at <strong>the</strong> pump should contain exactly .18liters of ethanol in each liter of gas. you survey 65 gas stations and find an average of.161 liters with a standard deviation of .06what can you conclude and at what confidence?ex) what are <strong>the</strong> average number of large-screen tv's sold at a Best Buy store yearly?management insists <strong>the</strong>y sell more than 100 tvs. 45 stores are surveyed, and <strong>the</strong>y sellan average of 107.3 (in <strong>the</strong> industry, σ = 25.2)what can you conclude at 95% confidence?on <strong>the</strong> exam you will be given this:Excel commands:NormdistNormsdistNorminvNormsinvTdistTinvAverageStdevsqrt
hw <strong>questions</strong> ch1010.3 #2 online
hw <strong>questions</strong> - ch1010.6 online-5)we are 99.22% confident that µ < 6.4 (p-value = .0078)in particular, at .05 significance we accept <strong>the</strong> claim that µ < 6.4 because pvalue < .05
10.3-online #2)Ho: µ = 1.67H 1 : µ = 1.67x = 1.669s = .0051n = 12 ... df=11sex) what is <strong>the</strong> average age of alllawyers?is it 39, or is it higher?you survey 110 lawyers, who have anaverage age of 40.2, with astandard deviation of 4.1what can you conclude, and at whatconfidence?= tdist(.6667,11,2)= .5187pvalue = .5187confidence = .4813we are .4813 confident that = 1.67we are .9986 confident that > 39pvalue = .0014reject Ho, accept H1 with .9986 confidence, with.0014 significance
ch9now, ask a "two-tail" type question:find P(80 < x < 100) µ=90, σ=20, n=16 population has normal distribution)
why might we wind up with two equal-size tails?- perhaps you are concerned with being, not less, or not more,but ra<strong>the</strong>r "a certain amount away"ex) what is <strong>the</strong> probability that is no more than 10 away from <strong>the</strong> pop.meane.g. could be 10 more, or could be 10 less (but no more than that)with 95.45% confidencehow do we interpret this??suppose we do not know µ but we know xwe can give a range of values for µ at a certain level of confidenceex) suppose you test drive 80 Hondas, and <strong>the</strong>y have an average gas mileage of23mpg. (let σ=4.5)- what is <strong>the</strong> range of values centered around x which with 95% confidence containsµnote!!!for confidence intervals,x is <strong>the</strong> middle valuenote!!!confidence invervals alwayshave two tailshave: zwant: data valuewe are 95% confident that <strong>the</strong> population mean µ is between 22.0139 and 23.9861OR: <strong>the</strong> 95% confidence interval for µ is 22.0139 < µ < 23.9861 OR (22.0139, 23.9861)
ex) what is <strong>the</strong> 98% confidence interval for <strong>the</strong> average age of college students?you do a survey, and x=21.9 σ=6.1 n=120we are 98% confident that <strong>the</strong> population mean is between20.6024 and 23.1976OR: <strong>the</strong> 98% confidence interval for <strong>the</strong> population mean is20.6024 < µ < 23.197621.9 ± 1.2976x is called an estimate or "point estimate" for µex) what is <strong>the</strong> 95% CI for µ (with <strong>the</strong> same information)x=21.9 σ=6.1 n=120ex) if you want a 96% confidence interval, what is your z-score?when you know your level of confidence and you find a z-score,that z-score is called <strong>the</strong> critical value
lets analyze <strong>the</strong> margin of error:CI:what effect does E (<strong>the</strong> margin of error) have on <strong>the</strong> confidence interval?- bigger E -> bigger intervalyou'd like to be as precise as possible saying something about µ...precise means smaller intervalin o<strong>the</strong>r words, you'd like E to be smallwhat can we do to make E small?can we make z smaller?→yes, but...higher confidence -> bigger Esmaller E -> lower confidence
suppose you want 95% confidence. <strong>the</strong>n <strong>the</strong> onlything you control is nalso suppose you want E to be a certain amount:first, recall our confidence interval...x = 21.9n = 120σ = 6.1σ x =<strong>the</strong> 95% CI was:E was:now, what if you still want 95% confidence, but you needyour margin of error to be .4 ... what does n have to be?we can figure this out in general:so in this problem:....parameterx ...point estimate
ex) find <strong>the</strong> 96% CI for µ when x = 38.2 σ = 7.1 n = 60follow-up: what if you want 98% confidence and a margin of error of .8what does n need to be? (still have x = 38.2, σ = 7.1 )
what if you dont know σ ?...use t-distributionex) find <strong>the</strong> 95% CI for µ if we have from our sample, x =124 s=8.6 n=81we are 95% confident that µ is between 122.0983 and 125.9017note!!!in Excel, use "=tinv"type probability, dfget t-scoreBUT you must enter <strong>the</strong>probability for two tailscombined!step 0: check which distribution and formula you need to useex) find <strong>the</strong> average age of all BMCC students. you ask 16 people and get:19 24 45 30 19 18 22 31 39 27 25 20 28 32 18 77find <strong>the</strong> 95% confidence interval ... <strong>the</strong>n do it again without <strong>the</strong> outlier
lets do a confidence interval....for proportionsex) find a 95% CI for p when you take a survey and get:we are 95% confident that p (<strong>the</strong> population proportion) isbetween .57 and .67 (between 57% and 67%)OR p is 62% with a margin of error of 5%note: <strong>the</strong> values for p [.62, .67, .57] are values for <strong>the</strong> proportion, which has to do with ourdata. it does NOT have to do with area/probability. keep track of which is which.note: margin of error. in this example, p = 62% (with a margin of error of ±5%)ex) find <strong>the</strong> CI for p at 96% confidence if p = .38 and n=600
for a CI:if you know <strong>the</strong> estimate (x or p), and you know <strong>the</strong> margin of error E,<strong>the</strong>n find <strong>the</strong> upper and lower valuesex) p = .74, E = .04, <strong>the</strong>n what are <strong>the</strong> upper and lower values?but what about: given <strong>the</strong> upper and lower values, find <strong>the</strong> estimate (x or p) and <strong>the</strong>margin of errorex) your CI is (.52, .58). find <strong>the</strong> estimate p and margin of error E
elationship between confidence level and margin of error:ex)confidence ↑ ... E ↑(it was true for µ,it is true for p)what if you want high confidence AND low margin of error?...have to increase nex) what if you want E = .03 with 95% confidence (take = .5)what does n need to be ?first, we solve <strong>the</strong> general case:we take to be .5 because that is<strong>the</strong> "worst-case scenario" (it gives<strong>the</strong> biggest possible value for n )so: to find n, if you are given p, useit. if not, use p=.5so, in our problem,note: this problem reflects <strong>the</strong> polling industry standardsevery professional poll follows <strong>the</strong> guideline of: 95% confidence and margin of error 3%what do we realize from this?almost every pollster needs 1068 people to askso: go find a newspaper, look for a poll where it has <strong>the</strong> fine print: confidence, E, #people
Confidence Interval Summaryfor mean µ: know σ dont know σ for proportion p:x ± z·σ x ± t·s p ± z·σnote: remember to think about if it is a mean problem or a proportion problem...sometimes you have to calculate <strong>the</strong> proportion, it is not given explicitly[e.g. 67 out of 120 people]given E, find nfor mean:for proportion:
ex) are <strong>the</strong> people in support of stricter gun control laws?out of 400 people surveyed, 296 say yes.what is your 96% confidence interval for p?as a percent: what is <strong>the</strong> point estimate for p? what is your margin oferror?we are 96% confident that between 69.5% and 78.5%of <strong>the</strong> population want stricter gun control lawspoint estimate p = 74%margin or error E = 4.5%ex) if you want E=.05 with 99% confidence (take p = .5)how big does your sample need to be?
Q: we went from using p to using p in <strong>the</strong> formulawhy?...because we have no value for p, only for pdoes it matter?...not much. here's an example why.ex) compare margin of error E at 95% confidence, n = 800, and different values for p:so, does it matter?...not much (as long as <strong>the</strong> values are kind of close)
hw <strong>questions</strong> ch99.3#1 construct a CI for <strong>the</strong> proportionx=125, n=250, 90% confidence
hw <strong>questions</strong> ch9
hw <strong>questions</strong> ch9online 9.1#2confidence interval
hw <strong>questions</strong> ch9
hw <strong>questions</strong> ch9online 9.2#4construct a confidence interval for p if:we are 99% confident that <strong>the</strong> population proportion(p) is between .5271 and .6729
ch11 inferences on two samples (from two populations)compare means, matched pairs (dependent samples)...recall: two different groups, testing <strong>the</strong> outcome for eachpair subjects so that each pair is as identical as possible, <strong>the</strong>n put one in eachtreatmentevery subject (in each treatment) goes through <strong>the</strong> same procedurehow do you organize your data after <strong>the</strong> study?- take <strong>the</strong> average (life span) from group 1 (bmw) and compare it with group 2 (toyota)- go pair by pair, and take difference for each pair, and let <strong>the</strong> difference be your dataclaim: BMW owners live longerex) data pairs:bmw: 81 78 77 85toyota: 79 82 74 78we calculate each difference<strong>the</strong> difference for <strong>the</strong> population (average) is... d (thats like µ)<strong>the</strong> (average) difference from <strong>the</strong> sample is... d (thats like x)so, what are <strong>the</strong> hypo<strong>the</strong>ses?Ho:H 1 :in words, thats like: bmw > toyota(bmw) - (toyota) > 0so, d > 0conclusion: we are 77.82% confident that we reject Ho, accept H1, that d >0bmw owners live longer [p-value = .2218]solve it by STATDISK ... instead of by handnote: if <strong>the</strong> claim is "morethan 5 years longer", <strong>the</strong>n H 1
ex) are men paid a higher salary (for <strong>the</strong> same job) than women?Ho: d = 0H1: d > 0conclusion: we are 97.74% confident that we rejectH o , accept H 1 , d>0, men get paid a higher salary thanwomen [p-value = .0226]also: Confidence Intervalex, continued) find <strong>the</strong> 95% CI for <strong>the</strong> difference between male andfemale salariesrecall: x ± z·σ_now:d ± t·s_<strong>the</strong> 95% confidence interval for <strong>the</strong> difference betweenmale and female salaries is (69.73, 5130.27)note that you must find <strong>the</strong> t-score for a 95% CIyou DO NOT use <strong>the</strong> t-score you found before - that was for adifferent confidence level!
hypo<strong>the</strong>sis test for two samples...proportionsex) claim that proportion of men who are smokers is higher than proportionof women who are smokersp 1: proportion of men who smoke ... p 2: proportion of women who smokeHo: p 1 = p 2H1: p 1 > p 2out of 2103 men, 547 smokeout of 1671 women, 368 smoke<strong>the</strong>re will be indices (little 1's and 2's) everywhere,because we need to indicate which population we arerefering tonote: compare as a whole population, notperson - <strong>the</strong>res no such thing as aproportion for one person=SQRT(0.2601*(1-0.2601)/2103+0.2202*(1-0.2202)/1671)we conclude with .9979 confidence that p 1 > p 2OR we reject Ho and accept H1 with 99.79% confidenceOR <strong>the</strong> proportion of men who smoke is greater than <strong>the</strong> proportion of womenwho smoke [pvalue = .0021]
to do a confidence interval for <strong>the</strong> difference between proportions:we do CI for (p 1 - p 2 )recall: <strong>the</strong> CI for p is p ± z·σnow: <strong>the</strong> CI for p 1 - p 2 is: p 1 - p 2 ± z·σex) p 1 = .2601 p 2 = .2202 find <strong>the</strong> 95% CI for p 1 - p 2our 95% CI for p 1 - p 2 is (.0127, .0671)OR we are 95% confident that p 1 - p 2 is between .0127 and.0671
you do:ex) out of 200 men surveyed, 55% believe abortion should be legalout of 250 women surveyed, 62% believe abortion should be legala) how confident are you that a greater proportion of women believeabortion should be legal?b) find a 95% CI for <strong>the</strong> difference in proportionswe are .9332 confident that p 1 > p 2 (or p 1 - p 2 > 0 )a higher proportion of women believe abortion should be legal[pvalue is .0668]we reject H o with 93.32% confidence
hw <strong>questions</strong> - ch1111.1 #14x: .582 .481 .841 .267 .685 .450 (blue)y: .408 .407 .542 .402 .456 .533 (red)is <strong>the</strong> blue time different from <strong>the</strong> red time?Ho: b = r b - r = 0H1: b ≠ r b - r ≠ 0-> matched pairs designd: .174 .074 .299 -.135 .229 -.083mean for d = d = .093st.dev for d = s = .1737st.dev for d = s d = .1737 = .0709t = .093 - 0 = 1.3117.0709use StatDisk to get probabilities...conclusion: we are 75.34% confident that <strong>the</strong> blue time is different from <strong>the</strong> red timereject Ho, accept H1 with 75.34% confidencep-value = .2466at 1% significance (which is 99% confidence) we cannot reject Hoc) make a 95% confidence intervalCI: d + ts d.093 + (2.5706)(.0709).093 + .1823OR (-.0893, .2753)use Statdisk to get t-score=SQRT(0.1076*(1-0.1076)/251+0.0987*(1-0.0987)/314)
hw <strong>questions</strong> ch11
linear correlation and regression [ch4.1,2]describing <strong>the</strong> relationship between two variables ...highlightswhat does correlation mean?...it means that you have two variables and one is related to <strong>the</strong> o<strong>the</strong>rspecifically in statistics, correlation means you have two quantitative variables,and saying <strong>the</strong>y are (linearly) correlated means that as one variable goes up, <strong>the</strong> o<strong>the</strong>rvariable tends to go up (or down)[recall, linear means straight line]what two quantitative variables might be correlated?ex) years of employment & salary....<strong>the</strong> more years of employment, <strong>the</strong> higher your salarywhat is a positive correlation? if one goes up, <strong>the</strong> o<strong>the</strong>r tends to go upwhat is a negative correlation? if one goes up, <strong>the</strong> o<strong>the</strong>r tends to go downnote: no calculations by hand (because <strong>the</strong>yre very long) - we will use technologywhat is a scatter plot?when you have a scatter plot, what is <strong>the</strong> line of best fit?go to my website, click on 'activities', click on 'regression' and play <strong>the</strong> game
scatter plot: <strong>the</strong> graph of (x,y) data pointsr: linear correlation coefficientit measures how strong <strong>the</strong> (linear) relationship is between X and Yr will be positive if: as X goes up, Y goes up (positive correlation)r will be negative if: as X goes up, Y goes down (negative correlation)if <strong>the</strong> relationship is exactly linear - all points are on a straight line<strong>the</strong>n r = 1 (or -1)if <strong>the</strong>re is no linear relationship<strong>the</strong>n r = 0-1 ≤ r ≤ 1go to my website, click on 'activties', click on 'correlation' and play <strong>the</strong> gamenote: r measures <strong>the</strong> strength of <strong>the</strong> correlationslope measures <strong>the</strong> slope of <strong>the</strong> liner-squared: coefficient of determinationit measures <strong>the</strong> proportion (percentage) of <strong>the</strong> variation from <strong>the</strong> meanpredicted by <strong>the</strong> line of best fitif r 2 = 1, <strong>the</strong>n our line predicts our data perfectly ... in o<strong>the</strong>r words <strong>the</strong>data is in a straight lineif r 2 = 0, <strong>the</strong> data is scattered all over <strong>the</strong> place ... in o<strong>the</strong>r words, nolinear relaionship at all...we will say more about r 2 later
Doing Regression and Correlation using StatDiskand interpreting <strong>the</strong> resultscorrelationrr 2y ("y-hat", <strong>the</strong> line of best fit)slopeinterceptpredictionresidualto use StatDisk:1 type in your data2 click 'analysis'3 click 'correlation and regression'4 make sure you have <strong>the</strong> proper columns selected for <strong>the</strong> x-variable and y-variable5 click 'evaluate'ex) bears: x=age y=weightwhat is r ? r 2 ?line of best fit:predict what a 31-month-old bear would weigh:x: explanatory variable (input)y: response variable (output)<strong>the</strong> average bear weighs 207kgi found a 31-month old bear!it weighs 143 kg143 - 207 = -64 ... total variation = (actual) - (mean)149.16 - 207 = -57.84 ... explained variation = (prediction) - (mean)143 - 149.16= -6.16 ... unexplained variation or residual = (actual) - (prediction)you do: for bears "headwidth" (x) and "neck" (y), find r, r 2 , line of best fit.if headwidth=7.5, predict <strong>the</strong> neck sizefor bear #7, find <strong>the</strong> total variation, explained variation, unexplained variationalso, what does <strong>the</strong> slope tell you?how much y increases as x increasesex) here, y = 1.64 + 3.05xso that tells you that <strong>the</strong> rate of increase is 3.05... in o<strong>the</strong>r words every time x increases 1, y increases 3.05
a bit about r 2 , and <strong>the</strong> 3 variationsex) 4.1 #32 ... scatter plot and (approximate) line of best fitto find r 2 by hand,square each of <strong>the</strong> explained variations, and add <strong>the</strong>m upsquare each of <strong>the</strong> total variations, and add <strong>the</strong>m updivide explained/total - thats r 2(and thats why we dont do it by hand!)
Probability [ch5]...from a more ma<strong>the</strong>matical point of viewquestion:suppose a family has two kids. if one kid is a boy, what is <strong>the</strong> probability that <strong>the</strong>o<strong>the</strong>r is a girl?guess:...we will come back and <strong>answer</strong> this.....i promise <strong>the</strong> <strong>answer</strong> will surprise youprobability measures <strong>the</strong> likelihood of an outcome (or event)ex) if you flip a coin, what isP(head) =if you roll a die, what is P(1 or 2) ?what is <strong>the</strong> probability that if you guess someone's birthday, you are correct?P(correct) =x = <strong>the</strong> number of ways an event can happenn = <strong>the</strong> total number of possibilities0 ≤ prob ≤ 1prob = 0 ... impossible eventex) flip a coin, get 'blue'prob = 1 ... certain eventex) roll a die, P(roll is less than 7)in a given scenario, all probabilities must add to 1
ex) pick a card from a 52-card deckP(king) =P(heart)P(spade)P(spade OR heart)addition rule for disjoint eventsdisjoint: no overlapP(king OR spade)P( E or F ) = P(E) + P(F)P( not a heart )general addition ruleP( E or F ) = P(E) + P(F) - P( E and F )P(heart) + P(not heart) = 1P(not heart) = 1 - P(heart)complement ("not")notation:
finding probabilities from real-world dataex) P(a person in <strong>the</strong> US was never married)ex) P(a person in <strong>the</strong> US was widowed)P(person in <strong>the</strong> US not widowed)you do:ex) from a 52-card deck, pull 1 cardP(jack or "10")=P("2" or "3" or "heart")=ex) P(someone is born on weekend)=
ex) flip a coin *twice*P(two heads)...guess:compound eventif you can say "first event THEN second event"that means that you have a compound event[different from: draw one card and see if it isa king OR spade ... that is one event]how do you find probabilities in a compound event?first lets look at finding "n"ex) n = 4 comes from (2)(2) ....two possible outcomes on <strong>the</strong> first flip,two possible outcomes on <strong>the</strong> second flipso it makes sense that to find <strong>the</strong> probability, we are going to multiplyP(HH)ex) flip a coin 4 times...find P(HHTH)*** flip a coin 4 times...P(3 heads) =
ex) roll a dieP(roll a 6, <strong>the</strong>n a 3, <strong>the</strong>n a 2...in that order)ex) flip a coin 3 times. what is <strong>the</strong> probability you getno heads?at least one head?"at least one" is <strong>the</strong> opposite of "none"you do:ex) P(from two people, no one born on a tuesday)ex) P(from two people, at least one born on a tuesday)ex) flip a coin, roll a die ... P(head, 5)ex) suppose P(sunny day) = .6 ... over three days, P(sun, no sun, sun)***ex) roll two dice ... P(sum is 2)***ex) P(roll a die four times, get four different numbers)recall: suppose a family has two kids. if one kid is a boy, what is <strong>the</strong>probability that <strong>the</strong> o<strong>the</strong>r is a girl?moral: probability can be very tricky, even counter-intuitive