Please answer the following questions:
Please answer the following questions:
Please answer the following questions:

Create successful ePaper yourself
Turn your PDF publications into a flip-book with our unique Google optimized e-Paper software.
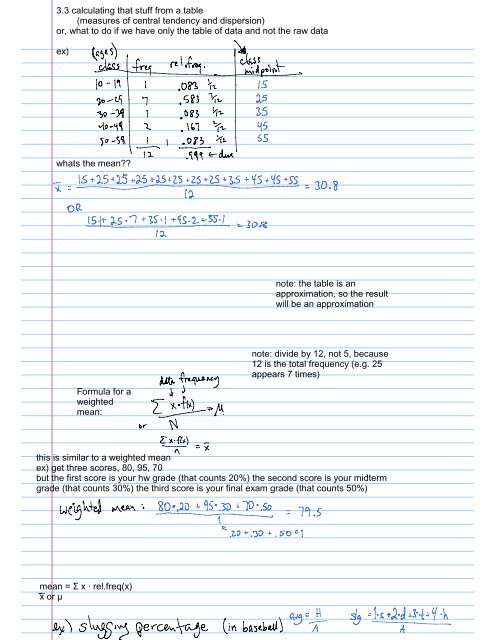
3.3 calculating that stuff from a table(measures of central tendency and dispersion)or, what to do if we have only <strong>the</strong> table of data and not <strong>the</strong> raw dataex)whats <strong>the</strong> mean??note: <strong>the</strong> table is anapproximation, so <strong>the</strong> resultwill be an approximationFormula for aweightedmean:note: divide by 12, not 5, because12 is <strong>the</strong> total frequency (e.g. 25appears 7 times)this is similar to a weighted meanex) get three scores, 80, 95, 70but <strong>the</strong> first score is your hw grade (that counts 20%) <strong>the</strong> second score is your midtermgrade (that counts 30%) <strong>the</strong> third score is your final exam grade (that counts 50%)mean = Σ x · rel.freq(x)x or µ