

Design For Deconstruction - US Environmental Protection Agency
Design For Deconstruction - US Environmental Protection Agency
Design For Deconstruction - US Environmental Protection Agency

You also want an ePaper? Increase the reach of your titles
YUMPU automatically turns print PDFs into web optimized ePapers that Google loves.
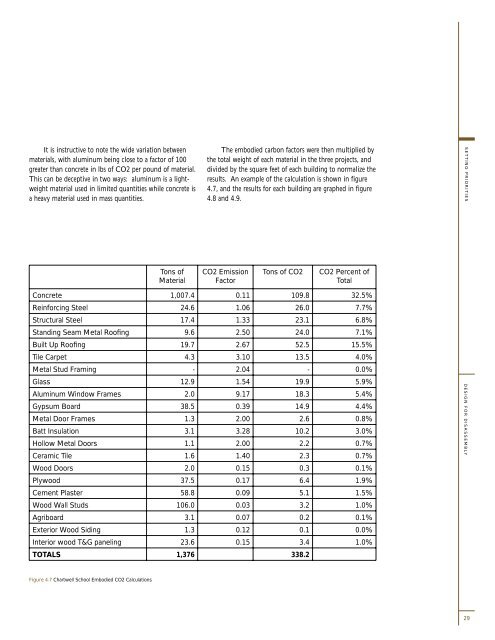
It is instructive to note the wide variation between<br />
materials, with aluminum being close to a factor of 100<br />
greater than concrete in lbs of CO2 per pound of material.<br />
This can be deceptive in two ways: aluminum is a lightweight<br />
material used in limited quantities while concrete is<br />
a heavy material used in mass quantities.<br />
Tons of<br />
Material<br />
The embodied carbon factors were then multiplied by<br />
the total weight of each material in the three projects, and<br />
divided by the square feet of each building to normalize the<br />
results. An example of the calculation is shown in figure<br />
4.7, and the results for each building are graphed in figure<br />
4.8 and 4.9.<br />
CO2 Emission<br />
Factor<br />
Tons of CO2 CO2 Percent of<br />
Total<br />
Concrete 1,007.4 0.11 109.8 32.5%<br />
Reinforcing Steel 24.6 1.06 26.0 7.7%<br />
Structural Steel 17.4 1.33 23.1 6.8%<br />
Standing Seam Metal Roofi ng 9.6 2.50 24.0 7.1%<br />
Built Up Roofi ng 19.7 2.67 52.5 15.5%<br />
Tile Carpet 4.3 3.10 13.5 4.0%<br />
Metal Stud Framing - 2.04 - 0.0%<br />
Glass 12.9 1.54 19.9 5.9%<br />
Aluminum Window Frames 2.0 9.17 18.3 5.4%<br />
Gypsum Board 38.5 0.39 14.9 4.4%<br />
Metal Door Frames 1.3 2.00 2.6 0.8%<br />
Batt Insulation 3.1 3.28 10.2 3.0%<br />
Hollow Metal Doors 1.1 2.00 2.2 0.7%<br />
Ceramic Tile 1.6 1.40 2.3 0.7%<br />
Wood Doors 2.0 0.15 0.3 0.1%<br />
Plywood 37.5 0.17 6.4 1.9%<br />
Cement Plaster 58.8 0.09 5.1 1.5%<br />
Wood Wall Studs 106.0 0.03 3.2 1.0%<br />
Agriboard 3.1 0.07 0.2 0.1%<br />
Exterior Wood Siding 1.3 0.12 0.1 0.0%<br />
Interior wood T&G paneling 23.6 0.15 3.4 1.0%<br />
TOTALS 1,376 338.2<br />
Figure 4.7 Chartwell School Embodied CO2 Calculations<br />
SETTING PRIORITIES DESIGN FOR DISASSEMBLY<br />
29


