MORE GUIDANCE, BETTER RESULTS?
MORE GUIDANCE, BETTER RESULTS?
MORE GUIDANCE, BETTER RESULTS?

Create successful ePaper yourself
Turn your PDF publications into a flip-book with our unique Google optimized e-Paper software.
OPENING DOORS<strong>MORE</strong> <strong>GUIDANCE</strong>,<strong>BETTER</strong> <strong>RESULTS</strong>?Three-Year Effects of an Enhanced Student ServicesProgram at Two Community CollegesSusan ScrivenerMichael J. WeissAUGUST 2009mdrcBUILDING KNOWLEDGETO IMPROVE SOCIAL POLICY
More Guidance, Better Results?Three-Year Effects of an Enhanced Student ServicesProgram at Two Community CollegesSusan ScrivenerMichael J. WeisswithJedediah J. TeresAugust 2009
Funders of the Opening Doors ProjectThe Annie E. Casey FoundationCharles Stewart Mott FoundationFord FoundationThe George Gund FoundationThe James Irvine FoundationThe Joyce FoundationKnowledgeWorks FoundationLumina Foundation for EducationMacArthur Foundation Research Network on Socioeconomic Status and HealthMacArthur Foundation Research Network on Transitions to AdulthoodNational Institutes of Health, National Institute of Child Health and Human Development(RO1 HD046162)Princeton University Industrial Relations SectionRobin Hood FoundationThe Spencer FoundationU.S. Department of EducationU.S. Department of LaborThe William and Flora Hewlett FoundationWilliam T. Grant FoundationDissemination of MDRC publications is supported by the following funders that help financeMDRC’s public policy outreach and expanding efforts to communicate the results and implicationsof our work to policymakers, practitioners, and others: The Ambrose Monell Foundation, The AnnieE. Casey Foundation, Carnegie Corporation of New York, The Kresge Foundation, Sandler Foundation,and The Starr Foundation.In addition, earnings from the MDRC Endowment help sustain our dissemination efforts. Contributorsto the MDRC Endowment include Alcoa Foundation, The Ambrose Monell Foundation,Anheuser-Busch Foundation, Bristol-Myers Squibb Foundation, Charles Stewart Mott Foundation,Ford Foundation, The George Gund Foundation, The Grable Foundation, The Lizabeth and FrankNewman Charitable Foundation, The New York Times Company Foundation, Jan Nicholson, PaulH. O’Neill Charitable Foundation, John S. Reed, Sandler Foundation, and The Stupski Family Fund,as well as other individual contributors.The findings and conclusions in this report do not necessarily represent the official positions orpolicies of the funders.For information about MDRC and copies of our publications, see our Web site: www.mdrc.org.Copyright © 2009 by MDRC. ® All rights reserved.
OverviewOver the past four decades, community colleges have played an increasingly importantrole in higher education. Today, community colleges — which are accessible and affordable,relative to four-year institutions — enroll more than one in every three postsecondary educationstudents. Unfortunately, among students who enroll in community colleges with the intentto earn a credential or transfer to a four-year institution, only 51 percent achieve their goalwithin six years. These students may face fewer difficulties and make better academic progressif they had better access to, or more adequate, student services, but, as it stands, student-tocounselorratios at community colleges are often more than 1,000 to 1, limiting the assistancethat students receive.As part of MDRC’s multisite Opening Doors demonstration, Lorain County CommunityCollege and Owens Community College in Ohio ran a program that provided enhancedstudent services and a modest stipend to low-income students. Students in the Opening Doorsprogram were assigned to one of a team of counselors, with whom they were expected to meetat least two times per semester for two semesters to discuss academic progress and resolve anyissues that might affect their schooling. Each counselor worked with far fewer students than didthe regular college counselors, which allowed for more frequent, intensive contact. Participatingstudents were also eligible for a $150 stipend for two semesters, for a total of $300.To estimate the effects of the program, MDRC worked with the colleges to randomlyassign students either to a program group, whose members were eligible for the Opening Doorsservices and stipend, or to a control group, whose members received standard college servicesand no Opening Doors stipend. Any subsequent substantial differences in academic and otheroutcomes can be attributed to the program. This study’s findings include the following:• The program improved academic outcomes during the second semester that studentswere in the study. Program group students registered for at least one course during thesecond semester at a higher rate than did control group students and earned an average ofhalf a credit more during the semester. The registration impact is likely primarily the effectof Opening Doors services provided during the first semester. The program did not substantiallyaffect outcomes during the first semester.• After students in the Opening Doors program received their two semesters of enhancedcounseling services, the program continued to have a positive effect on registrationrates in the semester that followed. The program did not, however, meaningfullyaffect academic outcomes in subsequent semesters. The program did notsignificantly increase the average number of credits that students earned after the counselingprogram ended or over the study’s three-year follow-up period.iii
ContentsOverviewList of Tables, Figures, and BoxesPrefaceAcknowledgmentsExecutive SummaryiiiviiixxiES-1Chapter1 Introduction 1Overview of the Opening Doors Demonstration and Evaluation 2Background on Student Services at Community Colleges 4The Remainder of This Report 112 The Sites, Sample, and Data Sources 13The Participating Colleges 13Identifying, Recruiting, and Randomly Assigning Students 15Characteristics of the Sample 17Data Sources and Follow-Up Periods 213 The Implementation of the Ohio Opening Doors Program 25History of the Opening Doors Program in Ohio 25Implementation of the Opening Doors Program 26Differences Between the Opening Doors Program andthe Control Group Environment 35Students’ Experiences in the Opening Doors Program and the Control GroupEnvironment 37Looking to the Report’s Next Chapter 414 The Effects of Enhanced Student Services and a Modest Stipend 43Effects on Education Outcomes: Transcript Measures 44Effects on Enrollment, Including Other Institutions: Clearinghouse Data 53Effects on Financial Aid 56Effects on Social, Psychological, and Health Outcomes 595 Summary and Conclusions 61Interpreting the Program’s Impacts 64v
AppendixA Supplementary Baseline Information 67B Survey Response Analysis 81C Supplementary Tables for Chapter 3 103D Description of Scales Presented in Chapters 3 and 4 109E Supplementary Tables for Chapter 4 117References 141Earlier MDRC Publications on Opening Doors 143vi
List of Tables, Figures, and BoxesTable1.1 Opening Doors Programs and Target Groups 32.1 Selected Characteristics of Sample Members at Baseline 183.1 Opening Doors Counseling Sessions Among the Program Group Members 313.2 Opening Doors Stipend Receipt Among the Program Group Members 343.3 Key Differences Between the Opening Doors Program andRegular College Services 363.4 Sample Members’ Receipt of Student Services 373.5 College Experiences of Sample Members 404.1 Transcript Outcomes, First and Second Program Semesters 474.2 Transcript Outcomes, First Through Fourth Postprogram Semesters 494.3 Cumulative Transcript Outcomes, First Program Semester ThroughThird Postprogram Semester 514.4 Enrollment at Opening Doors Institutions and Other Institutions,First Program Semester Through Fourth Postprogram Semester 544.5 Impacts on Sample Members’ Financial Aid Exclusive of Opening Doors, FirstProgram Semester Through Third Postprogram Semester 57A.1 Selected Characteristics of Sample Members at Baseline 70A.2 Selected Characteristics of Sample Members at Baseline: Lorain CountyCommunity College 74A.3 Selected Characteristics of Sample Members at Baseline:Owens Community College 77B.1 Selected Characteristics of 12-Month Survey Respondents and Nonrespondents 85B.2 Selected Characteristics of 12-Month Survey Respondents and Nonrespondents:Lorain County Community College 88B.3 Selected Characteristics of 12-Month Survey Respondents and Nonrespondents:Owens Community College 91B.4 Selected Characteristics of 12-Month Survey Respondents, by Research Group 94B.5 Selected Characteristics of 12-Month Survey Respondents, by Research Group:Lorain County Community College 97B.6 Selected Characteristics of 12-Month Survey Respondents, by Research Group:Owens Community College 100vii
C.1 Opening Doors Counseling Sessions Among the Program Group Members,by College 105C.2 Opening Doors Stipend Receipt Among the Program Group Members,by College 106C.3 Receipt of Student Services, by College 107C.4 College Experiences of Sample Members, by College 108E.1 Transcript Outcomes, by College, First and Second Program Semesters 119E.2 Transcript Outcomes, by College, First Through Fourth Postprogram Semesters 121E.3 Cumulative Transcript Outcomes, by College, First Program SemesterThrough Third Postprogram Semester 124E.4 Transcript Outcomes, by Gender, First and Second Program Semesters 125E.5 Transcript Outcomes, by Gender, First Through Fourth Postprogram Semesters 127E.6 Cumulative Transcript Outcomes, by Gender, First Program SemesterThrough Third Postprogram Semester 130E.7 Enrollment at Opening Doors Institutions and Other Institutions, by College,First Program Semester Through Fourth Postprogram Semester 131E.8 Impacts on Sample Members’ Financial Aid Exclusive of Opening Doors,by College, First Program Semester Through Third Postprogram Semester 134E.9 Social, Psychological, and Health Measures of Sample Members at Baseline 137E.10 Social and Psychological Outcomes 138E.11 Health Outcomes 140FigureES.1 Effects on Registration Rates ES-5ES.2 Effects on Average Cumulative Credits Earned ES-75.1 Percentage of Sample Members Who Registered for Any Courses,First Program Semester Through Fourth Postprogram Semester 625.2 Cumulative Credits Earned, First Program Semester Through ThirdPostprogram Semester 63Box3.1 How to Read the Impact Tables in This Report 39viii
PrefaceIf approved by Congress, the Obama Administration’s College Access and CompletionFund will provide $2.5 billion to states over five years to help them implement programs to increasecollege completion. This goal is of particular concern to community colleges, which accountfor approximately 40 percent of all college enrollments in this country and where roughlyhalf of all students do not complete their studies within six years. These schools serve disproportionatenumbers of low-income students, students of color, immigrants, and first-generationcollege students, who may need guidance in overcoming such barriers to success as inadequateacademic preparation, the need to juggle school with work and family obligations, financialconstraints, and other personal difficulties.There is widespread belief among community college leaders that strengthening studentservices is key to improving academic outcomes. Unfortunately, student services are severelyunder-resourced at most community colleges: student-to-counselor ratios often exceed 1,000 to1, seriously limiting the assistance that students receive. A recent national survey of enteringcommunity college students found that half did not meet with or recall seeing an adviser duringtheir first four weeks of college. Thus, when policymakers and college administrators point tolow persistence and graduation rates in community colleges, they often look to student supportservices as a possible solution. Such services can include orientation for new students, academicadvising, financial aid counseling, career planning, job placement assistance, and other services.This report presents the results of a study at two community colleges in Ohio that testedthe use of enhanced student services for low-income students. The study was one of a very fewthat has used an experimental design to evaluate community college student services. The student-to-counselorratio in the program was vastly lower than that in a control group, who receivedonly the regular college services, and the program services were more intensive, comprehensive,and personalized. Students in the program group also received a small stipend as anincentive to meet with their counselors. The program, which increased the frequency of academicand financial aid advising, and other student services, generated initial improvements inacademic outcomes and retention rates. However, for the most part, these effects did not persistonce the program ended.While the Opening Doors program in Ohio did not have an effect on students’ longtermoutcomes, it does leave us with a rough template for crafting an improved program and itraises valuable questions for future research. Would enhanced student services have longer-termimpacts, for example, if they were more comprehensive, were offered for a longer period, orwere paired with other reforms? It is our hope that community college administrators and policymakerswill continue to consider alternative frameworks for providing services to strugglingstudents that will help them overcome the barriers they face so they can succeed in school.Gordon BerlinPresidentix
AcknowledgmentsThe Opening Doors demonstration has received support from several foundations andgovernment agencies, which are listed at the front of this report. We are grateful for their generousbacking and ongoing commitment. We owe special thanks to Lumina Foundation forEducation for providing the early support that made the demonstration possible and the fundsthat allowed the completion of this report. We also owe thanks to the funders that focused inparticular on the demonstration at Lorain County Community College and Owens CommunityCollege: The George Gund Foundation, The Joyce Foundation, and KnowledgeWorksFoundation. We are grateful to Brett Visger, who worked at KnowledgeWorks when thedemonstration began, for providing us with introductions and access to the Ohio colleges.We are also grateful to the administrators and staff at Lorain and Owens who rose tothe challenge of developing and running a new program and participating in a complex researchproject. Space does not permit us to name everyone who has played a role in OpeningDoors, but we want to particularly acknowledge some individuals. Lorain’s President RoyChurch and Owens’s President Christa Adams supported the project from its inception andprovided crucial leadership. At Lorain, Judith Crocker, Mary Murphy, and Joe Fraconnaworked closely with MDRC to develop the program model and fit the study’s research proceduresinto the college’s operations. Judith has continued to work with MDRC throughout theproject and reviewed an earlier draft of this report. At Owens, Linda Stacy, Bill Ivoska, DonnaGruber, and Chip Campbell worked with MDRC to adapt the program for their college andset up the study’s research procedures. Donna and Bill have served as our contacts at the college,and Bill reviewed an earlier draft of this report.The Opening Doors coordinator and counselors at each college brought the programmodel to life. Ray Kneisel coordinated the program at Lorain, and Laura Hiss and Kita Grahamplayed that role at Owens. They and the other Opening Doors counselors — Carrie Delaney,Maureen Hess, Eddie Henson, and Pat Zolman at Lorain; and Gwen Ames, Anna Cihak, PatDymarkowski, Beth Senecal, and Amy Towner at Owens — devoted a lot of time and effort torecruiting and assisting students. Mary Szabados at Lorain and Laurene Markis at Owens assistedwith recruitment and provided valuable administrative support. We appreciate everyone’swillingness to participate in various activities related to the study, including interviews withMDRC staff during numerous campus visits. Finally, we appreciate the help of the followingindividuals who provided student records data to MDRC: Stacy Lease, Lu Phillips, and DianaSmarsh at Lorain; and Jason Stokes and Matthew Lewis at Owens.Many MDRC staff members have contributed to Opening Doors and to this report.Robert Ivry developed the demonstration, helped design the Ohio program, and providedxi
guidance on the study. Thomas Brock led the evaluation of the Opening Doors programs andhelped set up the demonstration at Lorain. Two former MDRC employees played central rolesin the study in Ohio. Melissa Wavelet worked closely with the colleges’ administrators to designthe program and offered guidance to help them deliver services to students as intended.Janelle Stevens worked with Melissa and one of this report’s authors on all aspects of thedemonstration at the colleges. JoAnna Hunter worked with Battelle Memorial Institute toconduct the 12-month survey in Ohio. Colleen Sommo oversaw the collection of the quantitativedata used in this report, and former MDRC staff members Laura Llamado, Sarah Spell,Jenny Au, Michael Pih, and Asa Wilks programmed the data. The current MDRC staff mentioned,along with John Hutchins, Charles Michalopoulos, and Lashawn Richburg-Hayes,reviewed earlier drafts of this report and provided helpful comments. Erin Coghlan assisted inthe production of the report and conducted fact-checking. Joel Gordon, Galina Farberova, andShirley James and her staff developed and monitored the random assignment and baselinedata collection process. Alice Tufel edited the report, and Stephanie Cowell and David Sobelprepared it for publication.Finally, we would like to thank the hundreds of students who participated in the studyat Lorain and Owens, and, in particular, those who answered surveys or participated in interviews.All were low-income students striving to get an education, most while juggling workand family responsibilities. We hope that the findings from the study in Ohio and the othersites in Opening Doors will be used to improve college programs and services for them andothers in the future.The Authorsxii
Executive SummarySince the mid-1960s, access to higher education has expanded dramatically, and communitycolleges have played an increasingly important role. Today, community colleges —which are accessible and affordable, relative to four-year institutions — enroll more than one inevery three postsecondary education students. 1 Unfortunately, among students who enroll incommunity colleges with the intent to earn a credential or transfer to a four-year institution, only51 percent achieve their goal within six years. 2 Institutional barriers, including inadequatestudent services, can impede community college students’ academic progress. Student-tocounselorratios at community colleges are often more than 1,000 to 1, limiting the assistancethat students receive. 3This report presents results from a rigorous study of a program that provided enhancedstudent services and a modest stipend to low-income students at two community colleges inOhio. The program was run as part of MDRC’s multisite Opening Doors demonstration, whichtested different programs to help students succeed in community college. At Lorain CountyCommunity College and Owens Community College, students in the Opening Doors programwere assigned to one of a team of counselors, with whom they were expected to meet at leasttwo times per semester for two semesters to discuss academic progress and resolve any issuesthat might affect their schooling. Each counselor worked with far fewer students than theregular college counselors did, which allowed for more frequent, intensive contact. Participatingstudents were also eligible for a $150 stipend for two semesters, for a total of $300.To estimate the effects of the program, MDRC randomly assigned students either to aprogram group, whose members were eligible for the Opening Doors services and stipend, or toa control group, whose members received standard college services and no Opening Doorsstipend. Any subsequent substantial differences between the two groups in academic and otheroutcomes can be attributed to the program.In summary, the key findings from this report are:1 Stephen Provasnik and Michael Planty, Community Colleges: Special Supplement to the 2008 Conditionof Education (Washington, DC: U.S. Department of Education, National Center for Education Statistics, 2008).2 Gary Hoachlander, Anna Sikora, and Laura Horn, Community College Students: Goals, Academic Preparation,and Outcomes (Washington, DC: U.S. Department of Education, National Center for EducationStatistics, 2003).3 Norton W. Grubb, ‘Getting into the World’: Guidance and Counseling in Community Colleges (NewYork: Community College Research Center, Teachers College, Columbia University, 2001), 6.ES-1
• The Ohio colleges successfully delivered enhanced student services and amodest stipend to participating students. Program group students reported receivingmore academic advising, financial aid advising, and other student services,compared with control group members. Approximately 9 of every 10 programgroup members received at least one stipend payment.• The program improved academic outcomes during the second semester thatstudents were in the study. Program group students registered for classes at ahigher rate than did control group students and earned an average of half a creditmore during the second semester. The registration impact is likely primarily theeffect of Opening Doors services provided during the first semester, since registrationfor the next semester typically occurred before the semester actually began.The program did not substantially affect outcomes during the first semester.• The program increased registration rates during the first “postprogram”semester — that is, the semester after the program’s enhanced counselingservices ended. The program did not, however, meaningfully affect academicoutcomes in the subsequent semesters. The program did not significantly increasethe average number of credits that students earned during the first semesterafter the program ended or over the study’s three-year follow-up period.How Was the Program Evaluated?To understand how the Opening Doors program was implemented, MDRC staff interviewedmany Lorain and Owens administrators, faculty, and staff. MDRC also analyzed datafrom the colleges about the Opening Doors counseling and stipends, and data from a survey thatwas administered to study participants about a year after random assignment.To estimate the effect, or “impact,” of the Opening Doors program, MDRC assignedstudents at the two colleges, at random, to either a program group or a control group. The studytracked both groups over time, using transcript data from the colleges, to determine whether theprogram improved academic outcomes for students. Random assignment ensures that thecharacteristics, including motivation levels and demographic characteristics, of students in theprogram group and control group are similar when a study begins; hence, any subsequentsubstantial differences in outcomes can be attributed to the program. This study, therefore, isestimating the value added of the Opening Doors program, above and beyond what studentsnormally receive.ES-2
Whom Did the Programs Serve?Lorain and Owens targeted students for their Opening Doors program who were between18 and 34 years old, had family income below 250 percent of the federal poverty level,had a high school diploma or General Educational Development (GED) certificate, and wereeither beginning freshmen or continuing students who had completed fewer than 13 credits andhad experienced academic difficulties (indicated by not passing courses or withdrawing fromcourses). The program was open to both part-time and full-time students.Over a period of several semesters, a total of 2,139 students were randomly assigned forthe study in Ohio — 1,073 in the program group and 1,066 in the control group. About 42percent of the sample members are from Lorain and 58 percent are from Owens.Approximately three-fourths of the sample members are women. Fifty-four percent ofthe sample members identified themselves as white, 30 percent as black, and 11 percent asHispanic/Latino. With an average age of 24 (at the point of random assignment), the sample issomewhat older than a traditional college-going population. Many sample members are singleparents, balancing family responsibilities with school. Roughly half were employed when theyentered the study and about the same proportion lived in a household that received governmentbenefits for families with income below the federal poverty level.How Was the Program Implemented?Lorain County Community College, which is in Elyria, a midsized city west of Cleveland,began operating the Opening Doors program during fall 2003. Owens CommunityCollege, in Toledo, started a year later. Both colleges operated the program through spring2006. Lorain and Owens operated their Opening Doors program to its full extent during the falland spring semesters. Some students in the program group received assistance from OpeningDoors during the summer semester, but the services were far less intensive.The key findings on the implementation of the Opening Doors program follow.• The colleges provided Opening Doors counseling services that were moreintensive, comprehensive, and personalized than the colleges’ standardservices.The Opening Doors counselors each worked with far fewer students than did othercounselors at the colleges. Over the course of the study, Lorain’s Opening Doors program hadthe equivalent of one full-time counselor for every 81 students participating in the program in agiven semester. At Owens, the corresponding number was 157. For the control group, the ratioof students to counselors or advisers at the colleges was more than 1,000 to 1.ES-3
Program group members were assigned to an Opening Doors counselor. The OpeningDoors counseling sessions that MDRC observed covered a range of issues, including courseselection, registration, financial aid, other financial issues, tutoring, work-based learning efforts,juggling school and work, career aspirations, and personal issues. The Opening Doors counselorsprovided intensive assistance themselves, and referred students to other services on andoff campus. Both colleges designated staff in the financial aid office to serve as a special liaisonfor students in the Opening Doors program.Control group members were not assigned to a counselor, but could seek help from acounselor or adviser on their own. In contrast to the counseling provided to Opening Doorsstudents, the counseling that control group members received tended to be short-term andfocused only on academic issues. Data from the study’s 12-month survey show that theprogram increased the frequency with which students received academic advising, financialaid advising, and other student services.• The Ohio colleges implemented the Opening Doors stipend component asdesigned. About 9 of every 10 program group members received at least onestipend payment.Program group students were eligible for a $150 stipend per semester for two semesters,which they could use for any purpose. The stipend’s primary function was to promotecontact between students and their counselor. It was paid in two installments each semester,after scheduled counseling meetings. A total of 89.3 percent of the program group membersreceived at least one stipend payment, and 45.9 percent received the full $300.• The implementation analysis suggests that the Opening Doors program wassomewhat more intensive at Lorain than at Owens.As noted above, average caseloads were lower for Lorain’s Opening Doors counselorsthan for their counterparts at Owens. Data from the programs suggest that students at Lorainmay have had more contact with their Opening Doors counselor than students at Owens. Ahigher proportion of the program group members at Lorain than at Owens received at least onestipend payment, and a higher proportion received the full $300.Did the Program Make a Difference?The first two semesters that each student was in the study, during which time OpeningDoors services were provided to the program group, are called the “first program semester”and the “second program semester.” The semesters that followed are called “postprogramsemesters.” Each sample member, regardless of the time of random assignment, was followedES-4
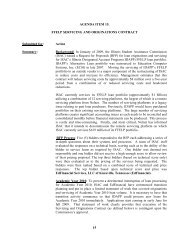
up for six consecutive semesters — two program semesters and four postprogram semesters —over a period of three years.Figure ES.1 illustrates registration rates over the study’s three-year follow-up period.The white bars show the average outcomes for program group members, and the solid blackbars show the averages for control group members. The difference between each pair of barsrepresents the program’s impact, and the presence of one or more asterisks indicates that animpact is statistically significant, meaning that it is unlikely to be due to chance. As the figureillustrates, over time there is an initial steep decline in registration rates for both researchgroups, followed by a more gradual decline. This pattern is common in community colleges.The primary question of the impact analysis is whether and to what extent the Opening Doorsprogram affected those rates and other key academic outcomes.The Opening Doors DemonstrationFigure ES.1Effects on Registration RatesLorain County Community College and Owens Community College ReportPercentage registered for any course10090807060504030201089.988.6***65.358.3*43.740.034.532.328.925.924.423.20First programsemesterSecond programsemesterFirstpostprogramsemesterSecondpostprogramsemesterThirdpostprogramsemesterFourthpostprogramsemesterProgram groupControl groupSOURCES: Lorain County Community College and Owens Community College transcript data.NOTES: A two-tailed t-test was applied to differences between research groups. Statistical significance levelsare indicated as: *** = 1 percent; ** = 5 percent; * = 10 percent.ES-5
• For the most part, the program did not substantially affect academic outcomesin the first program semester.As Figure ES.1 shows, the program group and control group had similar rates of registrationduring the first program semester. This is not surprising, since most program groupstudents registered before receiving program services. In contrast, the program’s enhancedcounseling might be expected to positively affect the number of credits that students earned. AsFigure ES.2 shows, however, the research groups earned about the same average number ofcredits during the first program semester.• The program increased registration rates and other academic outcomes inthe second program semester.As shown in Figure ES.1, during the second program semester, 65.3 percent of the programgroup registered for at least one course, compared with 58.3 percent of the control group.The impact is likely primarily the effect of Opening Doors services provided during the firstprogram semester, since registration typically occurs before a semester begins. During thesecond program semester, program group members earned an average of half a credit more thancontrol group members. This impact is relatively modest: it represents one-sixth of a threecreditcourse. As Figure ES.2 shows, by the end of the second program semester, programgroup members had earned an average of 9.7 credits since entering the study, compared with9.1 credits for the control group.• The program generated a small increase in registration rates during the firstpostprogram semester, but the effect dissipated in later semesters.As the third set of bars in Figure ES.1 illustrates, 43.7 percent of the program groupmembers registered in the first postprogram semester, compared with 40.0 percent of the controlgroup members. While smaller in magnitude than the program’s impact on registration duringthe second program semester, this impact of 3.7 percentage points is statistically significant.Despite the impact on registration during the first postprogram semester, the program did notincrease the average number of credits earned that semester. In the second, third, and fourthpostprogram semesters, the program did not substantially affect registration or any other keyacademic outcomes.Cumulative outcomes over the full follow-up period show only modest impacts. Programgroup members registered for an average of 3.3 semesters over the three-year period,whereas control group members registered for an average of 3.1 semesters. The program did notES-6
The Opening Doors DemonstrationFigure ES.2Effects on Average Cumulative Credits EarnedLorain County Community College and Owens Community College ReportAverage number of credits201816141210864205.35.1First programsemester9.7*9.1Second programsemester12.912.2First postprogramsemester15.214.5Secondpostprogramsemester17.416.6Third postprogramsemesterProgram groupControl groupSOURCES: Lorain County Community College and Owens Community College transcript data.NOTES: A two-tailed t-test was applied to differences between research groups. Statistical significance levels areindicated as: *** = 1 percent; ** = 5 percent; * = 10 percent.significantly increase the average number of credits that program group members earned duringthe study, as is illustrated in the rightmost set of bars in Figure ES.2. (The 0.8 difference incumulative credits earned is not statistically significant.)• For the most part, program impacts did not vary across the two colleges.Most of the differences between the effects on academic outcomes at the colleges arenot statistically significant.What Are Some Conclusions Based on the Results?It is reasonable to wonder whether a well-operated enhanced student services program(with a modest stipend) that lasts two semesters might have an effect on students’ longer-termoutcomes. Such an intervention might not only improve academic outcomes while services areES-7
offered, but might also provide students with information about the college, clarity about theireducational goals, improved problem-solving skills, and a feeling of connection to the collegeso that they can better cope with barriers in the future and continue to have better academicoutcomes than students who did not receive the same help. The study in Ohio does not provideevidence of such effects.The study — of one program tested at two colleges — cannot definitively determinehow well this program might have worked at other colleges or how well other program modelsmight have worked. It does, however, provide suggestive evidence, beyond the random assignment–basedcomparison, about enhancing student services.Below are three ways in which the program in Ohio could have been changed to possiblyproduce larger or more lasting effects.1. Provide services for a longer period.The program improved outcomes during the period in which students received services(and, to some extent, during the semester after the program ended). Many who advocate forenhanced student services view them as an ongoing need, since students continue to facebarriers to success. They would argue that two semesters of enhanced services is not sufficient,and that in order for enhanced student services to lead to sustained impacts, program effortsmust be sustained.2. Provide more comprehensive enhanced student services.While increasing the program’s duration is one possible way to boost the long-term impacts,it may also be worth exploring more comprehensive approaches to enhanced studentservices. The program studied in Ohio focused mainly on enhanced academic counseling,which is one of several key student services. Other components that could be offered includeenhanced academic supports, such as tutoring, remedial assistance, and time management andstudy skills training, or enhanced supplemental services, like on-campus child care and transportationassistance.3. Pair enhanced student services with other reforms.The program at Lorain and Owens provided the “lightest touch” of the programs thatwere operated as part of the multisite Opening Doors demonstration. Two colleges in Louisianatested a performance-based scholarship program that provided up to $2,000 and enhancedES-8
student services to low-income parents over two semesters. 4 A college in New York tested a“learning community” — an approach that typically groups students in linked courses withmutually reinforcing themes and assignments in order to improve their college learning experience— that restructured participating students’ first semester in college. 5 A college insouthern California offered a course that provided basic information on study skills and therequirements of college, along with enhanced student services and academic support for twoThese more comprehensive programs generated largerpositive effects for students, and in at least one case, the effects continued after the servicesended. It is possible that in order for enhanced student services to have a substantial effect oncommunity college students, they need to be offered in conjunction with reforms in other areasthat are more substantial than the modest stipend offered in Ohio.semesters to students on probation. 6 * * *When college administrators consider whether or not to enhance student services, thecost of the enhancements could be an important factor. Given that the Opening Doors programin Ohio helped students when they received services (and in the semester after), it may beworthwhile for other colleges to offer similar enhancements, if the costs are modest. If fundingis available, MDRC plans to conduct a study of the cost of the Ohio Opening Doors program.The research will provide an estimate of the gross cost of the services and will compare it withthe cost of providing standard services at the colleges.4 Lashawn Richburg-Hayes, Thomas Brock, Allen LeBlanc, Christina Paxson, Cecilia Elena Rouse, andLisa Barrow, Rewarding Persistence: Effects of a Performance-Based Scholarship Program for Low-IncomeParents (New York: MDRC, 2009).5 Susan Scrivener, Dan Bloom, Allen LeBlanc, Christina Paxson, Cecilia Elena Rouse, and Colleen Sommo,with Jenny Au, Jedediah J. Teres, and Susan Yeh, A Good Start: Two-Year Effects of a FreshmenLearning Community Program at Kingsborough Community College (New York: MDRC, 2008).6 Susan Scrivener, Colleen Sommo, and Herbert Collado, Getting Back on Track: Effects of a CommunityCollege Program for Probationary Students (New York: MDRC, 2009).ES-9
Chapter 1IntroductionOver the last 40 years, community colleges have played an increasingly important rolein postsecondary education. In the fall of 1963, community colleges enrolled under threequarters of a million students; by the 2006-2007 school year, they enrolled 6.2 million students,an increase of 741 percent. During this same time period, public and private four-year collegesand universities saw their enrollments grow by less than 200 percent. The substantially fastergrowth rate of community colleges has led them now to enroll more than one in every threepostsecondary education students. 1As the proportion of postsecondary students enrolled at community colleges has increased,so has the understanding of the challenges that these students face. Among studentswho enroll in community colleges with the intention of earning a credential or transferring to afour-year institution, only 51 percent fulfill these expectations within six years of their initialenrollment. 2 Research by MDRC and others suggests that many community college studentswant to earn a degree, but are stymied by the competing demands of work, family, and school.Institutional barriers, such as poorly tailored instruction, insufficient financial aid, or inadequatestudent services, can also impede students’ academic progress. 3 As a result, community collegesare searching for innovative programs to improve the likelihood of academic success amongtheir students.This report presents results from a rigorous study of a program designed to increaseacademic success by providing enhanced student services and a modest stipend to low-incomestudents at two community colleges in Ohio: Lorain County Community College and OwensCommunity College. Participating students were randomly assigned either to a control group,whose members received the college’s regular services, or to a program group. Program groupmembers were assigned to one of a team of counselors, with whom they were expected to meetat least two times per semester for two semesters to discuss academic progress and resolve anyissues that might affect their schooling. Program group students also could and sometimes didmeet with other counselors on the team. Each program counselor worked with far fewerstudents than did the regular college counselors, which allowed for more frequent, intensivecontact. Program group students were also eligible for a $150 stipend during each of the twosemesters, for a total of $300.1 Provasnik and Planty (2008). Enrollment data do not include students who were enrolled only in noncreditcourses.2 Hoachlander, Sikora, and Horn (2003).3 Brock and LeBlanc (2005).1
The program at Lorain operated between 2003 and 2006, and the program at Owens operatedbetween 2004 and 2006. This report updates and supplements the early findings that werepresented in two separate reports in 2007, one focusing on Lorain, the other on Owens. The 2007reports presented similar findings: while it was too soon to draw final conclusions, resultsindicated that the program improved some short-term academic outcomes for students, but didnot yet appear to have had a significant lasting effect. 4 This report synthesizes the previousfindings, pools results across the two colleges, and extends analyses up to three years afterstudents were randomly assigned in order to better assess the long-term effects of the program.The enhanced student services program offered at Lorain and Owens represents onetype of program being evaluated as part of a larger multisite study known as the Opening Doorsdemonstration. This chapter begins with an overview of the full Opening Doors demonstration,which took place at six community colleges in the United States and evaluated several innovativestrategies for improving students’ academic progress. Next, the chapter defines studentsupport services, explains how they might lead to student success, and provides some informationabout the types of students attending community college and why they, in particular, maybenefit from such services. That section is followed by a description of the current state ofstudent services and some research evidence that suggests that enhancing these services is5associated with higher student success rates. The chapter concludes with a description of thecontents of the rest of this report. 6Overview of the Opening Doors Demonstration and EvaluationWith support from a consortium of funders, MDRC launched the Opening Doors demonstrationin 2003. As part of the demonstration, six community colleges in four states eachoperated an innovative program that was designed to increase students’ achievement and persistencein school. The programs included two or three of the following strategies: curricular andinstructional innovations, enhanced student services, and supplementary financial aid. See Table1.1 for a brief description of the programs studied as part of the Opening Doors demonstration. 7To measure the effects of each of the programs, the evaluation used a random assignmentresearch design, a first in large-scale community college research. At each college, studyparticipants were assigned, at random, either to a program group that received the Opening4 Scrivener and Au (2007); Scrivener and Pih (2007).5 See, for example, Mathur (2004); Steingass and Sykes (2008).6 Some sections of this report were adapted from prior MDRC reports about the Opening Doors demonstration.7 For results of the other programs, see Scrivener et al. (2008); Richburg-Hayes et al. (2009); and Scrivener,Sommo, and Collado (2009).2
The Opening Doors DemonstrationTable 1.1Opening Doors Programs and Target GroupsLorain County Community College and Owens Community College ReportSite Brief Program Description Target GroupChaffey CollegeRancho Cucamonga, CaliforniaA College Success course andenhanced student services: Studentstook a one-semester College Successcourse, taught by a counselor, thatprovided instruction on study skills,goal setting, and college regulations;as part of the course, students wereexpected to visit the college’s SuccessCenters, which provided extraacademic support. The collegeoperated two versions of the program:the original version was voluntary; theenhanced version was framed asrequired and offered a secondsemesterCollege Success course.Students ages 18-34 whoearned fewer than 35 creditsand who were on eitheracademic probation (had acumulative grade pointaverage below 2.0 [C]) orprogress probation (hadcompleted fewer than half thecourses in which theyenrolled).Delgado Community College andLouisiana Technical College-West JeffersonNew Orleans area, LouisianaKingsborough CommunityCollegeBrooklyn, New YorkLorain County CommunityCollege and Owens CommunityCollegeElyria and Toledo, OH,respectivelyA scholarship predicated onacademic performance andenhanced counseling: Students wereeligible for $1,000 scholarship foreach of two semesters; scholarshipwas tied to maintaining at least halftimeenrollment and a grade pointaverage of 2.0 (C); students alsoeligible for enhanced counseling.Learning Communities and a bookvoucher: Groups of up to 25 studentstook three linked courses together theirfirst semester in college; studentsreceived enhanced counseling andtutoring and vouchers to pay fortextbooks.Enhanced student services and amodest stipend: Students wereassigned to an Opening Doorscounselor with a small caseload withwhom they were expected to meetfrequently; students had access todesignated contact in financial aidoffice; students were eligible for $150stipend for each of two semesters.Parents ages 18-34 whosefamily income was below 200percent of the federal povertylevel.Incoming freshmen ages 17-34who planned to attend collegefull time.Students ages 18-34 whosefamily income was below 250percent of the federal povertylevel and who either wereincoming freshmen or hadcompleted fewer than 13credits and had a history ofacademic difficulties.SOURCE: MDRC field research data.3
Doors services or to a control group that received only the college’s standard services. Bothgroups were tracked over time to determine which group attained better outcomes (such ascredits earned and retention). Random assignment ensures that the motivation levels andpersonal characteristics of students in the program group and control group were similar at thebeginning of the study; 8 hence, any subsequent substantial differences in outcomes can beattributed with a high level of confidence to differences in the way students were treated afterthey were randomly assigned. Using statistical techniques, studies that do not utilize a randomassignment research design are still capable of accounting for observable differences (in suchvariables as gender, race, and income) between the program group and a comparison group.However, one major advantage of the random assignment design is that, since program andcontrol group members are assigned at random, the two groups will, on average, be equivalenton both observed characteristics and unobserved characteristics (such as motivation and ability).For this reason, the experimental design is ideal for attempting to make causal inferences abouta program’s effectiveness.This report focuses on one of the Opening Doors programs designed to increase students’chances of achieving academic success: enhanced student services and a modest stipend.The following sections provide some background on student services in the community collegesetting; a detailed description of the Opening Doors program implemented at Lorain CountyCommunity College and Owens Community College appears in Chapter 3.Background on Student Services at Community CollegesComponents of Student ServicesTo begin, it is important to consider what is meant by student services. Definitions canvary, but the following catalog of their elements — developed as part of an earlier MDRCpublication on student services 9 — offers one useful, relatively comprehensive description ofwhat student services encompass:• Academic guidance and counseling, including orientation, information onnavigating the college, reading and math assessments, educational planningand advising that helps students select courses to meet major requirementsthat fit their career goals, monitoring students’ progress to ensure that theyreach educational benchmarks in a timely way, early registration, forums orpresentations on topics to help students persist, and transfer counseling to en-8 The program group and control group should be similar in terms of averages, as well as other distributionalcharacteristics.9 Purnell and Blank (2004).4
sure that students complete the requirements needed to enroll in four-yearcolleges or universities• Academic supports, such as tutoring, remedial assistance, and time managementand study skills training• Personal guidance and counseling, which can consist of crisis intervention,information and referral, mental health counseling, life skills counseling,mentoring or coaching, and peer support• Career counseling, which encompasses aptitude assessments, development ofcareer plans, and sharing of information on careers and their skill requirements• Supplemental services, such as child care subsidies or vouchers, transportationtokens or passes, and book and supply vouchers, that help students pursuean educationTheory of ChangeDiscussed here is the logic behind how student services might lead to increases in students’likelihood of succeeding academically. The focus is on the potential of student servicesboth to help students integrate into campus life and to provide accurate information so thatstudents can make well-informed decisions.Analyses by Tinto that focus on why students do or do not leave institutions of highereducation before completion provide interesting clues about the possible role of student servicesin promoting educational success. Building on theories that attempt to explain the individual,societal, and environmental factors that contribute to departure in many different contexts, Tintohas developed a framework for understanding student attrition from postsecondary institutions.10 He concludes that a very broad array of factors affect students’ decisions to stay inpostsecondary institutions or to exit institutions before completion. Tinto asserts that it isimportant to examine how the larger system of academic and social forces can help or hinderacademic progress. 11 Although four-year and community college students continue to beinvolved in many off-campus experiences and relationships, their interactions with the postsecondaryinstitution — for instance, the level and nature of their involvement with faculty,staff, peer groups, and extracurricular activities — become very important aspects of their livesafter enrollment.10 Tinto (1993), as cited in Purnell and Blank (2004).11 Tinto (1993), as cited in Purnell and Blank (2004).5
This line of reasoning suggests that activities and supports that promote students’ integrationinto the life of the community college can influence whether students stay or drop out.Student services may have the capacity to offer those kinds of activities and supports. Thus,Tinto’s analysis points to a possible pathway by which student services influence outcomes:these interventions may help students feel part of a community, which, in turn, helps thempersist academically. 12In describing components of one college’s student advising program, Steingass andSykes explain a potential theory of change underlying enhanced student advising:[A]dvisers can help students feel more connected with the university by increasingthe number of advising interactions with each individual student. Byfeeling more connected with the university, students make more informededucational decisions, interact more with faculty, collaborate with other studentsoutside of class, and report higher levels of satisfaction with their undergraduateexperience. Consequently, students will experience higher levelsof academic success and persist at higher rates. 13In other words, the logic behind the enhanced student services strategy of school improvementinvolves several steps. First, schools encourage or require students to interact morewith student services. These increased interactions lead students to feel more integrated, havinga greater sense of belonging in the college. This integration may be accompanied by increasedparticipation and engagement in college life, improving students’ overall college experience.Finally, the more integrated, engaged, and generally satisfied student will be more likely tosucceed in school.Integration, engagement, and eventually, improved satisfaction together make up onemechanism through which student services may increase student success. In addition, enhancedservices may result in improved student success by providing students with information theyotherwise might not obtain, enabling them to make better-informed decisions. This informationcould be about what courses are available to a student; what path a student must take in order toenter a certain career; who can help out with financial aid; and what academic, psychological,social, and family supports the college offers. Providing useful and accurate information tostudents is a primary goal of many student services, a goal that, if met, may lead to greaterstudent success.12 Tinto (1993), as cited in Purnell and Blank (2004).13 Steingass and Sykes (2008), 19.6
While the mechanism through which student services could lead to improved studentsuccess rates can be explained logically, it remains unclear whether community college studentsactually need those services.Selected Characteristics of Community College StudentsWhile student services are important at postsecondary institutions in general, these servicesmay be particularly vital at community colleges because of the types of students whoattend them. The following paragraphs are not intended to exhaustively describe communitycollege students; rather, the selected characteristics discussed are meant to exemplify why thetypes of students who attend community college may benefit significantly from enhancedstudent services.Many community college students enter school woefully underprepared academically. 14During the 2003-2004 school year, about 29 percent of community college students reportedhaving taken some remedial (or developmental) coursework during their first year at college. 15This number is well below the actual percentage who require remediation, since it representsstudent self-report and it reflects course-taking during the first year of community college only.Estimates from a longitudinal study that tracked a nationally representative sample of eighthgraders for 12 years suggest that among students whose first institution of attendance was acommunity college, over 60 percent took at least one remedial course at their postsecondaryinstitution. 16 In order to become “college-ready,” these academically underprepared studentsmay benefit greatly from support services like tutoring and remedial assistance (and advising onhow and where to get these services). In addition, because these academically underpreparedstudents are often required to take developmental course sequences prior to completing certaincredit-bearing courses and their degree, strong academic advising may be helpful in plotting andtracking their path of study.In addition to the high percentage of underprepared students, the vast majority of communitycollege students are “nontraditional.” These nontraditional students have one or more ofthe following characteristics: they delay postsecondary enrollment, are financially independent,attend school part time, work full time while enrolled, have children or dependents other than a17spouse, are single parents, or dropped out of high school. These characteristics are sometimesreferred to as “risk factors” because they have been negatively correlated with persistence incollege. 18 Enhanced student services may be particularly helpful at increasing the likelihood that14 Duke and Strawn (2008).15 Provasnik and Planty (2008).16 Adelman (2004).17 Horn, Berger, and Carroll (2005); Choy (2002).18 Choy (2002), 11.7
nontraditional students will succeed in school. Whether the services are orientation services forstudents who have been out of school for a while, financial aid advising for financially independentstudents, time management training for students who are working full time while attendingschool, or child-care subsidies for parents, the special needs of nontraditional students may beaddressed by enhanced student services.Finally, community college students frequently come from low-income backgroundsand have parents who did not attend college. More than one-fourth of students who attendedcommunity college during the 2003-2004 school year were from families whose income was ator below 125 percent of the 2002 federal poverty threshold. 19 For these low-income students,enhanced services geared toward financial assistance may be critical to their likelihood topersist. Meanwhile, nearly half of all beginning postsecondary students at public two-yearinstitutions had parents whose highest education level was a high school diploma or less in1995-1996. 20 For these students, whose parents are unable to provide experienced guidanceabout life in college, orientation sessions and information on navigating life on campus may beparticularly valuable.Community college students come from a diverse set of backgrounds. Although there isno such thing as a “typical” community college student, the types of students represented oncommunity college campuses often must overcome significant challenges and obstacles in orderto complete their studies. Enhanced student services are designed, in part, to address some ofthose challenges.Quantifying the Shortage of ServicesIn order to understand the enhancement of student services, it is important to considerthe current state of student services. Enhancements could be conceived of as “more” services,“better” services, or both. Described here is some information on the current state of studentservices provided at community colleges — an amount that many perceive as a shortage,suggesting that one starting point for an intervention is simply to provide more services.Academic advising and counseling is arguably the most important student service andan area where most community college students receive minimal help. Extraordinarily highstudent-to-counselor ratios are the most dramatic sign of the shortage of student services. Onestudy shows that the average student-to-counselor ratio in U.S. community colleges is almost1,000 to 1, 21 while a report examining the diversity of the California community college systemfound that the median ratio of students to counselor ranged from 1,400 to 1 in 1994 to approx-19 Provasnik and Planty (2008).20 Horn, Berger, and Carroll (2005).21 Grubb (2001), 6.8
imately 1,700 to 1 in 2001. 22 Exacerbating the shortage of student services, the budgets ofcolleges are often based on formulas that focus on “full-time equivalents,” which tend to countpart-time enrollments and teaching loads for less than their full worth and thus underrepresentpart-time students and their needs.The student-to-counselor ratio alone suggests a shortage of student services. The CommunityCollege Survey of Student Engagement (CCSSE) provides some additional information23about the current state of student services. According to this survey, more than 6 in every 10students say that academic advising/planning is very important. Yet, only 13 percent of studentsreported using academic advising/planning services “often,” whereas 35 percent reported usingthese services “rarely/never.” Students’ reporting on the importance and use of financial aidadvising tells a similar story. In general, students report that many student services are importantto them; however, they do not report using these services often. 24Students and administrators alike appear to agree that there is a need for student services.An MDRC study found that students highlighted financial aid, counseling (includingguidance counseling, personal counseling, and academic advising), and packages of servicesand supports offered through special programs as being critical in making it possible for them toenter and complete a college program. 25 This perceived need is not limited to students; nearly1,000 college administrators who responded to a survey about student retention practicesreported that a key reason why students drop out is inadequate academic advising. 26Evidence of SuccessWhile there is convincing descriptive evidence of the perception that student servicesare critical to students’ academic success, evidence of the actual benefit of providing additionalstudent services, above and beyond what is typically offered, is limited to correlational studies.For example, research by the California Community Colleges Chancellor’s Office suggests thatspecial services targeting nontraditional students are linked to better academic outcomes andimproved retention rates. Attributes associated with these positive outcomes appear to be thatthe services are consistent, that they take into account students’ strengths, and that they respondto students’ needs and to the challenges posed by a college environment. 2722 Woodlief, Thomas, and Orozco (2003), as cited in Purnell and Blank (2004).23 Although the survey is not offered to a nationally representative sample of community college students,the CCSSE cohort member colleges enroll over 3.7 million credit students, or about 58 percent of the nation’stotal credit student population.24 CCSSE (2008).25 Matus-Grossman and Gooden (2002).26 Purnell and Blank (2004), 11-12.27 Mathur (2004).9
Students who get no advising, or inadequate advising, may be more likely to drop out ofschool. A 1989 study found that first-year students who felt that they had received good-qualityadvising withdrew from public four-year institutions at a rate that was 25 percent lower thanstudents who believed their advising to be of poor quality, and 40 percent lower than studentswho reported that they had received no advising. 28A more recent study (published in 2008) of the effectiveness of enhanced student serviceswas conducted at Virginia Commonwealth University. This study found that the moretimes students met with academic advisers, the more satisfied they were with the services theyreceived. In addition, students who met with their advisers at least twice per semester weremore likely to be in good academic standing at the end of their first year and were more likely topersist in school, compared with students who met with their advisers fewer times. 29Such past research provides evidence of a correlation between student services and studentsuccess. However, it is difficult to ascertain whether this relationship is causal because,even after accounting for observable student background characteristics (such as gender) andobservable contextual factors (such as institutional size), the relationship may be confounded bythe influence of unobserved or difficult-to-quantify student characteristics (such as motivation)and unobserved or difficult-to-quantify contextual factors (such as teacher effectiveness). Whilepast research has found promising results, few studies have employed rigorous research designs,and none of the large-scale studies has used a random assignment research design. As such, theOpening Doors random assignment evaluation at the colleges in Ohio provides an importantcontribution to the growing body of research on the effectiveness of enhanced student services.Enhancing Student ServicesThe research presented in this report is from a random assignment evaluation of oneprogram of enhanced student services. Researchers and practitioners have a variety of ideasabout what an optimal student services package might look like. For example, many claim that,at a minimum, sufficient staffing is necessary in order to enable more frequent interactionsbetween students and support services. 30 Similarly, it has been suggested that strategies need tobe developed to ensure that students use support services (such as making them mandatory orintegrating them into the regular classroom experience). 31 Still others have discussed theoptimal organization of the delivery of student services, suggesting that all services need to behoused in the same location, for a one-stop student services center. 32 In addition, whole bodies28 Cuseo (2003), as cited in Purnell and Blank (2004), 11.29 Steingass and Sykes (2008).30 Grubb (2001); Gordon, Habley, and Associates (2000), as cited in Scrivener and Pih (2007).31 CCSSE (2008).32 Purnell and Blank (2004).10
of literature exist on career counseling, psychological counseling, and other categories ofstudent services. The details of the specific enhanced student service package studied in thisreport are presented in Chapter 3; here, it is simply noted that the main focus of the OpeningDoors program was on reducing the caseload of academic counselors to facilitate more frequentcontact, designating a specific contact in the financial aid office for program group students, andproviding a modest stipend to students who visited their academic counselor.The Remainder of This ReportThe next chapter describes the college settings where this study took place and the characteristicsof the research sample. It also describes the sources of data used in this study.Chapter 3 provides an overview of the program’s history and implementation at the twocolleges, as well as a discussion of the program’s impact on receipt of student services.Chapter 4 presents the program’s effects on various educational outcomes.Chapter 5 provides some implications of the findings, presents a discussion of severalimportant questions raised by this report, and offers areas for future research about studentservices.11
Chapter 2The Sites, Sample, and Data SourcesThis report presents results from a random assignment evaluation of the OpeningDoors programs at Lorain County Community College and Owens Community College. Thischapter first describes the two colleges. It then discusses how students became part of theresearch sample and presents some characteristics of the sample members. Finally, the chapterincludes a discussion of the data sources used in this report and the follow-up periods for theimpact analyses.The Participating CollegesLorain County Community CollegeThe EnvironmentLorain County Community College is located in Elyria, a midsized city of approximately56,000, in northeast Ohio, about 25 miles west of Cleveland. The vast majority of residents(81 percent) are white, and most of the rest (14 percent) are black. 1Elyria is set in what is sometimes referred to as the nation’s “Rust Belt,” an area spanningseveral Midwest and Mid-Atlantic states. Through much of the twentieth century, theregion had a high concentration of manufacturing and heavy industry, and many residentsworked in factories. Over recent decades, however, this sector of the economy has declined.Between 1980 and 2005, for example, the United States lost 24 percent of its manufacturingjobs. 2 During that period, northeast Ohio lost 41 percent of its manufacturing jobs, and LorainCounty suffered the most substantial job losses of any county in the region. 3 Thousands ofdisplaced workers needed to be retrained, a challenge that Lorain County Community Collegehas taken on, and new businesses had to be developed and attracted to the area.1 See www.factfinder.census.gov. The population estimate and the race breakdown are from 2000.2 Austrian (2006).3 The Public Services Institute and the Joint Center for Policy Research, Lorain County Community College(2004).13
The CollegeLorain County Community College was granted a charter by the Ohio Board of Regentsto provide higher education services in 1963. In 1964, the Lorain School of Technologywas incorporated into the community college. 4 Most students at Lorain County CommunityCollege go to school at the forested main campus in Elyria, but some students take classes at thesatellite campus in the nearby city of Lorain.Lorain is a well established community college that offers a range of programs leadingto an associate’s degree or a technical or vocational certificate. During the 2003-2004 schoolyear, when the study began at Lorain, the most commonly pursued academic and vocationalprograms at the college were (1) Health Professions and Related Clinical Sciences, (2) LiberalArts and Sciences, Social Sciences, and Humanities, and (3) Business, Management, andMarketing. Notably, Lorain is the only community college in the state that offers a UniversityPartnership Program, in which students can earn bachelor’s degrees and master’s degrees from5any of eight four-year institutions in Ohio without leaving the Lorain campus.During the fall 2003 semester, Lorain served approximately 9,400 students, and, as isthe case at most community colleges, the majority (about two-thirds) attended part time. Abouttwo-thirds of the students were women and nearly half were over 25 years of age. The studentbody is predominantly non-Hispanic white. The in-state tuition at Lorain for the 2003-2004school year was $2,565, and about half of the first-time, full-time students received some formof financial aid. 6Owens Community CollegeThe EnvironmentOwens Community College is located in Toledo, Ohio’s fourth largest city, with a populationjust over 300,000. Over two-thirds (70 percent) of the city’s residents are white, andabout one-fourth (24 percent) are black. 7Toledo is in the northwest part of the state, on the western end of Lake Erie. Like Elyria,it is in the Rust Belt and has a high concentration of manufacturing plants, including large4 See www.lorainccc.edu.5 For more information, see Lorain’s Web site, www.lorainccc.edu.6 The information in this section about the 2003-2004 school year at Lorain was originally drawn from theU.S. Department of Education’s Integrated Postsecondary Education Data System (IPEDS), atwww.nces.ed/gov/IPEDS. The 2003-2004 data are no longer posted. Updated information is available athttp://nces.ed.gov/collegenavigator/?id=203748.7 See www.factfinder.census.gov. The population estimate and the race breakdown are from 2000.14
automobile factories. In recent years, however, the number of jobs in manufacturing hasdeclined, while the number in services industries, such as health care, has increased. 8 Toledo ishome to a number of higher education institutions, including the University of Toledo, DavisCollege, and Mercy College of Northwest Ohio.The CollegeOwens was granted a charter to provide educational services as a technical college in1967. In 1994, the college was chartered as a comprehensive state community college, with arange of academic programs, although it has retained its technical and career programs. 9 Duringthe 2004-2005 school year, when the study started at Owens, the most commonly awardedassociate’s degrees were in the following three areas: (1) Health Professions and RelatedClinical Sciences, (2) Business, Management, and Marketing, and (3) Engineering Technologies.Owens offers classes at a main campus in Toledo, as well as at a campus in the nearbysmall city of Findlay.During the fall 2004 semester, Owens served about 20,000 students, more than doublethe number served by Lorain. The majority of students at Owens (about two-thirds) attendedpart time, just over half were men, and half were over 25 years old. As at Lorain, the studentbody at Owens is predominantly non-Hispanic white. The in-state tuition at Owens for the2004-2005 school year was $2,680, and about three in every five first-time, full-time students10received some form of financial aid.Identifying, Recruiting, and Randomly Assigning StudentsLorain and Owens targeted students for their Opening Doors program who met the followingcriteria:• Were age 18 to 34 years• Had a family income below 250 percent of the federal poverty level8 See http://lmi.state.oh.us/ces/LMR.htm (Ohio Department of Job and Family Services, Ohio Labor MarketInformation).9 See www.owens.edu.10 The information in this section about the 2004-2005 school year at Owens was originally drawn from theU.S. Department of Education’s Integrated Postsecondary Education Data System (IPEDS), atwww.nces.ed.gov/IPEDS. The 2004-2005 data are no longer posted. Updated information is available athttp://nces.ed.gov/collegenavigator/?id=204945.15
• Were beginning freshmen or continuing students who had completed fewerthan 13 credits and had experienced academic difficulties (indicated by notpassing courses or withdrawing from courses) 11• Had a high school diploma or General Educational Development (GED) certificate• Did not have an associate’s degree from an accredited college or universityThe program was open to both part-time and full-time students. 12The colleges used their student databases, which contain family income informationfrom the Free Application for Federal Student Aid (FAFSA), to identify eligible students. Oncea student was identified as eligible, college staff sent an initial invitation letter or postcarddescribing the Opening Doors program, its potential benefits, and the study. The letter orpostcard encouraged the student to call and set up an appointment for study intake.Neither Lorain nor Owens had a group registration event or other gathering that wouldhave facilitated randomly assigning large numbers of students to the study at once. As a result,the college staff had to conduct extensive outreach to make students aware of the opportunity toparticipate in the study and encourage them to sign up. They sent follow-up letters and mademultiple phone calls to recruit students. They also posted flyers around campus, placed advertisementsin newspapers and on the radio, and recruited students in the college bookstore,cafeteria, advising center, and outside classrooms.MDRC arranged for the college staff to receive assistance from a consultant with expertisein recruitment for education and workforce programs. She provided training to the OpeningDoors staff and helped the colleges revise their recruitment materials. Once the Opening Doorsprogram became established on the campuses, word of mouth helped the recruitment effort.Eligible students who were interested in the study met one-on-one or in small groupswith Opening Doors staff. After verifying students’ eligibility for the study, staff explained thestudy and program. If students agreed to participate in the study, staff obtained their writtenconsent and collected baseline information (discussed below). Once the paperwork was complete,at Lorain, the Opening Doors staff telephoned MDRC with students’ names and identifica-11 “Academic difficulty” was defined as earning no more than 75 percent of the credits attempted.12 This list of criteria was in effect for most of the study. For the first round of sample intake at Lorain(which accounts for 10 percent of the sample at Lorain and 4 percent of the full pooled sample), however, thecriteria were somewhat narrower. The income cut-off was 200 percent of the federal poverty level and thecredit completion cut-off was 60 percent. MDRC and Lorain agreed to broaden the criteria to increase the poolof students who were eligible for the study and, thus, generate a larger research sample.16
tion numbers, and MDRC’s computer system randomly assigned students to the program groupor to the control group. At Owens, staff transmitted students’ information to MDRC, and MDRCsent the students’ research group designations back to the college, all via a secure Web site.After the random assignment process was complete, staff at both colleges informed studentsabout their research group designation and gave the students a $20 gift card from a majordiscount store as compensation for their time. The students who were assigned to the programgroup were scheduled to meet with a counselor from the Opening Doors program at a later date.The appointment typically took place shortly before the semester began or early in the semester.The students who were assigned to the control group were told they could seek out the counselingand other student services offered on campus.The study started at Lorain in 2003 and at Owens a year later. Random assignment atLorain occurred prior to five consecutive semesters and yielded five cohorts of sample members:fall 2003, spring 2004, fall 2004, spring 2005, and fall 2005. Study intake at Owensoccurred before three semesters and yielded three cohorts: fall 2004, spring 2005, and fall 2005.The total, pooled research sample in Ohio is 2,139 — 1,073 in the program group and 1,066 inthe control group. The sample includes 898 students from Lorain and 1,241 students fromOwens (42 percent of the sample members are from Lorain and 58 percent are from Owens).Characteristics of the SampleTable 2.1 presents some characteristics of the sample members, based on a questionnaire(the Baseline Information Form) that they completed just before they were randomlyassigned. The first column of the table shows characteristics for the full, pooled researchsample.Approximately three-fourths of the pooled sample members are women. Fifty-four percentof the sample members identified themselves as white, 30 percent as black, and 11 percentas Hispanic/Latino. Almost all the sample members (99 percent) are U.S. citizens and few (8percent) reported that a language other than English is regularly spoken in their home.On average, the sample is somewhat older than a traditional college-going population.Less than a third of the sample members were between 18 and 20 years old when they enteredthe study, and more than a third were 26 or older. The average age was 24 (not shown in Table2.1). Almost half of the sample members graduated from high school (or received their GEDcertificate) more than five years before they entered the study. Forty-four percent reported thatthey had completed some college credits before random assignment.Many of the study participants in Ohio are single parents who are balancing family responsibilitieswith school: about two-thirds of the sample members were parents at baseline and17
The Opening Doors DemonstrationTable 2.1Selected Characteristics of Sample Members at BaselineLorain County Community College and Owens Community College ReportCharacteristic (%)Full Lorain OwensSample Sample SampleGenderMale 24.3 18.9 28.1 ***Female 75.7 81.1 71.9 ***Age in years18-20 28.1 14.4 38.0 ***21-25 35.0 38.6 32.4 ***26-30 23.8 29.8 19.5 ***31-34 13.1 17.2 10.2 ***Marital statusMarried 19.9 27.3 14.5 ***Unmarried 80.1 72.7 85.5 ***Race/ethnicity aHispanic/Latino 10.9 14.4 8.3 ***Black, non-Hispanic 29.9 21.1 36.4 ***White, non-Hispanic 54.1 58.8 50.7 ***Asian or Pacific Islander 0.6 0.2 0.9 **Other b 4.5 5.5 3.7 **Has one child or more 64.3 82.2 51.4 ***Household receiving any government benefits c 48.3 54.9 43.5 ***Financially dependent on parents 17.6 9.6 23.4 ***Ever employed 98.3 99.6 97.4 ***Currently employed 55.9 54.3 57.1Highest grade completed8th or lower 1.4 1.6 1.39th 3.8 4.5 3.310th 5.8 6.9 5.0 *11th 8.5 11.0 6.6 ***12th 80.5 76.0 83.8 ***Diplomas/degrees earned dHigh school diploma 75.7 70.7 79.3 ***General Educational Development (GED) certificate 22.9 27.7 19.3 ***Occupational/technical certificate 10.8 15.8 7.1 ***(continued)18
Table 2.1 (continued)Characteristic (%)Full Lorain OwensSample Sample SampleDate of high school graduation/GED certificate receiptDuring the past year 21.5 12.9 27.8 ***Between 1 and 5 years ago 31.3 29.3 32.8 *More than 5 years ago 47.2 57.8 39.4 ***Main reason for enrolling in college dTo complete a certificate program 9.8 11.0 8.8 *To obtain an associate’s degree 49.0 55.9 44.0 ***To transfer to a 4-year college/university 24.4 20.0 27.5 ***To obtain/update job skills 12.5 10.0 14.3 ***Other 7.2 5.6 8.4 **First person in family to attend college 35.9 37.0 35.1Completed any college courses/credits 43.6 43.5 43.6Working personal computer in home 64.2 65.6 63.2Owns or has access to a working car 88.3 90.3 86.9 **Language other than English spoken regularly in home 8.1 10.9 6.1 ***U.S. citizen 98.8 98.8 98.9Region in which respondent was bornNorth America 96.9 96.8 97.0Asia 0.4 0.1 0.7 *Latin America and the Caribbean 1.0 2.0 0.3 ***Other e 1.6 1.1 2.0Region in which respondent’s mother was born fNorth America 94.0 91.8 95.7 ***Asia 0.7 0.3 0.9Latin America and the Caribbean 2.8 5.6 0.6 ***Other e 2.6 2.3 2.8Sample size 2,139 898 1,241(continued)19
Table 2.1 (continued)SOURCE: MDRC calculations using Baseline Information Form (BIF) data.NOTES: Rounding may cause slight discrepancies in sums and differences.A two-tailed t-test was applied to differences between the two groups of sample members. Statisticalsignificance levels are indicated as: *** = 1 percent; ** = 5 percent; * = 10 percent.aRespondents who indicated that they are Hispanic and who chose a race are included only in theHispanic/Latino category.b“Other race” includes American Indians/Alaskan Natives and those who marked “other race/ethnicity” ormore than one racial/ethnic category.cBenefits include Unemployment/Dislocated Worker benefits, Supplemental Security Income (SSI) ordisability, cash assistance or welfare, food stamps, and Section 8 or public housing.dDistributions may not add to 100 percent because categories are not mutually exclusive.eThis category includes the Baltics, the Commonwealth of Independent States, eastern and western Europe,North Africa, Sub-Saharan Africa, the Near East, and Oceania. The Commonwealth of Independent Statesincludes Armenia, Azerbaijan, Belarus, Georgia, Kazakhstan, Kyrgyzstan, Republic of Moldova, Russia,Tajikistan, Turkmenistan (until August 2005), Ukraine, and Uzbekistan. Countries are grouped by regionaccording to the U.S. Bureau of the Census, International Data Base.fThe majority of respondents reported that both parents were born in the same region as each other.most were unmarried. The sample members who were parents had an average of two children,and many of the children were young: the average age of the sample members’ youngest childwas about 3 years (not shown in Table 2.1).Only 18 percent of the sample members reported that they were financially dependenton their parents. Just over half were employed when they entered the study and just under halfsaid that someone in their household received government benefits designed for people livingbelow the federal poverty level.Roughly a third of the sample members were the first in their family to attend college.Almost three-fourths said that their main reason for enrolling in college was to obtain anassociate’s degree or to transfer to a four-year college or university.In addition to presenting the characteristics of the pooled sample, Table 2.1 presents thecharacteristics of the sample members from each college. An asterisk in the rightmost columnof the table indicates that the difference between the proportion of sample members from Lorainwith the given characteristic and the proportion of sample members from Owens with thatcharacteristic is statistically significant (meaning that the difference is unlikely to be due tochance). As the table shows, the samples are quite different. Compared with sample members atOwens, sample members from Lorain are more likely to be women, older, married, and parents.They are less likely to be financially dependent on their own parents and more likely to be20
eceiving government benefits. 13 (Chapter 4 addresses the decision to pool the two samples forthe analyses presented in this report.)The research sample should not be considered representative of the broader studentbody at Lorain and Owens. The sample consists only of low-income students who either werenew to the college or had already experienced some academic difficulties.Data Sources and Follow-Up PeriodsTo study the Opening Doors program in Ohio, the analyses presented in this report relyon several data sources, described below.Baseline DataAs mentioned above, just before students were randomly assigned to the researchgroups at Lorain and Owens, they completed a questionnaire, called the Baseline InformationForm (BIF), and a baseline survey. The BIF collected demographic and other backgroundinformation. The survey contained a series of questions about students’ well-being and theirhealth. Baseline data are used to describe the sample and define subgroups of sample membersfor analysis. Baseline data are also used to assess the success of random assignment at creatingresearch groups that are statistically indistinguishable from one another at the start of the study.Lorain and Owens Transcript DataLorain and Owens provided to MDRC transcript data for sample members. These datainclude various academic outcomes, including courses for which sample members registered,number of credits earned, and course grades. This report presents a range of transcript dataoutcomes for the first two semesters during which each sample member was in the study (calledthe “first program semester” and the “second program semester”) and the three subsequentsemesters (called “postprogram semesters”). This yields a five-semester follow-up period foreach of the five cohorts at Lorain and each of the three cohorts at Owens. The report alsopresents registration information for a sixth semester (the fourth postprogram semester) for eachcohort. Transcript data are used in Chapter 4 to help describe the impacts of the program.13 Appendix A presents a more comprehensive list of the characteristics that were collected on the BIF. Italso presents characteristics separately for the program group and control group members and discusses thedifferences between the research groups and any implications for the impact analyses described in this report.21
Lorain and Owens Financial Aid DataThe colleges shared with MDRC information about the amount and type of financialaid (exclusive of the Opening Doors stipend) that students in the research sample received.Chapter 4 presents financial aid outcomes through the third postprogram semester.Opening Doors Counseling and Stipend DataLorain and Owens provided to MDRC data about the counseling and stipends offeredas part of the Opening Doors program. Opening Doors counselors at both colleges recordedinformation in a database about their contacts with students. The colleges also recorded theincidence and amount of the Opening Doors stipend payments to students. These data are usedin Chapter 3 to help describe the implementation of the program.National Student Clearinghouse DataThe National Student Clearinghouse, a nonprofit organization, collects and distributesenrollment, degree, and certificate data from more than 3,300 colleges that enroll 92 percent ofthe nation’s college students. 14 The Clearinghouse data are used in Chapter 4 to provide informationabout sample members who may have attended a postsecondary institution other than Lorainor Owens. This report presents Clearinghouse data through the fourth postprogram semester.The Opening Doors 12-Month SurveyA survey was administered to Opening Doors sample members approximately 12months after random assignment. MDRC attempted to locate and interview all the samplemembers. Response rates were very high in Ohio: 85 percent of sample members completed thesurvey. 15 The survey included questions about a wide range of topics, including sample members’educational experiences, social relationships and supports, and health. 16 Selected measuresfrom the survey are used in Chapters 3 and 4.Field ResearchPeriodically throughout the operation of the Opening Doors program, MDRC staff visitedLorain and Owens to conduct field research. MDRC interviewed many college administra-14 National Student Clearinghouse (2009).15 See Appendix B for an analysis of the response rates for the 12-month survey and any implications forthe analysis.16 The Opening Doors 12-Month Survey included some questions from the Community College Survey ofStudent Engagement, with permission.22
tors, faculty, and staff, including those involved in the Opening Doors program. The interviewsprovided information on the operation of the program and about the key differences between theprogram and the standard college services that were available to the members of the study’scontrol group. MDRC observed some Opening Doors counseling sessions and reviewed keydocuments, such as program orientation materials. MDRC also interviewed a subset of programand control group members from Lorain for a special study at two of the colleges in the OpeningDoors demonstration about factors that affected students’ ability to persist in school. (BecauseOwens joined the Opening Doors demonstration a year after Lorain, it was not included in thestudy.) 17 Information from the field research is used in Chapter 3 to describe the program.17 The special study is discussed in Gardenhire-Crooks, Collado, and Ray (2006).23
Chapter 3The Implementation of the Ohio Opening Doors ProgramLorain County Community College and Owens Community College ran an OpeningDoors program that provided enhanced counseling from a counselor with a small caseload, inaddition to providing a modest stipend. This chapter describes how the program was developedand implemented. It then briefly covers the key differences between the program and the regularcollege environment facing the study’s control group. Finally, the chapter presents somefindings about sample members’ experiences in college. The chapter draws from field researchconducted by MDRC staff, Opening Doors counseling and stipend data from the two colleges,and data from the Opening Doors 12-Month Survey.The key implementation findings are:• Lorain and Owens succeeded in providing Opening Doors counseling servicesthat were more intensive, comprehensive, and personalized than the colleges’standard services. Data from the study’s 12-month survey show thatthe program increased the frequency with which students received academicadvising, financial aid advising, and other student services.• The Ohio colleges implemented the Opening Doors stipend component asdesigned — students could receive up to $300 in stipend payments over twosemesters. A total of 89.3 percent of the program group members received atleast one stipend payment, and 45.9 percent received the full $300.• The implementation analysis suggests that the Opening Doors program wassomewhat more intensive at Lorain than at Owens. Average caseloads werelower for Lorain’s Opening Doors counselors. Program group students atLorain received stipend payments at a higher rate and may have had morecontact with their counselor.History of the Opening Doors Program in OhioMDRC and the leadership of Lorain County Community College began working togetherin late 2002 to design an Opening Doors intervention. The college was interested inbuilding upon its existing network of student supports, as well as its previous efforts to provide25
targeted services to low-wage workers, displaced workers, 1 at-risk youth, and other groups ofstudents who might benefit. Over a period of several months, Lorain and MDRC defined andfleshed out the package of services that constituted the college’s Opening Doors program.Although Lorain initially considered targeting only students who were low-wage workers, itexpanded the eligibility criteria to meet the sample size requirements for the study and thusincluded a broader subset of the college’s low-income students, some of whom were notworking. Lorain launched its program during the fall 2003 semester.After Lorain had joined the Opening Doors demonstration, MDRC and some of thedemonstration’s funders were interested in including a second Ohio college in the study. Theleadership of Owens Community College was interested in the opportunity, and in late 2003,Owens and MDRC began working together. Various program interventions were discussed, butit was quickly agreed that Owens would implement a program similar to Lorain’s and target thesame population. To get help designing their program, Owens administrators visited Lorain tolearn about its program and its experiences in the study. The two colleges remained in touchthroughout the implementation of their programs. Owens ran a small pilot of its Opening Doorsprogram, serving about 35 students, during the summer 2004 semester, and kicked off its fullscaleprogram during fall 2004. The program operated at both Lorain and Owens through spring2006, with a new cohort at each college enrolling in the study every fall and spring semester2through fall 2005.Implementation of the Opening Doors ProgramAfter providing some information about the timing of the program services and the program’sstaffing, this section describes the implementation of the program’s enhanced studentservices and stipend.Timing of Program ServicesThe Ohio colleges operated their Opening Doors program to its full extent during thefall and spring semesters. The program’s designers intended that participating students wouldreceive the full array of program services for two semesters. Thus, program group students whostarted in Opening Doors in a fall semester continued through the spring, and students whobegan in a spring semester participated in the program the following fall semester.1 According to the U.S. Bureau of Labor Statistics (2008), “Displaced workers are defined as persons 20years of age and older who lost or left jobs because their plant or company closed or moved, there wasinsufficient work for them to do, or their position or shift was abolished.”2 At Lorain, the program was called “Opening Doors Enhanced Services.” At Owens, it was called “OwensPersonalized Enhancement Network,” or OPEN.26
Toward the end of each student’s second semester in the study, the Opening Doorscounselors prepared them to make the transition out of the program and encouraged them tobegin using the college’s standard advising and counseling services. During interviews withMDRC, Opening Doors counselors reported that some students continued to seek assistancefrom the program after their two semesters ended, and that the counselors tended to help thestudents who reached out to them. This scenario occurred more frequently at Lorain than it didat Owens.Also, some students in the program group received assistance from Opening Doorsduring the summer semester, but the services were far less intensive. During summers, counselorswere available to help students, but they did not offer help as proactively, systematically,or regularly. (As discussed below, during the summer of 2004, Lorain used extra programfunding to provide an additional $75 stipend to program group students who were taking atleast one course.)Administrative Structure, Staffing, and TrainingThe Opening Doors program at Lorain and Owens was housed in the Student Servicesdivision of the college and was overseen by administrators in that division. Each program had afull-time Opening Doors program coordinator, who also served as an Opening Doors counselor,and two or three part-time counselors. The part-time counselors all worked full time at thecollege, and thus had other duties (including working in the college’s counseling center, leadingcareer development workshops, and recruiting students to the college). At Lorain, one of thepart-time counselors spent about half of her time on Opening Doors, another spent about onefourthof her time on the program, and the third part-time counselor spent about one-tenth of histime on Opening Doors. At Owens, the part-time counselors each spent about half of their timeon Opening Doors.Most of the Opening Doors counselors had experience working at the college, while afew were hired for the program. The Opening Doors counselors received some training in theprogram model. Staff without experience as academic advisers also received training in thataspect of the role. Training topics included the requirements of different majors at the college,and course scheduling and registration issues.Both colleges assigned administrative staff to Opening Doors, who helped recruit samplemembers, scheduled appointments, and maintained program records. Owens also hired astudent worker to help with the administrative tasks, and arranged for staff from the college’sStudent Outreach Services (SOS) unit to call students during recruitment and to remind themabout appointments.27
Both programs experienced some staff turnover throughout the study, but turnover wasa more substantial issue at Owens. At Lorain, one of the part-time counselors left the college in2004, but she was replaced relatively quickly. At Owens, the program coordinator left theposition just before the first semester of implementation. A few months later, the senior administratorwho oversaw the program went on leave, owing to health problems. Over the program’stwo-year operations, two of the part-time counselors left their positions. Owens respondedquickly, filling most of the positions within weeks. When a counselor left the program duringthe summer of 2005, however, the college decided not to replace her. As a result, for the fall2005 and spring 2006 semesters, Owens’s Opening Doors program had two part-time counselors,rather than three. This affected caseload sizes, as discussed below.Enhanced Counseling and AdvisingThe linchpin of the Opening Doors program in Ohio was a team of counselors withwhom students were expected to meet regularly for two full semesters to discuss academicprogress and any issues that might affect their schooling. Each student was assigned to acounselor, who acted as the student’s primary contact, but students could, and sometimes did,see other counselors on the team. MDRC field research found that the Lorain program reliedsomewhat more heavily on the team approach than did the Owens program.The Opening Doors counselors each worked with far fewer students than other counselorsat the colleges. Lorain’s Opening Doors program had the equivalent of one full-timecounselor for every 81 students participating in the program in a given semester, on average. AtOwens, the corresponding number was 157. At Owens, caseload sizes peaked when the programhad only two part-time counselors, rather than three. During the fall 2005 semester,Owens had one full-time Opening Doors counselor for every 256 program group students.For the control group, the ratio of students to counselors or advisers at the colleges wasmore than 1,000 to 1. Although the Opening Doors counselors worked with far fewer studentsthan typical counselors or advisers, they reported to MDRC that sometimes it was difficult tokeep on top of their work and they felt frustrated that they were not doing everything theycould for their students. This was especially true during the period when caseload sizes werelargest at Owens.The counseling in Opening Doors was designed to be more intensive, personalized, andcomprehensive than what students would typically receive at Lorain or Owens. The markedlylower student-to-staff ratio in the program allowed counselors to see students more frequentlyand spend more time with them. This increased contact, the program’s designers posited, wouldallow the counselors to uncover and address more issues relevant to the students’ success inschool. During each of the two program semesters (fall and spring), students were expected to28
meet with their counselor a minimum of twice, once shortly before or early in the semester, andthen again in mid-semester. These meetings triggered the payment of the Opening Doorsstipend, as described below.As was intended by the program’s designers, the program coordinator at Lorain stronglyencouraged the counselors to contact students much more frequently than twice a semester.This message became increasingly strong as the program matured. MDRC’s field researchsuggests that the message that counselors should try to meet with students frequently was not asstrong at Owens. In addition, since the Opening Doors counselors at Owens had larger caseloadsthan the counselors at Lorain, maintaining frequent contact was more challenging atOwens. Although the Opening Doors counselors strongly encouraged students to participate inthe program, there were no sanctions for students who did not meet with their counselor (otherthan not receiving the stipend).One of the counselors at Lorain typically worked at least one evening a week, and oneof the counselors at Owens typically worked on Saturdays. As was true during regular hours,students could make appointments or just drop in.In the counseling sessions that MDRC observed, staff and students talked about a rangeof issues, including course scheduling, registration, financial aid and other financial issues,tutoring, work-based learning efforts, juggling school and work, career aspirations, and personalissues. The Opening Doors counselors provided one-on-one counseling themselves, andreferred students to other services on and off campus. Because the Opening Doors counselorswere not trained as therapists, they did not delve into psychological issues with students. One ofthe part-time counselors at Lorain had expertise as a career development specialist, and she metwith many of the participating students to help them explore career options and align theiracademic efforts with their employment goals. For the most part, based on the observedcounseling sessions, the Opening Doors counselors seemed to have developed comfortable,trusting relationships with students.MDRC field research suggested that the program started up more slowly at Owens thanat Lorain, and that services were less intensive. As a result, MDRC provided more technicalassistance to the program staff at Owens. MDRC provided advising guides to the counselors tohelp structure the two expected meetings with students. The guides focused the conversationson anticipating and overcoming challenges to completing courses, and on students’ short- andlong-term goals. At the first counseling session, students were given a resource binder, preparedfor Opening Doors, which provided information about Owens’s academics, financial aid,tutoring, and other campus services, as well as services available in the community.To facilitate the enhanced counseling in Opening Doors, the colleges created a databaseto record key information about participating students and their contacts with staff. The coun-29
selors recorded their in-person and telephone contacts with students, including the length of themeeting and the topics covered. They sometimes also noted e-mail or regular mail communications.In interviews, the counselors said they sometimes reviewed the information prior totalking with a student. As noted above, students sometimes met with an Opening Doors counselorwho was not their primary contact. The database allowed staff to review the records forany participating student, facilitating the team approach.Table 3.1 presents some information from the colleges’ Opening Doors counseling database.The data from Owens do not reliably distinguish between in-person and telephonecontacts, so the table shows tallies for both types together. During students’ first semester in theprogram, 94.3 percent of the pooled program group members had at least one contact with anOpening Doors counselor either in person or over the telephone. The program group averagedjust over four such contacts during that semester.During the second program semester, 71.4 percent of the program group members hadcontact in person or over the telephone with a counselor. The lower proportion, compared withthe first semester, likely reflects the decrease in the proportion of students who were takingclasses. (Registration rates are discussed in Chapter 4.)As the bottom panel of Table 3.1 shows, 95.4 percent of the program group membershad at least one in-person or telephone contact with an Opening Doors counselor during theirtime in the study. The majority of program group students — 58.4 percent — had at least sixcontacts, and the average number of contacts was just over eight. The summary outcomesinclude contacts during the two main program semesters (fall and spring), summer semesters,and any postprogram semesters. 3 A total of 17.1 percent of the program group members hadcontact with an Opening Doors counselor after their second program semester.Appendix Table C.1 shows information on students’ contact with Opening Doors counselorsseparately for each college. According to the Opening Doors databases, a higher proportionof the program group at Lorain had contact in person or over the phone with a counselor,and the contact was more frequent. Lorain staff may have been more diligent about enteringcontacts into the database, so this comparison should be interpreted cautiously. (Also, for themost part, the 12-month survey data that are discussed below do not show higher rates ofcontact for the Lorain program group compared with the Owens program group.)3 The data include contacts through the spring 2006 semester.30
The Opening Doors DemonstrationTable 3.1Opening Doors Counseling Sessions Among the Program Group MembersLorain County Community College and Owens Community College ReportOutcomeProgramGroupFirst program semesterHad one or more contacts with counselor (%) 94.3Number of contacts (%)0 5.71-2 27.53-5 42.26 or more 24.6Average number of contacts 4.1Second program semesterHad one or more contacts with counselor (%) 71.4Number of contacts (%)0 28.61-2 31.43-5 26.06 or more 14.0Average number of contacts 2.7Summary outcomes aHad one or more contacts with counselor (%) 95.4Number of contacts (%)0 4.61-2 13.63-5 23.46 or more 58.4Average number of contacts 8.2Sample size 1,073SOURCES: MDRC calculations from Lorain County Community College and Owens Community CollegeOpening Doors counseling data.NOTES: Rounding may cause slight discrepancies in sums and differences.“Contact” includes all contact between students and counselors determined to be in person or over thetelephone.aAfter the second program semester, 184 sample members (17.1 percent) had contact with a counselor.Summary outcomes include data through spring 2006.31
OutcomeFirst program semesterProgramGroupReceived one or more stipend payments (%) 87.7Received full $150 70.8Average stipend amount received per recipient a ($) 140Second program semesterReceived one or more stipend payments (%) 60.1Received full $150 48.4Average stipend amount received per recipient a ($) 138Summary outcomes bThe Opening Doors DemonstrationTable 3.2Opening Doors Stipend Receipt Among the Program Group MembersLorain County Community College and Owens Community College ReportReceived one or more stipend payments (%) 89.3Received full $300 45.9Average stipend amount received per recipient a ($) 234Sample size 1,073SOURCES: MDRC calculations from Lorain County Community College and Owens Community CollegeOpening Doors stipend data.NOTES: Rounding may cause slight discrepancies in sums and differences.aThe denominator in this outcome is stipend recipients rather than all program group members.bAfter the second program semester, 27 sample members (2.5 percent) received stipend payments.Summary outcomes include data through spring 2006.second program semester, the proportion of students receiving the stipends dropped somewhat,likely reflecting that fewer students were registered for classes (see Chapter 4). During thatsemester, 60.1 percent of the program group members received a stipend payment, and 48.4percent received the full $150.As shown at the bottom of Table 3.2, the vast majority — 89.3 percent — of the programgroup members in Ohio received at least one stipend payment during their time in thestudy, but less than half — 45.9 percent — received the full $300. 6 Among program groupmembers who received at least one payment, the average total stipend amount was $234.6 The summary outcomes include stipend payments through the spring 2006 semester.34
Appendix Table C.2 shows information about the Opening Doors stipend for each college.A higher proportion of the program group members at Lorain received at least one stipendpayment, compared with Owens, and a higher proportion at Lorain received the full $300.The program at Lorain had extra funds during its first year, so it offered an additional$75 to students who enrolled in courses during the summer 2004 semester and attended acounseling session. In all, 18.2 percent of the full program group at Lorain received the extra$75 during summer 2004 (not shown in Table C.2). 7The 12-month survey asked program group members how they used their OpeningDoors stipend. Although the sample members reported using the money for a variety ofpurposes, the three most common responses were purchasing books and school supplies,paying bills, and buying gas or bus fare. Interviews with some program group students atLorain suggested that although the stipend was appreciated, in general, it did not substantiallyimprove students’ finances.Differences Between the Opening Doors Program and the ControlGroup EnvironmentThis study compares the academic (and other) outcomes of students in the programgroup with outcomes of students in the control group, whose members had access to thestandard services available at the colleges. Table 3.3 summarizes the key differences betweenthe Opening Doors program at Lorain and Owens and the regular college environment that thecontrol group members faced.Students in the study’s control group in Ohio had access to the colleges’ regular counselingand advising staff. As already noted and as is typical in community colleges, the studentto-staffratio at Lorain and Owens was more than 1,000 to 1. Regular counselors and advisersdid not carry caseloads of students and typically did not initiate contact or follow up withstudents. 8 The counseling tended to be short-term and focused on academic issues, rather than7 Because of the timing, only some of Lorain’s program group members were eligible for the extra moneyduring the summer 2004 semester: those who had been randomly assigned for the fall 2003 semester and thespring 2004 semester, and students who were assigned for the fall 2004 semester by the start of the summer. Atotal of 43.3 percent of the program group members from the fall 2003 and spring 2004 cohorts received the$75 payment, as did 23.3 percent of the program group members from the fall 2004 cohort.8 At Lorain, academic advisers are generalists who work with newer students to assist them with scheduling,financial aid, and course placement. Counselors, who tend to specialize in certain areas of study at Lorain,are available to work with students who need help determining their career direction or who are further along infulfilling their degree requirements. This report refers to the Opening Doors staff as counselors, but their work(continued)35
The Opening Doors DemonstrationTable 3.3Key Differences Between the Opening Doors Program and Regular College ServicesLorain County Community College and Owens Community College ReportProgram Feature Opening Doors Program Regular College ServicesCounseling andadvisingOpening Doorsstipend• Student-to-counselor ratio averaged lessthan 160 to 1• Students assigned to counselor, with whomthey were expected to meet regularly• Counseling was personalized, intensive,and comprehensive• Designated contact in financial aid office• Program group members had average of 8in-person or telephone contacts with OpeningDoors counselor during study• $150 per semester for two semesters, for atotal of $300• Paid after meetings with counselors toencourage contact• 89.3 percent of program group membersreceived at least one stipend payment• 45.9 percent received full $300• Extra $75 paid at Lorain during summer2004 to some program group members• Student-to-counselor ratioaveraged more than 1,000 to 1• Students not assigned tocounselor, met with counselorsas needed• Counseling tended to be shorttermand focused on academicissues• No designated contact infinancial aid office• No Opening Doors stipendSOURCE: MDRC field research data.on a broader set of issues that could affect students’ success in college. Furthermore, controlgroup students were not eligible for the Opening Doors stipend.As discussed above, both Lorain and Owens offered some additional services as part ofOpening Doors beyond the enhanced counseling, but only a small subset of the program groupmembers received those services. For the most part, the services were not available for thecontrol group members.Although the implementation analysis suggests that the Opening Doors program wassomewhat more intensive at Lorain than at Owens — average caseloads were lower for Lorain’sencompasses the responsibilities of the college’s advisers, as well. At Owens, advising and counseling dutiesare performed by the same staff members.36
Opening Doors counselors, and program group students at Lorain received stipend payments at ahigher rate and may have had more contact with their counselors — the difference between theprogram and the control group environment at the two colleges was much more substantial thanthe difference between the programs at the two colleges.Students’ Experiences in the Opening Doors Program and theControl Group EnvironmentThis section discusses some results from the Opening Doors 12-Month Survey aboutsample members’ experiences in college. 9 Table 3.4 shows the proportion of the pooled Ohioprogram group and control group that reported receiving various student services at least threetimes during the year after they entered the study. If the Ohio Opening Doors program providedadditional student services as intended, differences between the two research groups would beexpected in most of these categories.Program Control Difference StandardOutcome (%) Group Group (Impact) ErrorAttended 3 or more times during first year in studyThe Opening Doors DemonstrationTable 3.4Sample Members’ Receipt of Student ServicesLorain County Community College and Owens Community College ReportAcademic advising 64.0 40.2 23.9 *** 2.3Financial aid advising 49.2 40.4 8.8 *** 2.3Tutoring on campus 34.4 28.8 5.6 ** 2.2Career counseling 23.9 13.6 10.3 *** 1.8Job placement assistance 14.3 9.0 5.3 *** 1.5Advising about transferring earned credits 16.8 12.4 4.4 *** 1.7Sample size (total = 1,813) 910 903SOURCE: MDRC calculations from the Opening Doors 12-Month Survey.NOTES: Rounding may cause slight discrepancies in sums and differences.A two-tailed t-test was applied to differences between research groups. Statistical significance levels areindicated as: *** = 1 percent; ** = 5 percent; * = 10 percent.Estimates are adjusted by cohort and college.9 See Appendix B for an analysis of the survey response rates and any implications for the analysis.37
Box 3.1How to Read the Impact Tables in This ReportMost tables in this report use a similar format. The abbreviated table below displays survey data and showssome educational outcomes for the program group and the control group. The first row, for example, showsthat 64.0 percent of the program group members and 40.2 percent of the control group members attendedacademic advising three or more times during their first year in the study.Because individuals were assigned randomly either to the program group or to the control group, the effectsof the program can be estimated by the difference in outcomes between the two groups. The “Difference”column shows the differences between the two research groups’ outcomes — that is, the program’s estimatedimpacts on the outcomes. For example, the estimated impact on attending academic advising three ormore times during the first year of the study can be calculated by subtracting 40.2 percent from 64.0 percent,yielding an increase, or estimated impact, of 23.9 percentage points. This difference represents the estimatedimpact rather than the true impact because, although study participants are randomly assigned to the programand control groups, differences can still occur by chance.Differences marked with one or more asterisks are statistically significant, meaning that there is only a smallprobability that the observed difference occurred by chance. The number of asterisks indicates the probabilityof observing the same or larger differences if the program had no impact. One asterisk corresponds to a 10percent probability; two asterisks, a 5 percent probability; and three asterisks, a 1 percent probability. Forexample, as shown in the first row below, the program’s estimated impact on attending academic advisingthree or more times is 23.9 percentage points. The three asterisks indicate that this difference is statisticallysignificant at the 1 percent level, meaning that there is less than a 1 percent chance of observing a differencethis large by chance (that is, if the program’s true impact is zero).The statistical significance is calculated using the standard error of the impact estimate — a measure ofuncertainty or variability around the impact estimate. There is about a 90 percent chance that the true impactis within plus or minus 1.65 standard errors of the estimated impact, roughly a 95 percent chance that thetrue impact is within plus or minus 1.96 standard errors of the estimated impact, and about a 99 percentchance that the true impact is within plus or minus 2.58 standard errors of the estimated impact. For example,in the first row of data below, there is roughly a 99 percent chance that the impact on students whoattended academic advising three or more times during the first year of the study lies between 18.0 and 29.8percentage points, calculated as 23.9 ± (2.58 × 2.3).On survey tables that use scales to represent some outcomes, effect size is also given. The effect size providesa way to interpret the substantive significance of an effect. It is calculated as the impact divided by thestandard deviation of the control group. The standard deviation is the measurement of the distribution of dataabout an average value. Thus, the effect size is a measure of the impact on a standardized scale.ProgramGroupControlGroupDifference(Impact)StandardErrorOutcome (%)Attended 3 or more times during firstyear of studyAcademic advising 64.0 40.2 23.9 *** 2.3Financial aid advising 49.2 40.4 8.8 *** 2.3Tutoring on campus 34.4 28.8 5.6 ** 2.239
Program Control Difference StandardOutcome (%) Group Group (Impact) ErrorCan identify a staff member or instructor for support/guidanceWith personal or family issues 65.9 48.5 17.4 *** 2.3With education and career goals 62.6 45.6 17.0 *** 2.3Among those who attended an Opening Doorscollege during first year of studyThe Opening Doors DemonstrationTable 3.5College Experiences of Sample MembersLorain County Community College and Owens Community College ReportIntegration and sense of belonging at school aLow 17.4 19.8 -2.5 2.0High 17.8 15.0 2.8 1.9Rated college experience good or excellent b 87.5 81.7 5.8 *** 1.8Sample size (total = 1,813) 910 903SOURCE: MDRC calculations from the Opening Doors 12-Month Survey.NOTES: Rounding may cause slight discrepancies in sums and differences.A two-tailed t-test was applied to differences between research groups. Statistical significance levels areindicated as: *** = 1 percent; ** = 5 percent; * = 10 percent.Estimates are adjusted by cohort and college.a Eight-item scale about sense of integration with and belonging to the school community; response categoriesrange from 1 = “strongly disagree” to 4 = “strongly agree.” “Low” is the percentage of sample members scoringone standard deviation below the mean; “high” is the percentage of sample members scoring one standarddeviation above the mean. Standard deviation is the measurement of the distribution of data about an averagevalue. It describes the amount of variation in the data on either side of the average value. Of the 1,813 surveyrespondents, 1,520 answered the questions that made up these scales.bOf the 1,813 survey respondents, 1,593 answered this question.Table 3.5 does suggest, however, that the program increased students’ overall satisfactionwith their college experience. Among survey respondents who had attended class atLorain or Owens during their first year in the study, 87.5 percent of the program group membersrated their college experience as either good or excellent, compared with 81.7 percent ofthe control group.Appendix Table C.4 shows the outcomes in Table 3.5 for each college separately. Theimpacts at Lorain and Owens are not statistically distinguishable from one another.Qualitative Findings from Lorain County Community CollegeMDRC interviewed some sample members at Lorain as part of a qualitative study attwo of the colleges in the Opening Doors demonstration about factors that affected students’40
ability to persist in school. (The other college in the qualitative study was KingsboroughCommunity College. Because Owens joined the Opening Doors demonstration a year afterLorain, it was not included in the study.) Program group students at Lorain rated their counselingexperiences highly. They reported interacting more often and more intensively with counselorsthan the control group students who were interviewed. Most said that they could drop inon their Opening Doors counselor without an appointment, and others said they could call or e-mail and get quick responses.Discussing the Opening Doors counseling services, one student who had been out ofhigh school for a few years said:I feel like if I had the kind of help they’ve given me when I tried to start rightafter high school, I might have already completed my degree. Maybe I justneeded the counseling that I didn’t know [how] to get. 11Students reported that they received help from their Opening Doors counselor with academicissues, as well as personal problems that were interfering with their school performance.A program group student who had an acute health problem described the help she received:I was in the hospital last semester…. I got put in ICU. [My Opening Doorscounselor] went to all of my instructors and … he just went over the top. If Ihadn’t been in this program, I might have had to drop out. And then I endedup with a 3.0 GPA…. I really felt appreciation for him. 12In sum, the 12-month survey and the interviews with sample members from Lorainprovide evidence that the Opening Doors program positively affected at least some samplemembers’ experiences in college.Looking to the Report’s Next ChapterThe results discussed in this chapter show that Lorain and Owens operated an OpeningDoors program that provided services that were distinctly different from those that wereavailable to the study’s control group members. The counseling services were more intensive,comprehensive, and personalized than the colleges’ standard services, and almost all of theprogram group members received at least one stipend payment. Furthermore, participatingstudents expressed positive views about the Opening Doors services. The next question that thisreport addresses is whether the differences in services yielded substantial changes in students’academic and other outcomes. The following chapter discusses the answer to that question.11 Gardenhire-Crooks, Collado, and Ray (2006), p. 17.12 Gardenhire-Crooks, Collado, and Ray (2006), p. 17.41
Chapter 4The Effects of Enhanced Student Services anda Modest StipendThe Opening Doors program that was operated at Lorain County Community Collegeand Owens Community College may have had a positive effect on a variety of outcomes instudents’ lives. Central among those outcomes is academic success. This chapter focusesprimarily on the impacts of the Opening Doors program on educational outcomes as far as sixsemesters after students first enrolled in the study. Other outcomes that are considered includestudents’ receipt of financial aid and their social, psychological, and health outcomes. Theseoutcomes were measured using a variety of data sources collected after students were randomlyassigned either to the program group (which was eligible to receive enhanced student servicesand a modest stipend) or to the control group (which received the college’s standard services).Data sources include a survey conducted approximately 12 months after random assignment;transcript and financial aid data from the colleges; and data on student enrollment from anational clearinghouse, which allows the analysis to account for the fact that some students mayhave enrolled at schools other than Lorain or Owens during the follow-up period. 1The key impact findings are:• There is no evidence of meaningful program impacts on educational outcomesduring the first program semester.• There is strong evidence of positive program impacts on educational outcomesduring the second program semester. Students in the program groupoutperformed their control group counterparts with respect to registrationrates, average number of credits attempted, and average number of creditsearned during this semester.• There is evidence that the program increased registration rates during the firstsemester after the program ended. The positive impacts dissipated during thefollowing three semesters, providing little evidence that the program had lastinglong-term impacts on educational outcomes.• There is little evidence that the program’s impacts on educational outcomeswere significantly different across the two colleges.1 The data sources are described in detail in Chapter 2.43
Unless otherwise noted, the results presented in this chapter are pooled across the twocolleges to present the program’s overall impact. Appendixes include college-specific impactsand estimates of whether the impacts are different across the two colleges. The chapter focuseson the pooled sample for several reasons: First, pooled results show, as simply as possible,whether the program worked overall. Second, although somewhat more intensive at Lorain onsome measures, the implementation of the program was generally quite similar across the twocolleges. Finally, there was very little detectable difference in impacts across the two colleges, soshowing both sets of results complicates the story while not changing the general conclusions.This chapter begins with a discussion of the program’s impacts on educational outcomes,such as registration and credits earned, during the six semesters following random assignment foreach sample member. This is followed by a discussion of analyses of educational outcomes byselected subgroups, including an assessment of whether the program’s impacts on educationaloutcomes were different by college and gender. The discussion then turns to more generaleducational outcomes, including enrollment at institutions beyond Lorain and Owens, during thesix semesters after random assignment. The final two sections of this chapter briefly discuss theprogram’s impacts on financial aid and social, psychological, and health outcomes.As described more fully in Box 3.1 in Chapter 3, the tables in this chapter present averageoutcomes for the students assigned to the program group and the control group, the differencebetween the two groups’ averages (which represents the estimated impact of the program),and the standard error of the difference. The average outcomes are adjusted for each student’scohort, which reflects the point at which the student was randomly assigned to the programgroup or control group, and his or her college. No other covariates are included. 2 A descriptionof the statistical model used in the impact analyses appears in an earlier MDRC report. 3Effects on Education Outcomes: Transcript MeasuresEnhanced student services and a modest stipend may be an effective strategy to improvestudents’ chances of achieving academic success at community colleges. Explored first inthis section is whether the program had positive impacts during the two semesters whenprogram group students were eligible to receive the enhanced student services and modeststipend (referred to as the “program semesters”). This is followed by analyses of whether theprogram had impacts during the four semesters after program group students were eligible forthe Opening Doors services (referred to as the “postprogram semesters”).2 Sensitivity analyses were conducted controlling for selected student baseline characteristics on whichprogram and control group students differed at baseline. The results presented in this chapter are substantivelythe same when the impacts are adjusted.3 Brock and LeBlanc (2005), Appendix A.44
Program SemestersTable 4.1 (page 47) shows some academic outcomes from the two program semesters.During the first program semester, program group students and control group students registeredfor courses at very similar rates; 89.9 percent and 88.6 percent, respectively, registered forat least one course. It is not surprising to observe nonsignificant differences in registration ratesduring the first program semester because registration occurred before the program groupstudents received a significant portion of, and oftentimes any, program services. In contrast, theprogram might be expected to positively affect the number of credits earned; however, nosignificant program impact was observed on the total number of credits attempted or earnedduring the first program semester.Whereas there was little evidence of meaningful program impacts during the first programsemester, during the second program semester there was strong evidence of positiveprogram impacts. Most notably, as shown in Table 4.1 during the second program semester,65.3 percent of program group students registered for at least one class compared with only 58.3percent of control group students. This difference reflects a 7.0 percentage point programimpact on registration. The program’s impact on second semester registration is likely primarilythe lagged effect of program services offered during the first program semester, since registrationusually occurs prior to the start of the semester.Table 4.1 also shows that the registration pattern held true for the average number ofcredits attempted and earned. During the first program semester, no impacts were observed onthe average number of credits attempted or earned, whereas during the second program semester,program group students, on average, attempted 0.7 more credit and earned 0.4 more creditthan did their control group counterparts. Where significant impacts on average credits attemptedand earned were observed, it is possible that the program’s positive impact on registrationwas driving these results. In fact, there is evidence supporting this hypothesis.One way to examine whether the program’s impact on registration was driving the program’simpact on average credits attempted and earned is to calculate the expected programimpact on average credits attempted and earned given the program’s impact on registration.Under the assumption that the program groups’ additional registrants attempted and earnedcredits at the same rate as control group registrants, the expected program impacts on averagecredits attempted and earned would be 0.75 and 0.42, respectively. 4 The actual observed4 The following calculation was made to obtain these numbers: Among the 58.3 percent of control groupstudents who registered during the second program semester, the average number of credits attempted was 10.8and the average number of credits earned was 6.1 (not shown in Table 4.1; tables present credits attempted andearned for the full sample, not just among those who registered). The program’s estimated impact on registrationwas 6.95 percentage points (rounded to 7.0 in Table 4.1), representing an additional 74.6 (0.0695 × 1,073)(continued)45
impacts were 0.72 and 0.41. While the calculation of the expected impacts is based upon theunverifiable assumption that additional program group registrants attempted and earned creditsat the same rate as control group registrants, this analysis provides some evidence that theincreases in credits attempted and earned were driven by increased registration rates during thesecond program semester.This example highlights two interesting points. First, increased registration is an extremelyimportant program impact since it is almost certain to affect most other key educationaloutcomes. Second, because of the relationship between registration and other outcomes ofinterest, it is difficult to disentangle the program’s direct impact on credits earned from itsindirect impact on credits earned that are a result of its impact on registration. Nevertheless,while the results are not independent, there is strong evidence that the Opening Doors programhad a positive impact on registration, credits attempted, and credits earned during the secondprogram semester.Also of note is the fact that during both program semesters, program group studentswithdrew from at least one course at a higher rate than did control group students. While theother second semester impacts (increased registration, increased credits attempted, and increasedcredits earned) are positive program outcomes, the higher rate of withdrawing from anycourse among program group students is an ambiguous finding. It is possible that programgroup students were advised to withdraw from courses that were a mismatch for them orcourses that they were on track to fail. Withdrawing from such courses might enable students tofocus their energies on completing their other courses, an outcome that could be viewed aspositive. However, it is also possible that the Opening Doors counselors successfully convincedstudents to attempt more credits than they could handle, leading to increased withdrawalsamong program group students, an outcome that could be viewed as negative. Finally, much asthe average number of credits attempted and earned may be influenced by the program’s impacton registration rates, the percentage of students who withdraw from any course is also likely tobe influenced by the program’s impact on registration rates. Notably, in the first programsemester, there was no impact on registration, so in this semester the impact on withdrawalsappears to be a direct result of the program, not an artifact of increased registration.registrants as a result of the program — registrants who otherwise would have attempted and earned zerocredits. If these additional registrants attempted and earned credits at the same rate as registered control groupmembers, then the program group could expect an additional 805 (74.6 × 10.8) attempted credits and anadditional 454 (74.6 × 6.1) earned credits as a result of increased registration rates alone. Averaging theseadditional credits across all program group students yields 0.75 (805 ÷ 1,073) additional credits attempted and0.42 (454 ÷ 1,073) additional credits earned. (Numerical discrepancies are a result of rounding.)46
Program Control Difference StandardOutcome Group Group (Impact) ErrorFirst program semesterRegistered for any courses (%) 89.9 88.6 1.3 1.3Average number of credits attempted 9.8 9.7 0.2 0.2Regular credits 6.2 6.3 -0.1 0.2Developmental credits 3.5 3.3 0.2 * 0.1Average number of credits earned 5.3 5.1 0.2 0.2Regular credits 3.5 3.6 -0.1 0.2Developmental credits 1.8 1.5 0.2 ** 0.1Passed all courses (%) 31.3 31.3 0.0 2.0Withdrew from any courses (%) 30.0 26.2 3.8 ** 1.9Term GPA (%)0 to 1.9 34.9 34.3 0.7 2.02.0 or higher 44.1 43.0 1.0 2.1No GPA a 21.0 22.7 -1.7 1.8Second program semesterThe Opening Doors DemonstrationTable 4.1Transcript Outcomes, First and Second Program SemestersLorain County Community College and Owens Community College ReportRegistered for any courses (%) 65.3 58.3 7.0 *** 2.1Average number of credits attempted 7.0 6.3 0.7 *** 0.3Regular credits 5.4 4.9 0.4 ** 0.2Developmental credits 1.6 1.3 0.3 ** 0.1Average number of credits earned 4.0 3.5 0.4 ** 0.2Regular credits 3.2 3.0 0.2 0.2Developmental credits 0.7 0.5 0.2 ** 0.1Passed all courses (%) 24.2 22.0 2.2 1.8Withdrew from any courses (%) 21.5 18.7 2.8 * 1.7Term GPA (%)0 to 1.9 25.9 22.5 3.4 * 1.82.0 or higher 34.1 31.5 2.6 2.0No GPA a 39.9 46.0 -6.1 *** 2.1Sample size (total = 2,139) 1,073 1,066(continued)47
Table 4.1 (continued)SOURCES: MDRC calculations from Lorain County Community College and Owens Community Collegetranscript data.NOTES: Rounding may cause slight discrepancies in sums and differences.A two-tailed t-test was applied to differences between research groups. Statistical significance levels areindicated as: *** = 1 percent; ** = 5 percent; * = 10 percent.Estimates are adjusted by cohort and college.GPA = grade point average.Grades earned in all courses except for developmental courses are used in the calculation of term GPA.a The “No GPA” category includes students who did not enroll and students who took onlydevelopmental courses, which are not included in GPA calculations.In sum, there is no significant evidence that the program produced positive educationaloutcomes during the first program semester. There is convincing evidence, however, that theprogram had a significant positive impact on retention during the second program semester.Postprogram SemestersTable 4.2 shows academic outcomes during the four postprogram semesters (that is, forthe third, fourth, fifth, and sixth semesters after random assignment). During the first postprogramsemester, 43.7 percent of program group members registered compared with 40.0 percentof control group members. While smaller in magnitude than the program’s second semesterimpact on registration, this 3.7 percentage point impact is statistically significant. Thus, in eachof the semesters immediately following the Opening Doors services, program group studentsregistered at a higher rate than their control group counterparts.Given the finding of positive program impacts on registration rates during each of thetwo semesters immediately following the Opening Doors services, the next logical question iswhether these impacts persisted into the future. Table 4.2 shows that, with respect to registration,statistically significant differences between the research groups disappeared after the firstpostprogram semester. In addition, with respect to credits attempted and earned, statisticallysignificant differences between the research groups were generally not observed once theprogram services were no longer offered. Overall, it appears that the program’s positive impactsduring the second program semester began to fade once the program was complete. In otherwords, there is no convincing evidence of long-term impacts from the Opening Doors programat Lorain and Owens.48
Program Control Difference StandardOutcome Group Group (Impact) ErrorFirst postprogram semesterRegistered for any courses (%) 43.7 40.0 3.7 * 2.1Average number of credits attempted 4.5 4.1 0.4 0.2Regular credits 3.8 3.6 0.2 0.2Developmental credits 0.7 0.5 0.1 * 0.1Average number of credits earned 2.7 2.6 0.0 0.2Regular credits 2.4 2.4 0.1 0.2Developmental credits 0.3 0.3 0.0 0.0Term GPA (%)0 to 1.9 15.0 12.6 2.5 * 1.52.0 and higher 25.3 25.3 0.0 1.9No GPA a 59.6 62.1 -2.5 2.1Second postprogram semesterRegistered for any courses (%) 34.5 32.3 2.2 2.0Average number of credits attempted 3.4 3.3 0.2 0.2Regular credits 3.1 3.0 0.1 0.2Developmental credits 0.3 0.3 0.0 0.0Average number of credits earned 2.1 2.1 0.0 0.2Regular credits 2.0 2.0 0.0 0.2Developmental credits 0.1 0.1 0.0 0.0Term GPA (%)0 to 1.9 12.5 10.1 2.4 * 1.42.0 and higher 19.9 20.3 -0.3 1.7No GPA a 67.5 69.6 -2.1 2.0Third postprogram semesterThe Opening Doors DemonstrationTable 4.2Transcript Outcomes, First Through Fourth Postprogram SemestersLorain County Community College and Owens Community College ReportRegistered for any courses (%) 28.9 25.9 3.0 1.9Average number of credits attempted 2.9 2.4 0.4 ** 0.2Regular credits 2.6 2.3 0.4 * 0.2Developmental credits 0.2 0.2 0.1 0.0(continued)49
Program Control Difference StandardOutcome Group Group (Impact) ErrorAverage number of credits earned 1.9 1.7 0.1 0.2Regular credits 1.8 1.6 0.2 0.2Developmental credits 0.1 0.1 0.0 0.0Term GPA (%)0 to 1.9 8.6 6.1 2.5 ** 1.12.0 and higher 18.3 18.3 0.0 1.7No GPA a 73.1 75.6 -2.5 1.9Fourth postprogram semester bTable 4.2 (continued)Registered for any courses (%) 24.4 23.2 1.3 1.8Average number of credits attempted 2.3 2.1 0.2 0.2Regular credits 2.2 1.9 0.3 0.2Developmental credits 0.1 0.2 0.0 0.0Sample size (total = 2,139) 1,073 1,066SOURCES: MDRC calculations from Lorain County Community College and Owens Community Collegetranscript data.NOTES: Rounding may cause slight discrepancies in sums and differences.A two-tailed t-test was applied to differences between research groups. Statistical significance levels areindicated as: *** = 1 percent; ** = 5 percent; * = 10 percent.Estimates are adjusted by cohort and college.GPA = grade point average.aThe “No GPA” category includes students who did not enroll and students who took onlydevelopmental courses, which are not included in GPA calculations.bThe fourth postprogram semester does not include data for credits earned or term GPA.Cumulative ResultsTable 4.3 shows some cumulative academic outcome measures from the first programsemester through the third postprogram semester; registration data also include the fourthpostprogram semester. The cumulative results suggest that over the course of three years,program group students registered in 0.2 more semester than did control group students. Inaddition, during the first two and a half years after random assignment, compared with controlgroup students, program group students earned 0.4 more developmental credit. There was nostrong evidence of positive program impacts on overall (regular plus developmental) cumulativecredits earned, nor was there strong evidence of positive program impacts on students’ likelihoodof earning a degree or certificate. Overall, it appears that the program’s positive impactson educational outcomes are fairly limited.50
The Opening Doors DemonstrationTable 4.3Cumulative Transcript Outcomes,First Program Semester Through Third Postprogram SemesterLorain County Community College and Owens Community College ReportProgram Control Difference StandardOutcome Group Group (Impact) ErrorRegistered for any courses a (%) 93.9 93.0 1.0 1.1Average number of semesters registered a 3.3 3.1 0.2 ** 0.1Average number of credits earned 17.4 16.6 0.8 0.8Regular credits 14.3 13.9 0.4 0.7Developmental credits 3.1 2.7 0.4 ** 0.2Cumulative GPA (%)0 to 1.9 45.7 44.6 1.0 2.12.0 and higher 41.8 41.6 0.2 2.1No GPA b 12.5 13.7 -1.2 1.5Earned a degree/certificate (%) 1.6 2.5 -1.0 0.6Sample size (total = 2,139) 1,073 1,066SOURCE: MDRC calculations from Lorain County Community College and Owens Community Collegetranscript data.NOTES: Rounding may cause slight discrepancies in sums and differences.A two-tailed t-test was applied to differences between research groups. Statistical significance levelsare indicated as: *** = 1 percent; ** = 5 percent; * = 10 percent.Estimates are adjusted by cohort and college.GPA = grade point average.aOutcomes are from the first program semester through the fourth postprogram semester, and includesummer semesters.bThe “No GPA” category includes students who did not enroll and students who took onlydevelopmental courses, which are not included in GPA calculations.Effects on Educational Outcomes for Selected Subgroups:Transcript MeasuresThis section presents (with accompanying tables in Appendix E) impacts on educationaloutcomes, by college and by gender. These analyses assess whether there were impacts for theselected subgroups of students (for example, students at Lorain County Community College) andwhether there were differential impacts between subgroups of students (that is, whether themagnitude of the program’s impact at Lorain differed from the magnitude of the program’simpact at Owens). Differential impacts between subgroups might occur for a variety of reasons.51
For example, one of the two studied colleges may have implemented the program more effectivelythan the other; or, the program itself may be a more effective strategy at boosting academicsuccess for females than it is for males. Such possibilities are explored in this section.Transcript Outcomes by CollegeAssessed here is whether the program’s impact at Lorain County Community Collegediffered from its impact at Owens Community College. The program’s impacts could bedifferent because, as noted in Chapter 2, the study participants at the two colleges were somewhatdifferent. Sample members from Lorain were more likely to be women, older, married,and parents. They were less likely to be financially dependent on their own parents and morelikely to be receiving government benefits. If the program was more or less effective forstudents with certain characteristics, then this could result in differential impacts by college. It isalso possible that the program’s impacts could be different at the two colleges because theprogram was not implemented in exactly the same way at each college. While the program was,by and large, implemented in a similar fashion across the two colleges, where differencesexisted, evidence indicates that Lorain’s program was stronger than Owens’s program. Suchimplementation differences are described in detail in Chapter 3 of this report.Analyses indicate that the program’s impacts at Lorain and the program’s impacts atOwens were generally not significantly different from one another during the two programsemesters. (See Appendix Table E.1.) Substantively, the results at the two colleges were alsovery similar: at neither college did the program generate statistically significant impacts onacademic outcomes during the first program semester, but it did generate such impacts duringthe second program semester.During the four postprogram semesters, the differences in impacts at Lorain and Owenswere infrequently statistically significant. (See Appendix Table E.2.) Substantively, the resultswere fairly similar at the two colleges, with few consistent impacts during the postprogramsemesters. One exception is that during the second and third postprogram semesters, theprogram group members at Lorain registered at a significantly higher rate than the control groupmembers at the college, whereas there were no such impacts at Owens. However, the positiveimpacts of Lorain’s program on registration during the second and third postprogram semestersdid not translate into significant impacts on the average number of credits earned.In general, the program’s impacts at the two colleges were statistically indistinguishablefrom each other. Substantively, the impacts were also very similar, though there is some limitedevidence that the program was more effective at boosting registration rates at Lorain.52
Transcript Outcomes by GenderAssessed here is whether the program’s impact was different for women than formen. Policymakers may be interested to learn whether this program was more or less effectivefor females or males. Where differences exist between the two groups, evidence suggests thatthe program was more effective for women than it was for men. (See Appendix Tables E.4through E.6.)Effects on Enrollment, Including Other Institutions:Clearinghouse DataThe previous section examined academic outcomes using transcript data from the twoOhio Opening Doors institutions only. However, it is conceivable that the Opening Doorsprogram could have influenced students to enroll at other institutions (either by transferring toanother institution or via dual enrollment at either Lorain or Owens and another institution) at ahigher rate than they would have in the absence of the Opening Doors program. If this were thecase, then the program’s impacts on retention could be larger than those presented in theprevious section. Alternatively, it is possible that the Opening Doors program could haveinfluenced students who otherwise would have transferred to other institutions to remain at theirOpening Doors institution. If this were the case, then the program’s impacts on retention may besmaller than those presented in the previous section. As a result, it is important to consider datafrom institutions beyond the Opening Doors colleges in order to fully understand the program’simpact on student retention.Table 4.4 presents results for a broader measure of educational attainment: persistenceat any college as measured by enrollment at Lorain, Owens, or other postsecondary institutions.The registration and degree or certificate completion rates presented in Table 4.4 combine datafrom Lorain’s and Owens’s transcripts and the National Student Clearinghouse. While theClearinghouse data offer broad coverage of postsecondary institutions, their measures ofstudents’ educational attainment are limited. Specifically, these data indicate only enrollment(by type of institution) and degree attainment.In Table 4.4, the first row in each panel presents the percentage of students who registeredat any college, 5 and the second row presents the percentage of students who enrolled at theOpening Doors institution. 6 The most notable finding from this table is that the inclusion of5 The percentage enrolled at any college uses the transcript data to determine whether a student wasenrolled at his or her Opening Doors institution and uses the Clearinghouse data to determine whether thestudent was enrolled at any other institution.6 The percentage of students who enrolled at the Opening Doors institution comes from the Lorain andOwens transcript data only.53
Program Control Difference StandardOutcome (%) Group Group (Impact) ErrorFirst program semesterRegistered at any institution a 90.5 89.5 1.0 1.3At student’s Opening Doors college 89.9 88.6 1.3 1.3At any 2-year institution b 0.6 0.5 0.1 0.3At any 4-year institution 0.7 0.7 0.1 0.4Second program semesterRegistered at any institution a 67.8 60.8 7.0 *** 2.0At students’ Opening Doors college 65.3 58.3 7.0 *** 2.1At any 2-year institution b 1.6 1.0 0.6 0.5At any 4-year institution 1.3 1.8 -0.5 0.5First postprogram semesterRegistered at any institution a 48.3 44.3 4.0 * 2.2At student’s Opening Doors college 43.7 40.0 3.7 * 2.1At any 2-year institution b 2.1 1.5 0.6 0.6At any 4-year institution 2.5 3.1 -0.6 0.7Second postprogram semesterRegistered at any institution a 39.4 37.4 2.0 2.1At student’s Opening Doors college 34.5 32.3 2.2 2.0At any 2-year institution b 2.1 2.1 0.0 0.6At any 4-year institution 3.1 3.5 -0.4 0.8Third postprogram semesterThe Opening Doors DemonstrationTable 4.4Enrollment at Opening Doors Institutions and Other Institutions,First Program Semester Through Fourth Postprogram SemesterLorain County Community College and Owens Community College ReportRegistered at any institution a 34.7 31.8 2.9 2.0At student’s Opening Doors college 28.9 25.9 3.0 1.9At any 2-year institution b 2.8 1.9 0.9 0.7At any 4-year institution 3.2 4.7 -1.5 * 0.8(continued)54
Program Control Difference StandardOutcome (%) Group Group (Impact) ErrorFourth postprogram semesterRegistered at any institution a 30.5 29.0 1.5 2.0At student’s Opening Doors college 24.4 23.2 1.3 1.8At any 2-year institution b 2.3 2.1 0.3 0.6At any 4-year institution 4.0 4.2 -0.2 0.9Cumulative outcomes cTable 4.4 (continued)Registered at any institution a 95.2 93.7 1.4 1.0At student’s Opening Doors college 93.9 93.0 1.0 1.1At any 2-year institution b 6.5 5.3 1.2 1.0At any 4-year institution 7.2 8.7 -1.6 1.2Earned a degree or certificate from any institution d 1.8 2.8 -1.0 0.6From student’s Opening Doors college 1.6 2.5 -1.0 0.6From any 2-year institution b 0.0 0.2 -0.2 0.1From any 4-year institution 0.2 0.2 0.0 0.2Sample size (total = 2,139) 1,073 1,066SOURCES: MDRC calculations using data from the StudentTracker service of the National StudentClearinghouse and transcript data from Lorain County Community College and Owens Community College.NOTES: The Clearinghouse collects data from about 3,300 colleges that enroll 92 percent of U.S. collegestudents. Students have the right to opt out of having their information sent. Records were found in theClearinghouse file for 95 percent of the students randomly assigned at Lorain County Community Collegeand Owens Community College.A two-tailed t-test was applied to differences between the groups. Statistical significance levels areindicated as: *** = 1 percent; ** = 5 percent; * = 10 percent.Missing values are not included in individual variable distributions.Distributions may not add to 100 percent because of rounding.aDistributions may not add to the percent registered at any institution because of co-enrollment.bThis category excludes Lorain County Community College and Owens Community College.cSummer and winter semesters are not shown as relative semesters, but they are included in cumulativemeasures.dOutcomes include data from the first program semester through the third postprogram semester.enrollments at other institutions does not change the program’s impacts during any semester.That is, the program’s impacts on registration at any school mimic the program’s impacts onregistration at the Opening Doors institutions alone: there are clear positive impacts during thesecond program semester and small impacts during the first postprogram semester, but theimpacts do not persist during later semesters. These results suggest that students transferring toother institutions did not change the general findings regarding the program’s impacts onstudent persistence.55
As shown in the cumulative outcomes section of Table 4.4, in terms of degree or certificateattainment, the program offered no statistically detectable educational advantage. However,fewer than 3 percent of all students obtained a degree or certificate from any institution duringthe follow-up period, suggesting that it may be premature to expect impacts on this outcome.Comparing the program’s impacts on enrollment using the National Student Clearinghousedata for the Lorain and Owens samples yields similar results to those found using thetranscript data alone. (See Appendix Table E.7.)These analyses demonstrate that considering student transfers and/or dual enrollment atother institutions does not change the overall impacts of the Ohio Opening Doors program onstudent retention as measured by registration.Effects on Financial AidFinancial aid services are one component of community colleges’ student services. Aspart of the Opening Doors enhanced student services package, program group students weregiven access to a designated contact in the financial aid office. Control group students also hadaccess to the financial aid office, but they did not have a designated contact. As described inChapter 3, program group students indicated that they attended financial aid advising at asignificantly higher rate than their control group counterparts, which may provide some evidencethat this enhanced student service was utilized. Program group students may also havereceived additional financial aid advising from their Opening Doors counselor. In addition,program group students were eligible to receive a modest stipend (and typically did) that controlgroup students were not eligible to receive. One possible consequence of these programcomponents is an increase in the likelihood that students would receive financial assistance.Analyses of program impacts on financial aid are presented in Table 4.5. Financial aid datawere obtained from Lorain and Owens.The first panel of Table 4.5 assesses the program’s impact on the receipt of financial assistanceduring the first program semester. No differences were detected between programgroup and control group students’ rates of financial assistance receipt. Observing nonsignificantdifferences in receipt of financial assistance during the first program semester is not surprising,given that most applications for financial aid were completed prior to random assignment (thatis, before program group students received any enhanced services).During the second program semester and first postprogram semester, students in theprogram group were more likely to receive financial assistance (in general) and the federal PellGrant (in particular) than students in the control group. These financial assistance impacts56
Program Control Difference StandardOutcome Group Group (Impact) ErrorFirst program semesterRegistered for any class (%) 89.9 88.6 1.3 1.3Awarded financial assistance a (%) 88.1 87.2 0.8 1.4Federal Pell Grant 83.8 81.1 2.6 1.6Any other grants b 67.9 66.6 1.3 2.0Subsidized loans 33.6 35.1 -1.5 2.0Unsubsidized loans 20.2 22.6 -2.4 1.7Federal Work-Study c 3.6 2.4 1.1 1.1Average financial assistance received per recipient ($) 2,712 2,715Second program semesterRegistered for any class (%) 65.3 58.3 7.0 *** 2.1Awarded financial assistance a (%) 64.9 59.8 5.1 ** 2.0Federal Pell Grant 59.9 52.5 7.4 *** 2.1Any other grants b 55.0 49.5 5.6 *** 2.1Subsidized loans 24.6 25.1 -0.5 1.8Unsubsidized loans 15.6 18.2 -2.6 * 1.6Federal Work-Study c 4.0 2.2 1.8 1.2Average financial assistance received per recipient ($) 2,681 2,689First postprogram semesterThe Opening Doors DemonstrationTable 4.5Impacts on Sample Members’ Financial Aid Exclusive of Opening Doors,First Program Semester Through Third Postprogram SemesterLorain County Community College and Owens Community College ReportRegistered for any class (%) 43.7 40.0 3.7 * 2.1Awarded financial assistance a (%) 43.4 38.6 4.7 ** 2.1Federal Pell Grant 39.1 34.5 4.6 ** 2.1Any other grants b 34.9 31.7 3.2 2.0Subsidized loans 18.5 18.0 0.4 1.7Unsubsidized loans 12.8 12.9 -0.1 1.4Federal Work-Study c 2.0 1.3 0.6 0.9Average financial assistance received per recipient ($) 2,763 2,851(continued)57
Program Control Difference StandardOutcome Group Group (Impact) ErrorSecond postprogram semesterRegistered for any class (%) 34.5 32.3 2.2 2.0Awarded financial assistance a (%) 33.7 31.8 1.9 2.0Federal Pell Grant 30.0 27.4 2.7 1.9Any other grants b 27.3 25.9 1.4 1.9Subsidized loans 16.1 14.7 1.4 1.6Unsubsidized loans 11.8 11.4 0.5 1.4Federal Work-Study c 1.3 0.9 0.4 0.7Average financial assistance received per recipient ($) 2,849 2,754Third postprogram semesterRegistered for any class (%) 28.9 25.9 3.0 1.9Awarded financial assistance a (%) 28.2 24.5 3.8 ** 1.9Federal Pell Grant 25.4 22.6 2.8 1.8Any other grants b 19.8 18.6 1.1 1.7Subsidized loans 15.3 13.4 1.9 1.5Unsubsidized loans 11.4 10.1 1.2 1.3Federal Work-Study c 1.1 0.7 0.4 0.6Average financial assistance received per recipient ($) 3,120 3,166Summary outcomesTable 4.5 (continued)Registered for any class (%) 93.6 92.4 1.2 1.1Awarded financial assistance a (%) 91.4 90.5 0.9 1.2Federal Pell Grant 88.0 85.7 2.2 1.5Any other grants b 78.2 77.0 1.2 1.8Subsidized loans 46.2 46.1 0.1 2.1Unsubsidized loans 32.0 33.0 -1.1 2.0Federal Work-Study c 6.2 4.7 1.5 1.5Average financial assistance received per recipient ($) 7,826 7,446Sample size (total = 2,139) 1,073 1,066SOURCES: MDRC calculations from Lorain County Community College and Owens Community Collegefinancial aid and transcript data.NOTES: Distributions may not add to 100 percent because of rounding.A two-tailed t-test was applied to differences between the research groups. Statistical significance levels areindicated as: *** = 1 percent; ** = 5 percent; * = 10 percent.Italics indicate nonexperimental data. Significance tests are not calculated for nonexperimental data; thus, thecells for “Difference” and “Standard Error” are empty.Estimates are adjusted by research group and cohort.aDistributions may not add to 100 percent because categories are not mutually exclusive.bThis includes all grants and scholarships excluding the Pell Grant.cOnly Lorain County Community College reported Federal Work-Study.58
correspond with the program’s impact on registration. It cannot be determined with certaintywhether students chose to register because they would be able to receive financial assistance, orwhether students obtained financial assistance once they decided to register for another semester.While the program’s generally positive impact on the receipt of financial assistancemay be a result of its impact on registration, there is evidence that advising on financial mattersmade a difference above and beyond the program’s impact on registration. Despite the fact thata higher percentage of program group students registered during the second program semester,they were actually less likely to be awarded unsubsidized loans. This can be viewed as apositive impact since, compared with other forms of financial assistance (grants and subsidizedloans), unsubsidized loans are generally considered the least desirable form of financial assistance.So, there is some evidence that the program’s enhanced advising on financial mattersmade a small impact.The program’s impacts on financial aid at Lorain and at Owens were generally similar.(See Appendix Table E.8.)Effects on Social, Psychological, and Health OutcomesThe Opening Doors program discussed in this report was mainly intended to have a positiveimpact on students’ chances of academic success. Positive program impacts on measures ofacademic success such as retention, earned credits, or college completion have the potential toinfluence broader life outcomes, such as improved social, psychological, and health outcomes. 7While impacts on these measures of well-being are more likely to occur over the longer term,data from the study’s 12-month survey may indicate whether the program demonstrates any earlyimpacts on students’ well-being. Before considering the program’s impacts on these measures ofwell-being, a descriptive profile of study participants’ social, psychological, and health statuses atbaseline (that is, at the point of random assignment) is provided.Among study participants, more than half had a Body Mass Index (BMI) that placesthem in the overweight category according to standard weight-status categories. (See AppendixTable E.9.) In addition, over one-third of sample members considered themselves to be “currentsmokers” at baseline. Although being overweight and smoking are generally associated withpoor health status, less than 1 in 13 sample members viewed themselves as being in fair or poorhealth. Nevertheless, at baseline this group appears to have had health challenges.7 For a detailed explanation of how positive impacts on education outcomes can influence broader life outcomes,see Scrivener et al. (2008), 73-76.59
The results presented in Appendix Tables E.9 and E.10 of this report detail programimpacts on social, psychological, and health outcomes. The tables indicate that there is noevidence that the program had an impact on these outcomes at the 12-month follow-up point.These findings are unsurprising given that the program was not intended to have a direct impacton students’ well-being, and the hypothesized indirect program impacts on students’ well-beingare more likely to occur in the long term, not 12 months after the program began.60
Chapter 5Summary and ConclusionsLorain County Community College and Owens Community College both implementedan Opening Doors program that provided enhanced student services and a modest stipend tohelp improve the likelihood that students would succeed academically. The implementation ofthe program at each of the two colleges was fairly robust — student services were offered (asdesigned) and strong qualitative and quantitative evidence demonstrated that program groupstudents utilized student services at a greater rate than their control group counterparts. Thereare many practical restrictions on community college life, including limited staff time, budgetconstraints, busy student schedules, and a host of other priorities and challenges faced bycollege staff and students alike. Given this reality, the overall implementation of the program atLorain and Owens was strong and what could reasonably be expected from a communitycollege looking to enhance its student services.Generally, the two colleges offered similar Opening Doors programs. Where differencesin the implementation of the program existed, Lorain ran a slightly stronger program thanOwens. Compared with the services at Owens, Lorain’s Opening Doors counselors had smallercaseloads, their program group students met more frequently with counselors, and the programwas more stable (because of less staff turnover than at Owens). The slightly stronger implementationof the program at Lorain corresponded with some limited evidence that the program therewas more effective at boosting longer-term registration rates. That said, analyses generally didnot detect statistically significant differences in the program’s impacts across the two colleges.Since implementation and impacts were generally very similar across the two colleges,the pooled analyses present a useful summary of the program’s effectiveness at these two sites.As a result, the overall story was fairly straightforward: this was a well-implemented programwith clear, positive impacts on student academic performance during the second programsemester and a small impact on registration during the first postprogram semester; however, theprogram did not produce lasting meaningful positive impacts on educational outcomes insubsequent semesters.Figures 5.1 and 5.2 summarize the program’s impacts on the primary outcomes of interest:registration and cumulative credits earned, respectively. The plot of registration ratesshown in Figure 5.1 reflects a common trend in community colleges: there is an initial steepdecline in registration rates during the first few semesters, followed by a gradual decline duringlater semesters. By comparing program group students with control group students, the figureshows that the Opening Doors program in Ohio had a significant positive impact on registration61
The Opening Doors DemonstrationFigure 5.1Percentage of Sample Members Who Registered for Any Courses,First Program Semester Through Fourth Postprogram SemesterLorain County Community College and Owens Community College Report1009089.988.6Percentage80706050403020***65.358.3*43.740.034.532.328.925.924.423.2100First programsemesterSecond programsemesterFirstpostprogramsemesterSecondpostprogramsemesterThirdpostprogramsemesterFourthpostprogramsemesterProgram groupControl groupSOURCES: Lorain County Community College and Owens Community College transcript data.NOTES: Rounding may cause slight discrepancies in sums and differences.A two-tailed t-test was applied to differences between research groups. Statistical significance levels areindicated as: *** = 1 percent; ** = 5 percent; * = 10 percent.Estimates are adjusted by cohort and college.during the second program semester and the first postprogram semester; however, this impactwas not sustained through the remaining postprogram semesters.The plot of the average cumulative credits earned that is shown in Figure 5.2 shows afairly steep increase during the initial semesters followed by a more gradual increase duringlater semesters. By comparing program group students with control group students, the figureshows that the program had a significant positive impact on cumulative credits earned by the62
The Opening Doors DemonstrationFigure 5.2Cumulative Credits Earned,First Program Semester Through Third Postprogram SemesterLorain County Community College and Owens Community College ReportNumber of credits earned201816141210864205.35.1First programsemester9.7*9.1Second programsemester12.912.2First postprogramsemester15.214.5Secondpostprogramsemester17.416.6Third postprogramsemesterProgram groupControl groupSOURCES: Lorain County Community College and Owens Community College transcript data.NOTES: Rounding may cause slight discrepancies in sums and differences.A two-tailed t-test was applied to differences between research groups. Statistical significance levels areindicated as: *** = 1 percent; ** = 5 percent; * = 10 percent.Estimates are adjusted by cohort and college.Data include summer semesters.second program semester; however, the impact on cumulative credits earned was not statisticallysignificant after that semester. 11 While the magnitude of this impact increased slightly from the second program semester onward (from0.6 to 0.8), its statistical significance was detectable only during the second program semester. The reason forthis is that the standard error of the estimated impact (along with the variance in cumulative credits earned)increased monotonically from temporal semester to semester; consequently, the magnitude of the minimaldetectable impact also increased from semester to semester.63
Interpreting the Program’s ImpactsThere are several important factors to consider when interpreting the program’s impactsfrom this study.First, this study looks at one enhanced student services program implemented at twocommunity colleges. The randomized experimental design of this study leads MDRC to believethat the impact estimates have high internal validity. 2 That is, it can be said with confidence that,at these specific locations, the program services had a positive effect on registration and creditsearned during the second program semester and a small positive effect on registration during thefirst postprogram semester — impacts that did not persist through later semesters. However,since the study was conducted at two colleges only, claims regarding how well this type ofprogram might work at other colleges can be made only with low confidence and a fairly highdegree of speculation — that is, the external validity, or generalizability, of this study is low.As the number of rigorous studies on the effectiveness of enhanced student services atcommunity colleges increases, so will the confidence with which findings can be generalizedfrom this line of research. Currently, very few studies on community college student servicesuse an experimental design, the gold standard for making causal claims about program effectiveness.Combining this fact with the fact that internal validity is a necessary (though notsufficient) precursor to external validity, the research presented here provides important evidenceon the general effectiveness of enhanced student services, even though this evidence hasa high degree of uncertainty. With this in mind, offered below are some interpretations, implications,and suggested ideas for future research, based on this study.The main finding from this study is that the Opening Doors program that operated atLorain County Community College and Owens Community College had positive impactsduring the second program semester (and, to a lesser extent, during the first postprogramsemester); however, these impacts were, for the most part, not maintained in later postprogramsemesters. This result can be interpreted in at least two ways, both of which MDRC believes tobe reasonable. One interpretation is that the Opening Doors program in Ohio did not work well.The initial positive effects of the program disappeared over time, and by the second postprogramsemester, the academic success of the program group students and control group studentswas virtually indistinguishable. Furthermore, the program did not produce meaningful impactson the cumulative academic outcomes measured over the three-year study period. This findingmay suggest that while there is a perceived need for enhanced student services, the durationand/or set of services offered in the program at Lorain and Owens are not a useful policy leverfor improving students’ academic success at community colleges.2 Campbell and Stanley (1963).64
An alternative interpretation of the study’s results is that, given that the programboosted registration during the second semester in which the program services were provided,and, to some extent, during the semester after the program ended, it was successful. While thepositive impacts were not sustained, the two-semester program could be considered successfulas a first step toward longer-term academic success. The question then becomes: What, ifanything, can be done in order to sustain or even increase the temporary positive programimpacts? Here, speculation is the only option — speculation that presents interesting areas forfuture research on enhanced student services.One explanation for the program’s short-term success and lack of long-term success isthat the one-year duration of the program was simply too short. Many who advocate forenhanced student services view them as an ongoing need, not a temporary, one- or two-semesterneed. It is plausible that in order for enhanced student services to lead to sustained impacts,program efforts must be sustained. Since the registration drop-off rate is so dramatic during thefirst year (as depicted in Figure 5.1), it was reasonable to wonder whether a strong one-yearprogram might “nip in the bud” the persistence problem; however, such was not the case in thisstudy. Given this finding, it seems reasonable to wonder whether a similar intervention that isimplemented for a longer duration would lead to the desired long-term impacts.While increasing the program’s duration is one possible way to boost the program’slong-term impacts, it may also be worth exploring more comprehensive approaches to enhancedstudent services. The program studied in Ohio was robust and implemented with goodfidelity to the design; however, in order to see larger and more enduring impacts, morecomprehensive student services strategies may be required. Although some additional serviceswere provided, the studied program focused mainly on enhanced academic counseling, whichis one of several key student services. While academic counseling may attempt to addresssome of the barriers to students’ persistence, it alone may not be enough. A more comprehensiveapproach to enhanced student services could also include enhanced academic supports,like tutoring, remedial assistance, and time management and study skills training. A morecomprehensive approach might also offer enhanced supplemental services, like on-campuschild care and transportation assistance.Still, it is important to consider that it is unlikely that enhanced student services alonecan address all of the barriers to student academic success. Student services are unlikely to havea large impact on several areas that may be critical to students’ academic success, such asfinancial assistance or the activities that go on within the college classroom. It is possible that inorder for enhanced student services to have a substantial effect on community college students,they need to be offered in conjunction with other reforms that significantly reduce the financialburden of attending community college (that is, more considerable reforms than the modest65
stipend offered as part of the Opening Doors program) or reforms that improve the pedagogicalpractices of instructors.Finally, when considering the effectiveness of the program studied at Lorain andOwens, it is important to be mindful of the cost of the program. If funding is available, MDRCplans to conduct research measuring the cost of this intervention. In addition, MDRC hopes toassess the costs of the other Opening Doors programs (performance-based scholarships;learning communities, which group students in linked courses with mutually reinforcing themesand assignments in order to strengthen their college learning experience; and a college orientationcourse for students on academic probation). While this potential study is still in its earliestdesign phase, it is worth noting that the enhanced student services intervention studied hererepresents the “lightest touch” of the interventions tested as part of Opening Doors. (See Table1.1 for a description of all the Opening Doors programs.) The other programs offered moreprogram components, more intensive services, or both. Considered in this context, the modestshort-term impacts of the Opening Doors program in Ohio suggest that the enhanced studentservices and a modest stipend could be an important component of a larger package to meaningfullyimprove student success at community colleges.66
Appendix ASupplementary Baseline Information
Appendix A includes three descriptive tables — one for the pooled sample and one foreach of Lorain County Community College and Owens Community College separately. Tableswere created separately for all three groups since impact analyses were conducted for the pooledsample as well as for Lorain and Owens separately. Each table shows selected characteristics ofsample members at baseline for the full sample, as well as for the program and control groupsseparately. The full sample data provide a descriptive profile of the types of students who participatedin the study. Separating these data into program and control groups is one way to assessthe success of random assignment at creating statistically equivalent research groups atbaseline. Since students were randomly assigned to the program and control groups, their characteristicsshould generally be similar at baseline. For example, the percentage of males in theprogram group should be about the same as the percentage of males in the control group.Comparing Baseline Characteristics Across Research GroupsPooled SampleAppendix Table A.1 compares the baseline characteristics of program and controlgroup students from the pooled sample (Lorain and Owens combined). For the most part, thereis no evidence of statistically significant differences between program and control group memberson their baseline characteristics (as indicated by the absence of asterisks in the right-handcolumn), though, in a few instances, program and control group students differed significantlyon their baseline characteristics. For example, 19.0 percent of the program group lived in ahousehold in public or Section 8 housing compared with 14.1 percent of the control group. Thethree asterisks in the right-hand column indicate that this difference is statistically significant,suggesting that program group members and control group members differed with respect totheir probability of being in a household in public or Section 8 housing. Since such a largenumber of significance tests were calculated, occasional statistically significant differences betweenprogram and control group members are to be expected. Some other statistically significantdifferences are reflected in receipt of government benefits, likelihood of being ever employed,and having a language other than English spoken regularly at home, with programgroup members reporting these characteristics more often than control group members.When examining Table A.1 for differences between the program and control groups, it isimportant to note that the table shows separate statistical tests for each gender, each age group,each racial/ethnic group, and each category of several other variables that are mutually exclusive— that is, students can report being only one gender or the other, only one racial/ethnic group oranother, and so forth. Such tests are not independent since the categories, like percent male andpercent female, are not independent. This should be taken into account when noting the numberof observable characteristics that have statistically significant differences. Using “Region in69
Full Program ControlCharacteristic Sample Group GroupGender (%)Male 24.3 24.0 24.6Female 75.7 76.0 75.4Age in years (%)18-20 28.1 28.4 27.821-25 35.0 33.5 36.526-30 23.8 24.1 23.531-34 13.1 14.0 12.2Average age (years) 24.3 24.4 24.2Marital status (%)Married 19.9 19.0 20.9Unmarried 80.1 81.0 79.1Race/ethnicity (%)The Opening Doors DemonstrationAppendix Table A.1Selected Characteristics of Sample Members at BaselineLorain County Community College and Owens Community College ReportHispanic/Latino a 10.9 11.2 10.5Black, non-Hispanic 29.9 30.8 29.0White, non-Hispanic 54.1 52.4 55.9Asian or Pacific Islander 0.6 1.0 0.2 **Other b 4.5 4.6 4.4Has one child or more (%) 64.3 64.6 64.0Among sample members with children,average age of youngest child (years) 3.2 3.4 3.1Average household size, excluding roommates or boarders 3.4 3.4 3.4Household receiving any of the following benefits c (%)Unemployment/Dislocated Worker benefits 4.8 5.0 4.5Supplemental Security Income (SSI) or disability 10.0 10.9 9.1Cash assistance or welfare (TANF) 14.1 14.6 13.6Food stamps 36.0 37.8 34.3 *None of the above 54.1 52.4 55.8Household in public or Section 8 housing (%) 16.5 19.0 14.1 ***Household receiving any government benefits (%) 48.3 50.6 46.0 **(continued)70
Appendix Table A.1 (continued)Full Program ControlCharacteristic Sample Group GroupFinancially dependent on parents (%) 17.6 17.9 17.2Ever employed (%) 98.3 98.9 97.7 **Currently employed (%) 55.9 55.7 56.2Highest grade completed (%)8th or lower 1.4 1.4 1.49th 3.8 3.9 3.710th 5.8 5.6 6.011th 8.5 8.0 8.912th 80.5 81.1 79.9Diplomas/degrees earned d (%)High school diploma 75.7 75.4 76.0General Educational Development (GED) certificate 22.9 22.5 23.2Occupational/technical certificate 10.8 11.5 10.1Date of high school graduation/GED certificate receipt (%)During the past year 21.5 21.6 21.3Between 1 and 5 years ago 31.3 30.4 32.3More than 5 years ago 47.2 48.0 46.4Main reason for enrolling in college d (%)To complete a certificate program 9.8 10.6 8.9To obtain an associate’s degree 49.0 47.4 50.7To transfer to a 4-year college/university 24.4 24.7 24.1To obtain/update job skills 12.5 12.6 12.4Other 7.2 7.3 7.1Completed any college courses/credits (%) 43.6 45.1 42.1Among those who completed any college courses/credits,average number of courses completed 3.7 3.8 3.5First person in family to attend college (%) 35.9 35.8 36.0Working personal computer in home (%) 64.2 65.1 63.4Owns or has access to a working car (%) 88.3 89.1 87.5Language other than English spoken regularly in home (%) 8.1 9.9 6.3 ***U.S. citizen (%) 98.8 98.6 99.1Region in which respondent was born (%)North America 96.9 96.0 97.9 **Asia 0.4 0.6 0.3Latin America and the Caribbean 1.0 1.0 1.1Other e 1.6 2.5 0.8 ***(continued)71
Appendix Table A.1 (continued)Full Program ControlCharacteristic Sample Group GroupRegion in which respondent’s mother was born f (%)North America 94.0 92.6 95.4 ***Asia 0.7 0.9 0.5Latin America and the Caribbean 2.8 3.2 2.4Other e 2.6 3.4 1.8 **Sample size 2,139 1,073 1,066SOURCE: MDRC calculations using Baseline Information Form (BIF) data.NOTES: Rounding may cause slight discrepancies in sums and differences.A two-tailed t-test was applied to differences between research groups. Statistical significance levels areindicated as: *** = 1 percent; ** = 5 percent; * = 10 percent.Estimates are adjusted by cohort and college.TANF = Temporary Assistance for Needy Families.To analyze whether baseline characteristics jointly predicted research group status, a likelihood ratio test wasperformed, which yielded a p-value of 0.12. Convention suggests that this probability is large enough that thesepotential differences can be ignored in the analyses.Italics indicate nonexperimental data. Significance tests are not calculated for nonexperimental data.aRespondents who indicated that they are Hispanic and who chose a race are included only in theHispanic/Latino category.b“Other race” includes American Indians/Alaskan Natives and those who marked “other race/ethnicity” ormore than one racial category.cBenefits include Unemployment/Dislocated Worker benefits, Supplemental Security Income (SSI) ordisability, cash assistance or welfare, food stamps, and Section 8 or public housing.dDistributions may not add to 100 percent because categories are not mutually exclusive.eThis category includes the Baltics, the Commonwealth of Independent States, eastern and western Europe,North Africa, Sub-Saharan Africa, the Near East, and Oceania. The Commonwealth of Independent Statesincludes Armenia, Azerbaijan, Belarus, Georgia, Kazakhstan, Kyrgyzstan, Republic of Moldova, Russia,Tajikistan, Turkmenistan (until August 2005), Ukraine, and Uzbekistan. Countries are grouped by regionaccording to the U.S. Bureau of the Census, International Data Base.fThe majority of respondents reported that both parents were born in the same region as each other.which respondent was born” as an example, program group members and control group membersdiffered with respect to the percentage who were from North America and the percentagewho were from other regions. However, this difference represents only one real difference, a differencewith respect to the location of respondent’s birthplace. Similarly, the absence of differencesbetween program group members and control group members with respect to the percentagewho are males and the percentage who are females should only be thought of as oneindication of the success of random assignment at creating equivalent groups.In addition to the individual tests described above, an omnibus test was conducted to assesswhether overall systematic differences in baseline characteristics were observed betweenthe two research groups. In order to assess this possibility, a logistic regression model was used72
to analyze whether students’ baseline characteristics could jointly predict whether they were inthe program group or the control group. The model’s likelihood ratio test yielded a p-value of0.12. 1 Convention suggests that this probability is large enough that these potential differencescan be ignored in the analyses.Lorain County Community CollegeAppendix Table A.2 compares the baseline characteristics of program and controlgroup students from Lorain County Community College only. The table shows that there arefew statistically significant differences between the research groups on their observable characteristics.To assess whether sample members’ baseline characteristics jointly predicted their researchgroup status, a likelihood ratio test was performed, yielding a p-value of 0.15. Conventionsuggests that this probability is large enough that these potential differences can be ignoredin the analyses.Owens Community CollegeAppendix Table A.3 compares the baseline characteristics of program and controlgroup students from Owens Community College only. The table shows that there are severalstatistically significant differences between the research groups on their observable characteristics.To assess whether sample members’ baseline characteristics jointly predicted their researchgroup status, a likelihood ratio test was performed, yielding a p-value of 0.02. This analysissuggests that the program and control groups systematically differ on their baseline characteristicsat Owens. As a result, when conducting impact analyses for Owens alone, several key variableson which program and control group members differed at baseline were controlled for.All such analyses yielded substantively similar results to analyses conducted without controls,so results presented do not control for any baseline characteristics.1 The p-value is the probability of observing differences at least as extreme as those actually observed, assumingthat there are no true differences in the program and control groups’ population characteristics.73
Full Program ControlCharacteristic Sample Group GroupGender (%)Male 18.9 18.2 19.7Female 81.1 81.8 80.3Age in years (%)18-20 14.4 14.9 13.921-25 38.6 34.7 42.6 **26-30 29.8 31.8 27.831-34 17.2 18.7 15.7Average age (years) 25.7 25.9 25.5Marital status (%)Married 27.3 27.4 27.3Unmarried 72.7 72.6 72.7Race/ethnicity (%)The Opening Doors DemonstrationAppendix Table A.2Selected Characteristics of Sample Members at Baseline:Lorain County Community CollegeLorain County Community College and Owens Community College ReportHispanic/Latino a 14.4 14.4 14.3Black, non-Hispanic 21.1 19.2 23.1White, non-Hispanic 58.8 59.9 57.6Asian or Pacific Islander 0.2 0.5 0.0Other b 5.5 6.1 5.0Has one child or more (%) 82.2 83.3 81.0Among sample members with children,average age of youngest child (years) 3.4 3.6 3.2Average household size, excluding roommates or boarders 3.5 3.4 3.5Household receiving any of the following benefits c (%)Unemployment/Dislocated Worker benefits 5.4 6.4 4.3Supplemental Security Income (SSI) or disability 9.4 9.5 9.2Cash assistance or welfare (TANF) 15.8 15.5 16.0Food stamps 42.2 43.9 40.6None of the above 48.0 45.9 50.2Household in public or Section 8 housing (%) 20.4 22.7 18.1 *Household receiving any government benefits (%) 54.9 57.6 52.2(continued)74
Appendix Table A.2 (continued)Full Program ControlCharacteristic Sample Group GroupFinancially dependent on parents (%) 9.6 10.0 9.2Ever employed (%) 99.6 99.6 99.5Highest grade completed (%)8th or lower 1.6 2.2 0.99th 4.5 4.7 4.310th 6.9 6.4 7.411th 11.0 9.3 12.712th 76.0 77.3 74.7Diplomas/degrees earned d (%)High school diploma 70.7 70.1 71.4General Educational Development (GED) certificate 27.7 27.5 28.0Occupational/technical certificate 15.8 16.6 15.0Date of high school graduation/GED certificate receipt (%)During the past year 12.9 13.1 12.7Between 1 and 5 years ago 29.3 27.4 31.3More than 5 years ago 57.8 59.5 56.0Main reason for enrolling in college d (%)To complete a certificate program 11.0 12.2 9.8To obtain an associate’s degree 55.9 54.1 57.7To transfer to a 4-year college/university 20.0 20.6 19.5To obtain/update job skills 10.0 10.0 10.1Other 5.6 5.3 5.8Completed any college courses/credits (%) 43.5 44.3 42.7Among those who completed any college courses/credits,average number of courses completed 3.2 3.0 3.3First person in family to attend college (%) 37.0 38.8 35.2Working personal computer in home (%) 65.6 67.7 63.4Owns or has access to a working car (%) 90.3 90.3 90.3Language other than English spoken regularly in home (%) 10.9 11.8 9.9U.S. citizen (%) 98.8 98.5 99.1Region in which respondent was born (%)North America 96.8 96.2 97.3Asia 0.1 0.2 0.0Latin America and the Caribbean 2.0 2.0 2.0Other e 1.1 1.6 0.7(continued)75
Appendix Table A.2 (continued)Full Program ControlCharacteristic Sample Group GroupRegion in which respondent’s mother was born f (%)North America 91.8 90.2 93.4 *Asia 0.3 0.2 0.5Latin America and the Caribbean 5.6 6.5 4.8Other e 2.3 3.1 1.4 *Sample size 898 451 447SOURCE: MDRC calculations using Baseline Information Form (BIF) data.NOTES: Rounding may cause slight discrepancies in sums and differences.A two-tailed t-test was applied to differences between research groups. Statistical significance levels areindicated as: *** = 1 percent; ** = 5 percent; * = 10 percent.Estimates are adjusted by cohort.To analyze whether baseline characteristics jointly predicted research group status, a likelihood ratio test wasperformed, which yielded a p-value of 0.15. Convention suggests that this probability is large enough that thesepotential differences can be ignored in the analyses.Italics indicate nonexperimental data. Significance tests are not calculated for nonexperimental data.aRespondents who indicated that they are Hispanic and who chose a race are included only in theHispanic/Latino category.b“Other race” includes American Indians/Alaskan Natives and those who marked “other race/ethnicity” ormore than one racial category.cBenefits include Unemployment/Dislocated Worker benefits, Supplemental Security Income (SSI) ordisability, cash assistance or welfare, food stamps, and Section 8 or public housing.dDistributions may not add to 100 percent because categories are not mutually exclusive.eThis category includes the Baltics, the Commonwealth of Independent States, eastern and western Europe,North Africa, Sub-Saharan Africa, the Near East, and Oceania. The Commonwealth of Independent States includesArmenia, Azerbaijan, Belarus, Georgia, Kazakhstan, Kyrgyzstan, Republic of Moldova, Russia, Tajikistan,Turkmenistan (until August 2005), Ukraine, and Uzbekistan. Countries are grouped by region according to theU.S. Bureau of the Census, International Data Base.fThe majority of respondents reported that both parents were born in the same region as each other.76
Full Program ControlCharacteristic Sample Group GroupGender (%)Male 28.1 28.1 28.1Female 71.9 71.9 71.9Age in years (%)18-20 38.0 38.1 37.821-25 32.4 32.6 32.226-30 19.5 18.7 20.331-34 10.2 10.6 9.7Average age (years) 23.3 23.4 23.3Marital status (%)Married 14.5 12.9 16.2Unmarried 85.5 87.1 83.8Race/ethnicity (%)The Opening Doors DemonstrationAppendix Table A.3Selected Characteristics of Sample Members at Baseline:Owens Community CollegeLorain County Community College and Owens Community College ReportHispanic/Latino a 8.3 8.9 7.8Black, non-Hispanic 36.4 39.3 33.4 **White, non-Hispanic 50.7 46.9 54.6 ***Asian or Pacific Islander 0.9 1.5 0.3 **Other b 3.7 3.5 4.0Has one child or more (%) 51.4 51.0 51.7Among sample members with children,average age of youngest child (years) 3.0 3.1 2.9Average household size, excluding roommates or boarders 3.4 3.4 3.3Household receiving any of the following benefits c (%)Unemployment/Dislocated Worker benefits 4.3 3.9 4.7Supplemental Security Income (SSI) or disability 10.5 11.9 9.0 *Cash assistance or welfare (TANF) 12.8 13.9 11.8Food stamps 31.5 33.3 29.7None of the above 58.5 57.2 59.8Household in public or Section 8 housing (%) 13.5 16.1 11.0 **Household receiving any government benefits (%) 43.5 45.5 41.6(continued)77
Appendix Table A.3 (continued)Full Program ControlCharacteristic Sample Group GroupFinancially dependent on parents (%) 23.4 23.7 23.0Ever employed (%) 97.4 98.4 96.4 **Highest grade completed (%)8th or lower 1.3 0.8 1.89th 3.3 3.4 3.310th 5.0 5.0 5.011th 6.6 7.0 6.212th 83.8 83.8 83.7Diplomas/degrees earned d (%)High school diploma 79.3 79.3 79.3General Educational Development (GED) certificate 19.3 18.9 19.7Occupational/technical certificate 7.1 7.8 6.5Date of high school graduation/GED receipt (%)During the past year 27.8 27.9 27.7Between 1 and 5 years ago 32.8 32.6 33.0More than 5 years ago 39.4 39.5 39.3Main reason for enrolling in college d (%)To complete a certificate program 8.8 9.4 8.3To obtain an associate’s degree 44.0 42.4 45.5To transfer to a 4-year college/university 27.5 27.6 27.4To obtain/update job skills 14.3 14.5 14.1Other 8.4 8.8 8.1Completed any college courses/credits (%) 43.6 45.6 41.7Among those who completed any college courses/credits,average number of courses completed 4.0 4.4 3.7First person in family to attend college (%) 35.1 33.6 36.6Working personal computer in home (%) 63.2 63.1 63.4Owns or has access to a working car (%) 86.9 88.3 85.4Language other than English spoken regularly in home (%) 6.1 8.6 3.6 ***U.S. citizen (%) 98.9 98.7 99.0Region in which respondent was born (%)North America 97.0 95.8 98.3 **Asia 0.7 0.8 0.5Latin America and the Caribbean 0.3 0.2 0.3Other e 2.0 3.2 0.8 ***(continued)78
Appendix Table A.3 (continued)Full Program ControlCharacteristic Sample Group GroupRegion in which respondent’s mother was born f (%)North America 95.7 94.4 96.9 **Asia 0.9 1.4 0.5Latin America and the Caribbean 0.6 0.7 0.5Other e 2.8 3.6 2.0Sample size 1,241 622 619SOURCE: MDRC calculations using Baseline Information Form (BIF) data.NOTES: Rounding may cause slight discrepancies in sums and differences.A two-tailed t-test was applied to differences between research groups. Statistical significance levels areindicated as: *** = 1 percent; ** = 5 percent; * = 10 percent.Estimates are adjusted by cohort.To analyze whether baseline characteristics jointly predicted research group status, a likelihood ratio testwas performed, which yielded a p-value of 0.02. This analysis suggests that the program and control groupssystematically differ on their baseline characteristics at Owens.Italics indicate nonexperimental data. Significance tests are not calculated for nonexperimental data.aRespondents who indicated that they are Hispanic and who chose a race are included only in theHispanic/Latino category.b“Other race” includes American Indians/Alaskan Natives and those who marked “other race/ethnicity”or more than one racial category.cBenefits include Unemployment/Dislocated Worker benefits, Supplemental Security Income (SSI) ordisability, cash assistance or welfare, food stamps, and Section 8 or public housing.dDistributions may not add to 100 percent because categories are not mutually exclusive.eThis category includes the Baltics, the Commonwealth of Independent States, eastern and westernEurope, North Africa, Sub-Saharan Africa, the Near East, and Oceania. The Commonwealth of IndependentStates includes Armenia, Azerbaijan, Belarus, Georgia, Kazakhstan, Kyrgyzstan, Republic of Moldova,Russia, Tajikistan, Turkmenistan (until August 2005), Ukraine, and Uzbekistan. Countries are grouped byregion according to the U.S. Bureau of the Census, International Data Base.fThe majority of respondents reported that both parents were born in the same region as each other.79
Appendix BSurvey Response Analysis
This appendix includes three sections. The first section discusses the final researchsample for the study’s 12-month survey at Lorain County Community College and OwensCommunity College and the survey response rate. The second section compares the baselinecharacteristics of survey respondents with the baseline characteristics of nonrespondents in orderto assess whether the types of people who responded to the survey were similar to the typesof people who did not respond to the survey. These analyses speak to whether the survey resultsare likely to generalize to the full sample. The third section compares the baseline characteristicsof program group survey respondents with the baseline characteristics of controlgroup survey respondents. These analyses assess whether program and control group equivalenceis maintained among survey respondents.Survey Sample and Survey Response RateThe Opening Doors 12-Month Survey contained questions about a wide range of topics,including sample members’ educational experiences, social relationships and supports, futureoutlook and identity, and health. Sample members who asked not to be contacted in the future,or who were ineligible, incarcerated, or incapacitated at the time of the survey fielding, wereexcluded from the final survey sample. Sample members were considered ineligible if theylived 50 miles beyond where the field interviewers were located and did not have a phone.Sample members were classified as incapacitated if they were in the military and deployed outsidethe United States, had moved outside the United States, or were seriously injured in an accidentand unable to be interviewed during the interview period.There were 897 sample members at Lorain County Community College and 1,241sample members at Owens Community College, bringing the pooled sample size to 2,138 students.1 Of these students, 21 sample members (less than 1 percent) were excluded because theywere ineligible, incarcerated, or incapacitated, so that the final total sample size was 2,117 samplemembers. Of the 2,117 surveys fielded, 1,834 sample members (86.6 percent) responded tothe survey. However, 21 sample members (1.1 percent) were dropped from the research samplebecause their interviews were conducted past the interview cut-off date. Many of the questionsasked specifically about the respondent’s life during the previous 12 months, and respondentswho were interviewed more than 18 months after random assignment referred to periods thatdid not correspond to the time period of interest. This left a final research sample of 1,813 samplemembers, or 85.6 percent of the eligible sample members.1 At the beginning of the study, one student at Lorain County Community College requested not to becontacted in the future.83
Background Characteristics of Survey Respondents andNonrespondentsPooled SampleIn order to assess whether survey respondents systematically differ from nonrespondents,Appendix Table B.1 compares the baseline characteristics of survey respondents andnonrespondents for the pooled sample (Lorain and Owens combined). Survey respondents andnonrespondents differed significantly on a number of baseline characteristics. For example, 77.1percent of respondents were females compared with 70.2 percent of nonrespondents. The asterisksin the right-hand column indicate that this difference is statistically significant, suggestingthat respondents and nonrespondents differ with respect to their gender. Some other differencesare reflected in marital status, receipt of any government benefits, first person in thefamily to attend college, and first person in the family to be a U.S. citizen, with respondents significantlymore likely than nonrespondents to have these characteristics. Survey nonrespondentswere more likely to report that a language other than English is regularly spoken in their home.Though the table shows separate statistical tests for values in each of the mutually exclusivecategories, such as age, race, highest grade completed, and student’s birthplace, thesevariables are not independent from each other. Using “Region in which respondent was born”as an example, survey respondents and nonrespondents differed with respect to the percentagewho were from North America and the percentage who were from other regions. However, thisrepresents only one difference: student’s birthplace. Similarly, the differences found betweensurvey respondents and nonrespondents with respect to the region in which the student’s motherwas born should be thought of as one finding.In addition to the individual tests described above, an omnibus test was conducted to assesswhether there were systematic differences in observable characteristics between surveyrespondents and nonrespondents. In order to assess this, a logistic regression model was used toanalyze whether students’ baseline characteristics and their research group status could jointlypredict whether they were respondents or nonrespondents. The resulting likelihood ratio testyielded a p-value of less than 0.01. 2 This analysis suggests that survey respondents and nonrespondentssystematically differ on their baseline characteristics in the pooled sample, indicatingthat survey results may not generalize to study participants as a whole.2 The p-value is the probability of observing differences at least as extreme as those actually observed, assumingthat there are no true differences in the respondents’ and nonrespondents’ population characteristics.84
The Opening Doors DemonstrationAppendix Table B.1Selected Characteristics of 12-Month Survey Respondents and NonrespondentsLorain County Community College and Owens Community College ReportCharacteristic (%)FullSample Respondents NonrespondentsGenderMale 23.9 22.9 29.8 ***Female 76.1 77.1 70.2 ***Age in years18-20 28.0 27.6 30.421-25 35.1 35.2 34.426-30 23.7 23.9 22.931-34 13.1 13.2 12.3Marital statusMarried 20.0 20.9 14.7 **Unmarried 80.0 79.1 85.3 **Race/ethnicity aHispanic/Latino 10.8 10.9 10.3Black, non-Hispanic 30.0 29.8 31.2White, non-Hispanic 54.0 54.4 52.0Asian or Pacific Islander 0.6 0.6 0.6Other b 4.5 4.3 6.0Has one child or more 64.5 65.3 60.2 *Household receiving any government benefits c 48.4 49.6 41.7 **Financially dependent on parents 17.6 17.2 20.1Ever employed 98.4 98.4 98.8Currently employed 56.1 56.0 56.6Highest grade completed8th or lower 1.4 1.3 2.19th 3.8 3.9 3.210th 5.9 6.1 4.611th 8.3 7.9 10.212th 80.6 80.7 79.7Diplomas/degrees earned dHigh school diploma 75.8 75.8 75.6General Educational Development (GED) certificate 22.8 22.7 23.3Occupational/technical certificate 10.9 10.6 12.7(continued)85
Table B.1 (continued)Characteristic (%)FullSample Respondents NonrespondentsDate of high school graduation/GED certificate receiptDuring the past year 21.6 21.6 21.2Between 1 and 5 years ago 31.4 30.5 36.7 **More than 5 years ago 47.1 47.9 42.0 *Main reason for enrolling in college dTo complete a certificate program 9.8 9.7 10.6To obtain an associate’s degree 49.2 49.9 45.2To transfer to a 4-year college/university 24.1 23.0 30.8 ***To obtain/update job skills 12.5 12.6 11.9Other 7.2 7.4 5.9First person in family to attend college 36.0 37.1 29.2 ***Completed any college courses/credits 43.6 43.7 43.0Working personal computer in home 64.6 64.2 66.9Owns or has access to a working car 88.6 88.8 87.2Language other than English spoken regularly in home 8.1 7.4 12.5 ***U.S. citizen 98.8 99.0 97.7 **Region in which student was bornNorth America 96.9 97.4 93.6 ***Asia 0.4 0.4 0.7Latin America and the Caribbean 1.0 0.9 1.8Other e 1.7 1.3 3.9 ***Region in which student’s mother was born fNorth America 94.0 94.5 91.1 **Asia 0.7 0.6 1.0Latin America and the Caribbean 2.7 2.6 3.3Other e 2.6 2.3 4.6 **Sample size 2,117 1,813 304(continued)86
Table B.1 (continued)SOURCE: MDRC calculations using Baseline Information Form (BIF) data.NOTES: A two-tailed t-test was applied to differences between the groups. Statistical significance levels areindicated as: *** = 1 percent; ** = 5 percent; * = 10 percent.Twenty-two of the 2,139 sample members (1 percent) in the Opening Doors sample were excluded from thefinal survey sample because they asked to not be contacted or were ineligible, incarcerated, or incapacitated at thetime of the survey fielding, bringing the survey sample size to 2,117.A separate test was conducted to determine whether baseline characteristics and research group statusjointly predicted whether students responded to the survey. This likelihood ratio test yielded a p-value of less than0.00. This analysis suggests that survey respondents and nonrespondents systematically differ on their baselinecharacteristics in the pooled sample.Estimates are adjusted by college, research cohort, and research group.Missing values are not included in individual variable distributions.Distributions may not add to 100 percent because of rounding.aRespondents who indicated that they are Hispanic and who chose a race are included only in theHispanic/Latino category.b“Other race” includes American Indians/Alaskan Natives and those who marked “other race/ethnicity” ormore than one racial category.cBenefits include Unemployment/Dislocated Worker benefits, Supplemental Security Income (SSI) ordisability, cash assistance or welfare, food stamps, and Section 8 or public housing.dDistributions may not add to 100 percent because categories are not mutually exclusive.eThis category includes the Baltics, the Commonwealth of Independent States, eastern and western Europe,North Africa, Sub-Saharan Africa, the Near East, and Oceania. The Commonwealth of Independent Statesincludes Armenia, Azerbaijan, Belarus, Georgia, Kazakhstan, Kyrgyzstan, Republic of Moldova, Russia,Tajikistan, Turkmenistan (until August 2005), Ukraine, and Uzbekistan. Countries are grouped by regionaccording to the U.S. Bureau of the Census, International Data Base.fThe majority of respondents reported that both parents were born in the same region as each other.Lorain County Community CollegeAppendix Table B.2 compares the baseline characteristics of respondents and nonrespondentsfrom Lorain County Community College only. The table shows that there are severalstatistically significant differences between the two groups on their observable characteristics.An omnibus test was also conducted to assess whether there were systematic differences in observablecharacteristics between survey respondents and nonrespondents specifically at LorainCounty Community College. To analyze whether students’ baseline characteristics and theirresearch group status jointly predicted whether they responded to the survey, a likelihood ratiotest was performed, yielding a p-value of less than 0.01. This analysis suggests that Lorain’ssurvey respondents and nonrespondents systematically differ on their baseline characteristics,indicating that survey results may not generalize to study participants at Lorain as a whole.87
The Opening Doors DemonstrationAppendix Table B.2Selected Characteristics of 12-Month Survey Respondents and Nonrespondents:Lorain County Community CollegeLorain County Community College and Owens Community College ReportCharacteristic (%)FullSample Respondents NonrespondentsGenderMale 18.7 18.1 22.9Female 81.3 81.9 77.1Age in years18-20 14.3 13.2 22.7 ***21-25 38.8 39.7 32.426-30 29.7 29.8 29.031-34 17.2 17.3 15.9Marital statusMarried 27.7 29.0 17.8 **Unmarried 72.3 71.0 82.2 **Race/ethnicity aHispanic/Latino 14.2 14.0 15.5Black, non-Hispanic 21.4 20.0 31.4 ***White, non-Hispanic 58.6 60.3 46.1 ***Asian or Pacific Islander 0.2 0.3 -0.1Other b 5.6 5.4 6.9Has one child or more 82.4 83.1 77.6Household receiving any government benefits c 55.0 56.1 46.7 *Financially dependent on parents 9.6 9.4 10.9Ever employed 99.5 99.8 97.9 ***Currently employed 54.5 54.8 52.2Highest grade completed8th or lower 1.6 1.4 3.29th 4.4 4.8 1.2 *10th 7.0 7.0 7.211th 11.0 10.5 15.112th 76.0 76.4 73.3Diplomas/degrees earned dHigh school diploma 70.8 71.1 68.6General Educational Development (GED) certificate 27.7 27.4 30.1Occupational/technical certificate 15.9 15.3 20.3(continued)88
Table B.2 (continued)Characteristic (%)FullSample Respondents NonrespondentsDate of high school graduation/GED receiptDuring the past year 13.0 12.9 14.2Between 1 and 5 years ago 29.4 28.6 35.0More than 5 years ago 57.6 58.5 50.8Main reason for enrolling in college dTo complete a certificate program 11.1 10.7 14.5To obtain an associate’s degree 56.1 56.4 53.7To transfer to a 4-year college/university 19.7 19.1 23.8To obtain/update job skills 10.0 10.1 9.1Other 5.6 6.0 3.1First person in family to attend college 37.2 38.5 27.7 **Completed any college courses/credits 43.3 42.9 46.4Working personal computer in home 65.7 66.2 62.2Owns or has access to a working car 90.5 91.3 84.7 **Language other than English spoken regularly in home 10.8 10.1 16.0 *U.S. citizen 98.8 99.1 96.1 **Region in which student was bornNorth America 96.7 97.5 91.0 ***Asia 0.1 0.1 0.0Latin America and the Caribbean 2.0 1.7 4.7 **Other e 1.1 0.7 4.2 ***Region in which student’s mother was born fNorth America 91.8 92.4 87.5 *Asia 0.3 0.4 0.1Latin America and the Caribbean 5.6 5.3 7.3Other e 2.3 1.9 5.1 **Sample size 888 781 107(continued)89
Table B.2 (continued)SOURCE: MDRC calculations using Baseline Information Form (BIF) data.NOTES: A two-tailed t-test was applied to differences between the groups. Statistical significance levels areindicated as: *** = 1 percent; ** = 5 percent; * = 10 percent.Ten of the 898 sample members (1.1 percent) in the Opening Doors sample were excluded from the finalsurvey sample because they asked to not be contacted or were ineligible, incarcerated, or incapacitated at the timeof the survey fielding, bringing the survey sample size to 888.A separate test was conducted to determine whether baseline characteristics and research group status jointlypredicted whether students responded to the survey. This likelihood ratio test yielded a p-value of less than0.00. This analysis suggests that Lorain’s survey respondents and nonrespondents systematically differ on theirbaseline characteristics.Estimates are adjusted by research cohort and research group.Missing values are not included in individual variable distributions.Distributions may not add to 100 percent because of rounding.aRespondents who indicated that they are Hispanic and who chose a race are included only in theHispanic/Latino category.b“Other race” includes American Indians/Alaskan Natives and those who marked “other race/ethnicity” ormore than one racial category.cBenefits include Unemployment/Dislocated Worker benefits, Supplemental Security Income (SSI) ordisability, cash assistance or welfare, food stamps, and Section 8 or public housing.dDistributions may not add to 100 percent because categories are not mutually exclusive.eThis category includes the Baltics, the Commonwealth of Independent States, eastern and western Europe,North Africa, Sub-Saharan Africa, the Near East, and Oceania. The Commonwealth of Independent States includesArmenia, Azerbaijan, Belarus, Georgia, Kazakhstan, Kyrgyzstan, Republic of Moldova, Russia, Tajikistan,Turkmenistan (until August 2005), Ukraine, and Uzbekistan. Countries are grouped by region according to theU.S. Bureau of the Census, International Data Base.fThe majority of respondents reported that both parents were born in the same region as each other.Owens Community CollegeAppendix Table B.3 compares the baseline characteristics of respondents and nonrespondentsfrom Owens Community College only. The table shows that there are several statisticallysignificant differences between the two groups on their observable characteristics. Anomnibus test was also conducted to assess whether there were systematic differences in observablecharacteristics between survey respondents and nonrespondents. To analyze whether students’baseline characteristics and their research group status jointly predicted whether they respondedto the survey, a likelihood ratio test was performed, yielding a p-value of 0.01. Thisanalysis suggests that Owens’s survey respondents and nonrespondents systematically differ ontheir baseline characteristics, indicating that survey results may not generalize to study participantsat Owens as a whole.90
The Opening Doors DemonstrationAppendix Table B.3Selected Characteristics of 12-Month Survey Respondents and Nonrespondents:Owens Community CollegeLorain County Community College and Owens Community College ReportCharacteristic (%)FullSample Respondents NonrespondentsGenderMale 27.7 26.4 34.3 **Female 72.3 73.6 65.7 **Age in years18-20 37.9 38.1 37.121-25 32.5 32.1 34.626-30 19.4 19.6 18.631-34 10.2 10.3 9.7Marital statusMarried 14.5 15.0 11.7Unmarried 85.5 85.0 88.3Race/ethnicity aHispanic/Latino 8.3 8.6 6.8Black, non-Hispanic 36.3 37.0 32.5White, non-Hispanic 50.7 50.0 54.4Asian or Pacific Islander 0.9 0.9 1.0Other b 3.7 3.4 5.3Has one child or more 51.6 52.3 47.6Household receiving any government benefits c 43.7 44.8 37.9 *Financially dependent on parents 23.5 22.9 26.5Ever employed 97.6 97.4 99.0Currently employed 57.2 56.8 59.3Highest grade completed8th or lower 1.3 1.3 1.59th 3.4 3.2 4.210th 5.1 5.5 3.111th 6.3 6.2 7.112th 83.9 83.9 84.2Diplomas/degrees earned dHigh school diploma 79.4 79.2 80.2General Educational Development (GED) certificate 19.2 19.3 18.7Occupational/technical certificate 7.2 7.1 7.6(continued)91
Table B.3 (continued)Characteristic (%)FullSample Respondents NonrespondentsDate of high school graduation/GED receiptDuring the past year 27.9 28.1 26.7Between 1 and 5 years ago 32.8 31.8 37.9More than 5 years ago 39.3 40.0 35.4Main reason for enrolling in college dTo complete a certificate program 8.9 9.0 8.3To obtain an associate’s degree 44.3 45.2 39.4To transfer to a 4-year college/university 27.4 25.9 35.3 ***To obtain/update job skills 14.3 14.3 13.9Other 8.4 8.5 7.7First person in family to attend college 35.1 36.1 30.0Completed any college courses/credits 43.8 44.3 41.2Working personal computer in home 63.7 62.6 69.4 *Owns or has access to a working car 87.1 87.0 88.0Language other than English spoken regularly in home 6.2 5.4 10.0 **U.S. citizen 98.9 98.9 98.5Region in which student was bornNorth America 97.0 97.4 95.2Asia 0.7 0.6 1.1Latin America and the Caribbean 0.3 0.3 0.0Other e 2.0 1.7 3.7 *Region in which student’s mother was born fNorth America 95.6 96.0 93.5Asia 0.9 0.8 1.6Latin America and the Caribbean 0.6 0.6 0.5Other e 2.8 2.6 4.3Sample size 1,229 1,032 197(continued)92
Table B.3 (continued)SOURCE: MDRC calculations using Baseline Information Form (BIF) data.NOTES: A two-tailed t-test was applied to differences between the groups. Statistical significance levels areindicated as: *** = 1 percent; ** = 5 percent; * = 10 percent.Twelve of the 1,241 sample members (less than 1 percent) in the Opening Doors sample were excluded fromthe final survey sample because they were ineligible, incarcerated, or incapacitated at the time of the surveyfielding, bringing the survey sample size to 1,229.A separate test was conducted to determine whether baseline characteristics and research group status jointlypredicted whether students responded to the survey. This likelihood ratio test yielded a p-value of 0.01. Thisanalysis suggests that Owens’s survey respondents and nonrespondents systematically differ on their baselinecharacteristics.Estimates are adjusted by research cohort and research group.Missing values are not included in individual variable distributions.Distributions may not add to 100 percent because of rounding.aRespondents who indicated that they are Hispanic and who chose a race are included only in theHispanic/Latino category.b“Other race” includes American Indians/Alaskan Natives and those who marked “other race/ethnicity” ormore than one racial category.cBenefits include Unemployment/Dislocated Worker benefits, Supplemental Security Income (SSI) ordisability, cash assistance or welfare, food stamps, and Section 8 or public housing.dDistributions may not add to 100 percent because categories are not mutually exclusive.eThis category includes the Baltics, the Commonwealth of Independent States, eastern and western Europe,North Africa, Sub-Saharan Africa, the Near East, and Oceania. The Commonwealth of Independent States includesArmenia, Azerbaijan, Belarus, Georgia, Kazakhstan, Kyrgyzstan, Republic of Moldova, Russia, Tajikistan,Turkmenistan (until August 2005), Ukraine, and Uzbekistan. Countries are grouped by region according to the U.S.Bureau of the Census, International Data Base.fThe majority of respondents reported that both parents were born in the same region as each other.Comparing Baseline Characteristics Across Research GroupsAmong Survey RespondentsPooled SampleAppendix Table B.4 compares the baseline characteristics of the program group surveyrespondents with the baseline characteristics of the control group survey respondents for thepooled sample. This analysis is done to assess whether respondents with certain baseline characteristicswere more concentrated in one research group than the other. For example, the tableshows that among survey respondents, program group sample members were more likely thancontrol group sample members to report receiving any government benefits. As noted in thesection above, about Table B.1, in cases of mutually exclusive categories such as age, race, andlocation of birthplace, separate cases of statistically significant differences should be thought ofin broader terms instead of individual category differences. For example, among survey respondents,the program and control groups reported differences in race, region in which respondentwas born, and region in which respondent’s mother was born.93
The Opening Doors DemonstrationAppendix Table B.4Selected Characteristics of 12-Month Survey Respondents, by Research GroupLorain County Community College and Owens Community College ReportCharacteristic (%)Full Program ControlSample Group GroupGenderMale 22.7 22.4 23.1Female 77.3 77.6 76.9Age in years18-20 27.3 27.1 27.521-25 35.3 33.7 37.026-30 24.1 24.5 23.731-34 13.3 14.8 11.8 *Marital statusMarried 21.1 20.5 21.6Unmarried 78.9 79.5 78.4Race/ethnicity aHispanic/Latino 10.9 11.6 10.2Black, non-Hispanic 29.7 30.4 28.9White, non-Hispanic 54.5 52.6 56.5 *Asian or Pacific Islander 0.6 1.1 0.1 ***Other b 4.3 4.3 4.3Has one child or more 65.7 66.6 64.7Household receiving any government benefits c 49.6 52.1 47.1 **Financially dependent on parents 17.0 17.1 17.0Ever employed 98.4 98.9 97.9Currently employed 56.0 56.2 55.9Highest grade completed (%)8th or lower 1.3 1.3 1.39th 3.9 3.8 3.910th 6.1 5.9 6.311th 8.0 7.9 8.112th 80.6 80.9 80.3Diplomas/degrees earned dHigh school diploma 75.7 75.0 76.3General Educational Development (GED) certificate 22.9 22.7 23.1Occupational/technical certificate 10.7 11.3 10.1(continued)94
Table B.4 (continued)Characteristic (%)Full Program ControlSample Group GroupDate of high school graduation/GED receiptDuring the past year 21.4 21.5 21.3Between 1 and 5 years ago 30.5 29.4 31.6More than 5 years ago 48.1 49.1 47.1Main reason for enrolling in college dTo complete a certificate program 9.7 10.5 8.9To obtain an associate’s degree 50.1 48.4 51.8To transfer to a 4-year college/university 22.8 22.7 22.9To obtain/update job skills 12.6 13.2 12.0Other 7.4 7.4 7.4First person in family to attend college 37.1 37.0 37.1Completed any college courses/credits 43.6 45.4 41.7Working personal computer in home 64.1 64.4 63.8Owns or has access to a working car 88.8 89.8 87.8Language other than English spoken regularly in home 7.4 9.2 5.6 ***U.S. citizen 99.0 99.0 99.0Region in which respondent was bornNorth America 97.4 96.6 98.2 **Asia 0.4 0.6 0.2Latin America and the Caribbean 0.9 0.8 1.0Other e 1.3 2.0 0.6 ***Region in which respondent’s mother was born fNorth America 94.4 93.0 95.8 ***Asia 0.6 0.8 0.5Latin America and the Caribbean 2.7 3.1 2.2Other e 2.3 3.1 1.5 **Sample size 1,813 910 903(continued)95
Table B.4 (continued)SOURCE: MDRC calculations using Baseline Information Form (BIF) data.NOTES: A two-tailed t-test was applied to differences between the groups. Statistical significance levels areindicated as: *** = 1 percent; ** = 5 percent; * = 10 percent.A separate test was conducted to determine whether baseline characteristics jointly predicted researchgroup status among survey respondents. This likelihood ratio test yielded a p-value of 0.03. This analysissuggests that program group survey respondents and control group survey respondents systematically differ ontheir baseline characteristics in the pooled sample.Estimates are adjusted by college and research cohort.Missing values are not included in individual variable distributions.Distributions may not add to 100 percent because of rounding.aRespondents who indicated that they are Hispanic and who chose a race are included only in theHispanic/Latino category.b“Other race” includes American Indians/Alaskan Natives and those who marked “other race/ethnicity” ormore than one racial category.cBenefits include Unemployment/Dislocated Worker benefits, Supplemental Security Income (SSI) ordisability, cash assistance or welfare, food stamps, and Section 8 or public housing.dDistributions may not add to 100 percent because categories are not mutually exclusive.eThis category includes the Baltics, the Commonwealth of Independent States, eastern and western Europe,North Africa, Sub-Saharan Africa, the Near East, and Oceania. The Commonwealth of Independent Statesincludes Armenia, Azerbaijan, Belarus, Georgia, Kazakhstan, Kyrgyzstan, Republic of Moldova, Russia,Tajikistan, Turkmenistan (until August 2005), Ukraine, and Uzbekistan. Countries are grouped by regionaccording to the U.S. Bureau of the Census, International Data Base.fThe majority of respondents reported that both parents were born in the same region as each other.In addition to the individual tests described above, an omnibus test was conducted to assesswhether there were systematic differences in observable characteristics between programand control group survey respondents. To assess whether survey respondents’ baseline characteristicsjointly predicted their research group status, a likelihood ratio test was performed,yielding a p-value of 0.03. This analysis suggests that program group survey respondents andcontrol group survey respondents systematically differ on their baseline characteristics in thepooled sample. As a result, when conducting impact analyses on the pooled survey data, statisticaladjustments were made for several key variables on which program and control groupmembers differed at baseline. All such analyses yielded substantively similar results to analysesconducted without controls, so results presented do not control for any baseline characteristics.Lorain County Community CollegeAppendix Table B.5 compares the baseline characteristics of program group surveyrespondents to control group survey respondents from Lorain County Community College only.The table shows that there are several statistically significant differences between the twogroups on their observable characteristics. To assess whether survey respondents’ baseline characteristicsjointly predicted their research group status specifically at Lorain County Community96
The Opening Doors DemonstrationAppendix Table B.5Selected Characteristics of 12-Month Survey Respondents, by Research Group:Lorain County Community CollegeLorain County Community College and Owens Community College ReportCharacteristic (%)Full Program ControlSample Group GroupGenderMale 18.1 17.4 18.8Female 81.9 82.6 81.2Age in years18-20 13.1 12.6 13.621-25 39.7 35.6 43.9 **26-30 29.9 31.9 27.831-34 17.3 19.9 14.7 *Marital statusMarried 29.0 29.3 28.7Unmarried 71.0 70.7 71.3Race/ethnicity aHispanic/Latino 13.9 14.5 13.2Black, non-Hispanic 20.0 18.2 21.9White, non-Hispanic 60.5 60.9 60.1Asian or Pacific Islander 0.3 0.5 0.0Other b 5.3 5.9 4.7Has one child or more 83.1 84.7 81.4Household receiving any government benefits c 55.9 58.3 53.4Financially dependent on parents 9.4 9.3 9.4Ever employed 99.7 99.7 99.7Currently employed 55.1 56.6 53.4Highest grade completed8th or lower 1.4 2.0 0.89th 4.7 5.0 4.510th 7.0 6.8 7.311th 10.5 9.6 11.512th 76.3 76.6 76.0Diplomas/degrees earned dHigh school diploma 70.9 69.1 72.8General Educational Development (GED) certificate 27.5 28.2 26.9Occupational/technical certificate 15.2 16.0 14.4(continued)97
Table B.5 (continued)Characteristic (%)Full Program ControlSample Group GroupDate of high school graduation/GED receiptDuring the past year 12.9 13.1 12.6Between 1 and 5 years ago 28.6 26.4 30.9More than 5 years ago 58.5 60.5 56.5Main reason for enrolling in college dTo complete a certificate program 10.8 12.1 9.4To obtain an associate’s degree 56.5 54.8 58.2To transfer to a 4-year college/university 19.0 18.8 19.1To obtain/update job skills 10.2 10.6 9.9Other 6.0 5.8 6.3First person in family to attend college 38.4 39.7 37.1Completed any college courses/credits 42.7 43.6 41.8Working personal computer in home 66.1 66.4 65.9Owns or has access to a working car 91.3 90.9 91.6Language other than English spoken regularly in home 10.2 11.5 8.7U.S. citizen 99.1 99.0 99.2Region in which respondent was bornNorth America 97.4 97.0 97.9Asia 0.1 0.3 0.0Latin America and the Caribbean 1.7 1.5 1.9Other e 0.8 1.3 0.3Region in which respondent’s mother was born fNorth America 92.4 90.7 94.2 *Asia 0.4 0.3 0.5Latin America and the Caribbean 5.3 6.0 4.5Other e 1.9 3.0 0.8 **Sample size 781 398 383(continued)98
Table B.5 (continued)SOURCE: MDRC calculations using Baseline Information Form (BIF) data.NOTES: A two-tailed t-test was applied to differences between the groups. Statistical significance levels areindicated as: *** = 1 percent; ** = 5 percent; * = 10 percent.A separate test was conducted to determine whether baseline characteristics jointly predicted researchgroup status among survey respondents. This likelihood ratio test yielded a p-value of 0.19. Convention suggeststhat this likelihood is large enough that these potential differences between program group respondents andcontrol group respondents can be ignored in the analyses.Estimates are adjusted by research cohort.Missing values are not included in individual variable distributions.Distributions may not add to 100 percent because of rounding.aRespondents who indicated that they are Hispanic and who chose a race are included only in theHispanic/Latino category.b“Other race” includes American Indians/Alaskan Natives and those who marked “other race/ethnicity” ormore than one racial category.cBenefits include Unemployment/Dislocated Worker benefits, Supplemental Security Income (SSI) ordisability, cash assistance or welfare, food stamps, and Section 8 or public housing.dDistributions may not add to 100 percent because categories are not mutually exclusive.eThis category includes the Baltics, the Commonwealth of Independent States, eastern and western Europe,North Africa, Sub-Saharan Africa, the Near East, and Oceania. The Commonwealth of Independent Statesincludes Armenia, Azerbaijan, Belarus, Georgia, Kazakhstan, Kyrgyzstan, Republic of Moldova, Russia,Tajikistan, Turkmenistan (until August 2005), Ukraine, and Uzbekistan. Countries are grouped by regionaccording to the U.S. Bureau of the Census, International Data Base.fThe majority of respondents reported that both parents were born in the same region as each other.College, a likelihood ratio test was performed, yielding a p-value of 0.19. Convention suggeststhat this likelihood is large enough that these potential differences between program group respondentsand control group respondents can be ignored in the analyses.Owens Community CollegeAppendix Table B.6 compares the baseline characteristics of program group surveyrespondents with control group survey respondents from Owens Community College only. Thetable shows that there are several statistically significant differences between the two groups ontheir observable characteristics. To assess whether survey respondents’ baseline characteristicsjointly predicted their research group status specifically at Owens Community College, a likelihoodratio test was performed, yielding a p-value of 0.02. This analysis suggests that Owens’sprogram group survey respondents and control group survey respondents systematically differon their baseline characteristics.99
The Opening Doors DemonstrationAppendix Table B.6Selected Characteristics of 12-Month Survey Respondents, by Research Group:Owens Community CollegeLorain County Community College and Owens Community College ReportCharacteristic (%)Full Program ControlSample Group GroupGenderMale 26.3 26.2 26.4Female 73.7 73.8 73.6Age in years18-20 38.0 38.1 37.921-25 32.1 32.2 31.926-30 19.7 18.8 20.631-34 10.3 10.9 9.6Marital statusMarried 15.0 13.8 16.2Unmarried 85.0 86.2 83.8Race/ethnicity aHispanic/Latino 8.6 9.4 7.9Black, non-Hispanic 37.0 39.9 34.2 *White, non-Hispanic 50.0 46.2 53.7 **Asian or Pacific Islander 0.9 1.6 0.2 **Other b 3.5 3.0 4.0Has one child or more 52.4 52.9 51.9Household receiving any government benefits c 44.9 47.5 42.4 *Financially dependent on parents 22.9 23.0 22.7Ever employed 97.4 98.2 96.5 *Currently employed 56.8 55.8 57.7Highest grade completed8th or lower 1.3 0.8 1.79th 3.2 3.0 3.510th 5.5 5.3 5.611th 6.1 6.7 5.612th 83.9 84.3 83.6Diplomas/degrees earned dHigh school diploma 79.2 79.6 78.9General Educational Development (GED) certificate 19.3 18.5 20.1Occupational/technical certificate 7.2 7.7 6.8(continued)100
Table B.6 (continued)Characteristic (%)Full Program ControlSample Group GroupDate of high school graduation/GED receiptDuring the past year 28.0 28.0 28.0Between 1 and 5 years ago 31.9 31.7 32.2More than 5 years ago 40.1 40.3 39.8Main reason for enrolling in college dTo complete a certificate program 8.9 9.3 8.5To obtain an associate’s degree 45.2 43.5 46.9To transfer to a 4-year college/university 25.8 25.7 25.9To obtain/update job skills 14.5 15.2 13.7Other 8.5 8.7 8.3First person in family to attend college 36.0 34.9 37.1Completed any college courses/credits 44.3 46.8 41.7 *Working personal computer in home 62.5 62.9 62.2Owns or has access to a working car 86.9 88.9 85.0 *Language other than English spoken regularly in home 5.4 7.5 3.3 ***U.S. citizen 98.9 99.0 98.8Region in which respondent was bornNorth America 97.4 96.3 98.4 **Asia 0.6 0.8 0.4Latin America and the Caribbean 0.3 0.2 0.4Other e 1.7 2.7 0.8 **Region in which respondent’s mother was born fNorth America 96.0 94.8 97.2 *Asia 0.8 1.2 0.4Latin America and the Caribbean 0.6 0.8 0.4Other e 2.6 3.1 2.0Sample size 1,032 512 520(continued)101
Table B.6 (continued)SOURCE: MDRC calculations using Baseline Information Form (BIF) data.NOTES: A two-tailed t-test was applied to differences between the groups. Statistical significance levels areindicated as: *** = 1 percent; ** = 5 percent; * = 10 percent.A separate test was conducted to determine whether baseline characteristics jointly predicted research groupstatus. This likelihood ratio test yielded a p-value of 0.02. This analysis suggests that Owens’s program groupsurvey respondents and control group survey respondents systematically differ on their baseline characteristics.Estimates are adjusted by research cohort.Missing values are not included in individual variable distributions.Distributions may not add to 100 percent because of rounding.aRespondents who indicated that they are Hispanic and who chose a race are included only in theHispanic/Latino category.b“Other race” includes American Indians/Alaskan Natives and those who marked “other race/ethnicity” ormore than one racial category.cBenefits include Unemployment/Dislocated Worker benefits, Supplemental Security Income (SSI) ordisability, cash assistance or welfare, food stamps, and Section 8 or public housing.dDistributions may not add to 100 percent because categories are not mutually exclusive.eThis category includes the Baltics, the Commonwealth of Independent States, eastern and western Europe,North Africa, Sub-Saharan Africa, the Near East, and Oceania. The Commonwealth of Independent States includesArmenia, Azerbaijan, Belarus, Georgia, Kazakhstan, Kyrgyzstan, Republic of Moldova, Russia, Tajikistan,Turkmenistan (until August 2005), Ukraine, and Uzbekistan. Countries are grouped by region according to theU.S. Bureau of the Census, International Data Base.fThe majority of respondents reported that both parents were born in the same region as each other.ConclusionSurvey responses were collected from 85.6 percent of the eligible research sample atboth Lorain County Community College and Owens Community College; these response ratesare remarkable for a student population that traditionally is mobile and difficult to track. Thedata presented in Table B.1 and the likelihood ratio tests indicate that there is evidence of differencesbetween survey respondents and nonrespondents for the pooled sample. Thus, the selectivesurvey response analyses indicate that the outcomes drawn from the 12-month surveymay not generalize to the full research sample. Additionally, the data presented in Table B.4and the likelihood ratio tests performed suggest that there are differences between programgroup survey respondents and control group survey respondents for the pooled sample. As aresult of these differences, additional sensitivity analyses were conducted that adjusted forsome key baseline characteristics. These analyses yielded qualitatively similar results to thosepresented in this report.102
Appendix CSupplementary Tables for Chapter 3
Lorain OwensProgram ProgramOutcome Group GroupFirst program semesterHad one or more contacts with counselor (%) 98.4 91.3Number of contacts (%)0 1.6 8.71-2 15.1 36.53-5 40.8 43.26 or more 42.6 11.6Average number of contacts 5.6 3.0Second program semesterHad one or more contacts with counselor (%) 85.4 61.3Number of contacts (%)0 14.6 38.71-2 24.6 36.33-5 34.8 19.66 or more 25.9 5.3Average number of contacts 4.1 1.7Summary outcomes aThe Opening Doors DemonstrationAppendix Table C.1Opening Doors Counseling Sessions Among the Program Group Members, by CollegeLorain County Community College and Owens Community College ReportHad one or more contacts with counselor (%) 99.8 92.3Number of contacts (%)0 0.2 7.71-2 2.7 21.53-5 10.0 33.16 or more 87.1 37.6Average number of contacts 12.7 4.9Sample size (total = 1,073) 451 622SOURCES: MDRC calculations from Lorain County Community College and Owens Community CollegeOpening Doors counseling data.NOTES: Rounding may cause slight discrepancies in sums and differences.“Contact” includes all contact between students and counselors determined to be in person or over thetelephone.aAfter the second program semester, 155 sample members from Lorain (34.4 percent) and 29 sample membersfrom Owens (4.7 percent) had contact with a counselor. Summary outcomes include data through spring 2006.105
Lorain OwensProgram ProgramOutcome Group GroupFirst program semesterReceived one or more stipend payments (%) 91.8 84.7Received full $150 81.2 63.3Average stipend amount received per recipient a ($) 144 136Second program semesterReceived one or more stipend payments (%) 68.1 54.3Received full $150 61.6 38.7Average stipend amount received per recipient a ($) 145 132Summary outcomes bThe Opening Doors DemonstrationAppendix Table C.2Opening Doors Stipend Receipt Among the Program Group Members, by CollegeLorain County Community College and Owens Community College ReportReceived one or more stipend payments (%) 93.1 86.5Received full $300 59.9 35.7Average stipend amount received per recipient a ($) 251 220Sample size (total = 1,073) 451 622SOURCES: MDRC calculations from Lorain County Community College and Owens Community CollegeOpening Doors stipend data.NOTES: Rounding may cause slight discrepancies in sums and differences.aThe denominator in this outcome is stipend recipients rather than all program group members.bEleven sample members from Lorain (2.4 percent) and 16 sample members from Owens (2.6 percent)received stipend payments after the second program semester. Summary outcomes include data through spring2006.106
Lorain County Community CollegeOwens Community College DifferenceProgram Control Difference Standard Program Control Difference Standard BetweenOutcome (%) Group Group (Impact) Error Group Group (Impact) Error CollegesAttended 3 or more timesduring first year in studyThe Opening Doors DemonstrationAppendix Table C.3Receipt of Student Services, by CollegeLorain County Community College and Owens Community College ReportAcademic advising 63.1 40.4 22.7 *** 3.5 64.8 40.0 24.8 *** 3.0Financial aid advising 52.1 39.4 12.8 *** 3.5 47.0 41.2 5.8 * 3.1Tutoring on campus 29.1 20.1 8.9 *** 3.1 38.4 35.4 3.0 3.0Career counseling 25.2 12.6 12.5 *** 2.8 22.8 14.3 8.6 *** 2.4107Job placement assistance 12.1 6.2 5.9 *** 2.1 16.0 11.2 4.8 ** 2.1Advising about transferring earned credits 12.0 12.5 -0.6 2.4 20.5 12.4 8.1 *** 2.3 †††Sample size (total = 1,813) 398 383 512 520SOURCE: MDRC calculations from the Opening Doors 12-Month Survey.NOTES: Rounding may cause slight discrepancies in sums and differences.A two-tailed t-test was applied to differences between research groups. Statistical significance levels are indicated as: *** = 1 percent; ** = 5percent; * = 10 percent.A two-tailed t-test was applied to differences of impacts between colleges. Statistical significance levels are indicated as: ††† = 1 percent; ††= 5 percent; † = 10 percent.Estimates are adjusted by cohort.
Lorain County Community CollegeOwens Community College DifferenceProgram Control Difference Standard Program Control Difference Standard BetweenOutcome (%) Group Group (Impact) Error Group Group (Impact) Error CollegesCan identify a staff member or instructorfor support/guidanceWith personal or family issues 70.8 53.7 17.1 *** 3.4 62.2 44.6 17.6 *** 3.1With education and career goals 67.2 49.8 17.4 *** 3.5 59.0 42.4 16.7 *** 3.1Among those who attended an Opening Doorscollege during first year of studyThe Opening Doors DemonstrationAppendix Table C.4College Experiences of Sample Members, by CollegeLorain County Community College and Owens Community College ReportIntegration and sense of belonging at school aLow 16.0 20.6 -4.6 3.0 18.4 19.2 -0.8 2.7High 16.9 11.5 5.5 ** 2.7 18.4 17.7 0.7 2.6Rated college experience good or excellent b 88.3 84.5 3.9 2.6 86.8 79.5 7.3 *** 2.5108Sample size (total = 1,813) 398 383 512 520SOURCE: MDRC calculations from the Opening Doors 12-Month Survey.NOTES: Rounding may cause slight discrepancies in sums and differences.A two-tailed t-test was applied to differences between research groups. Statistical significance levels are indicated as: *** = 1 percent; ** = 5 percent;* = 10 percent.A two-tailed t-test was applied to differences of impacts between colleges. Statistical significance levels are indicated as: ††† = 1 percent; †† = 5percent; † = 10 percent.Estimates are adjusted by cohort.a8-item scale about sense of integration with and belonging to the school community; response categories range from 1 = “strongly disagree” to 4 =“strongly agree.” “Low” is the percentage of sample members scoring one standard deviation below the mean; “high” is the percentage of samplemembers scoring one standard deviation above the mean. Standard deviation is the measurement of the distribution of data about an average value. Itdescribes the amount of variation in the data on either side of the average value. At Lorain County Community College 670 of the 781 survey respondentsanswered the questions that made up this scale. At Owens Community College, 850 of the 1,032 survey respondents answered these questions.bAt Lorain County Community College, 701 of the 781 survey respondents answered this question. At Owens Community College, 892 of the 1,032survey respondents answered this question.
Appendix DDescription of Scales Presented in Chapters 3 and 4
Classroom and College ExperiencesIntegration and Sense of Belonging at School (10-item scale, Cronbach’s Alpha= 0.80)1. This is an unfriendly place. [responses were reversed in order to calculate the scalescore]2. I do not feel that I fit in or belong at this campus. [responses were reversed]3. The instructors and staff understand who I am, where I am coming from.4. It is difficult to make good friends with other students. [responses were reversed]5. The other students do not understand who I am, where I am coming from.[responses were reversed]6. This campus has the feeling of a community, where many people share the samegoals and interests.7. Many people on this campus know me by name.8. I do not feel I am a part of campus life. [responses were reversed]9. I know my way around this place.10. I am proud to be a student here.Response categories: Strongly disagree (1)Disagree (2)Agree (3)Strongly agree (4)Responses were summed and averaged. Scores range from 1 to 4.Social and Psychological OutcomesOutlook and IdentityOptimism (6-item scale, Cronbach’s Alpha = 0.72)1. In uncertain times, I usually expect the best.2. If something can go wrong for me, it will. [responses were reversed in order tocalculate the scale score]3. I am always optimistic about my future.111
4. I hardly ever expect things to go my way. [responses were reversed]5. I rarely count on good things happening to me. [responses were reversed]6. Overall, I expect more good things to happen to me than bad.Response categories: Strongly disagree (1)Somewhat disagree (2)Somewhat agree (3)Strongly agree (4)Responses were summed and averaged. Scores range from 1 to 4.Goal Orientation (3-item scale, Cronbach’s Alpha = 0.65)1. I don’t think much about my long-term goals. [responses were reversed in orderto calculate the scale score]2. I have many long-term goals that I will work to achieve.3. It is important for me to take time to plan out where I’m going in life.Response categories: Strongly disagree (1)Somewhat disagree (2)Somewhat agree (3)Strongly agree (4)Responses were summed and averaged. Scores range from 1 to 4.Life Engagement (6-item scale, Cronbach’s Alpha = 0.78)1. There is not enough purpose in my life. [responses were reversed in order tocalculate the scale score]2. I don’t care very much about the things I do. [responses were reversed]3. To me, the things I do are all worthwhile.4. I have lots of reasons for living.5. Most of what I do seems trivial and unimportant to me. [responses werereversed]6. I value my activities a lot.Response categories: Strongly disagree (1)Somewhat disagree (2)Somewhat agree (3)Strongly agree (4)Responses were summed and averaged. Scores range from 1 to 4.112
Self-Esteem (4-item scale, Cronbach’s Alpha = 0.69)1. I am able to do things as well as most other people.2. I feel that I’m a person of worth, or at least on an equal basis with others.3. I feel that I have a number of good qualities.4. I take a positive attitude toward myself.Response categories: Strongly disagree (1)Somewhat disagree (2)Somewhat agree (3)Strongly agree (4)Responses were summed and averaged. Scores range from 1 to 4.Sense of Self (13-item scale, Cronbach’s Alpha = 0.86)1. Your goals in life are becoming clearer.2. People know they can count on you to “be there” for them.3. You have a clear sense of your beliefs and values.4. There is at least one person who knows “the real you.”5. You have a good deal of freedom to explore things in life that interest you.6. You feel respected by others as an adult.7. There is at least one person with whom you can talk about anything.8. You feel that you are important, that you “matter,” to other people.9. You have a pretty good sense of the path you want to take in life and the stepsto take to get there.10. You can envision the kind of person you’d like to become.11. You feel your life is filled with meaning, a sense of purpose.12. It is easy for you to make close friends.13. People often seek your advice and support.Response categories: Strongly disagree (1)Somewhat disagree (2)Somewhat agree (3)Strongly agree (4)Responses were summed and averaged. Scores range from 1 to 4.113
Social Support and Civic EngagementGeneral Social Support (8-item scale, Cronbach’s Alpha = 0.80)1. There are people I know will help me if I need it.2. There is no one I feel comfortable talking about problems with. [responses werereversed in order to calculate the scale score]3. I am with a group of people who think the same way I do about things.4. If something went wrong, no one would help me. [responses were reversed]5. I have a trustworthy person to turn to if I have problems.6. I do not think that other people respect what I do. [responses were reversed]7. There is no one who likes to do the things I do. [responses were reversed]8. There are people who value my skills and abilities.Response categories: Strongly disagree (1)Disagree (2)Agree (3)Strongly agree (4)Responses were summed and averaged. Scores range from 1 to 4.Friends Value Education (5-item scale, Cronbach’s Alpha = 0.91)Among your friends, how important is it to…1. Go to college?2. Get good grades?3. Complete a college degree or training program?4. Use a college degree or program certificate to get a better job?5. Pursue advanced study after college?Response categories: Not very (1)Somewhat (2)Quite a bit (3)Extremely (4)Responses were summed and averaged. Scores range from 1 to 4.114
Civic Engagement (4-item summative scale, Cronbach’s Alpha = 0.54)1. Are you registered to vote?2. Did/do you plan to vote in the 2004 presidential election? 13. Since [date of random assignment], have you donated your time or money to apolitical campaign?4. Since [date of random assignment], have you attended a political speech, rally,or march?Each item has two response categories (1 = Yes and 0 = No). The four items areadded together and divided by 4. Response range is 0 to 1.Health OutcomesMental HealthStress (4-item scale, Cronbach’s Alpha = 0.71)During the past 30 days, about how often did you feel…1. That you were unable to control the important things in your life?2. Confident about your ability to handle your personal problems? [responseswere reversed in order to calculate the scale score]3. That things were going your way? [responses were reversed]4. That difficulties were piling up so high that you could not overcome them?Response categories: Never (1)Almost never (2)Sometimes (3)Fairly often (4)Very often (5)Responses were summed and averaged. Scores range from 1 to 5.1 Some sample members were surveyed before the election and some were surveyed afterwards.115
Psychological Distress (6-item summative scale, Cronbach’s Alpha = 0.80)During the past 30 days, about how often did you feel…1. Nervous?2. Hopeless?3. Restless or fidgety?4. So depressed that nothing could cheer you up?5. That everything was an effort?6. Worthless?Response categories: None of the time (0)A little of the time (1)Some of the time (2)Most of the time (3)All of the time (4)Responses were summed and averaged. Scores range from 0 to 24, with a cut-offpoint of 13 to determine nonspecific psychological distress.116
Appendix ESupplementary Tables for Chapter 4
Lorain County Community CollegeOwens Community CollegeDifferenceProgram Control Difference Standard Program Control Difference Standard BetweenOutcome Group Group (Impact) Error Group Group (Impact) Error CollegesFirst program semesterThe Opening Doors DemonstrationAppendix Table E.1Transcript Outcomes, by College, First and Second Program SemestersLorain County Community College and Owens Community College ReportRegistered for any courses (%) 89.6 87.5 2.1 2.1 90.2 89.5 0.7 1.7Average number of credits attempted 8.8 8.8 0.0 0.3 10.5 10.3 0.3 0.3Regular credits 6.1 6.3 -0.3 0.3 6.3 6.2 0.0 0.3Developmental credits 2.8 2.5 0.3 0.2 4.1 3.9 0.2 0.2Average number of credits earned 5.0 5.1 0.0 0.3 5.5 5.1 0.3 0.3Regular credits 3.5 3.7 -0.3 0.3 3.6 3.4 0.1 0.2Developmental credits 1.6 1.3 0.2 0.2 1.9 1.7 0.2 0.2119Passed all courses (%) 34.2 33.3 0.9 3.2 29.3 29.9 -0.6 2.6Withdrew from any courses (%) 42.8 38.7 4.0 3.3 20.7 17.1 3.6 2.2Term GPA (%)0 to 1.9 27.3 28.4 -1.2 3.0 40.5 38.5 2.0 2.82.0 and higher 53.0 51.7 1.3 3.3 37.6 36.8 0.8 2.7No GPA a 19.7 19.9 -0.2 2.7 21.9 24.7 -2.9 2.4Second program semesterRegistered for any courses (%) 68.5 59.9 8.6 *** 3.2 62.9 57.1 5.8 ** 2.7Average number of credits attempted 6.8 6.1 0.7 * 0.4 7.2 6.5 0.7 ** 0.3Regular credits 5.3 5.0 0.3 0.3 5.4 4.9 0.5 * 0.3Developmental credits 1.5 1.1 0.4 *** 0.1 1.7 1.5 0.2 0.2(continued)
Appendix Table E.1 (continued)Lorain County Community CollegeOwens Community CollegeDifferenceProgram Control Difference Standard Program Control Difference Standard BetweenOutcome Group Group (Impact) Error Group Group (Impact) Error CollegesAverage number of credits earned 3.9 3.6 0.3 0.3 4.0 3.5 0.5 * 0.3Regular credits 3.2 3.0 0.2 0.3 3.3 3.0 0.3 0.3Developmental credits 0.7 0.6 0.2 * 0.1 0.7 0.5 0.2 * 0.1Passed all courses (%) 27.1 23.2 3.8 2.9 22.2 21.2 1.0 2.3Withdrew from any courses (%) 29.7 28.6 1.1 3.0 15.6 11.6 4.0 ** 1.9120Term GPA (%)0 to 1.9 22.6 16.5 6.1 ** 2.6 28.3 26.8 1.5 2.52.0 and higher 39.5 38.5 1.0 3.2 30.2 26.5 3.8 2.5No GPA a 37.9 45.0 -7.1 ** 3.3 41.4 46.7 -5.3 * 2.8Sample size (total = 2,139) 451 447 622 619SOURCES: MDRC calculations from Lorain County Community College and Owens Community College transcript data.NOTES: Rounding may cause slight discrepancies in sums and differences.A two-tailed t-test was applied to differences between research groups. Statistical significance levels are indicated as: *** = 1 percent; ** = 5percent; * = 10 percent.A two-tailed t-test was applied to differences of impacts between colleges. Statistical significance levels are indicated as: ††† = 1 percent; †† = 5percent; † = 10 percent.Estimates are adjusted by cohort.GPA = grade point average.Grades earned in all courses except for developmental courses are used in the calculation of term GPA.aThe “No GPA” category includes students who did not enroll and students who took only developmental courses, which are not included in GPAcalculations.
Lorain County Community CollegeOwens Community College DifferenceProgram Control Difference Standard Program Control Difference Standard BetweenOutcome Group Group (Impact) Error Group Group (Impact) Error CollegesFirst postprogram semesterThe Opening Doors DemonstrationAppendix Table E.2Transcript Outcomes, by College, First Through Fourth Postprogram SemestersLorain County Community College and Owens Community College ReportRegistered for any courses (%) 47.4 43.0 4.5 3.3 41.0 37.9 3.1 2.8Average number of credits attempted 4.4 4.1 0.3 0.4 4.6 4.1 0.5 0.3Regular credits 3.7 3.6 0.1 0.3 3.9 3.6 0.3 0.3Developmental credits 0.7 0.5 0.1 0.1 0.7 0.5 0.1 0.1121Average number of credits earned 2.6 2.4 0.2 0.3 2.8 2.8 0.0 0.3Regular credits 2.3 2.1 0.1 0.2 2.5 2.5 0.0 0.2Developmental credits 0.3 0.3 0.0 0.1 0.2 0.3 -0.1 0.1Term GPA (%)0 to 1.9 14.2 13.2 1.0 2.3 15.6 12.1 3.5 * 2.02.0 and higher 28.6 26.6 1.9 3.0 23.0 24.4 -1.4 2.4No GPA a 57.2 60.2 -3.0 3.3 61.4 63.5 -2.1 2.7Second postprogram semesterRegistered for any courses (%) 39.9 34.2 5.7 * 3.2 30.6 31.0 -0.4 2.6Average number of credits attempted 3.7 3.2 0.5 0.3 3.2 3.3 -0.1 0.3Regular credits 3.3 2.9 0.5 0.3 3.0 3.1 -0.1 0.3Developmental credits 0.4 0.3 0.1 0.1 0.3 0.2 0.0 0.1(continued)
Lorain County Community CollegeOwens Community College DifferenceProgram Control Difference Standard Program Control Difference Standard BetweenOutcome Group Group (Impact) Error Group Group (Impact) Error CollegesAverage number of credits earned 2.4 2.0 0.4 0.3 1.9 2.2 -0.3 0.2 †Regular credits 2.2 1.9 0.3 0.2 1.9 2.1 -0.2 0.2Developmental credits 0.2 0.1 0.1 0.1 0.0 0.1 -0.1 * 0.0 †Term GPA (%)0 to 1.9 9.8 9.6 0.2 2.0 14.5 10.5 4.0 ** 1.92.0 and higher 26.4 21.9 4.5 2.8 15.3 19.1 -3.8 * 2.1 ††No GPA a 63.8 68.5 -4.6 3.2 70.2 70.5 -0.2 2.6Third postprogram semesterAppendix Table E.2 (continued)Registered for any courses (%) 34.6 28.0 6.6 ** 3.1 24.8 24.4 0.4 2.4122Average number of credits attempted 3.2 2.5 0.7 ** 0.3 2.6 2.4 0.2 0.3Regular credits 3.0 2.3 0.7 ** 0.3 2.4 2.2 0.2 0.3Developmental credits 0.3 0.2 0.1 0.1 0.2 0.1 0.1 0.1Average number of credits earned 2.0 1.7 0.3 0.2 1.8 1.8 0.0 0.2Regular credits 1.9 1.6 0.3 0.2 1.7 1.7 0.0 0.2Developmental credits 0.1 0.1 0.0 0.0 0.0 0.1 0.0 0.0Term GPA (%)0 to 1.9 7.8 5.4 2.4 1.7 9.2 6.6 2.6 * 1.52.0 and higher 23.5 20.8 2.7 2.8 14.5 16.5 -2.0 2.0No GPA a 68.7 73.8 -5.1 * 3.0 76.3 76.9 -0.6 2.4(continued)
Lorain County Community CollegeOwens Community College DifferenceProgram Control Difference Standard Program Control Difference Standard BetweenOutcome Group Group (Impact) Error Group Group (Impact) Error CollegesFourth postprogram semester bAppendix Table E.2 (continued)Registered for any courses (%) 29.5 24.8 4.7 3.0 20.8 21.9 -1.2 2.3Average number of credits attempted 2.7 2.3 0.5 0.3 2.0 2.0 0.1 0.2Regular credits 2.6 2.1 0.5 * 0.3 1.9 1.8 0.1 0.2Developmental credits 0.2 0.2 0.0 0.1 0.1 0.1 -0.1 0.0Sample size (total = 2,139) 451 447 622 619SOURCES: MDRC calculations from Lorain County Community College and Owens Community College transcript data.123NOTES: Rounding may cause slight discrepancies in sums and differences.A two-tailed t-test was applied to differences between research groups. Statistical significance levels are indicated as: *** = 1 percent; ** = 5 percent; * =10 percent.A two-tailed t-test was applied to differences of impacts between colleges. Statistical significance levels are indicated as: ††† = 1 percent; †† = 5 percent;† = 10 percent.Estimates are adjusted by cohort.GPA = grade point average.aThe “No GPA” category includes students who did not enroll and students who took only developmental courses, which are not included in GPAcalculations.bThe fourth postprogram semester does not include data for credits earned or term GPA.
The Opening Doors DemonstrationAppendix Table E.3Cumulative Transcript Outcomes, by College,First Program Semester Through Third Postprogram SemesterLorain County Community College and Owens Community College ReportLorain County Community CollegeOwens Community College DifferenceProgram Control Difference Standard Program Control Difference Standard BetweenOutcome Group Group (Impact) Error Group Group (Impact) Error CollegesRegistered for any courses a (%) 93.8 92.6 1.2 1.7 94.1 93.2 0.8 1.4Average number of semesters registered a 3.6 3.2 0.4 ** 0.2 3.0 2.9 0.1 0.1Average number of credits earned 17.8 16.4 1.4 1.2 17.1 16.7 0.4 1.1Regular credits 14.7 13.9 0.8 1.1 14.0 14.0 0.1 1.0Developmental credits 3.2 2.5 0.6 ** 0.3 3.1 2.8 0.3 0.2124Cumulative GPA (%)0 to 1.9 38.6 39.6 -1.0 3.3 50.8 48.3 2.5 2.82.0 and higher 48.8 47.2 1.5 3.3 36.8 37.6 -0.8 2.7No GPA b 12.6 13.2 -0.6 2.2 12.4 14.1 -1.7 1.9Earned a degree/certificate (%) 1.5 1.8 -0.3 0.9 1.6 3.1 -1.5 * 0.9Sample size (total = 2,139) 451 447 622 619SOURCE: MDRC calculations from Lorain County Community College and Owens Community College transcript data.NOTES: Rounding may cause slight discrepancies in sums and differences.A two-tailed t-test was applied to differences between research groups. Statistical significance levels are indicated as: *** = 1 percent; ** = 5 percent; * =10 percent.A two-tailed t-test was applied to differences of impacts between colleges. Statistical significance levels are indicated as: ††† = 1 percent; †† = 5 percent;† = 10 percent.Estimates are adjusted by cohort.GPA = grade point average.aOutcomes are from the first program semester through the fourth postprogram semester, and include summer semesters.bThe “No GPA” category includes students who did not enroll and students who took only developmental courses, which are not included in GPAcalculations.
Male SubgroupFemale SubgroupDifferenceProgram Control Difference Standard Program Control Difference Standard BetweenOutcome Group Group (Impact) Error Group Group (Impact) Error SubgroupsFirst program semesterThe Opening Doors DemonstrationAppendix Table E.4Transcript Outcomes, by Gender, First and Second Program SemestersLorain County Community College and Owens Community College ReportRegistered for any courses (%) 88.3 88.5 -0.2 2.8 90.4 88.7 1.7 1.5Average number of credits attempted 10.2 10.1 0.1 0.4 9.7 9.5 0.2 0.2Regular credits 6.6 6.6 0.0 0.4 6.0 6.2 -0.1 0.2Developmental credits 3.4 3.4 0.1 0.3 3.6 3.3 0.3 * 0.2125Average number of credits earned 4.8 5.1 -0.3 0.4 5.4 5.1 0.3 0.2Regular credits 3.6 3.8 -0.2 0.4 3.5 3.5 0.0 0.2Developmental credits 1.2 1.3 -0.1 0.2 1.9 1.6 0.3 *** 0.1 †Passed all courses (%) 22.9 26.4 -3.4 3.8 33.9 33.0 0.8 2.3Withdrew from any courses (%) 29.5 23.0 6.4 * 3.7 30.3 27.1 3.2 2.2Term GPA (%)0 to 1.9 41.2 41.2 0.0 4.3 32.8 32.1 0.6 2.32.0 and higher 34.5 37.1 -2.6 4.2 47.1 45.0 2.1 2.4No GPA a 24.3 21.6 2.6 3.7 20.1 22.9 -2.8 2.0Second program semesterRegistered for any courses (%) 57.5 52.0 5.5 4.3 67.8 60.3 7.5 *** 2.3Average number of credits attempted 6.3 6.1 0.2 0.5 7.2 6.3 0.9 *** 0.3Regular credits 4.9 4.8 0.0 0.5 5.5 4.9 0.6 ** 0.2Developmental credits 1.4 1.2 0.2 0.2 1.7 1.4 0.3 ** 0.1(continued)
Appendix Table E.4 (continued)Male SubgroupFemale SubgroupDifferenceProgram Control Difference Standard Program Control Difference Standard BetweenOutcome Group Group (Impact) Error Group Group (Impact) Error SubgroupsAverage number of credits earned 3.4 3.2 0.2 0.4 4.1 3.7 0.5 * 0.2Regular credits 2.9 2.9 0.0 0.4 3.4 3.1 0.3 0.2Developmental credits 0.5 0.3 0.2 * 0.1 0.8 0.6 0.2 ** 0.1Passed all courses (%) 16.4 16.3 0.1 3.3 26.7 23.9 2.8 2.2Withdrew from any courses (%) 21.7 15.7 6.0 * 3.4 21.6 19.7 1.9 2.0Term GPA (%)0 to 1.9 23.2 22.3 0.8 3.7 26.8 22.5 4.3 ** 2.12.0 and higher 26.6 24.7 1.9 3.8 36.6 33.7 2.9 2.3No GPA a 50.3 53.0 -2.7 4.4 36.6 43.8 -7.2 *** 2.4126Sample size (total = 2,139) 257 262 816 804SOURCES: MDRC calculations from Lorain County Community College and Owens Community College transcript data.NOTES: Rounding may cause slight discrepancies in sums and differences.A two-tailed t-test was applied to differences between research groups. Statistical significance levels are indicated as: *** = 1 percent; ** = 5percent; * = 10 percent.A two-tailed t-test was applied to differences of impacts between subgroups. Statistical significance levels are indicated as: ††† = 1 percent; †† = 5percent; † = 10 percent.Estimates are adjusted by cohort and college.GPA = grade point average.Grades earned in all courses except for developmental courses are used in the calculation of term GPA.aThe “No GPA” category includes students who did not enroll and students who took only developmental courses, which are not included in GPAcalculations.
Male SubgroupFemale SubgroupDifferenceProgram Control Difference Standard Program Control Difference Standard BetweenOutcome Group Group (Impact) Error Group Group (Impact) Error SubgroupsFirst postprogram semesterThe Opening Doors DemonstrationAppendix Table E.5Transcript Outcomes, by Gender, First Through Fourth Postprogram SemestersLorain County Community College and Owens Community College ReportRegistered for any courses (%) 33.2 33.5 -0.3 4.2 47.0 42.3 4.7 * 2.5Average number of credits attempted 3.5 3.6 -0.1 0.5 4.8 4.3 0.5 * 0.3Regular credits 3.1 3.1 0.0 0.5 4.1 3.7 0.3 0.3Developmental credits 0.4 0.5 -0.1 0.1 0.7 0.6 0.2 ** 0.1 †127Average number of credits earned 2.0 2.4 -0.4 0.4 2.9 2.7 0.2 0.2Regular credits 1.9 2.2 -0.3 0.4 2.6 2.4 0.2 0.2Developmental credits 0.1 0.2 -0.1 0.1 0.3 0.3 0.0 0.1Term GPA (%)0 to 1.9 10.0 10.8 -0.9 2.7 16.6 13.1 3.5 * 1.82.0 and higher 18.6 22.3 -3.7 3.6 27.4 26.4 1.0 2.2No GPA a 71.5 66.9 4.6 4.1 56.0 60.4 -4.4 * 2.4 †Second postprogram semesterRegistered for any courses (%) 24.0 24.5 -0.5 3.8 37.8 34.9 2.9 2.4Average number of credits attempted 2.5 2.6 -0.1 0.4 3.7 3.5 0.3 0.3Regular credits 2.3 2.5 -0.2 0.4 3.4 3.2 0.2 0.2Developmental credits 0.2 0.1 0.1 0.1 0.3 0.3 0.0 0.1(continued)
Male SubgroupFemale SubgroupDifferenceProgram Control Difference Standard Program Control Difference Standard BetweenOutcome Group Group (Impact) Error Group Group (Impact) Error SubgroupsAverage number of credits earned 1.5 1.7 -0.2 0.3 2.3 2.3 0.1 0.2Regular credits 1.5 1.6 -0.2 0.3 2.2 2.1 0.1 0.2Developmental credits 0.0 0.1 0.0 0.0 0.1 0.1 0.0 0.0Term GPA (%)0 to 1.9 9.9 9.0 0.9 2.6 13.3 10.5 2.8 * 1.62.0 and higher 12.9 15.3 -2.4 3.1 22.2 21.9 0.3 2.0No GPA a 77.2 75.8 1.5 3.8 64.5 67.6 -3.1 2.3Third postprogram semesterAppendix Table E.5 (continued)Registered for any courses (%) 17.2 20.9 -3.7 3.5 32.7 27.4 5.3 ** 2.3 ††128Average number of credits attempted 1.8 1.8 -0.1 0.4 3.2 2.6 0.6 *** 0.2Regular credits 1.6 1.8 -0.1 0.3 3.0 2.4 0.6 ** 0.2 †Developmental credits 0.2 0.1 0.1 0.1 0.2 0.2 0.1 0.1Average number of credits earned 1.2 1.4 -0.2 0.3 2.1 1.8 0.3 0.2Regular credits 1.2 1.3 -0.1 0.3 2.0 1.8 0.3 0.2Developmental credits 0.0 0.1 -0.1 0.0 0.1 0.1 0.0 0.0Term GPA (%)0 to 1.9 5.4 4.3 1.1 1.9 9.6 6.7 2.9 ** 1.42.0 and higher 10.2 15.6 -5.3 * 3.0 20.9 19.1 1.8 2.0 ††No GPA a 84.4 80.2 4.2 3.4 69.5 74.2 -4.7 ** 2.2 ††(continued)
Male SubgroupFemale SubgroupDifferenceProgram Control Difference Standard Program Control Difference Standard BetweenOutcome Group Group (Impact) Error Group Group (Impact) Error SubgroupsFourth postprogram semester bAppendix Table E.5 (continued)Registered for any courses (%) 14.9 14.7 0.2 3.2 27.5 25.8 1.7 2.2Average number of credits attempted 1.4 1.2 0.1 0.3 2.6 2.4 0.3 0.2Regular credits 1.3 1.1 0.2 0.3 2.5 2.2 0.3 0.2Developmental credits 0.1 0.1 0.0 0.1 0.1 0.2 0.0 0.0Sample size (total = 2,139) 257 262 816 804SOURCES: MDRC calculations from Lorain County Community College and Owens Community College transcript data.129NOTES: Rounding may cause slight discrepancies in sums and differences.A two-tailed t-test was applied to differences between research groups. Statistical significance levels are indicated as: *** = 1 percent; ** = 5percent; * = 10 percent.A two-tailed t-test was applied to differences of impacts between subgroups. Statistical significance levels are indicated as: ††† = 1 percent; †† = 5percent; † = 10 percent.Estimates are adjusted by cohort and college.GPA = grade point average.aThe “No GPA” category includes students who did not enroll and students who took only developmental courses, which are not included in GPAcalculations.bThe fourth postprogram semester does not include data for credits earned or term GPA.
The Opening Doors DemonstrationAppendix Table E.6Cumulative Transcript Outcomes, by Gender,First Program Semester Through Third Postprogram SemesterLorain County Community College and Owens Community College ReportMale SubgroupFemale SubgroupDifferenceProgram Control Difference Standard Program Control Difference Standard BetweenOutcome Group Group (Impact) Error Group Group (Impact) Error SubgroupsRegistered for any courses a (%) 92.9 91.4 1.5 2.4 94.3 93.5 0.8 1.2Average number of semesters registered a 2.6 2.6 0.1 0.2 3.5 3.2 0.3 ** 0.1Average number of credits earned 14.1 14.6 -0.5 1.6 18.4 17.2 1.2 0.9Regular credits 12.0 12.5 -0.6 1.5 15.0 14.4 0.6 0.9Developmental credits 2.1 2.1 0.0 0.3 3.4 2.8 0.6 *** 0.2130Cumulative GPA (%)0 to 1.9 51.9 50.3 1.6 4.4 43.7 42.8 0.8 2.52.0 and higher 31.7 35.3 -3.6 4.2 45.0 43.8 1.2 2.4No GPA b 16.4 14.5 1.9 3.2 11.3 13.4 -2.0 1.6Earned a degree/certificate (%) 0.8 2.7 -1.9 * 1.2 1.8 2.5 -0.7 0.7Sample size (total = 2,139) 257 262 816 804SOURCE: MDRC calculations from Lorain County Community College and Owens Community College transcript data.NOTES: Rounding may cause slight discrepancies in sums and differences.A two-tailed t-test was applied to differences between research groups. Statistical significance levels are indicated as: *** = 1 percent; ** = 5 percent; * =10 percent.A two-tailed t-test was applied to differences of impacts between subgroups. Statistical significance levels are indicated as: ††† = 1 percent; †† = 5 percent;† = 10 percent.Estimates are adjusted by cohort and college.GPA = grade point average.aOutcomes are from the first program semester through the fourth postprogram semester, and include summer semesters.bThe “No GPA” category includes students who did not enroll and students who took only developmental courses, which are not included in GPAcalculations.
Lorain County Community CollegeOwens Community College DifferenceProgram Control Difference Standard Program Control Difference Standard BetweenOutcome (%) Group Group (Impact) Error Group Group (Impact) Error CollegesFirst program semesterRegistered at any institution a 89.8 88.4 1.5 2.1 91.0 90.3 0.7 1.6At student’s Opening Doors college 89.6 87.5 2.1 2.1 90.2 89.5 0.7 1.7At any 2-year institution b 0.4 0.7 -0.2 0.5 0.6 0.3 0.3 0.4At any 4-year institution 0.2 0.2 0.0 0.3 1.1 1.0 0.2 0.6Second program semesterThe Opening Doors DemonstrationAppendix Table E.7Enrollment at Opening Doors Institutions and Other Institutions, by College,First Program Semester Through Fourth Postprogram SemesterLorain County Community College and Owens Community College Report131Registered at any institution a 70.1 61.5 8.6 3.1 *** 66.1 60.2 5.9 2.7 **At student’s Opening Doors college 68.5 59.9 8.6 3.2 *** 62.9 57.1 5.8 2.7 **At any 2-year institution b 1.3 1.1 0.2 0.7 1.8 1.0 0.8 0.7At any 4-year institution 0.4 0.9 -0.4 0.5 1.9 2.4 -0.5 0.8First postprogram semesterRegistered at any institution a 50.3 45.4 4.9 3.3 46.8 43.4 3.4 2.8At student’s Opening Doors college 47.4 43.0 4.5 3.3 41.0 37.9 3.1 2.8At any 2-year institution b 1.8 1.1 0.7 0.8 2.4 1.8 0.6 0.8At any 4-year institution 1.1 2.0 -0.9 0.8 3.5 3.9 -0.3 1.1Second postprogram semesterRegistered at any institution a 43.9 37.8 6.1 3.3 * 36.2 37.1 -0.9 2.7 †At student’s Opening Doors college 39.9 34.2 5.7 3.2 * 30.6 31.0 -0.4 2.6At any 2-year institution b 2.0 1.8 0.2 0.9 2.1 2.3 -0.2 0.8At any 4-year institution 2.0 2.5 -0.5 1.0 3.9 4.2 -0.3 1.1(continued)
Lorain County Community CollegeOwens Community College DifferenceProgram Control Difference Standard Program Control Difference Standard BetweenOutcome (%) Group Group (Impact) Error Group Group (Impact) Error CollegesThird postprogram semesterRegistered at any institution a 38.1 32.2 5.9 3.2 * 32.2 31.5 0.7 2.6At student’s Opening Doors college 34.6 28.0 6.6 3.1 ** 24.8 24.4 0.4 2.4At any 2-year institution b 1.3 1.1 0.2 0.7 3.9 2.4 1.4 1.0At any 4-year institution 2.2 3.8 -1.6 1.1 3.9 5.3 -1.5 1.2Fourth postprogram semesterAppendix Table E.7 (continued)Registered at any institution a 33.9 28.6 5.3 3.1 * 28.0 29.2 -1.2 2.6At student’s Opening Doors college 29.5 24.8 4.7 3.0 20.8 21.9 -1.2 2.3At any 2-year institution b 2.0 0.9 1.1 0.8 2.6 2.9 -0.3 0.9At any 4-year institution 2.9 3.8 -1.0 1.2 4.8 4.5 0.3 1.2132Cumulative measures cRegistered at any institution a 95.1 92.8 2.3 1.6 95.2 94.3 0.8 1.3At student’s Opening Doors college 93.8 92.6 1.2 1.7 94.1 93.2 0.8 1.4At any 2-year institution b 5.3 3.6 1.7 1.4 7.4 6.6 0.8 1.5At any 4-year institution 5.1 5.8 -0.7 1.5 8.7 10.8 -2.1 1.7Earned a degree or certificate from any institution 1.5 2.2 -0.7 0.9 1.9 3.2 -1.3 0.9From student’s Opening Doors college 1.5 1.8 -0.3 0.9 1.6 3.1 -1.5 0.9 *From any 2-year institution b 0.0 0.4 -0.4 0.3 0.0 0.0 0.0 0.0From any 4-year institution 0.0 0.2 -0.2 0.2 0.3 0.2 0.2 0.3Sample size (total = 2,139) 451 447 622 619(continued)
Appendix Table E.7 (continued)SOURCES: MDRC calculations using data from the StudentTracker service of the National Student Clearinghouse and transcript data from LorainCounty Community College and Owens Community College.NOTES: The Clearinghouse collects data from about 3,300 colleges that enroll 92 percent of U.S. college students. Students have the right to opt outof having their information sent. Records were found in the Clearinghouse file for 95 percent of the students randomly assigned at Lorain CountyCommunity College and Owens Community College.A two-tailed t-test was applied to differences between research groups. Statistical significance levels are indicated as: *** = 1 percent; ** = 5percent; * = 10 percent.A two-tailed t-test was applied to differences of impacts between colleges. Statistical significance levels are indicated as: ††† = 1 percent; †† = 5percent; † = 10 percent.Missing values are not included in individual variable distributions.Distributions may not add to 100 percent because of rounding.aDistributions may not add to the percent registered at any institution because of co-enrollment.bThis category excludes Lorain County Community College and Owens Community College.cSummer and winter semesters are not shown as relative semesters, but they are included in cumulative measures.dOutcomes include data from the first program semester through the third postprogram semester.133
Lorain County Community CollegeOwens Community College DifferenceProgram Control Difference Standard Program Control Difference Standard BetweenOutcome Group Group (Impact) Error Group Group (Impact) Error CollegesFirst program semesterThe Opening Doors ReportAppendix Table E.8Impacts on Sample Members’ Financial Aid Exclusive of Opening Doors, by College,First Program Semester Through Third Postprogram SemesterLorain County Community College and Owens Community College ReportRegistered for any courses (%) 89.6 87.5 2.1 2.1 90.2 89.5 0.7 1.7Awarded financial assistance a (%) 92.5 91.3 1.2 1.8 84.9 84.3 0.6 2.0Federal Pell Grant 88.5 84.8 3.7 2.3 80.4 78.5 1.9 2.3Any other grants b 68.6 68.6 0.0 3.0 67.4 65.1 2.3 2.7Subsidized loans 18.2 20.2 -2.0 2.6 44.7 45.9 -1.2 2.8Unsubsidized loans 9.1 10.3 -1.2 2.0 28.3 31.5 -3.2 2.6Federal Work-Study c 3.6 2.4 1.1 1.1 N/A N/A134Average financial assistance received per recipient ($) 2,240 2,252 3,083 3,078Second program semesterRegistered for any courses (%) 68.5 59.9 8.6 3.2 *** 62.9 57.1 5.8 2.7 **Awarded financial assistance a (%) 73.3 69.3 4.0 2.9 58.9 52.9 5.9 2.8 **Federal Pell Grant 67.0 58.4 8.6 3.2 *** 54.7 48.3 6.4 2.8 **Any other grants b 62.9 61.4 1.5 3.1 49.4 40.8 8.5 2.8 *** †Subsidized loans 16.4 19.0 -2.7 2.5 30.6 29.6 1.0 2.6Unsubsidized loans 9.5 11.7 -2.2 2.0 19.9 22.9 -3.0 2.3Federal Work-Study c 4.0 2.2 1.8 1.2 N/A N/AAverage financial assistance received per recipient ($) 2,305 2,319 3,028 3,030(continued)
Lorain County Community CollegeOwens Community College DifferenceProgram Control Difference Standard Program Control Difference Standard BetweenOutcome Group Group (Impact) Error Group Group (Impact) Error CollegesFirst postprogram semesterRegistered for any courses (%) 47.4 43.0 4.5 3.3 41.0 37.9 3.1 2.8Awarded financial assistance a (%) 51.9 46.3 5.6 3.3 * 37.2 33.1 4.1 2.7Federal Pell Grant 45.4 40.7 4.7 3.3 34.6 30.0 4.5 2.7 *Any other grants b 43.7 40.2 3.5 3.3 28.5 25.5 3.0 2.5Subsidized loans 14.8 13.9 0.9 2.3 21.1 21.0 0.1 2.3Unsubsidized loans 8.4 10.1 -1.7 1.9 15.9 14.9 1.1 2.0Federal Work-Study c 2.0 1.3 0.6 0.9 N/A N/AAverage financial assistance received per recipient ($) 2,231 2,343 3,302 3,365Second postprogram semesterAppendix Table E.8 (continued)135Registered for any courses (%) 39.9 34.2 5.7 3.2 * 30.6 31.0 -0.4 2.6Awarded financial assistance a (%) 41.5 36.9 4.6 3.3 28.0 28.1 -0.1 2.5Federal Pell Grant 37.1 31.7 5.3 3.2 * 24.9 24.2 0.7 2.4Any other grants b 34.6 31.3 3.3 3.1 22.0 22.0 0.1 2.4Subsidized loans 14.6 11.4 3.2 2.2 17.2 17.1 0.1 2.1Unsubsidized loans 10.6 8.5 2.1 2.0 12.7 13.4 -0.7 1.9Federal Work-Study c 1.3 0.9 0.4 0.7 N/A N/AAverage financial assistance received per recipient ($) 2,363 2,213 3,338 3,300Third postprogram semesterRegistered for any courses (%) 34.6 28.0 6.6 3.1 ** 24.8 24.4 0.4 2.4(continued)
Lorain County Community CollegeOwens Community College DifferenceProgram Control Difference Standard Program Control Difference Standard BetweenOutcome Group Group (Impact) Error Group Group (Impact) Error CollegesAwarded financial assistance a (%) 36.1 27.7 8.4 3.1 *** 22.5 22.1 0.4 2.4 ††Federal Pell Grant 32.2 25.5 6.7 3.0 ** 20.6 20.5 0.1 2.3 †Any other grants b 24.7 21.0 3.7 2.8 16.3 16.9 -0.7 2.1Subsidized loans 13.7 8.5 5.2 2.1 ** 16.4 16.9 -0.5 2.1 †Unsubsidized loans 9.7 5.8 3.9 1.8 ** 12.6 13.2 -0.7 1.9 †Federal Work-Study c 1.1 0.7 0.4 0.6 N/A N/AAverage financial assistance received per recipient ($) 2,401 2,288 3,856 4,063Summary outcomesAppendix Table E.8 (continued)Registered for any courses (%) 93.4 91.7 1.6 1.8 93.7 92.9 0.8 1.4136Awarded financial assistance a (%) 95.1 94.0 1.1 1.5 88.8 88.0 0.7 1.8Federal Pell Grant 92.5 89.9 2.5 1.9 84.7 82.7 2.0 2.1Any other grants b 80.7 80.5 0.2 2.6 76.4 74.5 1.9 2.4Subsidized loans 30.3 29.3 1.0 3.1 57.7 58.3 -0.6 2.8Unsubsidized loans 21.9 20.0 2.0 2.7 39.2 42.5 -3.2 2.8Federal Work-Study c 6.2 4.7 1.5 1.5 N/A N/AAverage financial assistance received per recipient ($) 7,124 6,585 8,368 8,112Sample size (total = 2,139) 451 447 622 619SOURCES: MDRC calculations from Lorain County Community College and Owens Community College financial aid and transcript data.NOTES: Distributions may not add to 100 percent because of rounding.A two-tailed t-test was applied to differences between research groups. Statistical significance levels are indicated as: *** = 1 percent, ** = 5 percent, * = 10percent.A two-tailed t-test was applied to differences of impacts between colleges. Statistical significance levels are indicated as: ††† = 1 percent; †† = 5 percent; † =10 percent.Italics indicate nonexperimental data. Significance tests are not calucluated for nonexperimental data; thus, the cells for “Difference” and “Standard Error”are empty.Estimates are adjusted by college and cohort.aDistributions may not add to 100 percent because categories are not mutually exclusive.bThis includes all grants and scholarships excluding the Pell Grant.
The Opening Doors DemonstrationAppendix Table E.9Social, Psychological, and Health Measures of Sample Members at BaselineLorain County Community College and Owens Community College ReportFull Program Control Standard EffectMeasure Sample Group Group Difference Error SizeGeneral social support a 3.22 3.24 3.21 0.03 0.02 0.05Perceived stress b 2.42 2.42 2.42 0.00 0.03 0.01K6 score for psychological distress c 5.18 5.29 5.08 0.21 0.18 0.05Indicator of high psychological distress d (%) 6.8 6.8 6.7 0.2 1.1 0.01Health status fair or poor (%) 7.0 7.6 6.4 1.1 1.1 0.05Body mass index (BMI) e 27.64 27.75 27.53 0.22 0.31 0.03Overweight or obese (BMI ≥ 25) f (%) 56.6 56.3 56.9 -0.6 2.2 -0.01Current smoker (%) 34.6 31.7 37.5 -5.7 *** 2.1 -0.12Sample size 2,133 1,070 1,063SOURCE: MDRC calculations from the Opening Doors Baseline Survey.NOTES: Rounding may cause slight discrepancies in sums and differences.A two-tailed t-test was applied to differences between research groups. Statistical significance levels areindicated as: *** = 1 percent; ** = 5 percent; * = 10 percent.Estimates are adjusted by cohort and college.a8-item scale about the presence of social support; response categories range from 1 = “strongly disagree” to 4= “strongly agree.” Items are averaged.b4-item scale about feelings of social stress; response categories range from 1 = “none of the time” to 5 = “allof the time.” Items are averaged.c6-item scale about nonspecific psychological distress; response categories range from 0 = “none of the time”to 4 = “all of the time.” Items are summed.dIndicator if the K6 Screening Scale measure of psychological distress exceeds 12.e BMI = weight in kilograms divided by height in meters squared.fStandard weight-status categories associated with BMI ranges for adults: underweight < 18.5; normal weight= 18.5 to 24.9; overweight = 25.0 to 29.9; and obese = 30 or greater.137
Program Control Difference Standard EffectOutcome Group Group (Impact) Error SizeOutlook and identityOptimism a 3.02 3.04 -0.02 0.03 -0.03Goal orientation b 3.55 3.54 0.01 0.02 0.03Life engagement c 3.51 3.51 0.00 0.02 0.01Self-esteem d 3.51 3.50 0.01 0.02 0.01Sense of self e 3.53 3.55 -0.02 0.02 -0.06Social support and civic engagementGeneral social support f 3.30 3.30 0.00 0.02 0.00Friends value education g 2.94 2.92 0.02 0.04 0.02Did unpaid volunteer orcommunity work in the past year (%) 30.4 31.0 -0.6 2.2 0.0Civic engagement h 0.43 0.43 0.00 0.01 0.01Antisocial behavior (%)The Opening Doors DemonstrationAppendix Table E.10Social and Psychological OutcomesLorain County Community College and Owens Community College ReportSpent time in reform schoolor prison in past year 4.0 4.9 -0.9 1.0 0.0Close friend spent time in reformschool or prison in past year 28.3 29.2 -1.0 2.1 0.0Sample size (total = 1,813) 910 903(continued)138
Appendix Table E.10 (continued)SOURCE: MDRC calculations from the Opening Doors 12-Month Survey.NOTES: Rounding may cause slight discrepancies in sums and differences.A two-tailed t-test was applied to differences between research groups. Statistical significancelevels are indicated as: *** = 1 percent; ** = 5 percent; * = 10 percent.Estimates are adjusted by cohort and college.a 6-item scale about feelings of optimism; response categories range from 1 = “strongly disagree” to4 = “strongly agree.” The six items are averaged.b 3-item scale about feeling focused on one’s goals; response categories range from 1 = “stronglydisagree” to 4 = “strongly agree.” The three items are averaged.c 6-item scale about feelings that life is purposeful and worthwhile; response categories range from1 = “strongly disagree” to 4 = “strongly agree.” The six items are averaged.d 4-item scale about feelings of self-esteem; response categories range from 1 = “strongly disagree”to 4 = “strongly agree.” The four items are averaged.e 13-item scale about feeling a strong sense of who one is, who one wants to be, and connections toothers; response categories range from 1 = “strongly disagree” to 4 = “strongly agree.” The 13 items areaveraged.f 8-item scale about the presence of social support; response categories range from 1 = “stronglydisagree” to 4 = “strongly agree.” The eight items are averaged.g 5-item scale about the importance of education to friends; response categories range from 1 = “notvery” to 4 = “extremely.” The five items are averaged.h 4-item scale of activities indicative of civic engagement (registered to vote; voted in presidentialelection; donated time or money to a political campaign; attended a political speech, rally, or march).Each item is coded as a 0 (“no”) or 1 (“yes”), and the four items are averaged.139
The Opening Doors DemonstrationAppendix Table E.11Health OutcomesLorain County Community College and Owens Community College ReportProgram Control Difference Standard EffectOutcome Group Group (Impact) Error SizePerceived stress a 2.20 2.17 0.02 0.04 0.03K6 score for psychological distress b 5.51 5.28 0.23 0.20 0.05Indicator of high psychologicaldistress (%) c 6.7 7.1 -0.4 1.2 -0.01Health status fair or poor (%) 17.5 15.1 2.3 1.7 0.06Body mass index d (BMI) 27.70 27.37 0.32 0.33 0.05Overweight or obese e (BMI ≥ 25) (%) 57.6 57.4 0.2 2.4 0.00Current smoker (%) 36.0 38.9 -2.9 2.3 -0.06Sample size (total = 1,813) 910 903SOURCE: MDRC calculations from the Opening Doors 12-Month Survey.NOTES: Rounding may cause slight discrepancies in sums and differences.A two-tailed t-test was applied to differences between research groups. Statistical significance levels areindicated as: *** = 1 percent; ** = 5 percent; * = 10 percent.Estimates are adjusted by cohort and college.a4-item scale about feelings of social stress; response categories range from 1 = “none of the time” to 5 =“all of the time.” Items are averaged.b6-item scale about nonspecific psychological distress; response categories range from 0 = “none of thetime” to 4 = “all of the time.” Items are summed.cIndicator if the K6 Screening Scale measure of psychological distress (see note b) exceeds 12.dBMI = weight in kilograms divided by height in meters squared.eStandard weight-status categories associated with BMI ranges for adults: underweight < 18.5; normalweight = 18.5 to 24.9; overweight = 25.0 to 29.9; and obese = 30 or greater.140
ReferencesAdelman, Clifford. 2004. Principal Indicators of Student Academic Histories in PostsecondaryEducation, 1972-2000. Washington, DC: U.S. Department of Education, Institute of EducationSciences.Austrian, Ziona. 2006. Manufacturing Brief: Trends in Manufacturing Industries in NortheastOhio. Cleveland: The Center for Economic Development, Maxine Goodman Levin Collegeof Urban Affairs, Cleveland State University.Web site: http://urban.csuohio.edu/economicdevelopment/reports/mb_oct06.pdfBrock, Thomas, and Allen LeBlanc. 2005. Promoting Student Success in Community College andBeyond. New York: MDRC.Campbell, Donald T., and Julian C. Stanley. 1963. Experimental and Quasi-Experimental Designsfor Research. Chicago: Rand McNally.Choy, Susan. 2002. Nontraditional Undergraduates. Washington, DC: U.S. Department of Education,National Center for Education Statistics.Community College Survey of Student Engagement (CCSSE). 2008. High Expectations and HighSupport. Austin, TX: The University of Texas at Austin, Community College LeadershipProgram.Cuseo, Joe. 2003. Academic Advisement and Student Retention: Empirical Connections andSystemic Interventions. Brevard, NC: Policy Center on the First Year of College.Duke, Amy-Ellen, and Julie Strawn. 2008. Overcoming Obstacles, Optimizing Opportunities: StatePolicies to Increase Postsecondary Attainment for Low-Skilled Adults. Boston: Jobs for the Future.Gardenhire-Crooks, Alissa, Herbert Collado, and Barbara Ray. 2006. A Whole ’Nother World:Students Navigating Community College. New York: MDRC.Grubb, W. Norton. 2001. ‘Getting into the World’: Guidance and Counseling in CommunityColleges. New York: Community College Research Center, Teachers College, Columbia University.Hoachlander, Gary, Anna Sikora, and Laura Horn. 2003. Community College Students: Goals,Academic Preparation, and Outcomes. Washington, DC: U.S. Department of Education, NationalCenter for Education Statistics.Horn, Laura, Rachel Berger, and C. Dennis Carroll. 2005. College Persistence on the Rise? Changesin 5-Year Degree Completion and Postsecondary Persistence Rates Between 1994 and 2000.Washington, DC: U.S. Department of Education, National Center for Education Statistics.Mathur, Anita, with Judy Reichle, Julie Strawn, and Chuck Wisely. 2004. From Jobs to Careers:How California Community Colleges Pay Off for Welfare Participants. Washington, DC, andSacramento, CA: Center for Law and Social Policy and California Community Colleges Chancellor’sOffice.141
Matus-Grossman, Lisa, and Susan Gooden, with Melissa Wavelet, Melisa Diaz, and ReishmaSeupersad. 2002. Opening Doors: Students’ Perspectives on Juggling Work, Family, and College.New York: MDRC.Provasnik, Stephen, and Michael Planty. 2008. Community Colleges: Special Supplement to the2008 Condition of Education. Washington, DC: U.S. Department of Education, National Centerfor Education Statistics.The Public Services Institute and the Joint Center for Policy Research, Lorain County CommunityCollege. 2004. Our People, Education, and Economy: The Changing Nature of Lorain County.Elyria, OH: Lorain County Community College.Purnell, Rogéair, and Susan Blank, with Susan Scrivener and Reishma Seupersad. 2004. SupportSuccess: Services That May Help Low-Income Students Succeed in Community College. NewYork: MDRC.Richburg-Hayes, Lashawn, Thomas Brock, Allen LeBlanc, Christina Paxson, Cecilia Elena Rouse,and Lisa Barrow. 2009. Rewarding Persistence: Effects of a Performance-Based ScholarshipProgram for Low-Income Parents. New York: MDRC.Scrivener, Susan, and Jenny Au. 2007. Enhancing Student Services at Lorain County CommunityCollege: Early Results from the Opening Doors Demonstration in Ohio. New York: MDRC.Scrivener, Susan, and Michael Pih. 2007. Enhancing Student Services at Owens CommunityCollege: Early Results from the Opening Doors Demonstration in Ohio. New York: MDRC.Scrivener, Susan, Dan Bloom, Allen LeBlanc, Christina Paxson, Cecilia Elena Rouse, and ColleenSommo, with Jenny Au, Jedediah J. Teres, and Susan Yeh. 2008. A Good Start: Two-Year Effectsof a Freshmen Learning Community Program at Kingsborough Community College. NewYork: MDRC.Scrivener, Susan, Colleen Sommo, and Herbert Collado. 2009. Getting Back on Track: Effects of aCommunity College Program for Probationary Students. New York: MDRC.Steingass, S. Jon, and Seth Sykes. 2008. Centralizing Advising to Improve Student Outcomes.Washington, DC: Association of American Colleges and Universities.Tinto, Vincent. 1993. Leaving College: Rethinking the Causes and Cures of Student Attrition. 2ndEdition. Chicago: University of Chicago Press.U.S. Bureau of Labor Statistics. 2008. “Worker Displacement, 2005-2007.” Economic NewsRelease. Displaced Workers Summary. USDL 08-1183 (August 26). Washington, DC: U.S.Bureau of Labor Statistics Division of Labor Force Statistics.Woodlief, Blaze, Catherine Thomas, and Garciela Orozco. 2003. California’s Gold: Claiming thePromise of Diversity in Our Colleges. Oakland, CA: California Tomorrow.142
EARLIER MDRC PUBLICATIONS ON OPENING DOORSGetting Back on TrackEffects of a Community College Program for Probationary Students2009. Susan Scrivener, Colleen Sommo, Herbert Collado.Rewarding PersistenceEffects of a Performance-Based Scholarship Program for Low-Income Parents2009. Lashawn Richburg-Hayes, Thomas Brock, Allen LeBlanc, Christina Paxson, CeciliaElena Rouse, Lisa Barrow.A Good StartTwo-Year Effects of a Freshmen Learning Community Program at Kingsborough CommunityCollege2008. Susan Scrivener, Dan Bloom, Allen LeBlanc, Christina Paxson, Cecilia Elena Rouse,Colleen Sommo, with Jenny Au, Jedediah J. Teres, Susan Yeh.Helping Low-Wage Workers Persist in Education ProgramsLessons from Research on Welfare Training Programs and Two Promising Community CollegeStrategies2008. Lashawn Richburg-Hayes.Enhancing Student Services at Lorain County Community CollegeEarly Results from the Opening Doors Demonstration in Ohio2007. Susan Scrivener, Jenny Au.Enhancing Student Services at Owens Community CollegeEarly Results from the Opening Doors Demonstration in Ohio2007. Susan Scrivener, Michael Pih.A Whole ’Nother WorldStudents Navigating Community College2006. Alissa Gardenhire-Crooks, Herbert Collado, Barbara Ray.Paying for PersistenceEarly Results of a Louisiana Scholarship Program for Low-Income Parents AttendingCommunity College2006. Thomas Brock, Lashawn Richburg-Hayes.Building Learning CommunitiesEarly Results from the Opening Doors Demonstration at Kingsborough Community College2005. Dan Bloom, Colleen Sommo.143
Promoting Student Success in Community College and BeyondThe Opening Doors Demonstration2005. Thomas Brock, Allen LeBlanc, with Casey MacGregor.Support SuccessServices That May Help Low-Income Students Succeed in Community College2004. Rogéair Purnell, Susan Blank, with Susan Scrivener, Reishma Seupersad.Changing CoursesInstructional Innovations That Help Low-Income Students Succeed in Community College2003. Richard Kazis, Marty Liebowitz.Money MattersHow Financial Aid Affects Nontraditional Students in Community Colleges2003. Victoria Choitz, Rebecca Widom.Supporting CalWORKs Students at California Community CollegesAn Exploratory Focus Group Study2003. Laura Nelson, Rogéair Purnell.Opening DoorsStudents’ Perspectives on Juggling Work, Family, and College2002. Lisa Matus-Grossman, Susan Gooden, with Melissa Wavelet, Melisa Diaz, ReishmaSeupersad.Welfare Reform and Community CollegesA Policy and Research Context2002. Thomas Brock, Lisa Matus-Grossman, Gayle Hamilton.Opening Doors to Earning CredentialsImpressions of Community College Access and Retention from Low-Wage Workers2001. Lisa Matus-Grossman, Susan Tinsley Gooden.Opening DoorsExpanding Educational Opportunities for Low-Income WorkersPublished with the National Governors Association Center for Best Practices2001. Susan Golonka, Lisa Matus-Grossman.____________________________NOTE: All MDRC publications are available for free download at www.mdrc.org.144
About MDRCMDRC is a nonprofit, nonpartisan social policy research organization dedicated to learningwhat works to improve the well-being of low-income people. Through its research and theactive communication of its findings, MDRC seeks to enhance the effectiveness of social andeducation policies and programs.Founded in 1974 and located in New York City and Oakland, California, MDRC is best knownfor mounting rigorous, large-scale, real-world tests of new and existing policies and programs.Its projects are a mix of demonstrations (field tests of promising new program approaches) andevaluations of ongoing government and community initiatives. MDRC’s staff bring an unusualcombination of research and organizational experience to their work, providing expertise on thelatest in qualitative and quantitative methods and on program design, development, implementation,and management. MDRC seeks to learn not just whether a program is effective but alsohow and why the program’s effects occur. In addition, it tries to place each project’s findings inthe broader context of related research — in order to build knowledge about what works acrossthe social and education policy fields. MDRC’s findings, lessons, and best practices are proactivelyshared with a broad audience in the policy and practitioner community as well as with thegeneral public and the media.Over the years, MDRC has brought its unique approach to an ever-growing range of policyareas and target populations. Once known primarily for evaluations of state welfare-to-workprograms, today MDRC is also studying public school reforms, employment programs for exoffendersand people with disabilities, and programs to help low-income students succeed incollege. MDRC’s projects are organized into five areas:• Promoting Family Well-Being and Child Development• Improving Public Education• Promoting Successful Transitions to Adulthood• Supporting Low-Wage Workers and Communities• Overcoming Barriers to EmploymentWorking in almost every state, all of the nation’s largest cities, and Canada and the UnitedKingdom, MDRC conducts its projects in partnership with national, state, and local governments,public school systems, community organizations, and numerous private philanthropies.