CATALOG - Schenectady County Community College
CATALOG - Schenectady County Community College
CATALOG - Schenectady County Community College

Create successful ePaper yourself
Turn your PDF publications into a flip-book with our unique Google optimized e-Paper software.
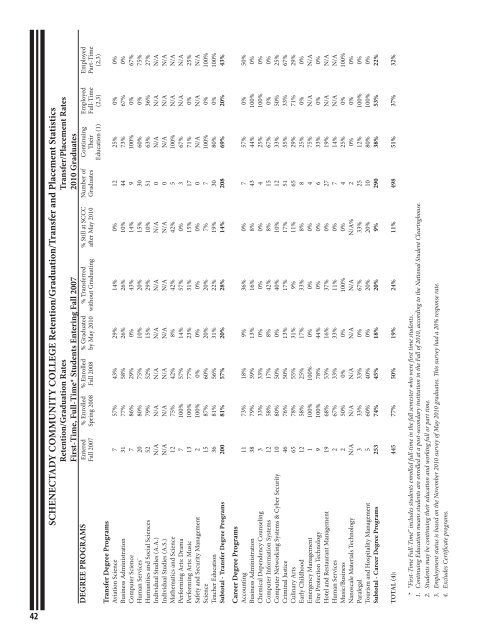
SCHENECTADY COMMUNITY COLLEGE Retention/Graduation/Transfer and Placement StatisticsRetention/Graduation Rates Transfer/Placement RatesFirst-Time, Full-Time* Students Entering Fall 2007 2010 GraduatesDEGREE PROGRAMS Entered % Enrolled % Enrolled % Graduated % Transferred % Still at SCCC Number of Continuing Employed EmployedFall 2007 Spring 2008 Fall 2008 by May 2010 without Graduating after May 2010 Graduates Their Full-Time Part-TimeEducation (1) (2,3) (2,3)Transfer Degree ProgramsAviation Science 7 57% 43% 29% 14% 0% 12 25% 0% 0%Business Administration 31 77% 58% 26% 26% 10% 44 73% 67% 0%Computer Science 7 86% 29% 0% 43% 14% 9 100% 0% 67%Human Services` 20 80% 75% 10% 20% 15% 30 60% 0% 75%Humanities and Social Sciences 52 79% 52% 15% 29% 10% 51 63% 36% 27%Individual Studies (A.A.) N/A N/A N/A N/A N/A N/A 0 N/A N/A N/AIndividual Studies (A.S.) N/A N/A N/A N/A N/A N/A 0 N/A N/A N/AMathematics and Science 12 75% 42% 8% 42% 42% 5 100% N/A N/APerforming Arts: Drama 7 100% 57% 14% 57% 0% 3 67% N/A N/APerforming Arts: Music 13 100% 77% 23% 31% 15% 17 71% 0% 25%Safety and Security Management 2 100% 0% 0% 0% 0% 0 N/A N/A N/AScience 15 87% 60% 20% 20% 7% 7 100% 0% 100%Teacher Education 36 81% 56% 31% 22% 19% 30 80% 0% 100%Subtotal - Transfer Degree Programs 200 81% 57% 20% 28% 14% 208 69% 20% 43%Career Degree ProgramsAccounting 11 73% 18% 9% 36% 0% 7 57% 0% 50%Business Administration 38 79% 39% 13% 16% 8% 43 44% 100% 0%Chemical Dependency Counseling 3 33% 33% 0% 0% 0% 4 25% 100% 0%Computer Information Systems 12 58% 17% 8% 42% 8% 15 67% 0% 0%Computer Networking Systems & Cyber Security 10 80% 50% 0% 40% 10% 12 33% 50% 25%Criminal Justice 46 76% 50% 13% 17% 17% 51 55% 33% 67%Culinary Arts 65 78% 55% 31% 9% 11% 65 29% 71% 29%Early Childhood 12 58% 25% 17% 33% 8% 8 25% 0% 0%Emergency Management 1 100% 100% 0% 0% 0% 4 75% N/A N/AFire Protection Technology 9 100% 78% 44% 0% 0% 6 33% 0% 0%Hotel and Restaurant Management 19 68% 53% 16% 37% 0% 27 19% N/A N/AHuman Services 2 67% 33% 33% 11% 0% 7 14% N/A N/AMusic/Business 2 50% 0% 0% 100% 0% 4 25% 0% 100%Nanoscale Materials Technology N/A N/A N/A N/A N/A N/A% 2 0% 0% 0%Paralegal 3 33% 33% 0% 67% 33% 25 12% 100% 0%Tourism and Hospitality Management 5 60% 40% 0% 20% 20% 10 80% 100% 0%Subtotal - Career Degree Programs 253 74% 45% 18% 20% 9% 290 38% 53% 22%TOTAL (4): 445 77% 50% 19% 24% 11% 498 51% 37% 32%* “First-Time Full-Time” includes students enrolled full-time in the fall semester who were first time students.1. Continuing Education means students are enrolled at a post-secondary institution in the Fall of 2010, according to the National Student Clearinghouse.2. Students may be continuing their education and working full or part time.3. Employment status is based on the November 2010 survey of May 2010 graduates. This survey had a 20% response rate.4. Excludes Certificate programs.42