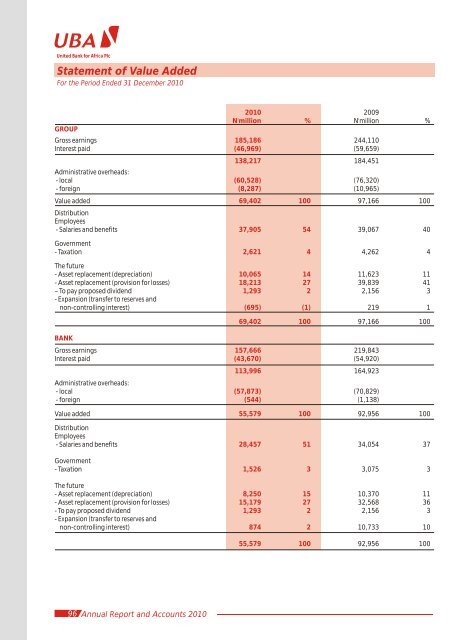
United Bank for Africa <strong>Plc</strong>Statement of Value AddedFor the Period Ended 31 December <strong>2010</strong>GROUP<strong>2010</strong>N'million %Gross earnings 185,186244,110Interest paid (46,969)(59,659)138,2172009N'million %184,451Administrative overheads:- local (60,528)(76,320)- foreign (8,287)(10,965)Value added 69,402 10097,166 100DistributionEmployees- Salaries <strong>and</strong> benefits 37,905 5439,067 40Government- Taxation 2,621 44,262 4The future- Asset replacement (depreciation) 10,065 1411,623 11- Asset replacement (provision for losses) 18,213 2739,839 41– To pay proposed dividend 1,293 22,156 3- Expansion (transfer to reserves <strong>and</strong>non-controlling interest) (695) (1)219 169,402 10097,166 100BANKGross earnings 157,666219,843Interest paid (43,670)(54,920)113,996164,923Administrative overheads:- local (57,873)(70,829)- foreign (544)(1,138)Value added 55,579 10092,956 100DistributionEmployees- Salaries <strong>and</strong> benefits 28,457 5134,054 37Government- Taxation 1,526 33,075 3The future- Asset replacement (depreciation) 8,250 1510,370 11- Asset replacement (provision for losses) 15,179 2732,568 36- To pay proposed dividend 1,293 22,156 3- Expansion (transfer to reserves <strong>and</strong>non-controlling interest) 874 210,733 1055,579 10092,956 10096 <strong>Annual</strong> <strong>Report</strong> <strong>and</strong> Accounts <strong>2010</strong>
United Bank for Africa <strong>Plc</strong>Group Five - Year <strong>Financial</strong> SummaryFor the Period Ended 31 December <strong>2010</strong>31 December<strong>2010</strong>N'million31 December 2009 2008 2007 2006N'million N'million N'million N'millionAssets:Cash <strong>and</strong> balances with central banks 68,056 68,225 120,088 64,183 58,466Treasury bills <strong>and</strong> other eligible bills 123,455 42,035 174,005 100,589 160,975Due from other banks 302,272 470,195 654,869 506,132 413,028Loans <strong>and</strong> advances to customers 628,811 606,616 431,410 320,406 109,896Investment securities 384,453 188,407 126,895 105,038 72,942Investment in subsidiaries –– – – –Investment in associates 9,1799,261 588 21 21Investment in joint venture 939245 900 – –Goodwill 3,4792,983 – – –Deferred tax assetsInvestment properties3,341–269 589 – –Other assets 28,511 87,003 102,436 44,926 35,618Property <strong>and</strong> equipment 65,200 73,042 61,553 49,747 33,1911,617,6961,548,281 1,673,333 1,191,042 884,137Finance by:Ordinary share capital 12,934 10,778 8,622 5,748 3,530Share premium account 111,489 113,645 114,036 119,066 23,209Reserves 52,106 57,090 70,802 42,905 21,796Non-controlling interest 2,8975,316 1,821 359 300Customers' deposits 1,267,171 1,245,650 1,333,289 905,806 762,574Due to other banks 7,456 15,807 32,000 – –Liability on investment contracts 33,090 22,138 40,558 66,013 13,561Borrowings 82,144 14,760 – 1,135 1,135Current income tax 2,7943,385 5,606 5,149 1,644Other liabilities 43,599 58,187 65,564 43,825 47,784Deferred income tax liabilities 302 993 994 1,502Dividend payable 20 42 42 7,102Retirement benefit obligations 1,9861,503 – – –Total equity <strong>and</strong> liabilities 1,617,696 1,548,281 1,673,333 1,191,042 884,137Off balance sheet engagements<strong>and</strong> contingencies 654,360 689,479 616,734 451,110 167,18412 months to 15 months to 12 months to 12 months to 18 months to31 December 31 December <strong>2010</strong>2009 2008 2007 2006N'million N'million N'million N'million N'millionGross earnings 185,186 244,110 169,506 109,512 90,447Net operating income 138,217 183,235 128,151 80,808 63,493Operating expenses (104,119) (128,404) (68,720) (47,581) (45,111)Provision for losses (18,213) (39,839) (2,616) (3,702) (5,571)Profit before taxation <strong>and</strong>exceptional items 15,885 13,662 56,815 29,525 12,811Exceptional items (12,666) (7,025) (8,786) (4,161) –Taxation (2,621) (4,262) (7,204) (3,923) (1,261)Profit after taxation <strong>and</strong> exceptional items 5982,375 40,825 21,441 11,550Non-controlling interest 70(262) 414 99 –Profit attributable to shareholders 6682,113 41,239 21,540 11,550Earnings per share(basic) - kobo 310 314 261 187Basic earnings per share is based on the weighted average number of ordinary shares of 50 kobo each in issue during the respectiveperiods.<strong>Annual</strong> <strong>Report</strong> <strong>and</strong> Accounts <strong>2010</strong> 97