- Page 1 and 2:
THE EGS5 CODE SYSTEM 1Hideo Hirayam
- Page 6 and 7:
4.1 UCCYL - Cylinder-Slab Geometry
- Page 8 and 9:
E CONTENTS OF THE EGS5 DISTRIBUTION
- Page 10 and 11:
2.17 Convergence of energy depositi
- Page 12 and 13:
List of Tables2.1 Symbols used in E
- Page 14 and 15:
C.2 Goudsmit-Saunderson-related sub
- Page 16:
With the release of the EGS4 versio
- Page 19 and 20:
“shower book”.For various reaso
- Page 21 and 22:
1.2.2 EGS1About this time Nelson be
- Page 23 and 24:
MSCAT.These versions of EGS, PEGS,
- Page 25 and 26:
ten for energies less than 100 MeV
- Page 27 and 28:
- Molière multiple scattering (i.e
- Page 29 and 30:
EGS5. The primary advantages of thi
- Page 31 and 32:
ICRU37-compliant using the NIST dat
- Page 33 and 34:
high Z materials. Del Guerra et al.
- Page 35 and 36:
One of these six cross sections is
- Page 37 and 38:
at low energies. The latter, couple
- Page 39 and 40:
If E 1 and E 2 are expressions invo
- Page 41 and 42:
The result of this algorithm is tha
- Page 43 and 44:
2.4 Particle Transport SimulationTh
- Page 45 and 46:
from appropriate distribution funct
- Page 47 and 48:
parameters which may be needed. The
- Page 49 and 50:
arrived at their values in a very m
- Page 51 and 52:
Math FORTRAN ProgramTable 2.1 (cont
- Page 53 and 54:
Figure 2.2: Feynman diagrams for br
- Page 55 and 56:
defined byδ ij = 1 if i = j,0 othe
- Page 57 and 58:
Davies, Bethe and Maximon[49] (e.g.
- Page 59 and 60:
cross section given in Equation 2.4
- Page 61 and 62:
and use this as the variable to be
- Page 63 and 64:
we haveNow defineδ ′ = ∆ C ∆
- Page 65 and 66:
This agrees with formula (10) of Bu
- Page 67 and 68:
That is, using Equations 2.122 and
- Page 69 and 70:
d˘Σ P air, Run−timedE=[23 − 1
- Page 71 and 72:
Angular distribution formulasThe fo
- Page 73 and 74:
at either x = 0, x = (πE 0 ) 2 (i.
- Page 75 and 76:
The following table, derived from t
- Page 77 and 78:
Figure 2.3: Feynman diagrams for tw
- Page 79 and 80:
whereX 0 = radiation length (cm),n
- Page 81 and 82:
whereα ′ 1 =α ′ 2 =k 0′k 0
- Page 83 and 84:
+ 1 E 2′ − 1 E 1′− C 2 ln E
- Page 85 and 86:
PEGS functions BHABDM, BHABRM, and
- Page 87 and 88:
To find the limits of E, we first c
- Page 89 and 90:
Figure 2.5: Feynman diagram for sin
- Page 91 and 92:
Ī adj = average adjusted mean ioni
- Page 93 and 94:
Table 2.2 (cont.)Z Symbol Atomic De
- Page 95 and 96:
Table 2.3 (cont.)LABEL a m s x 0 x
- Page 97 and 98:
(c) If 10.5 ≤ −C < 11.0 then x
- Page 99 and 100:
obtain the real scattering angle. E
- Page 101 and 102:
ρ = material mass density (g/cm 3
- Page 103 and 104:
Hence,so thatln [1.13 + 3.76(αZ i
- Page 105 and 106:
g 3 (θ) =θ4 ()λf (0) (θ) + f (1
- Page 107 and 108:
Actually, b = 0 does not correspond
- Page 109 and 110:
Assume that an electron starts off
- Page 111 and 112:
At small path lengths t, a very lar
- Page 113 and 114:
xFinalDirectionφΘ∆xtInitialDire
- Page 115 and 116:
shown that this version of the rand
- Page 117 and 118:
and as we noted earlier, they are d
- Page 119 and 120:
FinalDirectionxEnergy HingesφΘt(
- Page 121 and 122:
Transport Steps,∆ E = E x ESTEPEt
- Page 123 and 124:
tranport step 1DEINITIAL1 DERESID1t
- Page 125 and 126:
= ∆E( ∣ ∣∣∣ dE−1 ∣ )
- Page 127 and 128:
Since the CSDA range is uniquely de
- Page 129 and 130:
short steps accurate, but slowstep
- Page 131 and 132:
Table 2.4: Materials used in refere
- Page 133 and 134:
Average Lateral Displacement (cm)0.
- Page 135 and 136:
100 MeV Electrons0.010.001LiCLWAlST
- Page 137 and 138:
actions involving photons with ener
- Page 139 and 140:
Cu 40 keVCounts (/keV/sr/source)10
- Page 141 and 142:
Table 2.6: Data sources for general
- Page 143 and 144:
2.16.2 Photoelectron Angular Distri
- Page 145 and 146:
where r 0 is the classical electron
- Page 147 and 148:
second term on the right-hand side
- Page 149 and 150:
ZθkYOφe0Xk0Figure 2.23: Photon sc
- Page 151 and 152:
Note the similarities and differenc
- Page 153 and 154:
XZωk0Oe0YFigure 2.25: Direction of
- Page 155 and 156:
W = Atomic, molecular and mixture w
- Page 157 and 158:
In order to use EGS5 to answer the
- Page 159 and 160:
write(6,100)100 FORMAT(’ PEGS5-ca
- Page 161 and 162:
! plate is 1 mm thick!-------------
- Page 163 and 164:
implicit noneinclude ’include/egs
- Page 165 and 166:
0.989 MeV kinetic energyBrem photon
- Page 167 and 168:
! locally (in fact EDEP = particles
- Page 169 and 170:
inmax=max(binmax,ebin(j))end dowrit
- Page 171 and 172:
0.40 0.0058 *0.60 0.0054 *0.80 0.00
- Page 173 and 174:
!----------------------------------
- Page 175 and 176:
endifif(loop.lt.3) thenwrite(6,120)
- Page 177 and 178:
180 FORMAT(/’ Knock-on electrons
- Page 179 and 180:
common/score/escore(3), iscore(3)re
- Page 181 and 182:
Brem photons can be created and any
- Page 183 and 184:
in any combination of 31 well speci
- Page 185 and 186:
end doend do! nmed and dunit defaul
- Page 187 and 188:
! ------------------------------clo
- Page 189 and 190:
if (iarg.eq.17) then! A Compton sca
- Page 191 and 192:
! the general purpose geometry subr
- Page 193 and 194:
eturnend!--------------------------
- Page 195 and 196:
open(UNIT= 6,FILE=’egs5job.out’
- Page 197 and 198:
write(6,130)130 format(/’ Start t
- Page 199 and 200:
icol=* int(dlog10(ebin(j)*10000.0/f
- Page 201 and 202:
0.0300 0.0000*0.0320 0.0001*0.0340
- Page 203 and 204:
0.0780 0.0014 *0.0800 0.0012 *0.082
- Page 205 and 206:
The main purpose of this section, h
- Page 207 and 208:
4.1.3 Leading Particle BiasingThe s
- Page 209 and 210:
• Sum the weighted energy deposit
- Page 211 and 212:
4z6Vac115Pb65Air749 1012AirAir8Vac
- Page 213 and 214:
Figure 4.3: UCBEND simulation at 3.
- Page 215 and 216:
necessary geometry input. The follo
- Page 217 and 218:
Appendix AEGS5 FLOW DIAGRAMSHideo H
- Page 219 and 220:
subroutineannihVersion051219-1435ia
- Page 221 and 222:
¡eq1anormr = 1./sqrt(anorm2)sineta
- Page 223 and 224:
1br = max(br,0.D0)ekse2 = br*ekines
- Page 225 and 226:
12 3br = br*pesg = eie*bryesesg.lt.
- Page 227 and 228:
¤ne¤nesubroutinecollis(lelec,irl,
- Page 229 and 230:
¦ne¦necallausgab(iarg)6iq(np).eq.
- Page 231 and 232:
subroutinecomptVersion051219-1435ic
- Page 233 and 234:
3456icprof(medium).eq.3noyescallran
- Page 235 and 236:
subroutinecounters_outVersion051227
- Page 237 and 238:
1234567noii.ne.jjyesnoledgb(ii,medi
- Page 239 and 240:
©ne1 2 3neispl = (2*neispl + 1)/3f
- Page 241 and 242:
subroutineelectr(ircode)ielectr = i
- Page 243 and 244:
7 8 9 10 11 12 13detot = e(np)-ecut
- Page 245 and 246:
2324 25 26 27 282930ustep.gt.dnear(
- Page 247 and 248:
4142 43 44 45 4647 48 49ecut(irnew)
- Page 249 and 250:
5859 60 61 6263 64tmscat.eq.0.0noye
- Page 251 and 252:
73 7475 76noedep.lt.e(np)yescallran
- Page 253 and 254:
subroutinehardx(charge,kEnergy,keIn
- Page 255 and 256:
1 2 3 4 5iz = izziz.eq.0noxsi = zer
- Page 257 and 258:
13 14 15 16 17sint.ne.0.yesrdev = m
- Page 259 and 260:
19im=1im=im+1im >nmednoyesnoiprofm(
- Page 261 and 262:
2223write(kmpo,1610)read(kmpi,1260)
- Page 263 and 264:
26 27 28iprofm(im).ne.1noyeswrite(6
- Page 265 and 266:
30 31 32 33 34esig0(i,im) = esig0(i
- Page 267 and 268:
36 37 38noiedgfl(ii).ne.0.or.iauger
- Page 269 and 270:
nokaug.eq.6calllshell(3)kaug.eq.7ka
- Page 271 and 272:
subroutinekxrayVersion051219-1435ik
- Page 273 and 274:
123dfl3aug(5,iz).eq.0.nonauger = na
- Page 275 and 276:
12 3 4rnnow.le.omegal2(iz) + f23(iz
- Page 277 and 278:
1 2dflx3(6,iz).eq.0.nonxray=nxray+1
- Page 279 and 280:
1impacr(ir(np)).eq.1.and.iedgfl(ir(
- Page 281 and 282:
12fject = (ktot - k1grd(iprt,ik1))
- Page 283 and 284:
56789thr = 1./eta"Central correctio
- Page 285 and 286:
1 2 3delta = delcm(medium)*del"Reje
- Page 287 and 288:
89101112galpha.ge.0.0yesnoximid = 0
- Page 289 and 290:
subroutinephotoVersion051219-1435"C
- Page 291 and 292:
4 5 6 7 8rnnow.le.pbran(i)noyesiz =
- Page 293 and 294:
121314beta = sqrt((eelec - RM)*(eel
- Page 295 and 296:
subroutinephotonVersion051219-1435i
- Page 297 and 298:
678910idisc.gt.0yesnoedep = 0.iarg
- Page 299 and 300:
1718192021iausfl(iarg+1)ne0nocallpa
- Page 301 and 302:
2728iausfl(iarg+1)ne0noircode = 2np
- Page 303 and 304:
subroutinerk1Version060313-0945open
- Page 305 and 306:
4 5 6j=1j=j+1j>neke-1noyesj.eq.1noj
- Page 307 and 308:
18 19 20 21 22 23elkeold = elkek1ol
- Page 309 and 310:
1 2"end of file; go to 13"read(17,*
- Page 311 and 312:
4 5"go to 30"noabs(k1mine-k1grd(1,1
- Page 313 and 314:
7 8read(17,'(72a1)') bufferread(17,
- Page 315 and 316:
subroutine shower(iqi,ei,xi,yi,zi,u
- Page 317 and 318:
subroutineuphi(ientry,lvl)Version05
- Page 319 and 320:
subroutinerandomset(rndum)Version05
- Page 321 and 322:
subroutinerluxinitVersion051219-143
- Page 323 and 324:
1i=1i=i+1i>24noyesseeds(i) = real(i
- Page 325 and 326:
subroutinerluxinVersion051219-1435w
- Page 327 and 328:
Appendix BEGS5 USER MANUALHideo Hir
- Page 329 and 330:
Table B.1: Variable descriptions fo
- Page 331 and 332:
Table B.2: Variable descriptions fo
- Page 333 and 334:
Table B.5: Variable descriptions fo
- Page 335 and 336:
Table B.8: Variable descriptions fo
- Page 337 and 338:
Table B.12: Variable descriptions f
- Page 339 and 340:
Optional parameter modificationsThe
- Page 341 and 342:
the call to PEGS5 may be skipped if
- Page 343 and 344:
egions. Execution of EGS5 is termin
- Page 345 and 346:
of the transport in the walls of el
- Page 347 and 348:
call rluxinitafter specifying LUXLE
- Page 349 and 350:
END OF FILE ON UNIT 12PROGRAM STOPP
- Page 351 and 352:
do i=1,ncasesuf(1)=ufivf(1)=vfiwf(1
- Page 353 and 354: crossed, then USTEP should be set t
- Page 355 and 356: subroutine howfarimplicit noneinclu
- Page 357 and 358: Table B.18: IARG values program sta
- Page 359 and 360: As an example of how to write an AU
- Page 361 and 362: !**********************************
- Page 363 and 364: nreg=3do i=2,nregecut(i)=100.0pcut(
- Page 365 and 366: nlines=0nwrite=15!-----------------
- Page 367 and 368: if (nlines.lt.nwrite) thenwrite(6,1
- Page 369 and 370: Appendix CPEGS USER MANUALHideo Hir
- Page 371 and 372: is entered. On each pass through th
- Page 373 and 374: (from previous figure)(to previous
- Page 375 and 376: (from previous figure)||+ ---------
- Page 377 and 378: +------+|BREMTR|+------+|V+------+|
- Page 379 and 380: +------+|PAIRTR|+------+|V+------+|
- Page 381 and 382: NameDCSLOADDCSSTORDCSTABELASTINOELI
- Page 383 and 384: NameAFFACTAINTPALKEALKEIALINALINIAD
- Page 385 and 386: Table C.5: Functions in PEGS, part
- Page 387 and 388: +------+ +------+ +------+ +------+
- Page 389 and 390: Table C.8: ELEM option input data l
- Page 391 and 392: Table C.10: MIXT option input data
- Page 393 and 394: Table C.12: PWLF option input data
- Page 395 and 396: Table C.17: PLTN option input data
- Page 397 and 398: ICPROF is set to 3, the user must c
- Page 399 and 400: ColumnLine 123456789112345678921234
- Page 401 and 402: interiors of the intervals. If FEXA
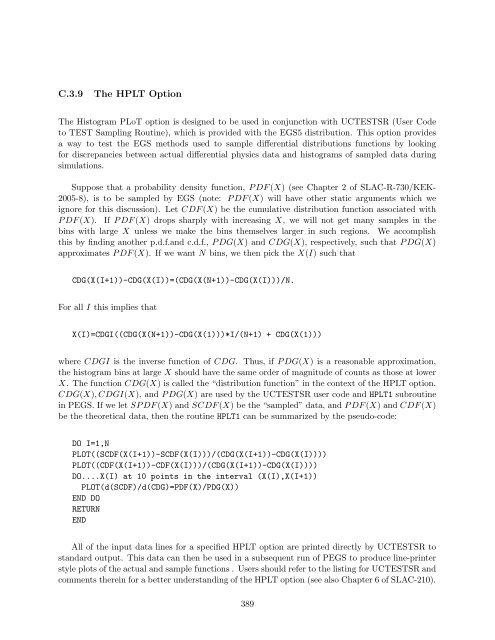
- Page 403: C.3.6The TEST OptionThe TEST option
- Page 407 and 408: Appendix DEGS5 INSTALLATION GUIDEHi
- Page 409 and 410: egs5 directory (preferably using th
- Page 411 and 412: 6. The user is then asked to key-in
- Page 413 and 414: * User code tutor1.f has been compi
- Page 415 and 416: Appendix ECONTENTS OF THE EGS5DISTR
- Page 417 and 418: All of the actual FORTRAN source co
- Page 419 and 420: aprime.data Data for empirical brem
- Page 421 and 422: ismuth krypton silverboron lanthanu
- Page 423 and 424: The tutorial problems and advanced
- Page 425 and 426: Bibliography[1] R. G. Alsmiller Jr.
- Page 427 and 428: [28] A. F. Bielajew. HOWFAR and HOW
- Page 429 and 430: [59] K. Flöttmann. Investigations
- Page 431 and 432: [92] H. Kolbenstvedt. Simple theory
- Page 433 and 434: [123] Y. Namito, H. Hirayama, A. Ta
- Page 435 and 436: [156] Y. A. Shreider, editor. The M
- Page 437 and 438: Index“shower book”, 37AE, 28, 3
- Page 439 and 440: Klein-Nishina formula, 62Landau dis