

Carbon-to-chlorophyll ratio and growth rate of phytoplankton in the sea
Carbon-to-chlorophyll ratio and growth rate of phytoplankton in the sea
Carbon-to-chlorophyll ratio and growth rate of phytoplankton in the sea

Create successful ePaper yourself
Turn your PDF publications into a flip-book with our unique Google optimized e-Paper software.
Sathyendranath et al.: <strong>Carbon</strong>-<strong>to</strong>-<strong>chlorophyll</strong> <strong>ratio</strong> <strong>and</strong> <strong>growth</strong> <strong>rate</strong> <strong>of</strong> phy<strong>to</strong>plank<strong>to</strong>n75Table 1. Details <strong>of</strong> <strong>the</strong> 16 shelf <strong>and</strong> open-ocean cruises (<strong>of</strong>fshore data)where samples were collected for <strong>chlorophyll</strong> <strong>and</strong> carbon measurements,show<strong>in</strong>g geographic area, sampl<strong>in</strong>g dates <strong>and</strong> <strong>to</strong>tal number <strong>of</strong> samples(n) collectedon each cruiseArea Dates nArabian Sea (Tyro Cruise) 13 Jan–4 Feb 1993 17Arabian Sea (Arabesque 1 Cruise) 28 Aug–30 Sep 1994 110Arabian Sea (Arabesque 2 Cruise) 17 Nov–15 Dec 1994 95Labrador Sea (JGOFS Cruise) 15 May–30 May 1996 45Labrador Sea (JGOFS Cruise) 24 Oct–17 Nov 1996 28Scotian Shelf (Hudson Cruise) 18 Apr–28 Apr 1997 16Labrador Sea (JGOFS Cruise) 12 May–9 Jun 1997 50Scotian Shelf (Hudson Cruise) 8 Apr–21 Apr 1998 26Scotian Shelf (Hudson Cruise) 3 Oct–20 Oct 1998 30Scotian Shelf (Hudson Cruise) 9 Apr–17 Apr 1999 39Scotian Shelf (Hudson Cruise) 24 Oct–12 Nov 1999 37Scotian Shelf (Hudson Cruise) 9 Apr–22 Apr 2000 49Scotian Shelf (Hudson, Cruise) 1 Oct–15 Oct 2000 98Scotian Shelf (Hudson, Cruise) 2 May–16 May 2001 105Labrador Sea (Hudson Cruise) 31 May–13 Jun 2001 42Scotian Shelf (Hudson Cruise) 24 Oct–7 Nov 2001 60Total 847prymnesiophytes, Prochlorococcus, o<strong>the</strong>r cyanobacteria(e.g. Synechococcus) <strong>and</strong> green algae. The pigmentcriteria used <strong>to</strong> identify <strong>the</strong>se algal groups are shown<strong>in</strong> Table 2.S<strong>in</strong>ce, for <strong>the</strong> same particulate carbon samples, correspond<strong>in</strong>gchl a estimates were available us<strong>in</strong>g both<strong>the</strong> Turner fluorometric method (B F ) <strong>and</strong> <strong>the</strong> HPLCmethod (B H ), <strong>the</strong> relationships between particulatecarbon <strong>and</strong> chl a were explored sepa<strong>rate</strong>ly for <strong>the</strong> 2<strong>chlorophyll</strong> estimates, especially because some systematicdifferences were <strong>of</strong>ten encountered between<strong>the</strong> chl a values estimated by <strong>the</strong> 2 methods (e.g. r 2 =0.89, slope = 1.39, n = 814, for l<strong>in</strong>ear regression <strong>of</strong>HPLC <strong>chlorophyll</strong> <strong>and</strong> Turner fluorometric <strong>chlorophyll</strong>for our <strong>of</strong>fshore data set). Both particulate carbon <strong>and</strong>chl a data were log-transformed <strong>to</strong> l<strong>in</strong>earise <strong>the</strong> relationship<strong>and</strong> <strong>to</strong> reduce <strong>the</strong> weight <strong>of</strong> <strong>the</strong> stations withhigh values <strong>of</strong> particulate carbon <strong>and</strong> chl a <strong>in</strong> <strong>the</strong>regression analysis (see also Legendre & Michaud1999). Ord<strong>in</strong>ary least-squares regression analysis wascarried out with particulate carbon as <strong>the</strong> dependentvariable <strong>and</strong> B F or B H as <strong>the</strong> <strong>in</strong>dependent variable. Ifwe represent <strong>to</strong>tal particulate carbon by C T , <strong>the</strong>n <strong>the</strong>fitted equations have <strong>the</strong> form: log (C T ) = log m + p (logB i ), where i = H or F, <strong>and</strong> log m <strong>and</strong> p are <strong>the</strong> fittedparameters. The results can <strong>the</strong>n be expressed as:CpT = mB iTokyo Bay data: Particulate carbon <strong>and</strong> pigmentdata were collected at 3 stations <strong>in</strong> Tokyo Bay everymonth from August 1997 until July 2000. Water sampleswere collected, us<strong>in</strong>g 5 l Van-Dorn bottles, at 7 <strong>to</strong>8 depths throughout <strong>the</strong> water column (maximum(4)depth 30 m). Particulate carbon, fluorometricchl a concent<strong>ratio</strong>n <strong>and</strong> HPLC pigment compositionwere measured at each sampl<strong>in</strong>gdepth as described above (HPLC sampleswere collected with<strong>in</strong> <strong>the</strong> <strong>to</strong>p 10 m only). In<strong>the</strong> <strong>of</strong>fshore dataset, HPLC pigments wereused <strong>to</strong> identify samples dom<strong>in</strong>ated by any 1<strong>of</strong> 6 phy<strong>to</strong>plank<strong>to</strong>n functional types. Itemerged that, when our criteria wereapplied <strong>to</strong> identify algal groups, this set <strong>of</strong>observations <strong>in</strong>cluded samples dom<strong>in</strong>atedby dia<strong>to</strong>ms <strong>and</strong> d<strong>in</strong><strong>of</strong>lagellates, but none <strong>of</strong><strong>the</strong> o<strong>the</strong>r types (Table 2). Aga<strong>in</strong>, <strong>the</strong> relationshipsbetween carbon <strong>and</strong> chl a wereestimated for Turner fluorometric chl a <strong>and</strong>HPLC chl a sepa<strong>rate</strong>ly.Satellite data: Local-area coverage Sea-WiFS data collected dur<strong>in</strong>g <strong>the</strong> period from1997 <strong>to</strong> 2006 at <strong>the</strong> Bedford Institute <strong>of</strong>Oceanography were used <strong>to</strong> gene<strong>rate</strong> bimonthlycomposite maps <strong>of</strong> <strong>chlorophyll</strong>us<strong>in</strong>g <strong>the</strong> NASA OC4 algorithm (O’Reilly etal. 2000) <strong>and</strong> SeaDAS s<strong>of</strong>tware. The composites for <strong>the</strong>second half <strong>of</strong> May for all years were <strong>the</strong>n comb<strong>in</strong>ed <strong>to</strong>create a clima<strong>to</strong>logical <strong>chlorophyll</strong> map for this time<strong>in</strong>terval, which was <strong>the</strong>n used <strong>to</strong> illust<strong>rate</strong> how <strong>the</strong>results established from <strong>the</strong> field data could be used <strong>to</strong>arrive at first-order estimates on <strong>the</strong> distribution <strong>of</strong> particulatecarbon, phy<strong>to</strong>plank<strong>to</strong>n carbon, carbon-<strong>to</strong><strong>chlorophyll</strong><strong>ratio</strong>s (χ) <strong>and</strong> carbon-based <strong>growth</strong> <strong>rate</strong>sfor phy<strong>to</strong>plank<strong>to</strong>n.Quantile regression: For a given observation <strong>of</strong> particulatecarbon <strong>in</strong> <strong>the</strong> ocean, <strong>the</strong> result may be partitioned<strong>in</strong><strong>to</strong> a portion that corresponds <strong>to</strong> <strong>the</strong> liv<strong>in</strong>gorganic carbon conta<strong>in</strong>ed <strong>in</strong> phy<strong>to</strong>plank<strong>to</strong>n <strong>and</strong> aresidual that <strong>in</strong>cludes contributions from heterotrophs<strong>and</strong> various sources <strong>of</strong> detritus. Addition <strong>of</strong> any <strong>of</strong><strong>the</strong>se components o<strong>the</strong>r than phy<strong>to</strong>plank<strong>to</strong>n would<strong>in</strong>crease <strong>to</strong>tal particulate carbon without <strong>in</strong>creas<strong>in</strong>g<strong>chlorophyll</strong>. Therefore, we assumed that, at any given<strong>chlorophyll</strong> concent<strong>ratio</strong>n, <strong>the</strong> lowest particulate carboncontent observed represents <strong>the</strong> phy<strong>to</strong>plank<strong>to</strong>ncarbon associated with that <strong>chlorophyll</strong> concent<strong>ratio</strong>n.Given such data over a range <strong>of</strong> <strong>chlorophyll</strong> concent<strong>ratio</strong>ns,we sought <strong>the</strong> relationship between <strong>the</strong> phy<strong>to</strong>plank<strong>to</strong>ncarbon concent<strong>ratio</strong>n (as opposed <strong>to</strong> <strong>to</strong>talparticulate carbon) <strong>and</strong> <strong>the</strong> <strong>chlorophyll</strong> concent<strong>ratio</strong>n.This relationship can be represented as a l<strong>in</strong>e form<strong>in</strong>ga lower envelope <strong>to</strong> <strong>the</strong> values <strong>of</strong> <strong>to</strong>tal particulate carbonplotted as a function <strong>of</strong> <strong>chlorophyll</strong> concent<strong>ratio</strong>n.The appropriate method <strong>to</strong> f<strong>in</strong>d this relation is quantileregression (Koenker & Bassett 1978). At <strong>the</strong> same time,we want <strong>to</strong> exclude any outliers that, through measurementerror, are biased <strong>to</strong>o low <strong>to</strong> belong <strong>to</strong> <strong>the</strong>parent distribution.
76Mar Ecol Prog Ser 383: 73–84, 2009Table 2. Criteria used <strong>to</strong> omit samples from <strong>the</strong> database <strong>in</strong> order<strong>to</strong> identify various phy<strong>to</strong>plank<strong>to</strong>n types. These criteria requirethat <strong>the</strong> concent<strong>ratio</strong>ns <strong>of</strong> pigments diagnostic for a particulartype <strong>of</strong> phy<strong>to</strong>plank<strong>to</strong>n should be high relative <strong>to</strong> <strong>the</strong>concent<strong>ratio</strong>n <strong>of</strong> <strong>chlorophyll</strong> a, while, at <strong>the</strong> same time, <strong>the</strong>relative concent<strong>ratio</strong>ns <strong>of</strong> diagnostic pigments for o<strong>the</strong>r types<strong>of</strong> phy<strong>to</strong>plank<strong>to</strong>n should be low. Collectively, <strong>the</strong> criteriaidentify those samples <strong>in</strong> which a s<strong>in</strong>gle phy<strong>to</strong>plank<strong>to</strong>ntype may be assumed <strong>to</strong> dom<strong>in</strong>ate, based on <strong>the</strong> chemotaxonomicsignature. Chl: <strong>chlorophyll</strong>; Hex: 19’-hexanoyloxyfucoxanth<strong>in</strong>;But: 19’-butanoyloxyfucoxanth<strong>in</strong>Phy<strong>to</strong>plank<strong>to</strong>n typeCriteria for omitt<strong>in</strong>g samplesnot belong<strong>in</strong>g <strong>to</strong> a typePrymnesiophytes Chl c 3 /Chl a < 0.035% Div<strong>in</strong>yl Chl a <strong>and</strong> b >10%Zeaxanth<strong>in</strong>/Chl a > 0.01Perid<strong>in</strong><strong>in</strong>/Chl a > 0.1Alloxanth<strong>in</strong>/Chl a > 0.01Chl b/Chl a > 0.1Hex/Chl a <strong>and</strong> But/Chl a < 0.05Prochlorococcus sp. % Div<strong>in</strong>yl Chl a <strong>and</strong> b < 50%Fucoxanth<strong>in</strong>/Chl a > 0.01Chl c 3 /Chl a > 0.01Hex/Chl a > 0.2Dia<strong>to</strong>ms Fucoxanth<strong>in</strong>/Chl a < 0.4Chl c 1, 2 /Chl a < 0.1Chl c 3 /Chl a > 0.01Zeaxanth<strong>in</strong>/Chl a > 0.01Hex/Chl a > 0.1Chl b/Chl a > 0.1Diad<strong>in</strong>oxanth<strong>in</strong>/Chl a < 0.01Cyanobacteria Zeaxanth<strong>in</strong>/Chl a < 0.1% Div<strong>in</strong>yl Chl a > 20%Fucoxanth<strong>in</strong>/Chl a > 0.1Chl b/Chl a > 0.2Perid<strong>in</strong><strong>in</strong>/Chl a > 0.03Hex/Chl a > 0.2Chl c 3 /Chl a > 0.035Green algae Chl b/Chl a < 0.1% Div<strong>in</strong>yl Chl b <strong>and</strong> b > 10%Fucoxanth<strong>in</strong>/Chl a > 0.01Chl c 1, 2 /Chl a > 0.1Hex/Chl a > 0.2Alloxanth<strong>in</strong>/Chl a >0.05D<strong>in</strong><strong>of</strong>lagellates Fucoxanth<strong>in</strong>/Chl a < 0.25Perid<strong>in</strong><strong>in</strong>/Chl a < 0.4Hex/Chl a > 0.2Chl b/Chl a > 0.1For example, <strong>the</strong> 50th percentile (median, q = 0.5)regression is a fitted l<strong>in</strong>e for which half <strong>the</strong> observations<strong>of</strong> <strong>the</strong> dependent variable lie above <strong>and</strong> halfbelow. The l<strong>in</strong>e represented by <strong>the</strong> 5th percentileregression lies below 95% <strong>of</strong> <strong>the</strong> observations. Clearly,<strong>to</strong> f<strong>in</strong>d <strong>the</strong> desired lower range, we sought such a loworderquantile regression. In fact, we sought <strong>the</strong>regression for <strong>the</strong> lowest quantile consistent with <strong>the</strong>criterion <strong>of</strong> robustness. Rogers (1992) advises that <strong>the</strong>m<strong>in</strong>imum quantile q should satisfy <strong>the</strong> condition q >5/N, where N is <strong>the</strong> <strong>to</strong>tal number <strong>of</strong> observations. Withsome 800 observations, this work<strong>in</strong>g rule would allowa regression at <strong>the</strong> first percentile (q = 0.01), but notmuch lower.The o<strong>the</strong>r fitt<strong>in</strong>g criterion is derived from <strong>in</strong>spection<strong>of</strong> <strong>the</strong> (log-transformed <strong>to</strong> base 10) data. It is clear that<strong>the</strong>y are convergent from lower <strong>to</strong> higher values <strong>of</strong><strong>chlorophyll</strong>, an <strong>in</strong>dication that phy<strong>to</strong>plank<strong>to</strong>n carbonconstitutes a higher proportion <strong>of</strong> particulate carbon as<strong>chlorophyll</strong> concent<strong>ratio</strong>n <strong>in</strong>creases <strong>and</strong> approachesthat characteristic <strong>of</strong> bloom conditions. In fitt<strong>in</strong>g <strong>the</strong> q =0.01 regression, we required that <strong>the</strong> fitted slopereflected this evident convergence. Therefore, if <strong>the</strong>fitted slope for <strong>the</strong> q = 0.01 regression was smaller thanthat <strong>of</strong> <strong>the</strong> q = 0.02 regression, we omitted <strong>the</strong> observationwith <strong>the</strong> largest residual <strong>and</strong> refitted <strong>the</strong> l<strong>in</strong>es. Theprocedure was repeated iteratively until <strong>the</strong> slopeexceeded or equalled that <strong>of</strong> <strong>the</strong> q = 0.02 regression. Inthis way, 3 (HPLC) <strong>to</strong> 8 (Turner fluorometer) datapo<strong>in</strong>ts were identified as outliers <strong>in</strong> <strong>the</strong> <strong>of</strong>fshoredataset. The f<strong>in</strong>al fit was judged <strong>to</strong> be free <strong>of</strong> bias byoutliers <strong>and</strong> <strong>to</strong> be <strong>the</strong> best available l<strong>in</strong>ear description<strong>of</strong> <strong>the</strong> lower edge <strong>of</strong> <strong>the</strong> scatter plot for <strong>the</strong> log-transformeddata.RESULTSOffshore dataThe straight-l<strong>in</strong>e fits <strong>to</strong> <strong>the</strong> log-transformed <strong>of</strong>fshoredata are shown <strong>in</strong> Fig. 1 for particulate carbon plottedas a function <strong>of</strong> both Turner fluorometric chl a <strong>and</strong>HPLC chl a (see also Table 3). The method <strong>of</strong> Legendre& Michaud (1999), who also analysed <strong>the</strong> relationshipbetween POC <strong>and</strong> chl a, is slightly different from ours<strong>in</strong> <strong>the</strong> sense that <strong>the</strong>y <strong>in</strong>teg<strong>rate</strong>d POC <strong>and</strong> chl a over af<strong>in</strong>ite depth <strong>of</strong> <strong>the</strong> water column <strong>and</strong> <strong>the</strong>n used averagevalues <strong>of</strong> <strong>the</strong> variables over <strong>the</strong> depth <strong>of</strong> <strong>in</strong>teg<strong>ratio</strong>n<strong>in</strong> <strong>the</strong> regression analysis. Our analyses, on <strong>the</strong>o<strong>the</strong>r h<strong>and</strong>, are based on discrete-depth samples. Ourresults for <strong>the</strong> parameters log m <strong>and</strong> p for <strong>the</strong> <strong>of</strong>fshoredata are remarkably close <strong>to</strong> <strong>the</strong> values reported byLegendre & Michaud (1999) for all station depths(Table 3) for POC.The particulate carbon field data <strong>in</strong>corpo<strong>rate</strong> alltypes <strong>of</strong> carbon <strong>in</strong> <strong>the</strong> system, <strong>in</strong>clud<strong>in</strong>g that fromphy<strong>to</strong>plank<strong>to</strong>n, detritus, bacteria <strong>and</strong> viruses that arereta<strong>in</strong>ed on <strong>the</strong> filter. We can assume that <strong>the</strong> m<strong>in</strong>imumcarbon amount associated with each concent<strong>ratio</strong>n<strong>of</strong> chl a represents <strong>the</strong> phy<strong>to</strong>plank<strong>to</strong>n carbon, anyo<strong>the</strong>r particulate carbon serv<strong>in</strong>g <strong>to</strong> <strong>in</strong>crease <strong>the</strong> measuredcarbon over <strong>the</strong> m<strong>in</strong>imum. Us<strong>in</strong>g quantileregression (for q = 0.01), we <strong>the</strong>refore fitted a l<strong>in</strong>e(Fig. 1) that follows <strong>the</strong> m<strong>in</strong>imum values <strong>of</strong> particulate
Sathyendranath et al.: <strong>Carbon</strong>-<strong>to</strong>-<strong>chlorophyll</strong> <strong>ratio</strong> <strong>and</strong> <strong>growth</strong> <strong>rate</strong> <strong>of</strong> phy<strong>to</strong>plank<strong>to</strong>n77Particulate carbon (CT) (mg m –3 )a100010010b100010010C T = 180 (B H ) 0.48 (n = 847)1% QR: C p = 79 (B H ) 0.650.1 1 10HPLC <strong>chlorophyll</strong> a (B H) (mg m –3 )C T = 157 (B F ) 0.45 (n = 839)C p = 83 (B F ) 0.69 (Buck et al. 1996)1% QR: C P = 64 (B F ) 0.630.1 1 10Turner <strong>chlorophyll</strong> a (B F) (mg m –3 )carbon associated with any given chl a concent<strong>ratio</strong>n(ignor<strong>in</strong>g identified outliers). S<strong>in</strong>ce phy<strong>to</strong>plank<strong>to</strong>n contribution<strong>to</strong> <strong>to</strong>tal particulate carbon may be expected <strong>to</strong><strong>in</strong>crease from oligotrophic <strong>to</strong> eutrophic waters, weanticipated that <strong>the</strong> l<strong>in</strong>es represent<strong>in</strong>g <strong>to</strong>tal <strong>and</strong> phy<strong>to</strong>plank<strong>to</strong>ncarbon would approach each o<strong>the</strong>r at high<strong>chlorophyll</strong> concent<strong>ratio</strong>ns. The equations for estimat<strong>in</strong>gphy<strong>to</strong>plank<strong>to</strong>n carbon from chl a concent<strong>ratio</strong>n arealso given <strong>in</strong> Table 3 for both Turner fluorometric <strong>and</strong>HPLC pigment data. From <strong>the</strong>se equations, one canestimate χ, <strong>the</strong> carbon-<strong>to</strong>-<strong>chlorophyll</strong> <strong>ratio</strong> <strong>of</strong> phy<strong>to</strong>plank<strong>to</strong>n,<strong>and</strong> its variation with chl a.S<strong>in</strong>ce <strong>the</strong> data set conta<strong>in</strong>s <strong>in</strong>formation on <strong>the</strong> pigmentcomposition <strong>of</strong> phy<strong>to</strong>plank<strong>to</strong>n, samples dom<strong>in</strong>ated by as<strong>in</strong>gle phy<strong>to</strong>plank<strong>to</strong>n type could be identified based on<strong>the</strong>ir diagnostic pigments. These phy<strong>to</strong>plank<strong>to</strong>n typesare fairly well sepa<strong>rate</strong>d along <strong>the</strong> <strong>chlorophyll</strong> axis, withAll dataDia<strong>to</strong>msPrymnesiophytesCyanobacteriaProchlorococcusGreen algaeAll dataDia<strong>to</strong>msPrymnesiophytesCyanobacteriaProchlorococcusGreen algaeFig. 1. Particulate carbon (C T ) as a function <strong>of</strong> <strong>chlorophyll</strong> a for <strong>of</strong>fshoredata. Chlorophyll a estimated by (a) HPLC <strong>and</strong> (b) Turner fluorometer.Least-squares fits <strong>to</strong> log-transformed data are shown, as well as m<strong>in</strong>imumcarbon estimates (C p , by quantile regression [QR] q = 0.01), whichmay be <strong>in</strong>terpreted as <strong>the</strong> upper limits for phy<strong>to</strong>plank<strong>to</strong>n carbon <strong>in</strong> <strong>the</strong>system. The relationship between phy<strong>to</strong>plank<strong>to</strong>n carbon <strong>and</strong> <strong>chlorophyll</strong>a <strong>in</strong> field data (Buck et al. 1996) is also shown <strong>in</strong> (b). The samplesidentified as be<strong>in</strong>g dom<strong>in</strong>ated by a particular type <strong>of</strong> phy<strong>to</strong>plank<strong>to</strong>n areidentified by different colourssamples dom<strong>in</strong>ated by Prochlorococcus,o<strong>the</strong>r cyanobacteria <strong>and</strong> green algae appear<strong>in</strong>g<strong>in</strong> oligotrophic waters, <strong>and</strong> dia<strong>to</strong>ms <strong>and</strong>prymnesiophytes becom<strong>in</strong>g more dom<strong>in</strong>ant <strong>in</strong>high-<strong>chlorophyll</strong> waters. No d<strong>in</strong><strong>of</strong>lagellatedom<strong>in</strong>atedsamples were identified from thisdata set accord<strong>in</strong>g <strong>to</strong> <strong>the</strong> criteria outl<strong>in</strong>ed <strong>in</strong>Table 2. Us<strong>in</strong>g <strong>the</strong> <strong>chlorophyll</strong> concent<strong>ratio</strong>ns<strong>of</strong> <strong>the</strong> samples <strong>and</strong> Eqs. (7) & (8) from Table 3for HPLC <strong>and</strong> Turner fluorometer data, respectively,one can compute χ for <strong>the</strong>se samples.The averages <strong>and</strong> ranges <strong>of</strong> χ for <strong>the</strong> 5 phy<strong>to</strong>plank<strong>to</strong>ntypes identified are presented <strong>in</strong>Table 4. These numbers are consistent withvalues <strong>in</strong> <strong>the</strong> literature on <strong>the</strong> carbon-<strong>to</strong><strong>chlorophyll</strong><strong>ratio</strong>s for various phy<strong>to</strong>plank<strong>to</strong>ntypes (Malone 1982, Geider 1987, Campbell etal. 1994, Kun<strong>in</strong>ao et al. 2000, Schoemann et al.2005, Veldhuis et al. 2005), provid<strong>in</strong>g <strong>in</strong>directvalidation <strong>of</strong> our method.The shape <strong>of</strong> <strong>the</strong> cloud <strong>of</strong> po<strong>in</strong>ts above <strong>the</strong>m<strong>in</strong>imum relationship (Fig. 1) is consistentwith <strong>the</strong> <strong>in</strong>terpretation that <strong>the</strong>re would be amore variable contribution <strong>to</strong> <strong>the</strong> particulatecarbon from material o<strong>the</strong>r than phy<strong>to</strong>plank<strong>to</strong>n<strong>in</strong> oligotrophic waters, whereas <strong>the</strong> relationshipbetween particulate carbon <strong>and</strong>phy<strong>to</strong>plank<strong>to</strong>n carbon would be tighter athigher <strong>chlorophyll</strong> concent<strong>ratio</strong>ns. Note alsothat <strong>the</strong> parameter p is
78Mar Ecol Prog Ser 383: 73–84, 2009Table 3. Fitted relationships between log carbon <strong>and</strong> log <strong>chlorophyll</strong> <strong>in</strong> <strong>the</strong> field for Turner fluorometric <strong>chlorophyll</strong> a (B F ) <strong>and</strong>HPLC <strong>chlorophyll</strong> a (B H ). Total particulate carbon is represented as C T , <strong>and</strong> C p is <strong>the</strong> estimated phy<strong>to</strong>plank<strong>to</strong>n carbon. The fits <strong>to</strong>log C T are by st<strong>and</strong>ard l<strong>in</strong>ear least-squares regression. The fits <strong>to</strong> estimate log C p are <strong>the</strong> results <strong>of</strong> 1% quantile regression, afterelim<strong>in</strong>ation <strong>of</strong> outliers. Results from Morel (1988), Legendre & Michaud (1999) <strong>and</strong> Buck et al. (1996) are also given, for comparison.Number <strong>of</strong> observations (n) <strong>and</strong> r 2 values are also given for log–log regressions. Note that <strong>the</strong> fitted relationships are <strong>of</strong> <strong>the</strong>form log(Y) = log (m) + p[log(X)]. POC: particulate organic carbonx y log (m) p n r 2 Eq. No. SourceOffshore (HPLC) B H C T 2.26 ± 0.006 0.48 ± 0.014 847 0.58 5 In situ dataOffshore (Turner) B F C T 2.20 ± 0.006 0.45 ± 0.013 839 0.59 6 In situ dataOffshore (HPLC) B H C p 1.90 0.65 844 7 In situ dataOffshore (Turner) B F C p 1.81 0.63 831 8 In situ dataTokyo Bay (HPLC) B H C T 2.43 ± 0.014 0.64 ± 0.017 469 0.76 9 In situ dataTokyo Bay (Turner) B F C T 2.41 ± 0.010 0.60 ± 0.011 811 0.78 10 In situ dataNorth Atlantic B F C p 1.92 0.69 0.60 12 Buck et al. (1996)Euphotic layer B F POC 1.95 0.57 409 0.68 11 Morel (1988)All station depths B F POC 2.21 ± 0.0140 0.505 ± 0.021 510 0.54 13 Legendre & Michaud (1999)Station depth < 200 m B F POC 2.29 ± 0.0194 0.353 ± 0.033 222 0.34 14 Legendre & Michaud (1999)Station depth > 300 m B F POC 2.16 ± 0.0213 0.614 ± 0.029 240 0.65 15 Legendre & Michaud (1999)Table 4. Mean <strong>and</strong> range <strong>of</strong> <strong>the</strong> carbon-<strong>to</strong>-<strong>chlorophyll</strong> <strong>ratio</strong>s(χ) <strong>of</strong> different phy<strong>to</strong>plank<strong>to</strong>n types, us<strong>in</strong>g <strong>the</strong> results <strong>of</strong> <strong>the</strong>1% quantile regression (QR). Chl a was determ<strong>in</strong>ed us<strong>in</strong>g aTurner fluorometer <strong>and</strong> HPLCPhy<strong>to</strong>plank<strong>to</strong>n typeMean χ (g/g) Range χ (g/g)1% QR 1% QRTurner fluorometerDia<strong>to</strong>ms (Offshore) 39 21–75Dia<strong>to</strong>ms (Tokyo Bay) 29 15–55D<strong>in</strong><strong>of</strong>lagellates (Tokyo Bay) 34 22–62Prymnesiophytes 65 44–82Cyanobacteria 93 74–126Green algae 99 80–126Prochlorococcus sp. 125 123–126All dia<strong>to</strong>ms <strong>to</strong>ge<strong>the</strong>r 34 15–75HPLCDia<strong>to</strong>ms (Offshore) 56 31–107Dia<strong>to</strong>ms (Tokyo Bay) 39 20–68D<strong>in</strong><strong>of</strong>lagellates (Tokyo Bay) 45 27–80Prymnesiophytes 85 65–111Cyanobacteria 130 95–176Green algae 137 122–159Prochlorococcus sp. 145 143–147All dia<strong>to</strong>ms <strong>to</strong>ge<strong>the</strong>r 47 20–107The mean (±SD) fraction <strong>of</strong> phy<strong>to</strong>plank<strong>to</strong>n carbon <strong>in</strong>particulate carbon estimated by this method is 45 ±21% us<strong>in</strong>g Turner fluorometric <strong>chlorophyll</strong> data (or 46± 20% us<strong>in</strong>g HPLC data), which is on <strong>the</strong> high side, butwith<strong>in</strong> <strong>the</strong> range <strong>of</strong> values reported <strong>in</strong> <strong>the</strong> literature(Eppley et al. 1992, Buck et al. 1996, DuR<strong>and</strong> et al.2001, Oubelkheir et al. 2005). On <strong>the</strong> o<strong>the</strong>r h<strong>and</strong>, χ valuesobta<strong>in</strong>ed by this simple method (Table 4) comparereasonably well with values <strong>in</strong> <strong>the</strong> literature on differentphy<strong>to</strong>plank<strong>to</strong>n types. Fur<strong>the</strong>rmore, <strong>the</strong> relationshipis also consistent with that observed by Buck et al.(1996), suggest<strong>in</strong>g that <strong>the</strong> estimates <strong>of</strong> <strong>the</strong> phy<strong>to</strong>plank<strong>to</strong>ncarbon-<strong>to</strong>-<strong>chlorophyll</strong> relationship <strong>in</strong> <strong>the</strong>mar<strong>in</strong>e environment provided here are reasonable.Note that, based on <strong>the</strong> equations for phy<strong>to</strong>plank<strong>to</strong>ncarbon <strong>and</strong> <strong>to</strong>tal particulate carbon, <strong>the</strong> fraction <strong>of</strong>phy<strong>to</strong>plank<strong>to</strong>n carbon <strong>in</strong> <strong>the</strong> <strong>to</strong>tal particulate carboncan be estimated as a function <strong>of</strong> <strong>chlorophyll</strong> concent<strong>ratio</strong>n(C p /C T = 0.44 B H 0.17 for HPLC data <strong>and</strong> C p /C T =0.41 B F 0.18 for Turner fluorometer data).Tokyo Bay dataThe Tokyo Bay data yielded higher values <strong>of</strong> both<strong>the</strong> parameters m <strong>and</strong> p for particulate carbon C T as afunction <strong>of</strong> chl a, compared with <strong>the</strong> <strong>of</strong>fshore data(Fig. 2, Table 3). This suggests <strong>the</strong> <strong>in</strong>fluence <strong>of</strong> a higherbackground <strong>of</strong> non-phy<strong>to</strong>plank<strong>to</strong>n carbon. The relationshipsbetween phy<strong>to</strong>plank<strong>to</strong>n carbon <strong>and</strong> chl aestablished for <strong>the</strong> <strong>of</strong>fshore data by Turner fluorometric<strong>and</strong> HPLC pigments (Fig. 1) are also extended herefor <strong>the</strong> higher <strong>chlorophyll</strong> concent<strong>ratio</strong>ns encountered<strong>in</strong> <strong>the</strong> semi-enclosed bay. The sepa<strong>ratio</strong>n between <strong>the</strong>extrapolated phy<strong>to</strong>plank<strong>to</strong>n–carbon–<strong>chlorophyll</strong> l<strong>in</strong>es<strong>and</strong> <strong>the</strong> data po<strong>in</strong>ts <strong>in</strong> Fig. 2 also suggest that nonphy<strong>to</strong>plank<strong>to</strong>ncontributions <strong>to</strong> <strong>the</strong> POC are higher <strong>in</strong><strong>the</strong> coastal environment than <strong>in</strong> <strong>the</strong> open ocean, whichmay be expected for areas <strong>in</strong>fluenced by river outflow<strong>and</strong> l<strong>and</strong> dra<strong>in</strong>age. Analyses <strong>of</strong> HPLC data revealedthat this data set conta<strong>in</strong>ed samples dom<strong>in</strong>ated bydia<strong>to</strong>ms <strong>and</strong> d<strong>in</strong><strong>of</strong>lagellates. Those samples are identified<strong>in</strong> Fig. 2, <strong>and</strong> <strong>the</strong>ir carbon-<strong>to</strong>-<strong>chlorophyll</strong> <strong>ratio</strong>s arepresented <strong>in</strong> Table 4.
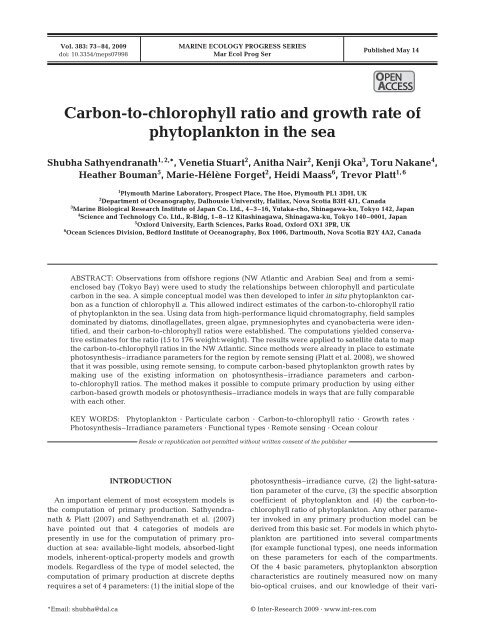
Sathyendranath et al.: <strong>Carbon</strong>-<strong>to</strong>-<strong>chlorophyll</strong> <strong>ratio</strong> <strong>and</strong> <strong>growth</strong> <strong>rate</strong> <strong>of</strong> phy<strong>to</strong>plank<strong>to</strong>n79Particulate carbon (C T ) (mg m –3 )a100001000100b100001000100C T = 268 (B H ) 0.64 (r 2 = 0.76, n = 469)1% QR: C p = 79 (B H ) 0.650.1 1 10 100HPLC <strong>chlorophyll</strong> a (B H ) (mg m –3 )C T = 256 (B F ) 0.60 (r 2 = 0.78, n = 811)1% QR: C p = 64 (B F ) 0.630.1 1 10 100Turner <strong>chlorophyll</strong> a (B F ) (mg m –3 )Satellite-based mapsTo illust<strong>rate</strong> <strong>the</strong> potential applications <strong>of</strong> this work,<strong>the</strong> results presented above were used <strong>in</strong> conjunctionwith chl a estimates derived from SeaWiFS <strong>to</strong> mapparticulate carbon, phy<strong>to</strong>plank<strong>to</strong>n carbon <strong>and</strong> carbon<strong>to</strong>-<strong>chlorophyll</strong><strong>ratio</strong>s <strong>of</strong> phy<strong>to</strong>plank<strong>to</strong>n (Fig. 3) <strong>in</strong> May<strong>in</strong> <strong>the</strong> NW Atlantic. This is <strong>the</strong> spr<strong>in</strong>g bloom <strong>sea</strong>son,<strong>and</strong> <strong>the</strong> <strong>chlorophyll</strong> distribution is highly variable(Fig. 3a), rang<strong>in</strong>g from oligotrophic Gulf Streamwaters <strong>to</strong> high <strong>chlorophyll</strong> waters <strong>of</strong>f SW Greenl<strong>and</strong>.The map <strong>of</strong> particulate carbon is based on Eq. (6)(Table 3) for <strong>of</strong>fshore data, which relies on a largenumber <strong>of</strong> observations from <strong>the</strong> area. It is an alternativeapproach <strong>to</strong> that based on back-scatter<strong>in</strong>g (e.g.Loisel et al. 2002) or <strong>the</strong> method <strong>of</strong> Gardner et al.(2006), which is based on relationships between beamattenuation, POC <strong>and</strong> <strong>the</strong> diffuse attenuation coefficientat 490 nm. Our method is designed <strong>to</strong> capture<strong>the</strong> particulate carbon that covaries with chl a. It is notAll dataDia<strong>to</strong>msD<strong>in</strong><strong>of</strong>lagellatesAll dataDia<strong>to</strong>msD<strong>in</strong><strong>of</strong>lagellatesFig. 2. Particulate carbon (C T ) as a function <strong>of</strong> <strong>chlorophyll</strong> a for a semienclosedbas<strong>in</strong> (Tokyo Bay). Chlorophyll a estimated by (a) HPLC <strong>and</strong>(b) Turner fluorometer. Least-squares fits <strong>to</strong> log-transformed data areshown, as well as <strong>the</strong> m<strong>in</strong>imum carbon estimates (C p ) from Fig. 1capable <strong>of</strong> identify<strong>in</strong>g variations <strong>in</strong> particulatecarbon that are <strong>in</strong>dependent <strong>of</strong> chl a. On<strong>the</strong> o<strong>the</strong>r h<strong>and</strong>, our method is unlikely <strong>to</strong> be<strong>in</strong>fluenced by phenomena such as coccolithblooms or bubbles, which can <strong>in</strong>crease backscatter<strong>in</strong>gor <strong>the</strong> attenuation coefficient without<strong>in</strong>creas<strong>in</strong>g <strong>chlorophyll</strong> concent<strong>ratio</strong>n. Themaps <strong>of</strong> particulate carbon <strong>and</strong> phy<strong>to</strong>plank<strong>to</strong>ncarbon reveal similarities with <strong>the</strong> <strong>chlorophyll</strong>map, given <strong>the</strong> correlation between<strong>the</strong>se properties. The phy<strong>to</strong>plank<strong>to</strong>n carbonmap (us<strong>in</strong>g Eq. 8; Table 3) relies, <strong>in</strong> addition,on a simple conceptual model, which hasbeen tested <strong>in</strong>directly by comparison withvalues from <strong>the</strong> literature (Buck et al. 1996).The <strong>ratio</strong> χ estimated here has a conservativerange (10 <strong>to</strong> 150) <strong>and</strong> is low <strong>in</strong> high-biomassareas <strong>and</strong> high <strong>in</strong> low-biomass areas. InFig. 3, we also show <strong>the</strong> assimilation numberP Bm computed us<strong>in</strong>g <strong>the</strong> Nearest-NeighbourMethod <strong>of</strong> Platt et al. (2008) <strong>and</strong> <strong>the</strong> maximum,light-satu<strong>rate</strong>d <strong>growth</strong> <strong>rate</strong>, which iscomputed as P B m /χ (see Eq. 3). Note that bothP Bm <strong>and</strong> <strong>the</strong> maximum <strong>growth</strong> <strong>rate</strong> peak <strong>in</strong>frontal areas, possibly because <strong>of</strong> associatedhigh nutrient supply.DISCUSSIONRelationship between particulate carbon<strong>and</strong> chl a concent<strong>ratio</strong>nThe data presented here show a strong correlationbetween particulate carbon <strong>and</strong> chl aconcent<strong>ratio</strong>n. The results are remarkably close <strong>to</strong>those presented by Legendre & Michaud (1999) for an<strong>in</strong>dependent data set on POC <strong>and</strong> chl a. They notedthat, s<strong>in</strong>ce chl a is readily estimated from satellite data,such relationships provide a simple avenue for estimat<strong>in</strong>gPOC from satellite data. They also po<strong>in</strong>ted out <strong>the</strong>importance <strong>of</strong> POC <strong>in</strong> ecosystem models as <strong>the</strong> foodsource for zooplank<strong>to</strong>n. Our data also show that ourmethod is robust, even though it straddles a broadrange <strong>of</strong> trophic conditions, rang<strong>in</strong>g from oligotrophic<strong>to</strong> eutrophic. Such macro-ecological patterns, whichappear <strong>to</strong> transcend boundaries <strong>of</strong> biogeochemicalprov<strong>in</strong>ces <strong>and</strong> even biomes, can also serve as useful<strong>to</strong>ols for test<strong>in</strong>g <strong>the</strong> performance <strong>of</strong> mar<strong>in</strong>e ecosystemmodels. Typically, particulate carbon or POC is notrepresented explicitly <strong>in</strong> ecosystem models, but can beestimated as <strong>the</strong> sum <strong>of</strong> <strong>the</strong> computed particulate carbon<strong>in</strong> <strong>the</strong> various elements <strong>of</strong> <strong>the</strong> model, <strong>in</strong>clud<strong>in</strong>gdetritus. If <strong>the</strong> models were able <strong>to</strong> reproduce <strong>the</strong> bulkproperties <strong>of</strong> <strong>the</strong> ecosystem, as shown here, we would
80Mar Ecol Prog Ser 383: 73–84, 2009Fig. 3. Clima<strong>to</strong>logical <strong>chlorophyll</strong> a data (1997 <strong>to</strong> 2006) for <strong>the</strong> second half <strong>of</strong> May for <strong>the</strong> NW Atlantic, derived from SeaWiFS (a).(b) Particulate carbon <strong>and</strong> (c) estimated fields <strong>of</strong> phy<strong>to</strong>plank<strong>to</strong>n carbon (C p ) derived from (a) us<strong>in</strong>g Eq. (7) from Table 3. The<strong>chlorophyll</strong> <strong>and</strong> phy<strong>to</strong>plank<strong>to</strong>n carbon fields are <strong>the</strong>n used <strong>to</strong> derive χ, <strong>the</strong> carbon-<strong>to</strong>-<strong>chlorophyll</strong> <strong>ratio</strong> <strong>of</strong> phy<strong>to</strong>plank<strong>to</strong>n (d). TheNearest-Neighbour Method <strong>of</strong> Platt et al. (2008) is used <strong>to</strong> map <strong>the</strong> light satu<strong>ratio</strong>n parameter P m B (e). F<strong>in</strong>ally, P m B is divided by χ<strong>to</strong> estimate maximum (light-satu<strong>rate</strong>d) carbon <strong>growth</strong> <strong>rate</strong>s (μ) us<strong>in</strong>g Eq. (3), <strong>and</strong> sett<strong>in</strong>g <strong>the</strong> terms <strong>in</strong> paren<strong>the</strong>ses on <strong>the</strong>right-h<strong>and</strong> side <strong>of</strong> <strong>the</strong> equation <strong>to</strong> 1 (f)have an <strong>in</strong>dependent validation <strong>of</strong> <strong>the</strong> overall performance<strong>of</strong> <strong>the</strong> model. One anticipates that macroecologicalpatterns, such as those presented here,would be modulated locally <strong>and</strong> regionally (as seen, forexample, <strong>in</strong> <strong>the</strong> differences between <strong>of</strong>fshore <strong>and</strong>Tokyo Bay data).Phy<strong>to</strong>plank<strong>to</strong>n carbon measurement <strong>in</strong> <strong>the</strong> fieldMany ecosystem models are not based on chl a, but oncarbon, such that a suitable carbon-<strong>to</strong>-<strong>chlorophyll</strong> <strong>ratio</strong>has <strong>to</strong> be <strong>in</strong>voked <strong>to</strong> estimate chl a for comparison withsatellite data. For phy<strong>to</strong>plank<strong>to</strong>n at <strong>sea</strong>, <strong>the</strong> carbon-<strong>to</strong>-
Sathyendranath et al.: <strong>Carbon</strong>-<strong>to</strong>-<strong>chlorophyll</strong> <strong>ratio</strong> <strong>and</strong> <strong>growth</strong> <strong>rate</strong> <strong>of</strong> phy<strong>to</strong>plank<strong>to</strong>n81<strong>chlorophyll</strong> <strong>ratio</strong> is a poorly known quantity. Phy<strong>to</strong>plank<strong>to</strong>ncarbon concent<strong>ratio</strong>n is not easily measured <strong>in</strong> <strong>the</strong>field, given <strong>the</strong> difficulty <strong>of</strong> dist<strong>in</strong>guish<strong>in</strong>g phy<strong>to</strong>plank<strong>to</strong>ncarbon from o<strong>the</strong>r types <strong>of</strong> carbon. What is <strong>of</strong>ten measuredis <strong>the</strong> <strong>to</strong>tal particulate carbon or POC, <strong>of</strong> whichphy<strong>to</strong>plank<strong>to</strong>n carbon is recognised <strong>to</strong> be a variable fraction(Eppley et al. 1992, Oubelkheir et al. 2005). L<strong>in</strong>earregression <strong>of</strong> POC on <strong>chlorophyll</strong> has been used <strong>to</strong> derive<strong>the</strong> phy<strong>to</strong>plank<strong>to</strong>n fraction <strong>of</strong> <strong>the</strong> carbon from <strong>the</strong>slope <strong>of</strong> <strong>the</strong> fit, on <strong>the</strong> assumption that <strong>the</strong>re is a background<strong>of</strong> POC at <strong>sea</strong> that is not associated with phy<strong>to</strong>plank<strong>to</strong>n(e.g. Steele & Baird 1961, Townsend & Thomas2002, Behrenfeld et al. 2005). But <strong>the</strong> method ignores <strong>the</strong>possibility that this background might be variable <strong>and</strong>that o<strong>the</strong>r types <strong>of</strong> particulate carbon might co-vary with<strong>the</strong> phy<strong>to</strong>plank<strong>to</strong>n, lead<strong>in</strong>g <strong>to</strong> erroneous results (Banse1977, Eppley et al. 1992, Legendre & Michaud 1999), especiallywhen deal<strong>in</strong>g with large data sets from a variety<strong>of</strong> locations cover<strong>in</strong>g a wide range <strong>of</strong> chl a values, as is<strong>the</strong> case here. The non-l<strong>in</strong>ear approach used here overcomessome <strong>of</strong> <strong>the</strong> limitations <strong>of</strong> <strong>the</strong>se earlier methods.Oubelkheir et al. (2005) used an analysis <strong>of</strong> opticaldata <strong>and</strong> phy<strong>to</strong>plank<strong>to</strong>n carbon measurements <strong>in</strong> cultures<strong>to</strong> derive <strong>the</strong> fraction <strong>of</strong> phy<strong>to</strong>plank<strong>to</strong>n carbon <strong>in</strong>POC. Their method has not yet been validated bydirect measurements. Ano<strong>the</strong>r approach <strong>to</strong> estimat<strong>in</strong>gphy<strong>to</strong>plank<strong>to</strong>n carbon at <strong>sea</strong> relies on measurements<strong>of</strong> cell carbon <strong>in</strong> various types <strong>of</strong> phy<strong>to</strong>plank<strong>to</strong>n <strong>in</strong> labora<strong>to</strong>rycultures, comb<strong>in</strong>ed with cell counts <strong>of</strong> <strong>the</strong>phy<strong>to</strong>plank<strong>to</strong>n types at <strong>sea</strong> (Eppley et al. 1992, Du-R<strong>and</strong> et al. 2001, Grob et al. 2007). The limitation <strong>of</strong>this method is that <strong>the</strong> cell quota <strong>of</strong> carbon is a variablequantity that depends on <strong>growth</strong> conditions (Geider1987, Cloern et al. 1995), <strong>and</strong> this <strong>of</strong>ten <strong>in</strong>troduces alevel <strong>of</strong> uncerta<strong>in</strong>ty <strong>in</strong><strong>to</strong> <strong>the</strong> calculations. A directmethod <strong>to</strong> estimate <strong>the</strong> carbon-<strong>to</strong>-<strong>chlorophyll</strong> <strong>ratio</strong> (χ)at <strong>sea</strong> is <strong>the</strong> pigment-labell<strong>in</strong>g method (Goericke &Welschmeyer 1998). Unfortunately, this method hasnot yet been widely used.The variability observed <strong>in</strong> <strong>the</strong> relationship between<strong>to</strong>tal carbon <strong>and</strong> <strong>chlorophyll</strong> (Figs. 1 & 2) arises from 2ma<strong>in</strong> sources: variability <strong>in</strong> <strong>the</strong> proportion <strong>of</strong> non-phy<strong>to</strong>plank<strong>to</strong>nicparticulate carbon <strong>and</strong> variability <strong>in</strong> <strong>the</strong>phy<strong>to</strong>plank<strong>to</strong>n carbon itself. The former type <strong>of</strong> variabilityis related <strong>to</strong> <strong>the</strong> status <strong>of</strong> <strong>the</strong> ecosystem as a whole,whereas <strong>the</strong> latter may be associated with changes <strong>in</strong> <strong>the</strong>phy<strong>to</strong>plank<strong>to</strong>n community itself or with its acclimation <strong>to</strong><strong>the</strong> light or nutrient regime. Assum<strong>in</strong>g that, at any given<strong>chlorophyll</strong> concent<strong>ratio</strong>n, <strong>the</strong> variability <strong>in</strong> <strong>the</strong> <strong>to</strong>tal carbon-<strong>to</strong>-<strong>chlorophyll</strong><strong>ratio</strong> is primarily due <strong>to</strong> changes <strong>in</strong><strong>the</strong> non-phy<strong>to</strong>plank<strong>to</strong>nic carbon, data on <strong>to</strong>tal particulatecarbon <strong>and</strong> <strong>chlorophyll</strong> can be used <strong>to</strong> retrieve <strong>the</strong>phy<strong>to</strong>plank<strong>to</strong>n carbon, as demonst<strong>rate</strong>d here. The estimateswe have given for phy<strong>to</strong>plank<strong>to</strong>n carbon <strong>in</strong> <strong>the</strong>field have been derived from measurements <strong>of</strong> particulatecarbon, <strong>in</strong>vok<strong>in</strong>g simple ecosystem conside<strong>ratio</strong>ns.S<strong>in</strong>ce <strong>the</strong>re will always be some contribution <strong>to</strong> particulatecarbon <strong>in</strong> <strong>the</strong> field from material o<strong>the</strong>r than phy<strong>to</strong>plank<strong>to</strong>n,this estimate (Eqs. 7 & 8; Table 3) represents anupper limit <strong>of</strong> phy<strong>to</strong>plank<strong>to</strong>n carbon for a given chl aconcent<strong>ratio</strong>n. Moreover, it is well known that adaptation<strong>to</strong> low light levels usually leads <strong>to</strong> an <strong>in</strong>crease<strong>in</strong> <strong>chlorophyll</strong> concent<strong>ratio</strong>n per cell (e.g. Cullen 1982,Veldhuis & Kraay 2004). Hence, we may ref<strong>in</strong>e <strong>the</strong> <strong>in</strong>terpretation<strong>of</strong> <strong>the</strong> field estimates <strong>to</strong> state that <strong>the</strong>y representmaximal phy<strong>to</strong>plank<strong>to</strong>n carbon for a given <strong>chlorophyll</strong>concent<strong>ratio</strong>n under <strong>the</strong> prevail<strong>in</strong>g ambient lightconditions. We may expect <strong>the</strong>se estimates <strong>to</strong> be modulatedwith changes <strong>in</strong> <strong>the</strong> available light, e.g. <strong>the</strong> carbon<strong>to</strong>-<strong>chlorophyll</strong><strong>ratio</strong> decreas<strong>in</strong>g with decreas<strong>in</strong>g light.S<strong>in</strong>ce most <strong>of</strong> <strong>the</strong> <strong>of</strong>fshore data come from depths <strong>of</strong> 40 mor less, <strong>the</strong> results presented here may be taken <strong>to</strong> berepresentative <strong>of</strong> <strong>the</strong> surface mixed layer.<strong>Carbon</strong>-<strong>to</strong>-<strong>chlorophyll</strong> <strong>ratio</strong>s <strong>of</strong> phy<strong>to</strong>plank<strong>to</strong>nThe analyses presented here provide an <strong>in</strong>directestimate <strong>of</strong> carbon-<strong>to</strong>-<strong>chlorophyll</strong> <strong>ratio</strong>s <strong>in</strong> <strong>the</strong> field,based on an extensive database. They compare wellwith values <strong>in</strong> <strong>the</strong> literature (Table 4), <strong>and</strong> <strong>the</strong> estimates<strong>of</strong> χ that emerge from <strong>the</strong> analyses (see Fig. 3)are conservative. This relationship may be modulatedby light conditions dur<strong>in</strong>g <strong>growth</strong>, as noted above.S<strong>in</strong>ce most <strong>of</strong> our data are from surface <strong>and</strong> near-surfacewaters, we may anticipate lower values <strong>of</strong> χ atdepth <strong>in</strong> <strong>the</strong> ocean, where <strong>the</strong> average light levelsexperienced by <strong>the</strong> cells are lower. <strong>Carbon</strong>-<strong>to</strong>-<strong>chlorophyll</strong><strong>ratio</strong>s also vary with phy<strong>to</strong>plank<strong>to</strong>n group, be<strong>in</strong>glowest for <strong>the</strong> larger dia<strong>to</strong>m cells <strong>and</strong> highest forsmaller species such as Prochlorococcus sp., which isalso consistent with literature values.The <strong>in</strong>direct method established here yields carbon<strong>to</strong>-<strong>chlorophyll</strong><strong>ratio</strong>s for phy<strong>to</strong>plank<strong>to</strong>n that are reasonable,based on our current knowledge. The field datafor various phy<strong>to</strong>plank<strong>to</strong>n types sepa<strong>rate</strong> <strong>in</strong><strong>to</strong> groupsalong <strong>the</strong> <strong>chlorophyll</strong> axis, which made it possible <strong>to</strong>establish χ for <strong>the</strong> different groups. These estimatesmay be considered reasonable first approximations <strong>of</strong>what can be expected <strong>in</strong> <strong>the</strong> field, when one <strong>of</strong> <strong>the</strong>sephy<strong>to</strong>plank<strong>to</strong>n types is dom<strong>in</strong>ant. It rema<strong>in</strong>s <strong>to</strong> beestablished whe<strong>the</strong>r <strong>the</strong>se values <strong>of</strong> χ would hold ifo<strong>the</strong>r phy<strong>to</strong>plank<strong>to</strong>n types were dom<strong>in</strong>ant <strong>and</strong> if <strong>the</strong>nutrient <strong>and</strong> light regimes were different.Phy<strong>to</strong>plank<strong>to</strong>n <strong>growth</strong> <strong>rate</strong>sCloern et al. (1995) used over 200 measurements <strong>of</strong>carbon-<strong>to</strong>-<strong>chlorophyll</strong> <strong>ratio</strong>s <strong>and</strong> <strong>growth</strong> <strong>rate</strong>s from
82Mar Ecol Prog Ser 383: 73–84, 2009labora<strong>to</strong>ry cultures reported by various <strong>in</strong>vestiga<strong>to</strong>rs<strong>and</strong> established an empirical model that relates carbon-<strong>to</strong>-<strong>chlorophyll</strong><strong>ratio</strong>s <strong>to</strong> <strong>growth</strong> <strong>rate</strong>s based onphysiological conside<strong>ratio</strong>ns. They <strong>the</strong>n developed amodel for conversion between carbon-based <strong>growth</strong><strong>rate</strong>s <strong>and</strong> <strong>chlorophyll</strong>-specific pho<strong>to</strong>syn<strong>the</strong>sis <strong>rate</strong>s.Geider (1987) <strong>and</strong> Geider et al. (1997) also proposedmodels that account for variations <strong>in</strong> carbon-<strong>to</strong>-<strong>chlorophyll</strong><strong>ratio</strong>s based on algal responses <strong>to</strong> culture conditions.The method <strong>of</strong> Behrenfeld et al. (2005) for estimat<strong>in</strong>gphy<strong>to</strong>plank<strong>to</strong>n <strong>growth</strong> <strong>rate</strong>s for remote-sens<strong>in</strong>gapplications is also based on labora<strong>to</strong>ry measurements.S<strong>in</strong>ce labora<strong>to</strong>ry cultures are <strong>of</strong>ten ma<strong>in</strong>ta<strong>in</strong>ed <strong>in</strong> conditionsthat poorly represent typical <strong>growth</strong> conditionsat <strong>sea</strong>, some uncerta<strong>in</strong>ty is <strong>in</strong>troduced when labora<strong>to</strong>rymodels are translated for application <strong>to</strong> field models.Phy<strong>to</strong>plank<strong>to</strong>n <strong>growth</strong> <strong>rate</strong>s can be measured at <strong>sea</strong><strong>in</strong>directly, from dilution experiments on zooplank<strong>to</strong>ngraz<strong>in</strong>g (L<strong>and</strong>ry & Hassett 1982), from chl a labell<strong>in</strong>gexperiments (e.g. Welschmeyer & Lorenzen 1984), orfrom pigment budget experiments assum<strong>in</strong>g steadystateconditions <strong>in</strong> <strong>the</strong> water column sampled (e.g.Welschmeyer & Lorenzen 1985, L<strong>and</strong>ry et al. 1995).But such measurements are not implemented on a rout<strong>in</strong>ebasis at <strong>sea</strong>. The method applied here is based on<strong>in</strong> situ measurements <strong>of</strong> pho<strong>to</strong>syn<strong>the</strong>sis–irradianceparameters <strong>and</strong> an <strong>in</strong>direct estimate <strong>of</strong> carbon-<strong>to</strong><strong>chlorophyll</strong><strong>ratio</strong>s. It allows us <strong>to</strong> exploit <strong>the</strong> exist<strong>in</strong>garchives <strong>of</strong> pho<strong>to</strong>syn<strong>the</strong>sis–irradiance parameters, <strong>and</strong><strong>to</strong> reconcile <strong>chlorophyll</strong>-based <strong>and</strong> carbon-based models<strong>of</strong> primary production. It would be desirable <strong>to</strong> test<strong>the</strong> performance <strong>of</strong> <strong>the</strong> method presented here byus<strong>in</strong>g <strong>in</strong> situ experiments.The method developed here for estimat<strong>in</strong>g <strong>the</strong> carbonbased<strong>growth</strong> <strong>rate</strong>s <strong>of</strong> phy<strong>to</strong>plank<strong>to</strong>n (Fig. 3) is based ona large body <strong>of</strong> field observations <strong>of</strong> pho<strong>to</strong>syn<strong>the</strong>sis–irradianceparameters <strong>and</strong> particulate carbon at <strong>sea</strong>. It is differentfrom that proposed by Behrenfeld et al. (2005),which relies on backscatter<strong>in</strong>g-derived POC, with <strong>the</strong>additional assumption <strong>of</strong> a constant background contributionfrom heterotrophic organisms <strong>and</strong> detritus, <strong>to</strong> derivephy<strong>to</strong>plank<strong>to</strong>n carbon. Their carbon-based <strong>growth</strong>model relies on culture data, whereas <strong>the</strong> pho<strong>to</strong>syn<strong>the</strong>sis–irradianceparameters on which our method is basedare estimated for natural <strong>sea</strong>water samples from <strong>the</strong>study area. Pho<strong>to</strong>syn<strong>the</strong>sis–irradiance parameters aredirectly observable at <strong>sea</strong>, <strong>and</strong> it is now possible <strong>to</strong> extrapolate<strong>the</strong>se observations on a pixel-by-pixel basis(Platt et al. 2008). Therefore, algorithms for primary productionthat are based on pho<strong>to</strong>syn<strong>the</strong>sis– irradiance formalismrema<strong>in</strong> <strong>the</strong> methods <strong>of</strong> choice, compared withcarbon-based models. In <strong>the</strong> absence <strong>of</strong> rout<strong>in</strong>e techniques<strong>to</strong> measure carbon-based <strong>growth</strong> <strong>rate</strong>s for phy<strong>to</strong>plank<strong>to</strong>nat <strong>sea</strong>, <strong>the</strong>se <strong>rate</strong>s have <strong>to</strong> be ei<strong>the</strong>r extrapolatedfrom labora<strong>to</strong>ry observations or estimated<strong>in</strong>directly from pho<strong>to</strong>syn<strong>the</strong>sis–irradiance parameters,as proposed here. At present, <strong>the</strong> value <strong>of</strong> mapp<strong>in</strong>g carbon-based<strong>growth</strong> <strong>rate</strong>s by remote sens<strong>in</strong>g is pr<strong>in</strong>cipallyfor comparison with <strong>growth</strong> <strong>rate</strong>s used <strong>in</strong> large-scaleecosystem models. The sources <strong>of</strong> differences betweenmodels <strong>and</strong> estimates, if identified, could provide <strong>in</strong>sightsthat would allow fur<strong>the</strong>r improvements <strong>of</strong> bothmodels <strong>and</strong> remote-sens<strong>in</strong>g methods.CONCLUSIONSAlmost 50 yr ago, Strickl<strong>and</strong> (1960) identified limitations<strong>of</strong> exist<strong>in</strong>g methods for estimat<strong>in</strong>g <strong>the</strong> carbon-<strong>to</strong><strong>chlorophyll</strong><strong>ratio</strong>s <strong>of</strong> natural phy<strong>to</strong>plank<strong>to</strong>n. Seventeenyears later, Banse (1977, p 199) lamented ‘matters havenot improved greatly’, <strong>and</strong> identified fur<strong>the</strong>r problemswith exist<strong>in</strong>g methods. Now, 30 yr later, we are still<strong>in</strong> <strong>sea</strong>rch <strong>of</strong> a robust method for measur<strong>in</strong>g this elusiveproperty. Even though new technologies such aslabelled <strong>chlorophyll</strong> (see Welschmeyer & Lorenzen1984) have been brought <strong>to</strong> bear on <strong>the</strong> problem, suchmeasurements have yet <strong>to</strong> become rout<strong>in</strong>e, <strong>and</strong> fieldestimates <strong>of</strong> phy<strong>to</strong>plank<strong>to</strong>n carbon still <strong>of</strong>ten rely on<strong>the</strong> cell quotas <strong>of</strong> carbon measured <strong>in</strong> labora<strong>to</strong>ry cultures,which br<strong>in</strong>g <strong>the</strong>ir own uncerta<strong>in</strong>ties <strong>in</strong><strong>to</strong> <strong>the</strong> estimates.We still do not have a direct, accu<strong>rate</strong> <strong>and</strong> rout<strong>in</strong>emethod for measur<strong>in</strong>g phy<strong>to</strong>plank<strong>to</strong>n carbon at<strong>sea</strong>.Meanwhile, <strong>the</strong> need <strong>to</strong> quantify phy<strong>to</strong>plank<strong>to</strong>n carbonhas <strong>in</strong>creased. Ecosystem <strong>and</strong> climate-changemodels use carbon-<strong>to</strong>-<strong>chlorophyll</strong> <strong>ratio</strong>s, which areknown <strong>to</strong> be highly variable (values reported <strong>in</strong> <strong>the</strong>literature range from 1000; see also Table 4for a more conservative range). We need <strong>to</strong> be able <strong>to</strong>measure <strong>the</strong> carbon-<strong>to</strong>-<strong>chlorophyll</strong> <strong>ratio</strong> directly <strong>and</strong> <strong>to</strong>underst<strong>and</strong> its variability if we are <strong>to</strong> improve phy<strong>to</strong>plank<strong>to</strong>n<strong>growth</strong> models <strong>and</strong> better evaluate <strong>the</strong> role <strong>of</strong>phy<strong>to</strong>plank<strong>to</strong>n <strong>in</strong> <strong>the</strong> global carbon cycle <strong>and</strong> how itmight vary <strong>in</strong> <strong>the</strong> context <strong>of</strong> a chang<strong>in</strong>g climate. It is afundamental property <strong>of</strong> phy<strong>to</strong>plank<strong>to</strong>n that rema<strong>in</strong>sdifficult <strong>to</strong> def<strong>in</strong>e.The relationships between particulate carbon <strong>and</strong>chl a presented here are based on bulk-property conside<strong>ratio</strong>ns<strong>and</strong> rely on a large body <strong>of</strong> field data. Theyreveal macro-ecological properties <strong>of</strong> use <strong>in</strong> models<strong>and</strong> <strong>in</strong> remote sens<strong>in</strong>g. Simple ecosystem conside<strong>ratio</strong>ns<strong>the</strong>n allow us <strong>to</strong> establish an upper limit for <strong>the</strong>carbon-<strong>to</strong>-<strong>chlorophyll</strong> <strong>ratio</strong> <strong>of</strong> phy<strong>to</strong>plank<strong>to</strong>n <strong>in</strong> <strong>the</strong>field <strong>and</strong> its variation with <strong>chlorophyll</strong> concent<strong>ratio</strong>n.We were also able <strong>to</strong> determ<strong>in</strong>e <strong>the</strong> <strong>ratio</strong>s for severalparticular phy<strong>to</strong>plank<strong>to</strong>n types, with results that areconsistent with earlier observations. These f<strong>in</strong>d<strong>in</strong>gslead <strong>to</strong> first-order estimates <strong>of</strong> <strong>the</strong> <strong>ratio</strong> from remotesens<strong>in</strong>g. Once <strong>the</strong> carbon-<strong>to</strong>-<strong>chlorophyll</strong> <strong>ratio</strong> is estab-
Sathyendranath et al.: <strong>Carbon</strong>-<strong>to</strong>-<strong>chlorophyll</strong> <strong>ratio</strong> <strong>and</strong> <strong>growth</strong> <strong>rate</strong> <strong>of</strong> phy<strong>to</strong>plank<strong>to</strong>n83lished, it is easy <strong>to</strong> switch between pho<strong>to</strong>syn<strong>the</strong>sis–irradiance models <strong>and</strong> carbon-based <strong>growth</strong> models <strong>of</strong>phy<strong>to</strong>plank<strong>to</strong>n <strong>in</strong> a consistent manner, for application<strong>in</strong> remote sens<strong>in</strong>g or <strong>in</strong> ecosystem models, as illust<strong>rate</strong>dhere.Acknowledgements. We are g<strong>rate</strong>ful <strong>to</strong> 5 anonymous reviewersfor <strong>the</strong>ir useful suggestions <strong>and</strong> comments. The presentstudy is a contribution <strong>to</strong> <strong>the</strong> Canadian Space Agency GRIPprogram <strong>and</strong> <strong>to</strong> <strong>the</strong> NCEO <strong>and</strong> Oceans2025 projects <strong>of</strong> NERC(UK).LITERATURE CITEDBanse K (1977) Determ<strong>in</strong><strong>in</strong>g <strong>the</strong> carbon-<strong>to</strong>-<strong>chlorophyll</strong> <strong>ratio</strong> <strong>of</strong>natural phy<strong>to</strong>plank<strong>to</strong>n. Mar Biol 41:199–212Behrenfeld MJ, Boss E, Siegel DA, Shea DM (2005) <strong>Carbon</strong>basedocean productivity <strong>and</strong> phy<strong>to</strong>plank<strong>to</strong>n physiologyfrom space. Global Biogeochem Cycles 19:GB1006doi:10.1029/2004GB002299Bricaud A, Claustre H, Ras J, Oubelkheir K (2004) Naturalvariability <strong>of</strong> phy<strong>to</strong>plank<strong>to</strong>nic absorption <strong>in</strong> oceanicwaters: <strong>in</strong>fluence <strong>of</strong> <strong>the</strong> size structure <strong>of</strong> algal populations.J Geophys Res 109:C11010Buck KR, Chavez FP, Campbell L (1996) Bas<strong>in</strong>-wide distributions<strong>of</strong> liv<strong>in</strong>g carbon components <strong>and</strong> <strong>the</strong> <strong>in</strong>verted trophicpyramid <strong>of</strong> <strong>the</strong> central gyre <strong>of</strong> <strong>the</strong> North Atlantic Ocean,summer 1993. Aquat Microb Ecol 10:283–298Campbell L, Nolla HA, Vaulot D (1994) The importance <strong>of</strong>Prochlorococcus <strong>to</strong> community structure <strong>in</strong> <strong>the</strong> centralNorth Pacific Ocean. Limnol Oceanogr 39:954–961Cloern JE, Grenz C, Vidergar-Lucas L (1995) An empiricalmodel <strong>of</strong> <strong>the</strong> phy<strong>to</strong>plank<strong>to</strong>n <strong>chlorophyll</strong>:carbon <strong>ratio</strong> — <strong>the</strong>conversion fac<strong>to</strong>r between productivity <strong>and</strong> <strong>growth</strong> <strong>rate</strong>.Limnol Oceanogr 40:1313–1321Collos Y (2002) Determ<strong>in</strong>ation <strong>of</strong> particulate carbon <strong>and</strong>nitrogen <strong>in</strong> coastal waters. In: Subba Rao DV (ed) Pelagicecology methodology. A. A. Balkema Publishers, Tokyo,p 333–341Cullen JJ (1982) The deep <strong>chlorophyll</strong> maximum: compar<strong>in</strong>gvertical pr<strong>of</strong>iles <strong>of</strong> <strong>chlorophyll</strong> a. Can J Fish Aquat Sci39:791–803Devred E, Sathyendranath S, Stuart V, Maass H, Ulloa O,Platt T (2006) A two-component model <strong>of</strong> phy<strong>to</strong>plank<strong>to</strong>nabsorption <strong>in</strong> <strong>the</strong> open ocean: <strong>the</strong>ory <strong>and</strong> applications.J Geophys Res 111:C03011 doi:10.01029/02005JC002880DuR<strong>and</strong> MD, Olson RJ, Chisholm SW (2001) Phy<strong>to</strong>plank<strong>to</strong>npopulation dynamics at <strong>the</strong> Bermuda Atlantic time-seriesstation <strong>in</strong> <strong>the</strong> Sargasso Sea. Deep-Sea Res II 48:1983–2003Eppley RW, Chavez FP, Barber RT (1992) St<strong>and</strong><strong>in</strong>g s<strong>to</strong>cks <strong>of</strong>particulate carbon <strong>and</strong> nitrogen <strong>in</strong> <strong>the</strong> equa<strong>to</strong>rial Pacific at150° W. J Geophys Res 97:655–661Gardner WD, Mishonov AV, Richardson MJ (2006) GlobalPOC concent<strong>ratio</strong>ns from <strong>in</strong> situ <strong>and</strong> satellite data. Deep-Sea Res II 53:718–740Geider RJ (1987) Light <strong>and</strong> temperature dependence <strong>of</strong> <strong>the</strong>carbon <strong>to</strong> <strong>chlorophyll</strong> a <strong>ratio</strong> <strong>in</strong> microalgae <strong>and</strong> cyanobacteria:implications for physiology <strong>and</strong> <strong>growth</strong> <strong>of</strong> phy<strong>to</strong>plank<strong>to</strong>n.New Phy<strong>to</strong>l 106:1–34Geider RJ, MacIntyre HL, Kana TM (1997) Dynamic model <strong>of</strong>phy<strong>to</strong>plank<strong>to</strong>n <strong>growth</strong> <strong>and</strong> acclimation: responses <strong>of</strong> <strong>the</strong>balanced <strong>growth</strong> <strong>rate</strong> <strong>and</strong> <strong>the</strong> <strong>chlorophyll</strong> a:carbon <strong>ratio</strong> <strong>to</strong>light, nutrient-limitation <strong>and</strong> temperature. Mar Ecol ProgSer 148:187–200Goericke R, Welschmeyer NA (1998) Response <strong>of</strong> SargassoSea phy<strong>to</strong>plank<strong>to</strong>n biomass, <strong>growth</strong> <strong>rate</strong>s <strong>and</strong> primaryproduction <strong>to</strong> <strong>sea</strong>sonally vary<strong>in</strong>g physical forc<strong>in</strong>g. J Plank<strong>to</strong>nRes 20:2223–2249Grob C, Ulloa O, Claustre H, Huot Y, Alarcon G, Marie D(2007) Contribution <strong>of</strong> picoplank<strong>to</strong>n <strong>to</strong> <strong>the</strong> <strong>to</strong>tal particulateorganic carbon concent<strong>ratio</strong>n <strong>in</strong> <strong>the</strong> eastern South Pacific.Biogeosciences 4:836–852Holm-Hansen O, Lorenzen CJ, Holmes JDH (1965) Fluorometricdeterm<strong>in</strong>ation <strong>of</strong> <strong>chlorophyll</strong>. J Cons Int Explor Mer30:3–15Koenker R, Bassett G (1978) Regression quantiles. Econometrica46:33–50Kun<strong>in</strong>ao T, Santiwat P, Kazuhiko I, Shigeru M (2000) <strong>Carbon</strong>,nitrogen, phosphorus, <strong>and</strong> <strong>chlorophyll</strong> a content <strong>of</strong> <strong>the</strong>large dia<strong>to</strong>m Cosc<strong>in</strong>odiscus wailesii <strong>and</strong> its abundance <strong>in</strong><strong>the</strong> Se<strong>to</strong> Inl<strong>and</strong> Sea, Japan. Fish Sci 66:509–514L<strong>and</strong>ry MR, Hassett RP (1982) Estimat<strong>in</strong>g <strong>the</strong> graz<strong>in</strong>g impac<strong>to</strong>f mar<strong>in</strong>e micro-zooplank<strong>to</strong>n. Mar Biol 67:283–288L<strong>and</strong>ry MR, Peterson WK, Lorenzen CJ (1995) Zooplank<strong>to</strong>ngraz<strong>in</strong>g, phy<strong>to</strong>plank<strong>to</strong>n <strong>growth</strong>, <strong>and</strong> export flux: <strong>in</strong>ferencesfrom <strong>chlorophyll</strong> tracer methods. ICES J Mar Sci52:337–345Legendre L, Michaud J (1999) Chlorophyll a <strong>to</strong> estimate <strong>the</strong>particulate organic carbon available as food <strong>to</strong> large zooplank<strong>to</strong>n<strong>in</strong> <strong>the</strong> euphotic zone <strong>of</strong> oceans. J Plank<strong>to</strong>n Res21:2067–2083Loisel H, Nicolas JM, Deschamps PY, Frou<strong>in</strong> R (2002) Seasonal<strong>and</strong> <strong>in</strong>ter-annual variability <strong>of</strong> <strong>the</strong> particulate matter<strong>in</strong> <strong>the</strong> global ocean. Geophys Res Lett 29:2196 doi:10.1029/2002GL015948Malone TC (1982) Phy<strong>to</strong>plank<strong>to</strong>n pho<strong>to</strong>syn<strong>the</strong>sis <strong>and</strong> carbonspecific<strong>growth</strong>: light-satu<strong>rate</strong>d <strong>rate</strong>s <strong>in</strong> a nutrient-richenvironment. Limnol Oceanogr 27:226–235Morel A (1988) Optical model<strong>in</strong>g <strong>of</strong> <strong>the</strong> upper ocean <strong>in</strong> relation<strong>to</strong> its biogenous matter content (case 1 water). J GeophysRes 93:10,749–10,768O’Reilly JE, Mari<strong>to</strong>rena S, Siegel DA, O’Brien MC <strong>and</strong> o<strong>the</strong>rs(2000) Ocean color <strong>chlorophyll</strong> a algorithms for SeaWiFS,OC2 <strong>and</strong> OC4: Version 4. In: Hooker SB, Fires<strong>to</strong>ne ER(eds) SeaWiFS postlaunch calib<strong>ratio</strong>n <strong>and</strong> validationanalyses (Part 3). NASA Technical Memor<strong>and</strong>um 2000-206892, 10, NASA GSFC, Greenbelt, MA, p 9–23Oubelkheir K, Claustre H, Sci<strong>and</strong>ra A, Bab<strong>in</strong> M (2005) Biooptical<strong>and</strong> biogeochemical properties <strong>of</strong> differenttrophic regimes <strong>in</strong> oceanic waters. Limnol Oceanogr 50:1795–1809Platt T, Gallegos CL, Harrison WG (1980) Pho<strong>to</strong><strong>in</strong>hibition <strong>of</strong>pho<strong>to</strong>syn<strong>the</strong>sis <strong>in</strong> natural assemblages <strong>of</strong> mar<strong>in</strong>e phy<strong>to</strong>plank<strong>to</strong>n.J Mar Res 38:687–701Platt T, Sathyendranath S, Forget MH, White GN III <strong>and</strong> o<strong>the</strong>rs(2008) Ope<strong>ratio</strong>nal mode estimation <strong>of</strong> primary productionat large geographical scales. Remote Sens Environ112:3427–3448Rogers W (1992) Quantile regression st<strong>and</strong>ard errors. StataTech Bull 2:133–137Sathyendranath S, Platt T (2007) Spectral effects <strong>in</strong> bio-opticalcontrol on <strong>the</strong> ocean system. Oceanologia 49:5–39Sathyendranath S, Platt T, Forget MH (2007) Oceanic primaryproduction: comparison <strong>of</strong> models. IEEE Oceans-07 ConferenceProceed<strong>in</strong>gs, IEEE, AberdeenSchoemann V, Becquevort S, Stefels J, Rous<strong>sea</strong>u W, LancelotC (2005) Phaeocystis blooms <strong>in</strong> <strong>the</strong> global ocean <strong>and</strong> <strong>the</strong>ircontroll<strong>in</strong>g mechanisms: a review. J Sea Res 53:43–66Steele JH, Baird IE (1961) Relations between primary production,<strong>chlorophyll</strong> <strong>and</strong> particulate carbon. Limnol Oceanogr6:68–78
84Mar Ecol Prog Ser 383: 73–84, 2009Strickl<strong>and</strong> JDH (1960) Measur<strong>in</strong>g <strong>the</strong> production <strong>of</strong> mar<strong>in</strong>ephy<strong>to</strong>plank<strong>to</strong>n. Bull Fish Res Board Can 122:1–172Stuart V, Head E (2005) The BIO method. In: Hooker SB (ed)The 2nd SeaWiFS HPLC analysis round-rob<strong>in</strong> experiment(SeaHARRE-2). NASA/TM 2005-212785, Greenbelt, MD,p 112Townsend DW, Thomas M (2002) Spr<strong>in</strong>gtime nutrient <strong>and</strong>phy<strong>to</strong>plank<strong>to</strong>n dynamics on Georges Bank. Mar Ecol ProgSer 228:57–74Veldhuis MJW, Kraay GW (2004) Phy<strong>to</strong>plank<strong>to</strong>n <strong>in</strong> <strong>the</strong> subtropicalAtlantic Ocean: <strong>to</strong>wards a better assessment <strong>of</strong>biomass <strong>and</strong> composition. Deep-Sea Res I 51:507–530Edi<strong>to</strong>rial responsibility: Ala<strong>in</strong> Véz<strong>in</strong>a,Dartmouth, CanadaVeldhuis MJW, Timmermans KR, Croot P, van der Wagt B(2005) Picophy<strong>to</strong>plank<strong>to</strong>n; a comparative study <strong>of</strong> <strong>the</strong>irbiochemical composition <strong>and</strong> pho<strong>to</strong>syn<strong>the</strong>tic properties.J Sea Res 53:7–24Welschmeyer NA, Lorenzen CJ (1984) <strong>Carbon</strong>-14 label<strong>in</strong>g <strong>of</strong>phy<strong>to</strong>plank<strong>to</strong>n carbon <strong>and</strong> <strong>chlorophyll</strong> a carbon: determ<strong>in</strong>ation<strong>of</strong> specific <strong>growth</strong> <strong>rate</strong>s. Limnol Oceanogr 29:135–145Welschmeyer NA, Lorenzen CJ (1985) Chlorophyll budgets:zooplank<strong>to</strong>n graz<strong>in</strong>g <strong>and</strong> phy<strong>to</strong>plank<strong>to</strong>n <strong>growth</strong> <strong>in</strong> a tempe<strong>rate</strong>fjord <strong>and</strong> <strong>the</strong> Central Pacific Gyres. LimnolOceanogr 30:1–21Submitted: June 3, 2008; Accepted: March 5, 2009Pro<strong>of</strong>s received from author(s): May 1, 2009


