Spring - Gull Chain of Lakes Association
Spring - Gull Chain of Lakes Association
Spring - Gull Chain of Lakes Association

Create successful ePaper yourself
Turn your PDF publications into a flip-book with our unique Google optimized e-Paper software.
3<br />
F I N A L R E P O R T<br />
O F W A T E R Q U A L I T Y S T U D I E S Robert Eliason<br />
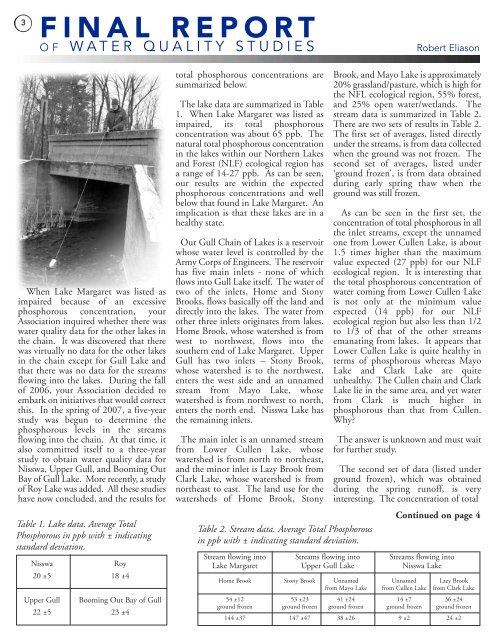
When Lake Margaret was listed as<br />
impaired because <strong>of</strong> an excessive<br />
phosphorous concentration, your<br />
<strong>Association</strong> inquired whether there was<br />
water quality data for the other lakes in<br />
the chain. It was discovered that there<br />
was virtually no data for the other lakes<br />
in the chain except for <strong>Gull</strong> Lake and<br />
that there was no data for the streams<br />
flowing into the lakes. During the fall<br />
<strong>of</strong> 2006, your <strong>Association</strong> decided to<br />
embark on initiatives that would correct<br />
this. In the spring <strong>of</strong> 2007, a five-year<br />
study was begun to determine the<br />
phosphorous levels in the streams<br />
flowing into the chain. At that time, it<br />
also committed itself to a three-year<br />
study to obtain water quality data for<br />
Nisswa, Upper <strong>Gull</strong>, and Booming Out<br />
Bay <strong>of</strong> <strong>Gull</strong> Lake. More recently, a study<br />
<strong>of</strong> Roy Lake was added. All these studies<br />
have now concluded, and the results for<br />
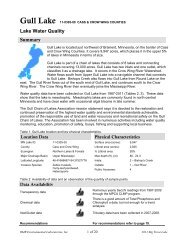
Table 1. Lake data. Average Total<br />
Phosphorous in ppb with ± indicating<br />
standard deviation.<br />
Nisswa Roy<br />
20 ±5 18 ±4<br />
Upper <strong>Gull</strong> Booming Out Bay <strong>of</strong> <strong>Gull</strong><br />
22 ±5 23 ±4<br />
total phosphorous concentrations are<br />
summarized below.<br />
The lake data are summarized in Table<br />
1. When Lake Margaret was listed as<br />
impaired, its total phosphorous<br />
concentration was about 65 ppb. The<br />
natural total phosphorous concentration<br />
in the lakes within our Northern <strong>Lakes</strong><br />
and Forest (NLF) ecological region has<br />
a range <strong>of</strong> 14-27 ppb. As can be seen,<br />
our results are within the expected<br />
phosphorous concentrations and well<br />
below that found in Lake Margaret. An<br />
implication is that these lakes are in a<br />
healthy state.<br />
Our <strong>Gull</strong> <strong>Chain</strong> <strong>of</strong> <strong>Lakes</strong> is a reservoir<br />
whose water level is controlled by the<br />
Army Corps <strong>of</strong> Engineers. The reservoir<br />
has five main inlets - none <strong>of</strong> which<br />
flows into <strong>Gull</strong> Lake itself. The water <strong>of</strong><br />
two <strong>of</strong> the inlets, Home and Stony<br />
Brooks, flows basically <strong>of</strong>f the land and<br />
directly into the lakes. The water from<br />
other three inlets originates from lakes.<br />
Home Brook, whose watershed is from<br />
west to northwest, flows into the<br />
southern end <strong>of</strong> Lake Margaret. Upper<br />
<strong>Gull</strong> has two inlets – Stony Brook,<br />
whose watershed is to the northwest,<br />
enters the west side and an unnamed<br />
stream from Mayo Lake, whose<br />
watershed is from northwest to north,<br />
enters the north end. Nisswa Lake has<br />
the remaining inlets.<br />
The main inlet is an unnamed stream<br />
from Lower Cullen Lake, whose<br />
watershed is from north to northeast,<br />
and the minor inlet is Lazy Brook from<br />
Clark Lake, whose watershed is from<br />
northeast to east. The land use for the<br />
watersheds <strong>of</strong> Home Brook, Stony<br />
Table 2. Stream data. Average Total Phosphorous<br />
in ppb with ± indicating standard deviation.<br />
Brook, and Mayo Lake is approximately<br />
20% grassland/pasture, which is high for<br />
the NFL ecological region, 55% forest,<br />
and 25% open water/wetlands. The<br />
stream data is summarized in Table 2.<br />
There are two sets <strong>of</strong> results in Table 2.<br />
The first set <strong>of</strong> averages, listed directly<br />
under the streams, is from data collected<br />
when the ground was not frozen. The<br />
second set <strong>of</strong> averages, listed under<br />
‘ground frozen’, is from data obtained<br />
during early spring thaw when the<br />
ground was still frozen.<br />
As can be seen in the first set, the<br />
concentration <strong>of</strong> total phosphorous in all<br />
the inlet streams, except the unnamed<br />
one from Lower Cullen Lake, is about<br />
1.5 times higher than the maximum<br />
value expected (27 ppb) for our NLF<br />
ecological region. It is interesting that<br />
the total phosphorous concentration <strong>of</strong><br />
water coming from Lower Cullen Lake<br />
is not only at the minimum value<br />
expected (14 ppb) for our NLF<br />
ecological region but also less than 1/2<br />
to 1/3 <strong>of</strong> that <strong>of</strong> the other streams<br />
emanating from lakes. It appears that<br />
Lower Cullen Lake is quite healthy in<br />
terms <strong>of</strong> phosphorous whereas Mayo<br />
Lake and Clark Lake are quite<br />
unhealthy. The Cullen chain and Clark<br />
Lake lie in the same area, and yet water<br />
from Clark is much higher in<br />
phosphorous than that from Cullen.<br />
Why?<br />
The answer is unknown and must wait<br />
for further study.<br />
The second set <strong>of</strong> data (listed under<br />
ground frozen), which was obtained<br />
during the spring run<strong>of</strong>f, is very<br />
interesting. The concentration <strong>of</strong> total<br />
Continued on page 4<br />
Stream flowing into Streams flowing into Streams flowing into<br />
Lake Margaret Upper <strong>Gull</strong> Lake Nisswa Lake<br />
Home Brook Stony Brook Unnamed Unnamed Lazy Brook<br />
from Mayo Lake from Cullen Lake from Clark Lake<br />
54 ±12 53 ±23 41 ±24 14 ±7 36 ±24<br />
ground frozen ground frozen ground frozen ground frozen ground frozen<br />
144 ±37 147 ±47 38 ±26 9 ±2 24 ±2