

Making Every Day Count - Teens
Making Every Day Count - Teens
Making Every Day Count - Teens

Create successful ePaper yourself
Turn your PDF publications into a flip-book with our unique Google optimized e-Paper software.
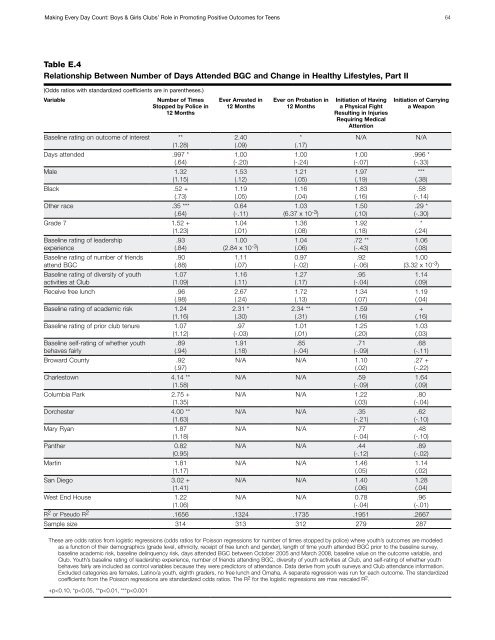
<strong>Making</strong> <strong>Every</strong> <strong>Day</strong> <strong>Count</strong>: Boys & Girls Clubs’ Role in Promoting Positive Outcomes for <strong>Teens</strong> 64Table E.4Relationship Between Number of <strong>Day</strong>s Attended BGC and Change in Healthy Lifestyles, Part II(Odds ratios with standardized coefficients are in parentheses.)VariableNumber of TimesStopped by Police in12 MonthsEver Arrested in12 MonthsEver on Probation in12 MonthsInitiation of Havinga Physical FightResulting in InjuriesRequiring MedicalAttentionInitiation of Carryinga WeaponBaseline rating on outcome of interest **(1.28)<strong>Day</strong>s attended .997 *(.64)Male 1.32(1.15)Black .52 +(.73)Other race .35 ***(.64)Grade 7 1.52 +(1.23)Baseline rating of leadershipexperienceBaseline rating of number of friendsattend BGCBaseline rating of diversity of youthactivities at Club.93(.84).90(.88)1.07(1.09)Receive free lunch .96(.98)Baseline rating of academic risk 1.24(1.16)Baseline rating of prior club tenure 1.07(1.12)Baseline self-rating of whether youthbehaves fairly.89(.94)Broward <strong>Count</strong>y .92(.97)Charlestown 4.14 **(1.58)Columbia Park 2.75 +(1.35)Dorchester 4.00 **(1.63)Mary Ryan 1.87(1.18)Panther 0.82(0.95)Martin 1.81(1.17)San Diego 3.02 +(1.41)West End House 1.22(1.06)2.40(.09)1.00(-.20)1.53(.12)1.19(.05)0.64(-.11)1.04(.01)1.00(2.84 x 10 -3 )1.11(.07)1.16(.11)2.67(.24)2.31 *(.30).97(-.03)1.91(.18)*(.17)1.00(-.24)1.21(.05)1.16(.04)1.03(6.37 x 10 -3 )1.36(.08)1.04(.06)0.97(-.02)1.27(.17)1.72(.13)2.34 **(.31)1.01(.01).85(-.04)N/A1.00(-.07)1.97(.19)1.83(.16)1.50(.10)1.92(.18).72 **(-.43).92(-.06).95(-.04)1.34(.07)1.59(.16)1.25(.20).71(-.09)N/A N/A 1.10(.02)N/A N/A .59(-.09)N/A N/A 1.22(.03)N/A N/A .35(-.21)N/A N/A .77(-.04)N/A N/A .44(-.12)N/A N/A 1.46(.05)N/A N/A 1.40(.06)N/A N/A 0.78(-.04)N/A.996 *(-.33)***(.38).58(-.14).29 *(-.30)*(.24)1.06(.08)1.00(3.32 x 10 -3 )1.14(.09)1.19(.04)+(.16)1.03(.03).68(-.11).27 +(-.22)1.64(.09).80(-.04).62(-.10).48(-.10).89(-.02)1.14(.02)1.28(.04).96(-.01)R 2 or Pseudo R 2 .1656 .1324 .1735 .1951 .2667Sample size 314 313 312 279 287These are odds ratios from logistic regressions (odds ratios for Poisson regressions for number of times stopped by police) where youth’s outcomes are modeledas a function of their demographics (grade level, ethnicity, receipt of free lunch and gender), length of time youth attended BGC prior to the baseline survey,baseline academic risk, baseline delinquency risk, days attended BGC between October 2005 and March 2008, baseline value on the outcome variable, andClub. Youth’s baseline rating of leadership experience, number of friends attending BGC, diversity of youth activities at Club, and self-rating of whether youthbehaves fairly are included as control variables because they were predictors of attendance. Data derive from youth surveys and Club attendance information.Excluded categories are females, Latino/a youth, eighth graders, no free lunch and Omaha. A separate regression was run for each outcome. The standardizedcoefficients from the Poisson regressions are standardized odds ratios. The R 2 for the logistic regressions are max rescaled R 2 .+p