Annual Report 2006 – Financial Section - Quilvest
Annual Report 2006 – Financial Section - Quilvest
Annual Report 2006 – Financial Section - Quilvest

You also want an ePaper? Increase the reach of your titles
YUMPU automatically turns print PDFs into web optimized ePapers that Google loves.
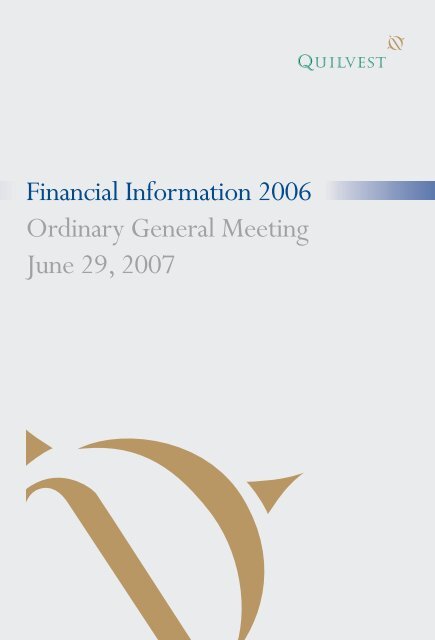
<strong>Financial</strong> Information <strong>2006</strong><br />
Ordinary General Meeting<br />
June 29, 2007
2<br />
Table of Contents<br />
<strong>Report</strong> of the Group Auditors to the shareholders<br />
on the Consolidated <strong>Financial</strong> Statements 3<br />
Consolidated financial statements of the Group 4<br />
<strong>Report</strong> of the Statutory Auditors to the shareholders<br />
on the <strong>Annual</strong> Accounts 52<br />
<strong>Annual</strong> accounts of the Parent Company 53<br />
Earnings and Allocations 58
<strong>Report</strong> of the Group Auditors<br />
to the shareholders<br />
on the Consolidated <strong>Financial</strong> Statements<br />
<strong>Report</strong> on the consolidated financial statements<br />
Following our appointment by the General Meeting of the Shareholders dated June 22, <strong>2006</strong>, we have audited the accompanying consolidated<br />
financial statements of <strong>Quilvest</strong> S.A. and its subsidiary companies (”<strong>Quilvest</strong> Group”), which comprise the consolidated balance sheet as<br />
at December 31, <strong>2006</strong> and the consolidated income statement, consolidated statement of changes in equity and consolidated cash flow statement<br />
for the year then ended, and a summary of significant accounting policies and other explanatory notes.<br />
Board of directors’ responsibility for the consolidated financial statements<br />
The board of directors is responsible for the preparation and fair presentation of these consolidated financial statements in accordance with<br />
International <strong>Financial</strong> <strong>Report</strong>ing Standards as adopted by the EU. This responsibility includes: designing, implementing and maintaining<br />
internal control relevant to the preparation and fair presentation of consolidated financial statements that are free from material misstatement,<br />
whether due to fraud or error; selecting and applying appropriate accounting policies; and making accounting estimates that are reasonable<br />
in the circumstances.<br />
Responsibility of the Group auditors<br />
Our responsibility is to express an opinion on these consolidated financial statements based on our audit.We conducted our audit in accordance<br />
with International Standards on Auditing as adopted by the Luxembourg ”Institut des Réviseurs d’Entreprises”.Those standards require<br />
that we comply with ethical requirements and plan and perform the audit to obtain reasonable assurance whether the consolidated financial<br />
statements are free from material misstatement.<br />
An audit involves performing procedures to obtain audit evidence about the amounts and disclosures in the consolidated financial statements.<br />
The procedures selected depend on the judgment of the Group auditors, including the assessment of the risks of material misstatement of<br />
the consolidated financial statements, whether due to fraud or error. In making those risk assessments, the Group auditors consider internal<br />
control relevant to the entity’s preparation and fair presentation of the consolidated financial statements in order to design audit procedures<br />
that are appropriate in the circumstances, but not for the purpose of expressing an opinion on the effectiveness of the entity’s internal control.<br />
An audit also includes evaluating the appropriateness of accounting policies used and the reasonableness of accounting estimates made by the<br />
board of directors, as well as evaluating the overall presentation of the consolidated financial statements.We believe that the audit evidence<br />
we have obtained is sufficient and appropriate to provide a basis for our audit opinion.<br />
Opinion<br />
In our opinion, the consolidated financial statements give a true and fair view of the consolidated financial position of <strong>Quilvest</strong> Group as of<br />
December 31, <strong>2006</strong>, and of its financial performance and its consolidated cash flows for the year then ended in accordance with International<br />
<strong>Financial</strong> <strong>Report</strong>ing Standards as adopted by the EU.<br />
Other matter<br />
Supplementary information included in the annual report has been reviewed in the context of our mandate but has not been subject to specific<br />
audit procedures carried out in accordance with the standards described above. Consequently, we express no opinion on such information.<br />
However, we have no observation to make concerning such information in the context of the consolidated financial statements taken as<br />
a whole.<br />
<strong>Report</strong> on other legal and regulatory requirements<br />
The consolidated management report, which is the responsibility of the board of directors, is in accordance with the consolidated financial<br />
statements.<br />
Luxembourg, May 31, 2007<br />
KPMG Audit S.à r.l. KPMG Ltd<br />
John Li Jane Hallauer-Wong<br />
Partner Partner<br />
Réviseur d’Entreprises Chartered Certified Accountant (United Kingdom)<br />
31, Allée Scheffer<br />
L-2520 Luxembourg<br />
3
Consolidated Balance Sheet<br />
for the financial years ended December 31, <strong>2006</strong> and 2005 in $ '000<br />
Assets<br />
Notes <strong>2006</strong> 2005<br />
Cash and cash equivalents 3 159,882 82,250<br />
Income tax receivable 1,331 4<br />
Loans and advances to bank customers 4 103,297 82,862<br />
Loans and advances to banks 3,505 -<br />
Other receivables, accrued income and prepaid expenses 5 32,491 23,166<br />
Investments 6 557,670 541,079<br />
Property, plant and equipment 7 15,612 12,168<br />
Investment property 8 8,049 6,952<br />
Intangible assets 9 15,803 13,068<br />
Investments in associates and non consolidated affiliates 10 1,482 1,849<br />
Deferred tax assets 11 201 14<br />
Total assets 899,323 763,412<br />
The accompanying notes form an integral part of these consolidated financial statements.<br />
4
Consolidated Balance Sheet (continued)<br />
for the financial years ended December 31, <strong>2006</strong> and 2005 in $ '000<br />
Liabilities and equity<br />
Notes <strong>2006</strong> 2005<br />
<strong>Financial</strong> liabilities held for trading 6 825 1,293<br />
Income tax payable 1,948 2,299<br />
Deposits from banks 12 27,129 4,773<br />
Deposits from bank customers 13 122,331 83,863<br />
Other liabilities, deferred income and accrued expenses 14 53,097 37,301<br />
Interest-bearing liabilities 15 47,165 58,345<br />
Employee benefit obligation 16 586 1,253<br />
Provisions 17 369 336<br />
Deferred tax liabilities 11 7,606 6,537<br />
Total liabilities 261,056 196,000<br />
Share capital 18 36,500 36,500<br />
Share premium 20,277 22,137<br />
Treasury shares 19 (1,348) (816)<br />
Reserves 20 6,167 (8,939)<br />
Retained earnings 20 484,807 417,592<br />
Profit for the year - Group share 67,951 73,557<br />
Total equity attributable to shareholders of the parent 614,354 540,031<br />
Minority Interest 21 23,913 27,381<br />
Total equity 638,267 567,412<br />
Total liabilities and equity 899,323 763,412<br />
The accompanying notes form an integral part of these consolidated financial statements.<br />
5
Consolidated Income Statement<br />
for the financial years ended December 31, <strong>2006</strong> and 2005 in $ '000<br />
Notes <strong>2006</strong> 2005<br />
Net income from directly held investments 24 87,268 96,065<br />
Net income from banking activities 25 46,571 41,073<br />
Other operating income 26 17,745 11,943<br />
General administrative expenses 27 (80,451) (62,429)<br />
Depreciation, amortization and impairment losses 28 (1,239) (1,274)<br />
<strong>Financial</strong> income 29 3,953 2,512<br />
<strong>Financial</strong> expenses 30 (5,218) (4,641)<br />
Income from associates 31 696 207<br />
Profit before tax 69,325 83,456<br />
Income tax expense 32 (2,561) (1,801)<br />
Profit for the year 66,764 81,655<br />
Attributable to the Shareholders of the parent 67,951 73,557<br />
Minority interest (1,187) 8,098<br />
Basic earnings per share (in $) 23 10,5 11,4<br />
Diluted earnings per share (in $) 23 10,3 11,2<br />
The accompanying notes form an integral part of these consolidated financial statements.<br />
6
Consolidated Cash flow Statement<br />
for the financial years ended December 31, <strong>2006</strong> and 2005 in $ '000<br />
Notes <strong>2006</strong> 2005<br />
(reperformed)<br />
Operating cash flows directly linked to the Private Equity Business<br />
Acquisition of PE investments (210,669) (118,737)<br />
Proceeds from sale of PE investments 287,044 132,059<br />
Operating cash flows directly linked to the Wealth Management Business<br />
Net interest income 5,942 4,423<br />
Net fee and commission income 35,651 47,334<br />
Cash movements in loans and advances to bank customers (15,370) (10,713)<br />
Cash movements in loans and advances from bank customers 11,671 12,102<br />
Other cash movements related to the Banking Business 515 (1,310)<br />
Other operating cash flow movements<br />
Cash paid to suppliers and employees (59,470) (52,993)<br />
Net cash from other operating activities 2,057 -<br />
Interest received 1,619 3,231<br />
Dividends received 3,292 3,767<br />
Income taxes paid (2,682) (3,364)<br />
Net cash provided by / (used in) operating activities 33 59,600 15,799<br />
Acquisition of investments (53,320) (23,848)<br />
Proceeds from sale of investments 51,531 27,667<br />
Acquisition of investment in associates (1,602) (659)<br />
Proceeds from disposal of investment in associates 497 6<br />
Acquisition of property, plant and equipment (1,410) (1,086)<br />
Proceeds from disposal of property, plant and equipment 37 -<br />
Acquisition of intangible assets (847) (1,167)<br />
Acquisition of subsidiaries, net of cash acquired (5,399) (3,312)<br />
Dividends received - 295<br />
Net cash provided by / (used in) investing activities 33 (10,513) (2,104)<br />
Proceeds from interest bearing liabilities 31,249 611<br />
Repayment of interest-bearing liabilities (37,536) (3,052)<br />
(Decrease)/Increase in Short term financing 39,282 24,880<br />
Repurchase of own shares (532) (567)<br />
Contributions from investors 2,373 2,356<br />
Distributions to investors (1,682) (1,986)<br />
Interest paid (3,115) (776)<br />
Dividends paid (8,202) (7,571)<br />
Net cash provided by / (used in) financing activities 33 21,837 13,895<br />
Net increase / (decrease) in cash and cash equivalents 70,924 27,590<br />
Cash and cash equivalents at beginning of year 82,250 61,563<br />
Effect of exchange rate fluctuations on cash and cash equivalents held 6,708 (6,903)<br />
Cash and cash equivalents at end of year 159,882 82,250<br />
The accompanying notes form an integral part of these consolidated financial statements.<br />
7
Consolidated Statement of Changes in Equity<br />
for the financial years ended December 31, <strong>2006</strong> and 2005<br />
in $ '000 Share Share Treasury Reserves Total Minority Total<br />
Capital Premium Shares & Retained Group Reserves Equity<br />
earnings & Result<br />
Notes 18 19 20<br />
Balance at January 1st, 2005 36,500 22,137 (249) 434,843 493,231 18,933 512,164<br />
Profit for the year - - - 73,557 73,557 8,098 81,655<br />
Exchange differences - - - (19,332) (19,332) (1,379) (20,711)<br />
Total recognized income and expense - - - 54,225 54,225 6,719 60,944<br />
Changes in scope - - - - - 2,384 2,384<br />
Repurchase of own shares - - (567) - (567) - (567)<br />
Capital distributions - - - - - (1,894) (1,894)<br />
Change in minority reserves - - - - - 1,607 1,607<br />
Dividends paid - - - (6,858) (6,858) (368) (7,226)<br />
Balance at December 31st, 2005 36,500 22,137 (816) 482,210 540,031 27,381 567,412<br />
Balance at January 1st, <strong>2006</strong> 36,500 22,137 (816) 482,210 540,031 27,381 567,412<br />
Profit for the year - - - 67,951 67,951 (1,187) 66,764<br />
Gain on property revaluation, net of deferred tax - - - 1,060 1,060 - 1,060<br />
Exchange differences - - - 14,046 14,046 1,117 15,163<br />
Total recognized income and expense - - - 83,057 83,057 (70) 82,987<br />
Changes in scope - - - - - 769 769<br />
Repurchase of own shares - - (532) - (532) - (532)<br />
Capital distributions - - - - - (1,877) (1,877)<br />
Change in minority reserves - - - - - (1,950) (1,950)<br />
Dividends paid - (1,860) - (6,342) (8,202) (340) (8,542)<br />
Balance at December 31st, <strong>2006</strong> 36,500 20,277 (1,348) 558,925 614,354 23,913 638,267<br />
The accompanying notes form an integral part of these consolidated financial statements.<br />
8
Significant Accounting Policies<br />
<strong>Quilvest</strong> S.A. (the Company) is a Luxembourg Holding Company incorporated under the laws of August 10, 1915 and<br />
July 31, 1929 as amended.<br />
The company’s status as a tax exempted billionaire holding company is maintained until December 31, 2010.<br />
The consolidated financial statements were authorized for issue by the Board of Directors on April 25, 2007 and are subject<br />
to approval by the shareholders' meeting of June 29, 2007.<br />
Summary of Activities<br />
The business of <strong>Quilvest</strong> is that of a financial holding company, controlling two sub-holding companies, <strong>Quilvest</strong> Private<br />
Equity Ltd,Tortola, British Virgin Islands, and <strong>Quilvest</strong> Europe SA, Luxembourg.<br />
The business of <strong>Quilvest</strong> Private Equity Ltd and subsidiaries is that of an investment holding company, investing both<br />
directly and indirectly.The investments include direct equity and debt investments in private equity made in the United<br />
States, Europe, South-East Asia and Latin America.<br />
<strong>Quilvest</strong> Europe SA, Luxembourg invests in European markets and controls <strong>Quilvest</strong> France and its subsidiaries. <strong>Quilvest</strong><br />
France makes public and private investments in France. Two of the subsidiaries of <strong>Quilvest</strong> Europe, namely Société<br />
Internationale de Finance (SIF) in Zurich, Switzerland and <strong>Quilvest</strong> Banque Privée (QBP) in Paris, France, are involved in<br />
banking activities.<br />
SIF is a licensed Securities Dealer, and its principal business is the co-ordination and administration of globally invested<br />
assets. It is not directly engaged in asset management but provides investment advisory services.<br />
<strong>Quilvest</strong> Banque Privée is a bank, and its main activities consist of asset management and investment advisory services.<br />
Basis of Presentation and statement of compliance<br />
Since the year 2005, the consolidated financial statements are prepared in accordance with International <strong>Financial</strong><br />
<strong>Report</strong>ing Standards (IFRS).<br />
The consolidated financial statements cover the financial year from January 1, <strong>2006</strong> till December 31, <strong>2006</strong> and are presented<br />
with their comparative figures of previous year. The accounting policies are consistent between the presented<br />
periods. Certain comparative amounts have been reclassified to conform with the current year’s presentation, the most<br />
important reclassifications concerning the reclassification of USD 30 million from Deposits from banks to Interest-bearing<br />
liabilities and the reclassification of USD 4 million from Associates to Investments.<br />
The consolidated financial statements are prepared and presented in US Dollars, the Group's functional currency and<br />
rounded to the nearest thousand.They are prepared on the historical cost basis except for the following assets and liabilities<br />
which are stated at their fair value : derivative financial instruments, financial investments at fair value through profit<br />
and loss, investment property as well as own-used property.<br />
9
Significant Accounting Policies (continued)<br />
Basis of Consolidation<br />
Subsidiaries<br />
Subsidiaries are those enterprises controlled by the Company. Control exists when the Company has the power, directly<br />
or indirectly, to govern the financial and operating policies of an enterprise so as to obtain benefits from its activities.The<br />
financial statements of subsidiaries are included in the consolidated financial statements from the date that control commences<br />
until the date that control ceases.<br />
Associates<br />
Associates are those enterprises in which the Group has significant influence, but not control, over the financial and operating<br />
policies.The consolidated financial statements include the Group’s share of the total recognized profits and losses<br />
of associates on an equity accounting basis (equity method), from the date that significant influence commences until the<br />
date that significant influence ceases.When an associate makes losses, the Group’s share of losses is recognized until the<br />
carrying amount of the associate is reduced to nil. Recognition of further losses is discontinued unless the Group has incurred<br />
an obligation to cover such losses.<br />
Transactions Eliminated on Consolidation<br />
Intra-group balances and transactions, and any unrealized results arising from intra-group transactions, are eliminated in<br />
preparing the consolidated financial statements.<br />
Unrealized gains arising from transactions with associates are eliminated to the extent of the Group’s interest in the enterprise,<br />
as an adjustment to the carrying amount of the investment. Unrealized losses are eliminated in the same way as<br />
unrealized gains, unless there is evidence of impairment, giving rise to additional write-off.<br />
Foreign Currencies<br />
Foreign Currency Translation<br />
Transactions in foreign currencies are translated at the foreign exchange rate ruling at the date of the transaction or at average<br />
rates that approximate the spot rates of a number of transactions. Monetary assets and liabilities denominated in<br />
foreign currencies at the balance sheet date are translated at the foreign exchange rate ruling at that date. Foreign exchange<br />
differences arising on translation are recognized in the income statement.<br />
<strong>Financial</strong> Statements of Foreign Operations<br />
Assets and liabilities of foreign subsidiaries, including goodwill and fair value adjustments arising on consolidation, are<br />
translated to US-Dollars at foreign exchange rates ruling at the balance sheet date.The revenues and expenses of foreign<br />
subsidiaries are translated to US-Dollars at average rates. Exchange differences arising on translation of foreign entities are<br />
recognized directly in shareholders' equity.<br />
10
Significant Accounting Policies (continued)<br />
Currency exchange rates<br />
The following exchange rates were used for translating Euros, Swiss Francs and British Pounds, which are the most important<br />
foreign currencies used in the Group.<br />
USD/EUR CHF/USD USD/GBP<br />
Year-end 2004 0,73570 1,13710 0,52086<br />
Average 2005 0,80303 1,25196 NA<br />
Year-end 2005 0,84531 1,31470 0,58032<br />
Average <strong>2006</strong> 0,79615 1,24883 0,53987<br />
Year-end <strong>2006</strong> 0,75821 1,21990 0,51101<br />
Cash and Cash Equivalents<br />
Cash and cash equivalents are comprised of cash in hand, postal and bank accounts as well as short-term deposits with an<br />
original maturity of less than 90 days.<br />
Loans and advances to/from banks and bank customers and other receivables/liabilities<br />
The loans, advances, receivables and liabilities are initially recognized at nominal value. In subsequent periods, they are<br />
measured at their recoverable amounts, which approximate amortized cost.An impairment test is applied at each closing<br />
date on loans and advances by assessing their contractual terms to specific counterparty- and country- risk exposure.<br />
Impairment losses and reversals of impairment losses are recognized in the income statement.<br />
<strong>Financial</strong> Investments and Fair Values<br />
The Group's investments primarily relate to private equity investments. Investments are stated at fair value on an itemby-item<br />
basis, as determined by the Investment Manager and approved by the Board of Directors. Fair value is defined as<br />
the estimated amount for which an asset could be exchanged between knowledgeable, willing parties in an arm's length<br />
transaction. Options and similar rights attached to the investments are also considered in determining fair value.<br />
If <strong>Quilvest</strong>'s share in ownership interest or voting rights exceeds 20%, then, in accordance with the scope exclusion of IAS<br />
28, those investments are upon initial recognition classified as "designated as fair value through profit and loss" in accordance<br />
with IAS 39.<br />
According to <strong>Quilvest</strong>'s investment strategy, all in-house managed financial assets (equity and debt instruments) and their<br />
performance are evaluated on a fair value basis and are designated upon initial recognition at fair value through the profit<br />
and loss accounts. Any resulting gains or losses from these investments are recognized in the income statement.The company<br />
allocated all its investments to the financial assets at fair value through profit and loss.<br />
11
Significant Accounting Policies (continued)<br />
Listed investments<br />
The fair value of listed investments is based on stock price as per the relevant stock exchange at year end. Estimated future<br />
selling costs are not deducted.<br />
Unlisted equity securities<br />
The fair value of unlisted equity securities is determined by applying the entry earning multiple to the estimated EBITDA<br />
less net debt of the underlying investee companies, unless there are indications that another valuation technique should be<br />
applied. Indicators for other valuation techniques include recent arm's length marked transactions, reference to the current<br />
fair value of another instrument that is substantially the same, or prices obtained in actual market transactions.<br />
Because of inherent uncertainties of valuation, the value of investments and any related value adjustments may differ significantly<br />
from the amounts that would have been used had an active market for the investments existed, and the difference<br />
could be material.<br />
Third party funds<br />
The fair value of third party funds is based on the annual financial statements prepared by the underlying funds which normally<br />
have year end on December 31st. If the annual financial statements at December 31st are not available, the fair value<br />
will be determined based on the most recent financial statements, adjusted for cash flows.<br />
<strong>Financial</strong> assets and liabilities held for trading<br />
The Group slows under this category exclusively derivatives.They are initially recognized at fair value. Subsequent to initial<br />
recognition all derivatives are stated at fair value at the balance sheet date. Gains and losses on remeasurement of derivatives<br />
are recognized in the income statement.<br />
The fair value of financial assets and liabilities held for trading is their quoted price at the balance sheet date.<br />
Loans and receivables<br />
Loans and receivables are non-derivative financial assets with fixed or determinable payments that are not quoted in an<br />
active market. Loans and receivables are initially recognized at fair value.After initial recognition loans and receivables are<br />
measured at amortized cost using the effective interest rate.<br />
12
Significant Accounting Policies (continued)<br />
Property, Plant and Equipment<br />
Property, plant and equipment are stated at cost less accumulated depreciation and impairment losses, except the buildings<br />
which are revalued. Subsequent expenditures are capitalized as separate assets, only when it is probable that future<br />
economic benefits associated with an item will flow to the Company and the cost of the item can be measured reliably.All<br />
other repairs and maintenance are charged to the income statement as expenses as they are incurred.<br />
<strong>Quilvest</strong> Group capitalizes all purchases equal to or exceeding USD 5,000.<br />
Depreciation is charged to the income statement on a straight-line basis over the estimated useful lives of property, plant<br />
and equipment. Land is revalued but not depreciated.The estimated useful lives are as follows:<br />
- Buildings 50 years<br />
- Fixtures and Fittings 2 - 10 years<br />
- Cars 2-5 years<br />
- EDP 3 years<br />
The assets' residual values and useful lives are reviewed and adjusted, if appropriate, at each balance sheet date. Own-used<br />
buildings are carried at a revalued amount, which is the fair value at the date of revaluation less any subsequent accumulated<br />
depreciation and subsequent accumulated impairment losses. Any surplus arising on the revaluation is recognized<br />
directly in the revaluation reserves within equity. If the fair value of the building is decreased as result of a revaluation, the<br />
decrease is recognized in the income statement only if the decrease exceeds the amount previously recognized in equity.<br />
Investment Property<br />
Investment property is mainly held for rental income or for capital appreciation. Investment property is measured at fair<br />
value, with changes in fair value recognized in the income statement.<br />
Intangible assets<br />
Intangible assets, except for goodwill, are stated at purchase price, less accumulated amortization.<br />
Goodwill<br />
Goodwill arising on an acquisition represents the excess of the cost of the acquisition over the fair value of the net identifiable<br />
assets acquired. Goodwill is tested yearly for impairment and is carried at cost less accumulated impairment losses.<br />
Moreover IAS 36 (§24 and 25) prohibits since <strong>2006</strong> the reversal of impairments.<br />
Other intangible assets<br />
Software acquired by the Group is stated at cost less accumulated amortization and impairment losses. It is amortized over<br />
2-5 years on a straight-line basis.<br />
The Group does not have any internally generated intangible assets.<br />
13
Significant Accounting Policies (continued)<br />
Impairment<br />
The carrying amounts of the Group’s property, plant and equipment, intangible assets, investments in associates and other<br />
financial assets are reviewed at each balance sheet date to determine whether there is any indication of impairment. If any<br />
such indication exists, the asset’s recoverable amount, being the greater of its fair value less costs to sell and its value in<br />
use, is estimated.<br />
Interest-bearing Liabilities<br />
Interest-bearing liabilities are recognized initially at cost, being the fair value of the consideration received less attributable<br />
transaction costs. Subsequent to initial recognition, interest-bearing liabilities are measured at amortized cost with any<br />
differences between cost and redemption value being recognized in the income statement over the period of the liabilities<br />
on an effective interest basis.<br />
Convertible Bonds<br />
<strong>Quilvest</strong> S.A. issued in 2003 a convertible loan that can be converted to share capital at a fixed predetermined conversion<br />
ratio at the option of the holder at the maturity date of June 30, 2008.This loan is accounted for as a compound financial<br />
instrument, net of attributable transaction costs.The equity component of the convertible loan is calculated as the excess<br />
of the issue proceeds over the present value of the future interest and principal payments, discounted at the market rate<br />
of interest applicable to similar liabilities that do not have a conversion option.This component is included in equity.The<br />
interest expense recognized in the income statement is calculated using the effective interest rate method.<br />
Employee benefit obligations<br />
The Group sponsors pension plans according to the national regulations of the countries in which it operates.The significant<br />
pension plans in France and Switzerland qualify as defined benefit plans under IAS 19.The respective employee benefit<br />
costs are determined in accordance with the Projected Unit Credit Method.Actuarial calculations are conducted on an<br />
annual basis. Any excess of the defined benefit obligation over the fair value of plan assets is initially recognized and presented<br />
under employee benefit obligations. A pension asset is recognized only to the extent that it represents economic<br />
benefits in the form of refunds or reductions in future contributions. Actuarial gains and losses arising from subsequent<br />
calculations are recognized to the extent that they exceed 10% of the greater of the defined benefit and the fair value of<br />
the plan assets. The amount exceeding this corridor is amortized over the average remaining working lives of the<br />
employees participating in the plan.<br />
The pension plan in Luxembourg is a defined contribution plan. The pension costs recognized during a period for such<br />
plans equal the contributions paid or due for that period.<br />
Provisions<br />
A provision is recognized on the balance sheet when the Group has a legal or constructive obligation as a result of a past<br />
event, and it is probable that an outflow of economic benefits will be required to settle the obligation.<br />
If the effect is material, provisions are determined by discounting the expected future cash flows at a pre-tax rate that<br />
reflects current market assessments of the time value of money and, where appropriate, the risks specific to the liability.<br />
14
Significant Accounting Policies (continued)<br />
Share capital<br />
Ordinary shares with discretionary dividends are classified as equity. Dividends on ordinary shares are recognized in equity<br />
in the period in which they are declared. External costs directly attributable to the issuance of new shares are presented<br />
net of the related tax, as a deduction from the proceeds in equity.<br />
When the Company or its subsidiaries purchase the Company's own shares, the consideration paid, including any attributable<br />
transaction cost, net of income tax, is presented as treasury shares and deducted from shareholders' equity.Where<br />
such shares are subsequently sold or reissued, any consideration received is included in shareholders' equity.<br />
Equity compensation benefit plans<br />
The Group operates a cash settlement, share-based payment compensation plan in one of its banking subsidiaries. The<br />
stock option plan relates to a French subsidiary of the Group and does not concern potential emission of shares of the<br />
parent company.This subsidiary grants to its employees a right to receive a future cash payment by granting to them a right<br />
to shares to be issued upon the exercise of share options, which are redeemable, either mandatorily (upon cessation of<br />
employment) or at the employee's option.<br />
The fair value of the employee services received in exchange for the grant of the options is recognized as an expense.The<br />
total amount to be expensed over the vesting period is determined by reference to the fair value of the options granted.<br />
Additionally, the company recognizes a liability for the redemption of the shares.The liability is measured initially, and at<br />
each reporting date until settled, at the fair value of the options by applying an option pricing model. Once the options<br />
are exercised, the liability is revalued at the fair value of the redeemable shares.The liability is extinguished when the shares<br />
are redeemed.<br />
Net income from investments<br />
Interest income on debt securities or on loans is recognized on an accrual basis, taking into account the effective yield on<br />
the asset. Dividend income is recognized on the date that the dividend is declared. For investments classified at fair value<br />
through profit and loss, fair value changes are recognized directly in income.<br />
Fee and commission income<br />
Brokerage fees earned from executing securities transactions are recorded when the service has been provided. Portfolio<br />
and other management, advisory and other service fees are recognized based on the terms of the applicable service<br />
contracts. Asset management fees related to investment funds are recognized pro rata temporis over the period the service<br />
is provided.The same principle is applied to fees earned for wealth management financial planning and custody services<br />
that are continuously provided over an extended period of time.<br />
Income tax<br />
Income tax on the profit or loss for the year is comprised of current and deferred tax. Income tax is recognized in the<br />
income statement except to the extent that it relates to items recognized directly in equity, in which case the income tax<br />
is recognized in equity.<br />
Current tax is the expected tax payable on the taxable income for the year, using tax rates enacted or substantially enacted<br />
at the balance sheet date, plus any adjustment to tax payable relating to previous years.<br />
15
Significant Accounting Policies (continued)<br />
Deferred tax is recognized based on the balance sheet liability method, on temporary differences between the carrying<br />
amounts of assets and liabilities for financial reporting purposes and the amounts used for taxation purposes.The following<br />
temporary differences are not accounted for: goodwill non-deductible for tax purposes; the initial recognition of<br />
assets or liabilities that affect neither accounting nor taxable profit; and differences relating to investments in subsidiaries,<br />
to the extent that they will probably not be reversed in the foreseeable future.The amount of deferred tax recognized is<br />
based on the expected manner of realization or settlement of the carrying amount of assets and liabilities, using tax rates<br />
enacted or substantially enacted at the balance sheet date.<br />
A deferred tax asset is recognized only to the extent that it is probable that future taxable profits will be available against<br />
which the asset can be utilized. Deferred tax assets are reduced to the extent that it is no longer probable that the related<br />
tax benefit will be realized.<br />
Taxes that arise from the distribution of dividends are recognized when the liability to pay the related dividend is incurred.<br />
Segment information<br />
The Group's primary dimension for segment reporting is business segments and the secondary dimension is geographical<br />
segments. The risks and returns of the group's operations are primarily determined by the different business activities<br />
rather than the different locations of the group's activity.This is reflected by the Group's management and organizational<br />
structure and internal financial reporting systems.<br />
Business segments<br />
The Group has two main areas of activity which are presented as the business segments "Private Equity" and "Wealth<br />
Management".The Private Equity segment is mostly concentrated in <strong>Quilvest</strong> Private Equity Ltd and its subsidiaries.The<br />
Wealth Management segment is concentrated in its private banking structures, SIF in Zurich and <strong>Quilvest</strong> Banque Privée<br />
in Paris.The additional Corporate segment includes the supporting administrative activities concentrated at the holding<br />
and sub-holding structures.<br />
Geographical segments<br />
The Private Equity segment operates in Europe, as well as in America and in Asia.<br />
There are no significant inter-segment transactions.<br />
Critical accounting judgement<br />
The application of the Group's accounting policies requires management to make judgements that can have a significant<br />
effect on the amounts recognized in the consolidated financial statements. Estimates and assumptions are made that affect<br />
the reported amounts of assets, liabilities, income, expenses and related disclosures.The estimates and underlying assumptions<br />
are based on historical experience, on information linked to the close follow-up of the underlying investments and<br />
on market-driven comparison factors. Actual results may differ from these estimates.The most significant estimates and<br />
assumptions concern the fair valuation detailed above under the <strong>Financial</strong> Investments section, the assumption related to<br />
the valuation of Land and Building, the valuation of goodwill and the actuarial assumptions related to the Employee<br />
Benefits.<br />
16
Significant Accounting Policies (continued)<br />
New IFRS standards and IFRIC interpretations<br />
New standards, amendments and interpretations to existing standards have been published up to the date the Board of Directors has<br />
approved these consolidated financial statements, which are mandatory for the group from accounting periods beginning January 1,<br />
2007 and which the Group has not early adopted.We detail below the group's assessment on those new accounting and reporting developments<br />
:<br />
1) New standards<br />
IFRS 7 <strong>Financial</strong> Instruments : Disclosures, and a complementary Amendment to IAS 1, Presentation of <strong>Financial</strong> statements<br />
- Capital Disclosures<br />
Content This new standard introduces new disclosures to improve the information regarding financial instruments.<br />
IFRS 7 requires the disclosure of qualitative and quantitative information about exposure to risks arising from<br />
financial instruments, including specified minimum disclosures about credit risk, liquidity risk and market risk,<br />
including sensitivity analysis to market risk.<br />
IFRS 7 replaces IAS 30, Disclosures in the <strong>Financial</strong> Statements of Banks and Similar <strong>Financial</strong> Institutions, and disclosure<br />
requirements in IAS 32, <strong>Financial</strong> Instruments : Disclosure and Presentation.<br />
This standard applies to all entities reporting under IFRS.<br />
The amendment to IAS 1 introduces disclosures about the level of an entity's capital and how it manages capital.<br />
Date of required application: January 1, 2007<br />
Assessment Management is currently assessing the impact in terms of disclosures of this new standard and expects these to be<br />
effective on January 1, 2007 with comparative figures from January 1, <strong>2006</strong>.<br />
IFRS 8 Operating Segments<br />
Content This new standard defines the disclosures relating to operating segments and requires entities to disclose quantitative<br />
and qualititative information on products and services, geographical areas and major customers.<br />
Date of required application: January 1, 2009<br />
Assessment Management is currently analyzing the impact of this amendment on the group's disclosures.<br />
2) New interpretations<br />
IFRIC 7 Applying the Restatement Approach under IAS 29, <strong>Financial</strong> <strong>Report</strong>ing in Hyperinflationary Economies<br />
Effective March 1, <strong>2006</strong><br />
Assessment This new interpretation does not apply to the group.<br />
IFRIC 8 Scope of IFRS 2, Share-based payment<br />
Effective May 1, <strong>2006</strong><br />
IFRIC 9 Reassessment of Embedded Derivatives<br />
Effective June 1, <strong>2006</strong><br />
IFRIC 10 Interim <strong>Financial</strong> <strong>Report</strong>ing and Impairment<br />
Effective November 1, <strong>2006</strong><br />
IFRIC 11 Group Treasury Share Transactions<br />
Effective March 1, 2007<br />
Assessment These new interpretations apply to the group but have no significant impact.<br />
17
Notes to the Consolidated <strong>Financial</strong> Statements<br />
1) Changes in the scope of consolidation<br />
Compared to year-end 2005, the following changes in the scope of consolidation were integrated in these consolidated<br />
financial statements.<br />
In the Private Equity sub-group, a new company, Eviso Investment Corp. SA, was created in order to buy back some minority<br />
interests in several investing vehicles. Laju (Cayman) Ltd was also incorporated at the end of the year in order to bear<br />
alternative funds.<br />
<strong>Quilvest</strong> Alternative Investment is fully consolidated from <strong>2006</strong>.<br />
On June 30, <strong>2006</strong> <strong>Quilvest</strong> Holding France was dissolved without liquidation by decision of its sole shareholder <strong>Quilvest</strong><br />
Capital France.The merger is effective retroactively from January 1, <strong>2006</strong>.The operation is based on the net asset value<br />
of <strong>Quilvest</strong> Holding France as of December 31, 2005 without cash settlement. The new structure was renamed into<br />
<strong>Quilvest</strong> France on September 4, <strong>2006</strong>.<br />
On January 12, <strong>2006</strong>, Banque Privée <strong>Quilvest</strong> acquired the remaining 30% of Gestor Holding for EUR 4,3 million from<br />
the minority shareholders.The price of the transaction was already included in the group liabilities at the end of 2005.<br />
In July <strong>2006</strong>, Gestor Holding merged with Gestor Finance. In a second step, Banque Privée <strong>Quilvest</strong> merged with Gestor<br />
Holding.The new structure has been renamed into <strong>Quilvest</strong> Banque Privée.<br />
18
Notes to the Consolidated <strong>Financial</strong> Statements (continued)<br />
2) Main consolidated structures<br />
All companies integrated in the consolidation have their closing date at December 31st.<br />
Parent Company<br />
Country % held Segment<br />
<strong>Quilvest</strong> S.A.H. Luxembourg Corporate<br />
<strong>Quilvest</strong> Europe sub-group<br />
<strong>Quilvest</strong> Europe S.A. Luxembourg 100.00 Corporate<br />
<strong>Quilvest</strong> France S.A.S. France 100.00 Private Equity<br />
<strong>Quilvest</strong> Banque Privée S.A. and its subsidiaries France 99.44 Wealth Management<br />
Société Internationale de Finance S.A. and its subsidiaries Switzerland 75.00 Wealth Management<br />
<strong>Quilvest</strong> Private Equity sub-group Private Equity<br />
<strong>Quilvest</strong> Private Equity Ltd British Virgin Islands 100.00<br />
<strong>Quilvest</strong> American Equity Ltd British Virgin Islands 100.00<br />
<strong>Quilvest</strong> American Venture Ltd British Virgin Islands 100.00<br />
<strong>Quilvest</strong> European Equity Ltd British Virgin Islands 100.00<br />
<strong>Quilvest</strong> European Venture Ltd British Virgin Islands 100.00<br />
<strong>Quilvest</strong> Asian Equity Ltd British Virgin Islands 100.00<br />
<strong>Quilvest</strong> Asian Venture Ltd British Virgin Islands 100.00<br />
<strong>Quilvest</strong> Ventures Ltd and its subsidiaries British Virgin Islands 100.00<br />
QS Companies USA Ltd and its subsidiaries British Virgin Islands 100.00<br />
QS Companies Europe Ltd and its subsidiaries British Virgin Islands 100.00<br />
QS PEP Holding S.A. and its subsidiaries British Virgin Islands 100.00<br />
QS Strategic GP's Ltd British Virgin Islands 100.00<br />
<strong>Quilvest</strong> Finance Ltd British Virgin Islands 100.00<br />
Eviso Investment Corp. British Virgin Islands 100.00<br />
Laju (Cayman) Ltd Cayman Islands 100.00<br />
Eparfin S.A.H. Luxembourg 99.99<br />
<strong>Quilvest</strong> Services Ltd (formerly Three Cities Holding Ltd) British Virgin Islands 100.00<br />
TCRE Management Ltd Jersey 100.00<br />
TCR Europe France 99.73<br />
QS Management Ltd British Virgin Islands 100.00<br />
<strong>Quilvest</strong> MEA Inc. British Virgin Islands 100.00<br />
<strong>Quilvest</strong> USA Inc. Delaware 100.00<br />
<strong>Quilvest</strong> European Partners Sicar S.A. Luxembourg 100.00<br />
19
Notes to the Consolidated <strong>Financial</strong> Statements (continued)<br />
3) Cash and Cash Equivalents<br />
in $ '000 <strong>2006</strong> 2005<br />
Cash in hand (Petty cash) 329 217<br />
Balances with banks 36,369 28,892<br />
Call and fixed term deposits < 3 months 121,939 52,958<br />
Treasury bills and similar securities - 70<br />
Cash in transit 1,245 113<br />
Cash and Cash Equivalents 159,882 82,250<br />
The significant increase of cash is due to the important investment exits of the year of which an amount of USD 62 million<br />
is invested in short-term deposits at year end.<br />
4) Loans and Advances to Bank Customers<br />
in $ '000 <strong>2006</strong> 2005<br />
Loans and advances to bank customers 104,227 82,862<br />
Allowances for doubtful loans and advances (930) -<br />
Net loans and advances to bank customers 103,297 82,862<br />
The valuation undertaken by SIF resulted in a global allowance for doubtful loan of CHF 1,135,000 (USD 930,000) at the<br />
end of <strong>2006</strong>.This amount covers potential default risk from a specific client.<br />
The loans are represented by USD 80.3 million at an average interest rate of 6.2% and EUR 17.5 million at an average<br />
rate of 5.4%.<br />
Secured loans to bank customers (in $ '000) <strong>2006</strong> 2005<br />
Loans secured by real estate 3,855 3,477<br />
Lombard loans 94,017 75,714<br />
Other warranties 4,285 1,497<br />
Not collateralized 1,140 2,174<br />
Total 103,297 82,862<br />
20
Notes to the Consolidated <strong>Financial</strong> Statements (continued)<br />
5) Other Receivables, Accrued Income and Prepaid Expenses<br />
in $ '000 <strong>2006</strong> 2005<br />
Interest receivable 11 65<br />
Other assets and receivables 21,899 19,022<br />
Loans to employees 849 -<br />
Other loans 2,208 60<br />
Accrued interest 2,714 1,599<br />
Other accrued income 4,484 2,192<br />
Prepaid expenses 326 228<br />
Other Receivables,Accrued Income and Prepaid Expenses 32,491 23,166<br />
6) Investments and <strong>Financial</strong> Liabilities held for Trading<br />
According to <strong>Quilvest</strong>'s strategy, all equity and debt instruments of the Group are recognized at fair value and designated<br />
upon initial recognition at fair value through profit and loss. Any transaction costs are expensed as incurred. Subsequently,<br />
any changes in fair value (revaluation) or impairments are recognized as well in the income statement.<br />
Changes in fair value due to currency gains or losses are not separately recognized, but included in the change in fair value<br />
on the income statement. The fair value of private equity investments is determined on an item-by-item basis by the<br />
investment manager and approved by the Board of Directors.<br />
At disposal, gains and losses are included in realized gains or losses in the income statement.<br />
Investments in which the investor has control over the investee or considers the investee as a subsidiary are not included.<br />
Debt securities designated at fair value through profit and loss<br />
These include bonds and treasury bills.<br />
Equity securities designated at fair value through profit and loss<br />
Only non-derivative equity securities are considered here. Private equity investments in venture capital may be included<br />
when they are measured at fair value in accordance with IAS 39.<br />
Third-party funds designated at fair value through profit and loss<br />
In the case of third party funds, capital calls must be analyzed such that the amounts called for expenses or dividends and<br />
capital gains amounts distributed must be recorded in the income statement. Increases of investments and returns of capital<br />
will be recorded as an increase to assets.<br />
21
Notes to the Consolidated <strong>Financial</strong> Statements (continued)<br />
6.1) <strong>Financial</strong> assets designated at fair value through profit and loss<br />
in $ '000 <strong>2006</strong> 2005<br />
Debt securities 297 1,444<br />
Equity securities 190,139 177,763<br />
Third party funds 354,769 334,878<br />
Convertible loans 5,831 7,421<br />
Total 551,036 521,506<br />
6.2) <strong>Financial</strong> assets at fair value through profit and loss - Trading<br />
Derivative financial assets 1,443 6,478<br />
6.3) Loans and receivables<br />
Investment related loans 5,191 13,095<br />
Total investments 557,670 541,079<br />
6.1.1) Schedule of changes in investments designated at fair value through profit and loss in <strong>2006</strong><br />
Equity, Debt securities Third party Total<br />
and convertible loans funds<br />
Fair value at opening balance 186,628 334,878 521,506<br />
Additions 43,042 182,061 225,103<br />
Disposals (65,425) (233,111) (298,536)<br />
Changes in fair market value recognized in the income statement 27,129 68,831 95,960<br />
Currency differences 4,893 2,110 7,003<br />
Fair value at closing balance 196,267 354,769 551,036<br />
The acquisitions of Private Equity investments generated a cash-outflow of USD 210,7 million and the disposals from these<br />
investments a cash-inflow of USD 287 million, as stated in the corresponding lines of the consolidated cash-flow statement.<br />
6.1.2) Schedule of changes in investments designated at fair value through profit and loss in 2005<br />
Equity, Debt securities Third party Total<br />
and convertible loans funds<br />
Fair value at opening balance 149,488 302,859 452,347<br />
Additions 43,605 98,980 142,585<br />
Disposals (40,096) (119,632) (159,728)<br />
Changes in fair market value recognized in the income statement 33,631 52,671 86,302<br />
Fair value at closing balance 186,628 334,878 521,506<br />
22
Notes to the Consolidated <strong>Financial</strong> Statements (continued)<br />
6.2.1) Detailed schedule of derivatives by nature and maturity at December 31, <strong>2006</strong> :<br />
in $ '000 Notional amount with remaining life of Fair values<br />
Less than 3 months More than Total positive negative<br />
3 months to 1 year 1 year<br />
ASSETS<br />
Foreign currency forward contracts 80,677 5,888 - 86,565 830 -<br />
Foreign currency option contracts 24,400 49,100 26,000 99,500 613 -<br />
LIABILITIES<br />
Foreign currency forward contracts 99,108 7,190 - 106,298 - 825<br />
Total 1,443 825<br />
The negative fair market value of the derivatives is presented in the consolidated balance sheet under ”<strong>Financial</strong> liabilities<br />
held for trading”.<br />
6.2.2) Detailed schedule of derivatives by currency risk at December 31, <strong>2006</strong> :<br />
in $ '000 USD/CHF EUR/CHF EUR/USD<br />
Buy<br />
Weighted average Weighted average Weighted average<br />
contracted Notional amount contracted Notional amount contracted Notional amount<br />
exchange rates exchange rates exchange rates<br />
Less than 3 months 1,2182 39,746 1,6075 40,302 - -<br />
Between 3 months and 1 year 1,2102 3,801 1,6063 2,087 - -<br />
Total 43,547 42,389<br />
Sell<br />
Less than 3 months 1,2168 56,363 1,6068 42,677 1,2200 24,400<br />
Between 3 months and 1 year 1,2268 6,259 1,5826 931 1,2275 49,100<br />
More than 1 year - - - - 1,3000 26,000<br />
Total 62,622 43,608 99,500<br />
The remaining notional amount of USD 696,000 represents a Buy position within 3 months of CHF.<br />
23
Notes to the Consolidated <strong>Financial</strong> Statements (continued)<br />
6.2.3) Detailed schedule of derivatives by nature and maturity at December 31, 2005 :<br />
in $ '000 Notional amount with remaining life of Fair values<br />
Less than 3 months More than Total positive negative<br />
3 months to 1 year 1 year<br />
ASSETS<br />
Foreign currency forward contracts 24,574 62,719 - 87,293 747 -<br />
Foreign currency option contracts - 23,200 99,500 122,700 5,731 -<br />
LIABILITIES<br />
Foreign currency forward contracts 35,025 66,907 - 101,932 - 1,293<br />
Total 6,478 1,293<br />
6.3.1) Detailed schedule of Investment-related loans by maturity date :<br />
in $ '000 <strong>2006</strong> 2005<br />
Within 1 year 989 1,250<br />
Between 1 and 5 years 1,217 9,137<br />
More than 5 years 2,985 2,708<br />
Total 5,191 13,095<br />
Investment-related loans are non-convertible loans granted to direct investments. Most loans present characteristics that<br />
categorize them as equity investments.They are evaluated at fair market value through profit and loss.<br />
24
Notes to the Consolidated <strong>Financial</strong> Statements (continued)<br />
7) Property, Plant and Equipment<br />
7.1) Schedule of changes in property, plant and equipment for the year <strong>2006</strong> :<br />
In $ '000 Land Buildings Fixtures Cars EDP Total<br />
and fittings hardware<br />
Cost<br />
Balance at January 1, <strong>2006</strong> 4,230 6,347 3,446 434 1,201 15,658<br />
Additions - - 839 - 571 1,410<br />
Net gains or losses from<br />
fair value adjustment 637 953 - - - 1,590<br />
Disposals and derecognized assets - - (35) (79) (147) (261)<br />
Currency differences 518 777 381 44 136 1,856<br />
Balance at December 31, <strong>2006</strong> 5,385 8,077 4,631 399 1,761 20,253<br />
Depreciation and impairment losses<br />
Balance at January 1, <strong>2006</strong> - 253 2,135 170 932 3,490<br />
Depreciation charge for the year - 195 397 69 282 943<br />
Disposals and derecognized assets - - (28) (43) (137) (208)<br />
Currency differences - 39 253 20 104 416<br />
Balance at December 31, <strong>2006</strong> - 487 2,757 216 1,181 4,641<br />
Net book value (carrying amount)<br />
Balance at January 1, <strong>2006</strong> 4,230 6,094 1,311 264 269 12,168<br />
Balance at December 31, <strong>2006</strong> 5,385 7,590 1,874 183 580 15,612<br />
In December <strong>2006</strong>, <strong>Quilvest</strong> Group received the appraisal from Cabinet Hellier du Verneuil for the property located at<br />
241 and 243 Boulevard Saint Germain in Paris. The appraised value of the building and land amounts to EUR 580 per<br />
square meter, for a total fair value of EUR 16'306'000 used in the present accounts.The fair value is based on the rental<br />
value of the building at current market rates for well-situated commercial real estate.<br />
1.The own-use part of the buildings has been revalued accordingly and the revaluation amount linked directly to equity,<br />
i.e. to the revaluation reserve for own-used buildings. Accumulated depreciation has been charged against the revalued<br />
amount, taking into account an estimated economic life of 50 years.<br />
2.The investment part of the property follows the same valuation, but is accounted for under a separate balance sheet heading.The<br />
corresponding revaluation is directly booked in the income statement.<br />
For the opening IFRS value of land and building, <strong>Quilvest</strong> applied the same proportion between land and building as at<br />
cost: 34.7% for land and 65.3% for building. This proportion still relates to the economic reality in the current real estate<br />
market, and the fair value of land and buildings at 31 December <strong>2006</strong> and 2005 is based on this proportion.<br />
25
Notes to the Consolidated <strong>Financial</strong> Statements (continued)<br />
7.2) Schedule of changes in property, plant and equipment for the year 2005 :<br />
in $ '000 Land Buildings Fixtures Cars EDP Total<br />
and fittings Hardware<br />
Cost<br />
Balance at January 1, 2005 4,861 7,292 4,247 277 1,330 18,007<br />
Additions - - 691 139 255 1,086<br />
Disposals and derecognized assets - - (918) (103) (237) (1,258)<br />
Acquisitions through business combinations - - 32 149 65 247<br />
Currency differences (630) (946) (527) (47) (171) (2,320)<br />
Other differences - - (81) 19 (42) (105)<br />
Balance at December 31, 2005 4,230 6,347 3,446 434 1,201 15,658<br />
Depreciation and impairment losses<br />
Balance at January 1, 2005 - 145 2,908 174 1,076 4,304<br />
Depreciation charge for the year - 139 508 73 197 918<br />
Disposals and derecognized assets - - (873) (103) (238) (1,214)<br />
Disposals through business combinations - - 20 51 49 120<br />
Currency differences - (32) (422) (25) (147) (624)<br />
Other differences - - (6) - (6) (12)<br />
Balance at December 31, 2005 - 253 2,135 170 932 3,490<br />
Net book value (carrying amount)<br />
Balance at January 1, 2005 4,861 7,147 1,339 102 254 13,703<br />
Balance at December 31, 2005 4,230 6,094 1,311 264 269 12,168<br />
26
Notes to the Consolidated <strong>Financial</strong> Statements (continued)<br />
8) Investment Property<br />
Schedule of changes in the Investment Property :<br />
in $ '000 <strong>2006</strong> 2005<br />
At cost<br />
Balance as of January 1 6,952 7,988<br />
Net gains from fair value adjustment 284 -<br />
Currency differences 813 (1,036)<br />
Balance as of December 31 8,049 6,952<br />
Balance as of January 1 6,952 7,988<br />
Balance as of December 31 8,049 6,952<br />
The investment property relates to offices rented to third parties within the building located at 241 and 243 Boulevard<br />
Saint-Germain in Paris.<br />
The valuation follows the same method as for the own-used property. Rental income related to this invesment amounts<br />
to USD 343,000 for <strong>2006</strong> and USD 397,000 for 2005.<br />
The operating expenses related to the buildings amount to EUR 92,000 in <strong>2006</strong>, compared to EUR 111,600 in 2005,<br />
whereof 50% is attributable to the own-use part.<br />
27
Notes to the Consolidated <strong>Financial</strong> Statements (continued)<br />
9) Intangible Assets<br />
9.1) Schedule of changes in Intangible assets for the year <strong>2006</strong> :<br />
in $ '000 Goodwill Other Total<br />
At cost<br />
Balance as of January 1, <strong>2006</strong> 11,464 3,442 14,906<br />
Additions 633 847 1,480<br />
Disposals and derecognized assets - (260) (260)<br />
Adjustment of goodwill due to subsequent recognition of deferred tax assets 56 - 56<br />
Currency differences 1,359 300 1,659<br />
Balance as of December 31, <strong>2006</strong> 13,512 4,329 17,841<br />
Accumulated depreciation and impairment losses<br />
Balance as of January 1, <strong>2006</strong> - 1,838 1,838<br />
Amortization charge for the year - 296 296<br />
Disposals and derecognized assets - (260) (260)<br />
Currency differences - 164 164<br />
Balance as of December 31, <strong>2006</strong> - 2,038 2,038<br />
Net book value (carrying amount)<br />
Balance as of January 1, <strong>2006</strong> 11,464 1,604 13,068<br />
Balance as of December 31, <strong>2006</strong> 13,512 2,291 15,803<br />
The goodwill relates to Copagest (USD 8,706,000) and Gestor (USD 4,806,000) in <strong>Quilvest</strong> Banque Privée.The good<br />
health of the respective portfolios lead to no impairment loss at the end of <strong>2006</strong>.<br />
The other intangible assets relate to IT internal developments for the Swiss subsidiaries, specifically a new banking system<br />
for SIF and a front-office software package for the tracking of the private equity investments.<br />
28
Notes to the Consolidated <strong>Financial</strong> Statements (continued)<br />
9.2) Schedule of changes in Intangible assets for the year 2005 :<br />
in $ '000 Goodwill Other Total<br />
At cost<br />
Balance as of January 1, 2005 4,188 2,680 6,868<br />
Additions 635 1,167 1,802<br />
Disposals and derecognized assets - (10) (10)<br />
Acquisitions through business combinations 7,596 - 7,596<br />
Currency differences (955) (395) (1,350)<br />
Balance as of December 31, 2005 11,464 3,442 14,906<br />
Accumulated depreciation and impairment losses<br />
Balance as of January 1, 2005 - 1,744 1,744<br />
Amortization charge for the year - 356 356<br />
Disposals and derecognized assets - (10) (10)<br />
Currency differences - (252) (252)<br />
Balance as of December 31, 2005 - 1,838 1,838<br />
Net book value (carrying amount)<br />
Balance as of January 1, 2005 4,188 936 5,124<br />
Balance as of December 31, 2005 11,464 1,604 13,068<br />
During 2005 goodwill increased by USD 7.3 million due to new business combinations on which no impairment loss had<br />
to be recorded.<br />
29
Notes to the Consolidated <strong>Financial</strong> Statements (continued)<br />
10) Investments in Associates and non consolidated Affiliates<br />
The Group has the following investments in associates and non consolidated affiliates:<br />
in $ '000 Country Ownership Fair value Fair value<br />
interest (%) <strong>2006</strong> 2005<br />
TCR Capital S.A. France 0% - 503<br />
Three Cities Research Inc. US 0% - 409<br />
25 de Mayo Inmobiliaria S.A. Uruguay 33% - 40<br />
Fideas Capital France 34% 45 112<br />
<strong>Quilvest</strong> & Associés France 50% 887 384<br />
<strong>Quilvest</strong> Alternative Investment France 80% - 284<br />
<strong>Quilvest</strong> Assurances France 100% 10 10<br />
Gaspal Holding France 65% 540 -<br />
TCR Industrial Partners - C shares France - - 107<br />
Total 1,482 1,849<br />
The financial information on the associates and non consolidated affiliates at December <strong>2006</strong> is summarized as follows :<br />
in $ '000 Current Non-current Current Non-current<br />
assets assets liabilities liabilities<br />
Fideas Capital NA NA NA NA<br />
<strong>Quilvest</strong> & Associés 2,842 - (1,096) (1,746)<br />
Gaspal Holding 1,445 1,281 (1,046) (1,680)<br />
<strong>Quilvest</strong> Assurances 381 - (61) (320)<br />
Total 4,668 1,281 (2,203) (3,746)<br />
in $ '000 Revenues Expenses Net result<br />
Fideas Capital 388 (524) (136)<br />
<strong>Quilvest</strong> & Associés 3,751 (2,908) 843<br />
Gaspal Holding 2,224 (2,190) 34<br />
<strong>Quilvest</strong> Assurances 332 (36) 296<br />
Total 6,695 (5,658) 1,037<br />
”NA” means that financial information is not available at the date of this annual report.<br />
30
Notes to the Consolidated <strong>Financial</strong> Statements (continued)<br />
TCR Capital / Three Cities Research<br />
TCR Capital and Three Cities Research were sold in September <strong>2006</strong>.The proceeds of the sale amount to USD 497,000.<br />
<strong>Quilvest</strong> & Associés<br />
The minority shareholders of <strong>Quilvest</strong> & Associés have a put option to sell their respective interests to <strong>Quilvest</strong> Banque<br />
Privée (QBP), one of the Company's indirect subsidiaries, in the event that the shareholding of QBP in <strong>Quilvest</strong> Associés<br />
exceeds 50%.<br />
<strong>Quilvest</strong> Alternative Investment<br />
This subsidiary was established in December 2005. QBP has the option to purchase the shareholding from the minority<br />
interest. The subsidiary is fully consolidated at end of <strong>2006</strong>.<br />
Gaspal Holding<br />
This affiliate was established in August <strong>2006</strong>, and its first legal closing is fixed at the end of 2007. It is recorded at cost at<br />
the end of <strong>2006</strong>.<br />
<strong>Quilvest</strong> Assurances<br />
This company is not consolidated due to immateriality.This investment is recorded at cost and the share in the profit of<br />
this affiliate is recognized in the income statement.<br />
The share of the Group of the contingent liabilities of associates amounts to USD 2,208,000 (2005: USD 2,442,000).<br />
31
Notes to the Consolidated <strong>Financial</strong> Statements (continued)<br />
11) Deferred Tax Assets and Liabilities<br />
11.1) Summary of consolidated amounts in $ '000 <strong>2006</strong> 2005<br />
Deferred tax assets 201 14<br />
Deferred tax liabilities 7,606 6,537<br />
Deferred tax (expense)/income (172) 2,474<br />
11.2) Recognized Deferred <strong>2006</strong> 2005 <strong>2006</strong> 2005<br />
Tax Assets and Liabilities in $ '000 Assets Liabilities Assets Liabilities net net<br />
Other receivables - - 2 - - 2<br />
Investments - 106 (168) 371 (106) (539)<br />
Property, Plant and Equipment 80 3,390 80 2,529 (3,310) (2,449)<br />
Investment property - 2,582 - 2,217 (2,582) (2,217)<br />
Intangible Assets 4 - - (1) 4 1<br />
Investments in associates - 5 - - (5) -<br />
Employee benefits 117 (33) - (24) 150 24<br />
Other provisions - 1,556 100 1,445 (1,556) (1,345)<br />
Total deferred tax assets (liabilities) 201 7,606 14 6,537 (7,405) (6,523)<br />
11.3) Movements of net deferred tax assets and liabilities in $ '000 <strong>2006</strong> 2005<br />
Net deferred tax assets (liabilities) at opening balance (6,523) (10,166)<br />
Increase/(decrease) in temporary differences 172 556<br />
Change in tax rate - 1,065<br />
Other effects (change in tax regulation) - 853<br />
Currency differences (1,054) 1,169<br />
Net deferred tax assets (liabilities) at closing balance (7,405) (6,523)<br />
Deferred tax assets have not been recognized in respect of tax losses corresponding to USD 1,163,000.<br />
The deductible temporary difference does not expire under current fiscal legislation.<br />
Deferred tax assets have not been recognized in respect of these items because it is not probable that future taxable profit<br />
will be available against which the Group can utilise the benefits therefrom.<br />
32
Notes to the Consolidated <strong>Financial</strong> Statements (continued)<br />
11.4) Movements in net deferred tax assets (liabilities) per class<br />
11.4.1) Movements for the year <strong>2006</strong> in $ '000 Balance Recognized in Recognized in Balance<br />
January 1 profit & loss equity December 31<br />
Other receivables 2 (2) - -<br />
Investments (539) 544 (111) (106)<br />
Property, Plant and Equipment (2,449) (158) (703) (3,310)<br />
Investment property (2,217) (110) (255) (2,582)<br />
Intangible Assets 1 3 - 4<br />
Investments in associates - (5) - (5)<br />
Employee benefits 24 111 15 150<br />
Other provisions (1,345) (211) - (1,556)<br />
Total (6,523) 172 (1,054) (7,405)<br />
The deferred taxes recognized directly in equity concern exclusively currency differences.<br />
11.4.2) Movements for the year 2005 in $ '000 Balance Recognized in Recognized in Balance<br />
January 1 profit & loss equity December 31<br />
Other receivables 14 (12) - 2<br />
Investments (2,699) 1,622 538 (539)<br />
Property, Plant and Equipment (2,880) 88 343 (2,449)<br />
Investment property (2,545) 22 306 (2,217)<br />
Intangible Assets - 1 - 1<br />
Other liabilities 2 (2) - -<br />
Employee benefits 141 (99) (18) 24<br />
Other provisions (2,199) 854 - (1,345)<br />
Total (10,166) 2,474 1,169 (6,523)<br />
33
Notes to the Consolidated <strong>Financial</strong> Statements (continued)<br />
11.5) Reconciliation between applicable and effective tax rate for the year <strong>2006</strong> :<br />
This table reconciles the effective tax amounts presented in the consolidated income statement with the amount theoratically<br />
calculated with local applicable tax rates.<br />
Profit before tax 7,403<br />
Applicable local tax rates 25 - 33.3%<br />
Expected income tax expense 2,011<br />
Current income taxes relating to prior periods 355<br />
Effects that increase tax expense :<br />
Tax effects of non-deductible expenses 1,418<br />
Increase/decrease in valuation adjustments on deferred tax assets 800<br />
Other 40<br />
Total 2,258<br />
Effects that decrease tax expense :<br />
Tax effects of non-taxable income (454)<br />
Use of unrecognized tax losses carried forward (138)<br />
Fiscal integration (1,471)<br />
Total (2,063)<br />
Tax Expense in the income statement 2,561<br />
34
Notes to the Consolidated <strong>Financial</strong> Statements (continued)<br />
12) Deposits from Banks<br />
in $ '000 <strong>2006</strong> 2005<br />
Payable on demand 27,129 4,773<br />
Total Deposits from Banks 27,129 4,773<br />
The amount concerns short-term deposits from external financial institutions. Most deposits from banks are in USD with<br />
an average deposit interest rate of approximatively 6%.<br />
13) Deposits from Bank Customers<br />
in $ '000 <strong>2006</strong> 2005<br />
Repayable on demand 122,331 83,307<br />
With agreed maturity date or period of notice - 556<br />
Total deposits from Bank Customers 122,331 83,863<br />
Deposits from bank customers comprise USD 66.9 million and EUR 42 million.<br />
14) Other Liabilities, Deferred Income and Accrued Expenses<br />
in $ '000 <strong>2006</strong> 2005<br />
Accounts payable 18,860 9,527<br />
Interest payable 5,178 2,012<br />
Dividends payable 27 -<br />
Liabilities relating to share purchase agreements 3,452 5,086<br />
Liabilities relating to performance bonus 13,161 5,910<br />
Accrued expenses 12,112 12,126<br />
Deferred income 307 2,640<br />
Total Other Liabilities, Deferred Income and Accrued Expenses 53,097 37,301<br />
The liabilities relating to share purchase agreements represent primarily in <strong>2006</strong> the value of the purchase agreement of<br />
<strong>Quilvest</strong> Banque Privée for the remaining 35% of Copagest for an amount of EUR 2.1 million. In 2005 the amount related<br />
to the purchase agreement of the remaining 30% of Gestor for EUR 4.3 million.<br />
35
Notes to the Consolidated <strong>Financial</strong> Statements (continued)<br />
15) Interest-bearing Liabilities<br />
15.1) Terms and debt repayment schedule of <strong>2006</strong> figures<br />
in $ '000 Amount Interest rate Less than 1 year 1-5 years Over 5 years<br />
Convertible Bonds 15,723 4,31% - 15,723 -<br />
Liabilities towards financial institutions 31,430 3,74 - 4,09% 29,851 - 1,579<br />
Other loans 12 4,50% 12 - -<br />
Total Interest-bearing liabilities 47,165<br />
15.2) Terms and debt repayment schedule of 2005 figures<br />
in $ '000 Amount Interest rate Less than 1 year 1-5 years Over 5 years<br />
Convertible Bonds 15,723 4,31% - 15,723 -<br />
Liabilities towards financial institutions 32,306 3,74% 30,000 - 2,306<br />
Bridge loan 10,316 0,00% 10,316 - -<br />
Total Interest-bearing liabilities 58,345<br />
15.3) Convertible Bonds<br />
On July 1, 2003 <strong>Quilvest</strong> issued 160,000 bonds at a nominal price of $100 each, bearing an interest rate of 3%, p.a. payable<br />
annually as of June 30, maturing in 2008.The bonds are convertible at the option of the bondholders upon maturity<br />
at a conversion rate of one for 1.1 <strong>Quilvest</strong> shares.<br />
In accordance with IFRS this convertible bond has been split between its debt and equity components.The effective interest<br />
rate of 4.3095% takes into account the redemption price in case of no conversion as well as the additional market spread<br />
that would have been applied in case of an external financing scheme.The equity component amounts to USD 277,000 and<br />
has been added to the share premium.<br />
176,000 additional shares are expected to be issued in case of total conversion of this bond at maturity.<br />
36
Notes to the Consolidated <strong>Financial</strong> Statements (continued)<br />
16) Employee benefit obligations<br />
The defined benefit plans relate to pension schemes in place in the subsidiaries <strong>Quilvest</strong> France, <strong>Quilvest</strong> Banque Privée<br />
and SIF.The funding occurs only for SIF.<br />
16.1) Liability for defined benefit obligations<br />
in $ '000 <strong>2006</strong> 2005<br />
Present value of unfunded obligations 351 370<br />
Present value of funded obligations 13,585 11,736<br />
Fair value of plan assets (13,195) (9,824)<br />
Net unrecognised actuarial gains (losses) (155) (1,029)<br />
Net liability in balance sheet 586 1,253<br />
16.2) Changes in the net liability recognized in the balance sheet<br />
in $ '000 <strong>2006</strong> 2005<br />
Net liability at opening balance 1,253 427<br />
Net expenses recognised in the income statement 292 1,373<br />
Contributions (1,053) (452)<br />
Currency differences 94 (95)<br />
Net liability at closing balance 586 1,253<br />
16.3) Detail of expenses recognized in the income statement in $ '000 <strong>2006</strong> 2005<br />
Current service cost 311 1,124<br />
Interest on obligation 394 276<br />
Expected return on plan assets (351) (287)<br />
Net actuarial losses (gains) recognised in year 11 (50)<br />
Past service cost (73) 310<br />
Total expense in Income Statement 292 1,373<br />
16.4) Other disclosures for defined benefit plans in $ '000 <strong>2006</strong> 2005<br />
Actual return on plan assets (179) (178)<br />
16.5) Principal actuarial assumptions at the balance sheet date <strong>2006</strong> 2005<br />
Discount rate at December 31 3% / 4.25% 2.70%<br />
Expected return on plan assets at December 31 2.75% 2.75%<br />
Future salary increase 2% / 3% 2.00%<br />
Future pension increase 0.50% 0.50%<br />
37
Notes to the Consolidated <strong>Financial</strong> Statements (continued)<br />
17) Provisions<br />
in $ '000 <strong>2006</strong> 2005<br />
Provisions for litigation 303 276<br />
Other provisions 66 60<br />
Total Provisions 369 336<br />
The variation from the prior year results from currency changes.The amounts remain unchanged in reporting currency.<br />
18) Share capital<br />
As of January 1, 2005, 5,400,000 ordinary shares without nominal value were issued.<br />
This amount is unchanged at December 31, <strong>2006</strong>. All issued shares are fully paid up.<br />
The authorized capital of the company amounts to USD 100,000,000 represented by 14,794,520 shares without nominal<br />
value.<br />
19) Treasury shares<br />
As at December 31, <strong>2006</strong> 19,989 <strong>Quilvest</strong> shares were held by the group. In accordance with IFRS, their total acquisition<br />
cost of USD 1,348,000 was deducted from group equity. During the year <strong>2006</strong> the group acquired additionnally 7,062<br />
own shares for a total purchase amount of USD 532,000.<br />
20) Reserves<br />
in $ '000<br />
Translation Revaluation Retained Total<br />
reserve reserve earnings<br />
Balance as at January 1, 2005 7,863 2,530 424,450 434,843<br />
Profit for the year 73,557 73,557<br />
Exchange differences (19,004) (328) (19,332)<br />
Total recognised income and expenses (19,004) (328) 73,557 54,225<br />
Dividends paid (6,858) (6,858)<br />
Balance as at December 31, 2005 (11,141) 2,202 491,149 482,210<br />
Balance as at January 1, <strong>2006</strong> (11,141) 2,202 491,149 482,210<br />
Profit for the year 67,951 67,951<br />
Revaluation of own-use building, net of deferred tax 1,060 1,060<br />
Exchange differences 13,185 861 14,046<br />
Total recognised income and expenses 13,185 1,921 67,951 83,057<br />
Dividends paid (6,342) (6,342)<br />
Balance as at December 31, <strong>2006</strong> 2,044 4,123 552,758 558,925<br />
The translation reserve is comprised of all foreign exchange differences arising from the translation of the financial statements<br />
of entities accounting in another currrency than the US dollar.<br />
38
Notes to the Consolidated <strong>Financial</strong> Statements (continued)<br />
21) Minority Interest<br />
in $ '000 <strong>2006</strong> 2005<br />
Minority Interests in reserves 25,100 19,283<br />
Minority Interests in result (1,187) 8,098<br />
Total Minority Interest 23,913 27,381<br />
22) Equity compensation benefits<br />
As at May 23, 2000 <strong>Quilvest</strong> Banque Privée issued 2,575 stock options at the price of FRF 198 (EUR 30) each to a member<br />
of its management team, exercisable within 5 years on a one option for one share in <strong>Quilvest</strong> Banque Privée.The exercise<br />
price is FRF 150 (EUR 23) over the nominal value of the shares. All these options have been exercised.<br />
During 2002, <strong>Quilvest</strong> Banque Privée issued another 1,545 stock options, at zero price, to its employees, exercisable until<br />
June 30, 2008 on a one option for one share in <strong>Quilvest</strong> Banque Privée.The exercise price is EUR 200 over the nominal<br />
value of the shares.<br />
In 2005, <strong>Quilvest</strong> Banque Privée issued 1,313 additional options to its employees, exercisable at the price of EUR 525 for<br />
one share <strong>Quilvest</strong> Banque Privée.<br />
<strong>Quilvest</strong> France, the immediate parent company of <strong>Quilvest</strong> Banque Privée, is required, after deliberation of the Board<br />
meeting, to buy back the options from the holders at a predeterminated calculation method in case of death or resignation<br />
of the holder.<br />
The group shows a liability of USD 722 thousand in <strong>2006</strong> (USD 1,370 thousand in 2005) in relation to its obligation to<br />
repurchase these options.The group recognized an additional personnel expense of USD 722 thousand in <strong>2006</strong> due to the<br />
share-based payment schemes (USD 1,370 thousand in 2005).The fair market value of the options amounts to USD 1,739<br />
thousand at the end of <strong>2006</strong>, compared to USD 2,799 thousand at the end of 2005 and is based on the valuation of <strong>Quilvest</strong><br />
Banque Privée made by the management.<br />
39
Notes to the Consolidated <strong>Financial</strong> Statements (continued)<br />
22.1) Schedule of changes in the option plan<br />
<strong>2006</strong> 2005<br />
Weighted Number Weighted Number<br />
average of average of<br />
exercice options exercice options<br />
price price<br />
Outstanding at the beginning of the period 427 3,352 421 3,837<br />
Granted during the period 692 566 654 515<br />
Forfeited during the period (515) (1,000)<br />
Exercised during the period 359 (1,704) - -<br />
Outstanding at the end of the period 598 1,699 427 3,352<br />
Exercisable at the end of the period 598 1,699 427 3,352<br />
During <strong>2006</strong>, 1,300 options were sold by an employee to <strong>Quilvest</strong> France, in addition to the 1,000 sold in the prior year.<br />
<strong>Quilvest</strong> France exercised the 2,300 options during <strong>2006</strong>. Employees exercised globally 404 options in <strong>2006</strong>. 515 options<br />
were forfeited due to the leaving of an employee.<br />
40
Notes to the Consolidated <strong>Financial</strong> Statements (continued)<br />
23) Earnings per Share<br />
The calculation of basic earnings per share at December 31, <strong>2006</strong> and 2005 is based on the net profit attributable to ordinary<br />
shareholders and a weighted average number of ordinary shares outstanding during the years under review calculated<br />
as follows:<br />
23.1) Calculation of IFRS weighted number of shares <strong>2006</strong> 2005<br />
Net profit attributable to the shareholders of the parent in $ '000 67,951 73,557<br />
Issued ordinary shares at January 1 5,400,000 5,400,000<br />
Effect of own shares held (12,564) (9,294)<br />
Shares issued at the capital increase of March 29, 2007 1,080,000 1,080,000<br />
Weighted average number of ordinary shares at March 29, 2007 6,467,436 6,470,706<br />
Net basic earnings per share (in $) 10.5 11.4<br />
23.2) Calculation of IFRS diluted average number of shares <strong>2006</strong> 2005<br />
Net profit attributable to the shareholders of the parent in $ '000 67,951 73,557<br />
Interest of convertible bonds, net of tax in $ '000 695 686<br />
Adjusted net profit for the year in $ '000 68,646 74,243<br />
Weighted average number of shares at December 31 5,387,436 5,390,706<br />
Shares issued at the capital increase of March 29, 2007 1,080,000 1,080,000<br />
Effect of potential conversion on convertible bond 176,000 176,000<br />
Diluted average number of potential ordinary shares at March 29, 2007 6,643,436 6,646,706<br />
Net weighted diluted earnings per share (in $) 10.3 11.2<br />
41
Notes to the Consolidated <strong>Financial</strong> Statements (continued)<br />
24) Net income from directly held investments<br />
in $ '000 <strong>2006</strong> 2005<br />
Dividend and interest income<br />
Dividend income 2,767 2,658<br />
Interest income 309 1,319<br />
Total 3,076 3,977<br />
Realized and unrealized gains and losses<br />
Realized and unrealized gains and losses on equity securities 27,129 33,631<br />
Realized and unrealized gains and losses on investment-related loans (7,355) 4,489<br />
Realized and unrealized gains and losses on third party funds 68,831 52,671<br />
Total 88,605 90,791<br />
Net realized and unrealized gains and losses on derivative instruments (4,538) 1,297<br />
Foreign exchange gains and losses 125 -<br />
Total Net Income from directly held investments 87,268 96,065<br />
42
Notes to the Consolidated <strong>Financial</strong> Statements (continued)<br />
25) Net Income from Banking Activities<br />
in $ '000 <strong>2006</strong> 2005<br />
Interest income and similar income<br />
Interest on loans and advances to banks 2,077 735<br />
Interest on loans and advances to bank customers 5,008 4,303<br />
Total 7,085 5,038<br />
Fee and Commission Income<br />
Brokerage fees 12,645 13,093<br />
Fiduciary fees 2,634 722<br />
Custodian fees 4,265 3,886<br />
Asset management fees 17,707 14,767<br />
Other fee and commission income 6,283 6,097<br />
Total 43,534 38,565<br />
Other income<br />
Gain from securities traded on behalf of clients - 47<br />
Reversal of impairments on loans and advances to banks and customers - 499<br />
Total - 546<br />
Interest expense and similar charges<br />
Interest on deposits from bank customers (175) (82)<br />
Total (175) (82)<br />
Fee and commission expenses<br />
Brokerage fees (19) (1,458)<br />
Fiduciary fees (403) (270)<br />
Custodian fees (218) (175)<br />
Asset management fees (51) (547)<br />
Other fee and commission expenses (2,208) (165)<br />
Total (2,899) (2,615)<br />
Other expenses<br />
Losses from securities traded on behalf of clients (44) (379)<br />
Allowances on loans and advances to banks and bank customers (930) -<br />
Total (974) (379)<br />
Total Net Income from Banking Activities 46,571 41,073<br />
43
Notes to the Consolidated <strong>Financial</strong> Statements (continued)<br />
26) Other Operating Income<br />
in $ '000 <strong>2006</strong> 2005<br />
Decrease / (increase) in allowance for doubtful other receivables (2) 925<br />
Loss from disposal of property, plant and equipment and intangible assets - (32)<br />
Rental income 343 397<br />
Management Fees 1,805 2,468<br />
Income from carried shares 9,479 1,704<br />
Change in fair value of investment property 284 -<br />
Other income 5,836 6,481<br />
Total Other Operating Income 17,745 11,943<br />
27) General Administrative Expenses<br />
Administrative expenses which include the costs of making and managing investments, administrative costs related to the<br />
banking activities and the corporate management of the Group are accounted for on an accrual basis.They also include<br />
personnel costs, external consultancy fees and office expenses.<br />
in $ '000 <strong>2006</strong> 2005<br />
Personnel<br />
Salaries and wages (19,119) (18,028)<br />
Pension expense - Defined benefit plans (292) (1,373)<br />
Pension expense - Defined contributions plans (32) -<br />
Social contributions (5,985) (3,866)<br />
Variable compensation (staff and management bonus) (15,687) (3,435)<br />
Other personnel costs (1,373) (1,526)<br />
Expenses related to share based payment schemes (688) -<br />
Total (43,176) (28,228)<br />
Other administrative expenses<br />
External consultancy Fees (3,877) (4,167)<br />
Rental expense (2,128) (2,574)<br />
Management fees (147) (5,148)<br />
Set up fees (270) (832)<br />
Other administrative expenses (30,853) (21,480)<br />
Total (37,275) (34,201)<br />
Total General Administrative Expenses (80,451) (62,429)<br />
44
Notes to the Consolidated <strong>Financial</strong> Statements (continued)<br />
28) Depreciation, Amortization and Impairment Losses<br />
in $ '000 <strong>2006</strong> 2005<br />
Depreciation on property, plant and equipment (943) (918)<br />
Amortization of intangible assets (296) (356)<br />
Total Depreciation,Amortization and Impairment Losses (1,239) (1,274)<br />
29) <strong>Financial</strong> Income<br />
in $ '000 <strong>2006</strong> 2005<br />
Interest income 1,336 869<br />
Foreign exchange gains 2,617 1,643<br />
Total <strong>Financial</strong> Income 3,953 2,512<br />
30) <strong>Financial</strong> Expenses<br />
in $ '000 <strong>2006</strong> 2005<br />
Interest expense (2,085) (2,981)<br />
Foreign exchange losses (3,059) (1,554)<br />
Other financial expense (74) (106)<br />
Total <strong>Financial</strong> Expenses (5,218) (4,641)<br />
45
Notes to the Consolidated <strong>Financial</strong> Statements (continued)<br />
31) Income from Associates<br />
in $ '000 <strong>2006</strong> 2005<br />
Share in the profits of associated companies 696 207<br />
Total Income from Associates 696 207<br />
32) Income Tax Expense<br />
in $ '000 <strong>2006</strong> 2005<br />
Total current year expense (2,389) (4,275)<br />
Total deferred tax expense (172) 2,474<br />
Total Income Tax Expense (2,561) (1,801)<br />
All entities of the wealth management business segment of the group are domiciled in France and Switzerland and thus<br />
fully taxable, whereas some entities within the group's private equity business segment are not subject to income tax due<br />
to their domicile.<br />
33) Explanatory notes to the Cash flow statement<br />
In <strong>2006</strong> the company changed the presentation of the consolidated cash flow statement from the indirect method to the<br />
direct method.The comparatives for 2005 were reperformed accordingly.<br />
Cash flows from operating activities include the acquisitions and disposals of financial assets of the private equity segment.<br />
Cash flows relating to the financial assets held by the wealth management segment are classified as investing cash flows.<br />
46
Notes to the Consolidated <strong>Financial</strong> Statements (continued)<br />
34) Segment information<br />
34.1) Business segments<br />
The group has two main areas of activity. Private Equity, mostly concentrated through <strong>Quilvest</strong> Private Equity Ltd and its<br />
subsidiaries; and Wealth Management, concentrated through the private banking structures, SIF at Zurich and QBP in<br />
Paris.<br />
for the year <strong>2006</strong> in $ '000 Private Wealth Corporate Other and Consolidation<br />
Equity management elimination<br />
External revenue 101,666 50,992 4,114 (5,470) 151,302<br />
Depreciation and amortization expenses, net (330) (906) (3) - (1,239)<br />
Other non-cash income, net 284 (2) - - 282<br />
Segment result (= EBIT) 64,889 7,224 (1,527) (691) 69,895<br />
Segment assets 715,486 237,712 128,779 (182,654) 899,323<br />
Segment liabilities 85,754 184,012 59,216 (67,926) 261,056<br />
Capital expenditures (55) (1,962) - - (2,017)<br />
for the year 2005 in $ '000 Private Wealth Corporate Other and Consolidation<br />
Equity management elimination<br />
External revenue 95,566 41,434 12,080 - 149,080<br />
Depreciation and amortization expenses, net (108) (997) (169) - (1,274)<br />
Other non-cash income, net - - 925 - 925<br />
Segment result (= EBIT) 80,988 5,692 (1,303) - 85,377<br />
Segment assets 633,062 197,119 145,562 (212,331) 763,412<br />
Segment liabilities 46,375 143,100 4,005 2,520 196,000<br />
Capital expenditures 631 1,558 64 - 2,253<br />
47
Notes to the Consolidated <strong>Financial</strong> Statements (continued)<br />
34.2) Geographical segments<br />
Private equity activities are located in Europe, as well as in America and in Asia.<br />
The geographical segments are well segregated and no intersegment eliminations apply.<br />
for the year <strong>2006</strong> in $ '000 Europe America Asia & Other and Consolidation<br />
Middle East eliminaton<br />
External revenue 103,365 39,143 8,794 - 151,302<br />
Segment assets 699,158 319,389 63,432 (182,656) 899,323<br />
Capital expenditures (2,017) - - - (2,017)<br />
for the year 2005 in $ '000 Europe America Asia & Other and Consolidation<br />
Middle East eliminaton<br />
External revenue 104,229 40,581 7,728 (3,458) 149,080<br />
Segment assets 442,166 267,879 53,367 - 763,412<br />
Capital expenditures 1,969 284 - - 2,253<br />
35) Risk management<br />
The Board of Directors instituted an Audit Committee in 2002, which assesses risks and risk management of the Group.<br />
<strong>Quilvest</strong> recruited a Group Controller in 2004. He reports functionally to the Audit Committee and is in charge of optimizing<br />
overall control functions within the Group.<br />
The Group Controller engaged a Group Auditor in early 2007 in order to perform periodic audits in the subsidiaries of<br />
<strong>Quilvest</strong>.<br />
35.1) Private Equity activities<br />
Credit risk<br />
A strong diversification policy, which allows for regular divestment opportunities, and a strong shareholder commitment<br />
mitigate overall liquidity risk.<br />
In addition, in-house due diligence, an independent committee decision team and close post acquisition monitoring of<br />
each lead investment by experienced professionals result in a lower risk.<br />
Foreign currency risk<br />
Currency risk is derived from multi-currency investments, whereas Group financial accounts are presented in United<br />
States Dollars. In addition to the United States Dollar, the major financial investments are in Euros, Sterling Pounds and<br />
Swiss Francs. Since 2003, <strong>Quilvest</strong> has put in place currency macro-hedging initiatives to limit currency driven performance<br />
volatility.<br />
Liquidity risk<br />
Cash positions and cash forecasts are prepared and reviewed by management on a weekly basis. Potential temporary short<br />
cash positions would be covered by signed back up line with Dexia.<br />
48
Notes to the Consolidated <strong>Financial</strong> Statements (continued)<br />
35.2) Banking activities<br />
<strong>Quilvest</strong> Banque Privée and Société Internationale de Finance are regulated respectively by the Autorité des Marchés<br />
Financiers and the Commission Bancaire in France and by the Federal Banking Commission of Switzerland.<br />
Credit risk<br />
Management has a credit policy in place and the exposure to credit risks is monitored on an ongoing basis.<br />
Credits granted to clients are generally covered by a Lombard Credit Agreement. To protect against market fluctuations,<br />
a strong lending ratio on available collateral is defined, and the collateral portfolio value is monitored on a regular basis.<br />
Credit risk is assessed according to a system of limits and ratings monitored by the management.<br />
At the balance sheet date there were no significant concentrations of credit risk.The maximum exposure to credit risk is<br />
represented by the carrying amount of each financial asset in the balance sheet.<br />
Interest rate risk<br />
Interest rate risk is the risk of loss resulting from changes in interest rates.The interest rates on the group's major interest-bearing<br />
liabilities are fixed.The interest rate risk of deposits from banks and customers is offset mainly by loans and<br />
advances to bank customers.<br />
Foreign currency risk<br />
The Group is exposed to foreign currency risk on investments, loans and advances to bank customers and deposits from<br />
banks and customers that are denominated in currencies other than the US dollar.The currencies giving rise to the risk<br />
are primarily Swiss Francs and Euros.<br />
The Group uses derivative financial instruments to hedge economically the foreign exchange exposure of recognized<br />
monetary items or liabilities. No hedge accounting is applied and any gain or loss on the hedging instruments is recognized<br />
in the income statement.<br />
36) Contingent liabilities and commitments<br />
in $ '000 <strong>2006</strong> 2005<br />
Acceptances and endorsements 3,054 1,775<br />
Guarantees and assets pledged as collateral security 26,648 19,388<br />
Commitments arising out of sale and repurchase transactions 192,863 189,224<br />
Fiduciary operations 2,462,794 1,169,362<br />
Other commitments 148,468 160,721<br />
Total 2,833,827 1,540,470<br />
49
Notes to the Consolidated <strong>Financial</strong> Statements (continued)<br />
37) Group Employment<br />
<strong>2006</strong> 2005<br />
Number of employees at year end 183 147<br />
Full time equivalent at year end 176 142<br />
Average full time equivalent during the year 166 128<br />
The employment policy of the group over the last few years has been to give preference to internal employment rather<br />
than to external recruitment. Different departments have profited from this policy, first of all the front units directly responsible<br />
for the two main core businesses of the group, but largely also the supporting units, such as IT and controlling.<br />
At all levels <strong>Quilvest</strong> acquired highly experienced and skilled professionals to support the strong growth of its activities.<br />
38) Related parties<br />
Related party transactions<br />
Certain subsidiaries in the wealth management segment, as part of their normal business activities, also provide family<br />
office services to some members of the board of directors and senior management.The fees for their services are charged<br />
at arm's length.<br />
Directors' remuneration<br />
A list of the members of the Board of Directors is shown on page 3 of the General <strong>Section</strong> of the annual report.<br />
in $ '000 <strong>2006</strong> 2005<br />
Directors' remuneration 518 468<br />
Management remuneration<br />
Key management personnel is defined within <strong>Quilvest</strong> as executive employees who are responsible for the operational and<br />
financial performance of a business segment and/or a business unit, as well as individuals who play a significant role in corporate<br />
functions within the organization.They represent 27 persons compared to 22 in 2005.As the scope of key personnel<br />
has been redefined this year, last year's figures have been restated accordingly.<br />
All directors' remuneration is included in Other Administrative Expenses, whereas management's remuneration is included<br />
in Personnel Expenses, detailed in note 27.<br />
50
Notes to the Consolidated <strong>Financial</strong> Statements (continued)<br />
in $ '000 <strong>2006</strong> 2005<br />
Short-term employee benefits 10,140 6,680<br />
Post-employment benefits 913 890<br />
Termination benefits - 959<br />
Other long-term benefits 6,059 1,709<br />
Share-based payments 152 -<br />
Total Management's Remuneration 17,264 10,238<br />
Other long-term benefits correspond to various incentive programs put in place for the management team.<br />
The termination benefit in 2005 relates to the departure of the Head of a business unit at the end of 2005.<br />
39) Subsequent events<br />
The financial statements were authorized for issue by the directors on April 25, 2007.<br />
After the balance sheet date, the following dividends were proposed by the directors for distribution :<br />
<strong>2006</strong> 2005<br />
Total gross dividends (in $ '000) 13,081 8,202<br />
Dividend per share (in $) 2.02 1.52<br />
On March 8, 2007, the Board of Directors approved the issuance, listing and admission to trading of 1,080,000 new shares,<br />
each without nominal value.The company allowed subscription for the new shares by existing shareholders of <strong>Quilvest</strong><br />
as at March 12, 2007.The subscription right was granted at a ratio of one Share for each five Existing Shares.<br />
The subscription price was USD 112 per share, determined as the fair market price per share of the Company by its Board<br />
of Directors on March 8, 2007.<br />
The offer period ran from March 12, 2007 until March 22, 2007.<br />
100% of the new shares have been subscribed. The new shares were admitted to the Luxembourg Stock Exchange on<br />
March 29, 2007.<br />
As a result of the operation, the share capital increased from USD 36,500,000 represented by 5,400,000 shares to USD<br />
43,800,000 represented by 6,480,000 shares without par value, whereas USD 113,660,000 have been allocated to the<br />
Share Premium.<br />
51
<strong>Report</strong> of the Statutory Auditors<br />
to the shareholders<br />
on the <strong>Annual</strong> Accounts<br />
Following our appointment by the General Meeting of the Shareholders dated June 22, <strong>2006</strong>, we have audited the accompanying annual<br />
accounts of <strong>Quilvest</strong> S.A., which comprise the balance sheet as at December 31, <strong>2006</strong> and the profit and loss account for the year then ended,<br />
and a summary of significant accounting policies and other explanatory notes.<br />
Board of directors’ responsibility for the annual accounts<br />
The board of directors is responsible for the preparation and fair presentation of these annual accounts in accordance with Luxembourg legal<br />
and regulatory requirements relating to the preparation of the annual accounts. This responsibility includes: designing, implementing and<br />
maintaining internal control relevant to the preparation and fair presentation of annual accounts that are free from material misstatement,<br />
whether due to fraud or error; selecting and applying appropriate accounting policies; and making accounting estimates that are reasonable<br />
in the circumstances.<br />
Responsibility of the statutory auditors<br />
Our responsibility is to express an opinion on these annual accounts based on our audit. We conducted our audit in accordance with<br />
International Standards on Auditing as adopted by the Luxembourg ”Institut des Réviseurs d’Entreprises”.Those standards require that we<br />
comply with ethical requirements and plan and perform the audit to obtain reasonable assurance whether the annual accounts are free from<br />
material misstatement.<br />
An audit involves performing procedures to obtain audit evidence about the amounts and disclosures in the annual accounts.The procedures<br />
selected depend on the judgement of the statutory auditors, including the assessment of the risks of material misstatement of the annual<br />
accounts, whether due to fraud or error. In making those risk assessments, the statutory auditors consider internal control relevant to the<br />
entity’s preparation and fair presentation of the annual accounts in order to design audit procedures that are appropriate in the circumstances,<br />
but not for the purpose of expressing an opinion on the effectiveness of the entity’s internal control.An audit also includes evaluating the<br />
appropriateness of accounting policies used and the reasonableness of accounting estimates made by the board of directors, as well as evaluating<br />
the overall presentation of the annual accounts.We believe that the audit evidence we have obtained is sufficient and appropriate to provide<br />
a basis for our audit opinion.<br />
Opinion<br />
In our opinion, the annual accounts give a true and fair view of the financial position of <strong>Quilvest</strong> S.A. as at December 31, <strong>2006</strong>, and of the<br />
results of its operations for the year then ended in accordance with Luxembourg legal and regulatory requirements relating to the preparation<br />
of the annual accounts.<br />
Other matter<br />
Supplementary information included in the annual report has been reviewed in the context of our mandate but has not been subject to specific<br />
audit procedures carried out in accordance with the standards described above. Consequently, we express no opinion on such information.<br />
However, we have no observation to make concerning such information in the context of the annual accounts taken as a whole.<br />
Luxembourg, May 31, 2007<br />
KPMG Audit S.à r.l. KPMG Ltd<br />
John Li Jane Hallauer-Wong<br />
Partner Partner<br />
Réviseur d’Entreprises Chartered Certified Accountant (United Kingdom)<br />
31, Allée Scheffer<br />
L-2520 Luxembourg<br />
Parent Company<br />
52
Balance Sheet<br />
as of December 31 in $ ’000<br />
Assets<br />
Fixed Assets<br />
Note <strong>2006</strong> 2005<br />
Tangible assets 13<br />
<strong>Financial</strong> assets 3 56,756 56,756<br />
Current Assets<br />
56,769 56,756<br />
Debtors 4 30,262 29,561<br />
Cash at bank and in hand 762 247<br />
31,024 29,808<br />
Total Assets 87,793 86,564<br />
Liabilities <strong>2006</strong> 2005<br />
Capital and reserves 5<br />
Subscribed capital 36,500 36,500<br />
Share premium account 20,000 21,861<br />
Legal reserve 3,650 3,070<br />
General reserve - 2,171<br />
Profit brought forward 1,063 3,350<br />
Profit for the financial year 8,691 2,463<br />
Creditors<br />
69,904 69,415<br />
Convertible bonds 6 16,240 16,240<br />
Other creditors 1,649 909<br />
17,889 17,149<br />
Total Liabilities 87,793 86,564<br />
The accompanying notes form an integral part of these annual accounts<br />
Parent Company<br />
53
Profit and Loss Account<br />
as of December 31 in $ ‘000<br />
Charges Note <strong>2006</strong> 2005<br />
Value adjustments in respect of assets 4 -<br />
Interest payable and similar charges 504 525<br />
Other charges 2,211 2,588<br />
Profit for the financial year 8,691 2,463<br />
Total charges 11,410 5,576<br />
Income<br />
Income from fixed assets 7 10,000 3,000<br />
Income from current assets 1,410 2,576<br />
Total Income 11,410 5,576<br />
The accompanying notes form an integral part of these annual accounts<br />
Parent Company<br />
54
Notes to the <strong>Annual</strong> Accounts<br />
1. Basis of Presentation<br />
The Company maintains its accounts and records in USD. The annual accounts are prepared in accordance with legal<br />
requirements and generally accepted accounting principles in the Grand Duchy of Luxembourg.<br />
Certain comparative amounts have been reclassified to conform with the current year’s presentation.<br />
The Company prepares consolidated financial statements, which are available at its registered office 84, Grand-Rue, B.P.<br />
154, L-2011 Luxembourg.<br />
On December 13, <strong>2006</strong>, Luxembourg abolished by law the tax exemption of the Holding 1929 companies.According to<br />
this law, <strong>Quilvest</strong>, established in Luxembourg since 1960 and traded on the Luxembourg Stock Exchange before July 20,<br />
<strong>2006</strong>, may continue to benefit from this regime during a transitional period from January 1, 2007 till December 31, 2010.<br />
During the transitional period, the Company must comply with certain reporting requirements to maintain its right to<br />
benefit from the special tax exemption status, including an annual certification and submission of such certification to the<br />
tax authorities.<br />
Alternative tax regimes, including potential conversion of the Company into a normally taxable company that may benefit<br />
from particular exemption rules, are currently being reviewed by the Company, so as to maintain an efficient tax regime<br />
in the future.<br />
2. Summary of Significant Valuation Rules<br />
The annual accounts have been prepared under the historical cost convention.<br />
Transactions in foreign currencies have been reflected in the annual accounts the rates prevailing at the transaction date.<br />
<strong>Financial</strong> assets in foreign currencies have been stated at the historical exchange rate. Current assets and liabilities in<br />
foreign currencies have been stated at the exchange rates as of December 31, <strong>2006</strong>.<br />
<strong>Financial</strong> assets are valued at acquisition cost. In case of a permanent reduction in the value of financial assets, they are<br />
valued at the lowest figures to be attributed to them. In the year ended December 31, <strong>2006</strong>, no value adjustment was<br />
necessary.<br />
3. <strong>Financial</strong> Assets<br />
as of December 31, <strong>2006</strong><br />
Share capital Number of % of Capital Book value<br />
shares held<br />
<strong>Quilvest</strong> Private Equity Ltd USD 57,599,800 575,997 99,99% USD 54,104,177<br />
Tortola, British Virgin Islands 575,998 shares<br />
of USD 100 par value<br />
<strong>Quilvest</strong> Europe S.A. EUR 2,500,000 2,499,997 99,99% USD 2,651,712<br />
Luxembourg 2,500,000 shares<br />
without par value<br />
Total USD 56,755,889<br />
Parent Company<br />
55
Notes to the <strong>Annual</strong> Accounts (continued)<br />
4. Debtors<br />
These mainly represent loans receivable from <strong>Quilvest</strong> Europe S.A. and from <strong>Quilvest</strong> Finance Ltd.<br />
5. Capital and Reserves<br />
Profit Profit<br />
Subscribed Share Legal General brought for the Total Capital<br />
in $ capital Premium reserve reserve forward financial year and reserves<br />
Balance at January 1, <strong>2006</strong> 36,500,000 21,860,615 3,070,000 2,171,295 3,349,900 2,463,313 69,415,123<br />
Ordinary General Meeting<br />
of June 22, <strong>2006</strong><br />
Result 2005 brought forward 2,463,313 (2,463,313)<br />
Dividend (1,860,615) (2,171,295) (4,169,730) (8,201,640)<br />
Allocation to Legal reserve 580,000 (580,000)<br />
Profit for the financial year 8,690,641 8,690,641<br />
Balance at<br />
December 31, <strong>2006</strong> 36,500,000 20,000,000 3,650,000 0 1,063,483 8,690,641 69,904,124<br />
As of December 31, <strong>2006</strong> the Company's authorised share capital is USD 100,000,000 represented by 14,794,520 shares<br />
without nominal value, of which USD 36,500,000 represented by 5,400,000 shares without nominal value are issued<br />
and fully paid.<br />
As at December 31, <strong>2006</strong>, 19,989 <strong>Quilvest</strong> shares are held by the Group. As the holding occurs through a foreign subsidiary<br />
of the mother company, no indisponible reserve has been constituted in the annual accounts as should have been<br />
required if the holding had occurred at the Luxembourg level. During the year <strong>2006</strong> the group acquired additionally<br />
7,062 own shares for a total purchase amount of USD 532,000.<br />
6. Convertible Bonds<br />
On July 1, 2003 <strong>Quilvest</strong> S.A. issued 160,000 bonds at a price of USD 100 nominal each, bearing an interest rate of 3%,<br />
p.a. payable annually as of June 30, maturing in 2008.The bonds are convertible at the option of the bondholders upon<br />
maturity at a conversion rate of one for 1.1 <strong>Quilvest</strong> shares.The amount shown includes accrued interest of USD 240,000,<br />
which is becoming due and payable within one year.<br />
Parent Company<br />
56
Notes to the <strong>Annual</strong> Accounts (continued)<br />
7. Income from Fixed Assets<br />
On June 26, <strong>2006</strong>, the company received a cash dividend in the amount of USD10,000,000 from <strong>Quilvest</strong> Private Equity<br />
Ltd.<br />
8. Contingencies<br />
As of December 31, <strong>2006</strong> and 2005 <strong>Quilvest</strong> S.A. has granted an indemnity in favor of an indirectly held subsidiary in<br />
the amount of USD 1.3 million (CHF 1.5 million) to cover that subsidiary’s loss on an asset.<br />
9. Subsequent Events<br />
On February 13, 2007, <strong>Quilvest</strong> S.A. incorporated a new subsidiary, <strong>Quilvest</strong> Participation Limited in Gibraltar.<br />
On March 8, 2007, the Board of Directors approved the issuance, listing and admission to trading of 1’080’000 new shares,<br />
each without nominal value.The company allowed subscription for the new shares by existing shareholders of <strong>Quilvest</strong><br />
as at March 12, 2007.The subscription right was granted at a ratio of one share for each five existing shares.<br />
The subscription price was USD 112 per share, determined as the fair market price per share of the Company by its Board<br />
of Directors on March 8, 2007.<br />
The offer period ran from March 12, 2007 until March 22, 2007.<br />
100% of the new shares have been subscribed. The new shares were admitted to the Luxembourg Stock Exchange on<br />
March 29, 2007.<br />
As a result of the operation, the share capital increased from USD 36,500,000 represented by 5,400,000 shares to USD<br />
43,800,000 represented by 6,480,000 shares without par value, whereas USD 113,660,000 have been allocated to the<br />
Share Premium.<br />
Parent Company<br />
57
Earnings and Allocations<br />
Proposal<br />
(in $)<br />
The balance sheet as per December 31, <strong>2006</strong> shows a profit of: 8,690,641<br />
- adding the profit brought forward 1,063,483<br />
- General Reserve -<br />
- Issue Premium 5,000,000<br />
The total available for distribution is: 14,754,124<br />
The Board of Directors proposes to:<br />
- allocate to Legal Reserve 730,000<br />
- distribute a gross dividend of 13,081,344<br />
- carry forward 942,780<br />
The Board of Directors proposes a dividend for the year ended December 31, <strong>2006</strong> of USD 2,0187 per share.<br />
14,754,124<br />
Furthermore the Board of Directors proposes an allocation to the legal reserve of USD 730,000 in accordance with<br />
Luxembourg law whereas at least 5% of the net profit must be appropriated to a non-distributable legal reserve until the<br />
aggregate reserve reaches 10% of the subscribed capital.<br />
No delegation of task was made by the Board of Directors to any of its members and accordingly no salary, allocation or<br />
remuneration was paid except as stated in Article 14 of the Articles of Incorporation.<br />
A gross remuneration of USD 518,000 will be proposed for the year <strong>2006</strong>.<br />
Parent Company<br />
58
84, Grand-Rue<br />
L-1660 Luxembourg<br />
R.C.S.L.: B 6091<br />
Tel.: (352) 47 38 85<br />
Fax: (352) 22 60 56<br />
Internet: http://www.quilvest.com<br />
E-mail: infolux@quilweb.com<br />
Luxembourg - New York - Zurich - Paris - Beirut - Buenos Aires - London