Hypothesis Testing Using z- and t-tests In hypothesis testing, one ...
Hypothesis Testing Using z- and t-tests In hypothesis testing, one ...
Hypothesis Testing Using z- and t-tests In hypothesis testing, one ...

You also want an ePaper? Increase the reach of your titles
YUMPU automatically turns print PDFs into web optimized ePapers that Google loves.
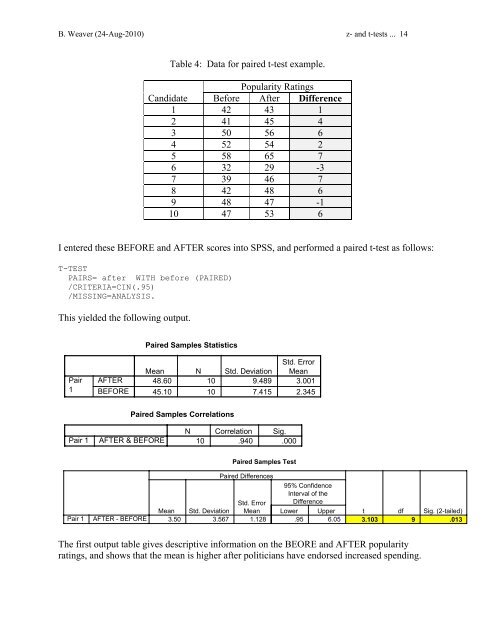
B. Weaver (24-Aug-2010) z- <strong>and</strong> t-<strong>tests</strong> ... 14Table 4: Data for paired t-test example.Popularity RatingsC<strong>and</strong>idate Before After Difference1 42 43 12 41 45 43 50 56 64 52 54 25 58 65 76 32 29 -37 39 46 78 42 48 69 48 47 -110 47 53 6I entered these BEFORE <strong>and</strong> AFTER scores into SPSS, <strong>and</strong> performed a paired t-test as follows:T-TESTPAIRS= after WITH before (PAIRED)/CRITERIA=CIN(.95)/MISSING=ANALYSIS.This yielded the following output.Paired Samples StatisticsPair1AFTERBEFOREStd. ErrorMean N Std. Deviation Mean48.60 10 9.489 3.00145.10 10 7.415 2.345Paired Samples CorrelationsPair 1AFTER & BEFOREN Correlation Sig.10 .940 .000Paired Samples TestPair 1AFTER - BEFOREPaired Differences95% Confidence<strong>In</strong>terval of theStd. Error DifferenceMean Std. Deviation Mean Lower Upper t df Sig. (2-tailed)3.50 3.567 1.128 .95 6.05 3.103 9 .013The first output table gives descriptive information on the BEORE <strong>and</strong> AFTER popularityratings, <strong>and</strong> shows that the mean is higher after politicians have endorsed increased spending.