Hypothesis Testing Using z- and t-tests In hypothesis testing, one ...
Hypothesis Testing Using z- and t-tests In hypothesis testing, one ...
Hypothesis Testing Using z- and t-tests In hypothesis testing, one ...

Create successful ePaper yourself
Turn your PDF publications into a flip-book with our unique Google optimized e-Paper software.
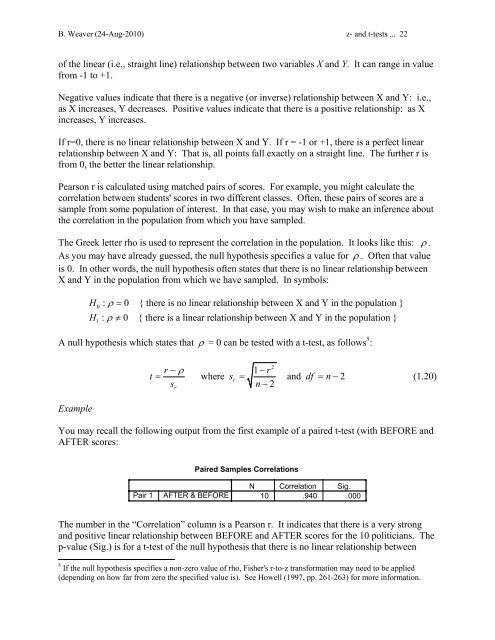
B. Weaver (24-Aug-2010) z- <strong>and</strong> t-<strong>tests</strong> ... 22of the linear (i.e., straight line) relationship between two variables X <strong>and</strong> Y. It can range in valuefrom -1 to +1.Negative values indicate that there is a negative (or inverse) relationship between X <strong>and</strong> Y: i.e.,as X increases, Y decreases. Positive values indicate that there is a positive relationship: as Xincreases, Y increases.If r=0, there is no linear relationship between X <strong>and</strong> Y. If r = -1 or +1, there is a perfect linearrelationship between X <strong>and</strong> Y: That is, all points fall exactly on a straight line. The further r isfrom 0, the better the linear relationship.Pearson r is calculated using matched pairs of scores. For example, you might calculate thecorrelation between students' scores in two different classes. Often, these pairs of scores are asample from some population of interest. <strong>In</strong> that case, you may wish to make an inference aboutthe correlation in the population from which you have sampled.The Greek letter rho is used to represent the correlation in the population. It looks like this: ρ .As you may have already guessed, the null <strong>hypothesis</strong> specifies a value for ρ . Often that valueis 0. <strong>In</strong> other words, the null <strong>hypothesis</strong> often states that there is no linear relationship betweenX <strong>and</strong> Y in the population from which we have sampled. <strong>In</strong> symbols:HH01: ρ = 0 { there is no linear relationship between X <strong>and</strong> Y in the population }: ρ ≠ 0 { there is a linear relationship between X <strong>and</strong> Y in the population }A null <strong>hypothesis</strong> which states that ρ = 0 can be tested with a t-test, as follows 5 :2r −ρ1−rt = where sr= <strong>and</strong> df = n−2sn−2r(1.20)ExampleYou may recall the following output from the first example of a paired t-test (with BEFORE <strong>and</strong>AFTER scores:Paired Samples CorrelationsPair 1AFTER & BEFOREN Correlation Sig.10 .940 .000The number in the “Correlation” column is a Pearson r. It indicates that there is a very strong<strong>and</strong> positive linear relationship between BEFORE <strong>and</strong> AFTER scores for the 10 politicians. Thep-value (Sig.) is for a t-test of the null <strong>hypothesis</strong> that there is no linear relationship between5 If the null <strong>hypothesis</strong> specifies a non-zero value of rho, Fisher's r-to-z transformation may need to be applied(depending on how far from zero the specified value is). See Howell (1997, pp. 261-263) for more information.