Untitled - Annual Report 2004 - The University of Western Australia
Untitled - Annual Report 2004 - The University of Western Australia
Untitled - Annual Report 2004 - The University of Western Australia

Create successful ePaper yourself
Turn your PDF publications into a flip-book with our unique Google optimized e-Paper software.
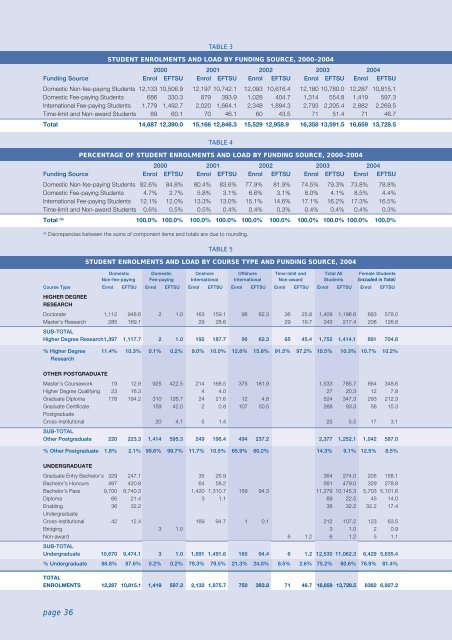
TABLE 3STUDENT ENROLMENTS AND LOAD BY FUNDING SOURCE, 2000–<strong>2004</strong>2000 2001 2002 2003 <strong>2004</strong>Funding Source Enrol EFTSU Enrol EFTSU Enrol EFTSU Enrol EFTSU Enrol EFTSUDomestic Non-fee-paying Students 12,133 10,506.9 12,197 10,742.1 12,093 10,616.4 12,180 10,780.0 12,287 10,815.1Domestic Fee-paying Students 686 330.3 879 393.9 1,028 404.7 1,314 554.8 1,419 597.3International Fee-paying Students 1,779 1,492.7 2,020 1,664.1 2,348 1,894.3 2,793 2,205.4 2,882 2,269.5Time-limit and Non-award Students 89 60.1 70 46.1 60 43.5 71 51.4 71 46.7Total 14,687 12,390.0 15,166 12,846.3 15,529 12,958.9 16,358 13,591.5 16,659 13,728.5TABLE 4PERCENTAGE OF STUDENT ENROLMENTS AND LOAD BY FUNDING SOURCE, 2000–<strong>2004</strong>2000 2001 2002 2003 <strong>2004</strong>Funding Source Enrol EFTSU Enrol EFTSU Enrol EFTSU Enrol EFTSU Enrol EFTSUDomestic Non-fee-paying Students 82.6% 84.8% 80.4% 83.6% 77.9% 81.9% 74.5% 79.3% 73.8% 78.8%Domestic Fee-paying Students 4.7% 2.7% 5.8% 3.1% 6.6% 3.1% 8.0% 4.1% 8.5% 4.4%International Fee-paying Students 12.1% 12.0% 13.3% 13.0% 15.1% 14.6% 17.1% 16.2% 17.3% 16.5%Time-limit and Non-award Students 0.6% 0.5% 0.5% 0.4% 0.4% 0.3% 0.4% 0.4% 0.4% 0.3%Total (a) 100.0% 100.0% 100.0% 100.0% 100.0% 100.0% 100.0% 100.0% 100.0% 100.0%(a)Discrepancies between the sums <strong>of</strong> component items and totals are due to rounding.TABLE 5STUDENT ENROLMENTS AND LOAD BY COURSE TYPE AND FUNDING SOURCE, <strong>2004</strong>Domestic Domestic Onshore Offshore Time-limit and Total All Female StudentsNon-fee-paying Fee-paying International International Non-award Students (included in Total)Course Type Enrol EFTSU Enrol EFTSU Enrol EFTSU Enrol EFTSU Enrol EFTSU Enrol EFTSU Enrol EFTSUHIGHER DEGREERESEARCHDoctorate 1,112 948.6 2 1.0 163 159.1 96 62.3 36 25.8 1,409 1,196.6 683 578.0Master’s Research 285 169.1 29 28.6 29 19.7 343 217.4 208 126.8SUB-TOTALHigher Degree Research1,397 1,117.7 2 1.0 192 187.7 96 62.3 65 45.4 1,752 1,414.1 891 704.8% Higher Degree 11.4% 10.3% 0.1% 0.2% 9.0% 10.0% 12.8% 15.8% 91.5% 97.2% 10.5% 10.3% 10.7% 10.2%ResearchOTHER POSTGRADUATEMaster’s Coursework 19 12.8 925 422.5 214 168.5 375 181.9 1,533 785.7 664 348.6Higher Degree Qualifying 23 16.3 4 4.0 27 20.3 12 7.8Graduate Diploma 178 194.2 310 126.7 24 21.6 12 4.8 524 347.3 293 212.3Graduate Certificate 159 42.0 2 0.8 107 50.5 268 93.3 56 15.3PostgraduateCross-institutional 20 4.1 5 1.4 25 5.5 17 3.1SUB-TOTALOther Postgraduate 220 223.3 1,414 595.3 249 196.4 494 237.2 2,377 1,252.1 1,042 587.0% Other Postgraduate 1.8% 2.1% 99.6% 99.7% 11.7% 10.5% 65.9% 60.2% 14.3% 9.1% 12.5% 8.5%UNDERGRADUATEGraduate Entry Bachelor’s 329 247.1 35 26.9 364 274.0 205 158.1Bachelor’s Honours 497 420.8 64 58.2 561 479.0 329 278.8Bachelor’s Pass 9,700 8,740.3 1,420 1,310.7 159 94.3 11,279 10,145.3 5,703 5,101.6Diploma 66 21.4 3 1.1 69 22.5 45 14.0Enabling 36 32.2 36 32.2 32.2 17.4UndergraduateCross-institutional 42 12.4 169 94.7 1 0.1 212 107.2 123 63.5Bridging 3 1.0 3 1.0 2 0.9Non-award 6 1.2 6 1.2 5 1.1SUB-TOTALUndergraduate 10,670 9,474.1 3 1.0 1,691 1,491.6 160 94.4 6 1.2 12,530 11,062.3 6,429 5,635.4% Undergraduate 86.8% 87.6% 0.2% 0.2% 79.3% 79.5% 21.3% 24.0% 8.5% 2.6% 75.2% 80.6% 76.9% 81.4%TOTALENROLMENTS 12,287 10,815.1 1,419 597.3 2,132 1,875.7 750 393.8 71 46.7 16,659 13,728.5 8362 6,927.2page 36