Untitled - Annual Report 2004 - The University of Western Australia
Untitled - Annual Report 2004 - The University of Western Australia
Untitled - Annual Report 2004 - The University of Western Australia
Create successful ePaper yourself
Turn your PDF publications into a flip-book with our unique Google optimized e-Paper software.
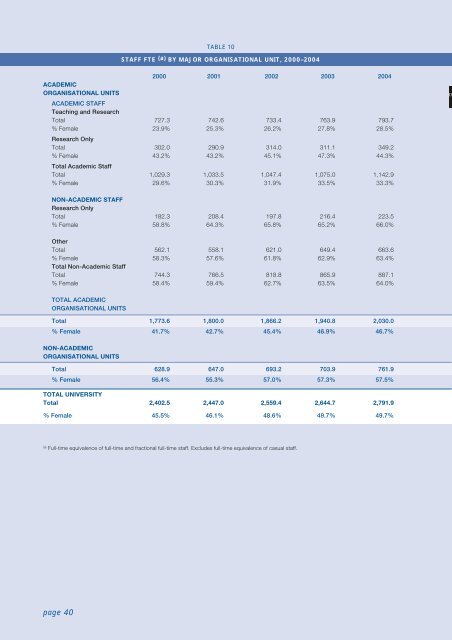
TABLE 10STAFF FTE (a) BY MAJOR ORGANISATIONAL UNIT, 2000–<strong>2004</strong>2000 2001 2002 2003 <strong>2004</strong>ACADEMICORGANISATIONAL UNITSACADEMIC STAFFTeaching and ResearchTotal 727.3 742.6 733.4 763.9 793.7% Female 23.9% 25.3% 26.2% 27.8% 28.5%Research OnlyTotal 302.0 290.9 314.0 311.1 349.2% Female 43.2% 43.2% 45.1% 47.3% 44.3%Total Academic StaffTotal 1,029.3 1,033.5 1,047.4 1,075.0 1,142.9% Female 29.6% 30.3% 31.9% 33.5% 33.3%DNON-ACADEMIC STAFFResearch OnlyTotal 182.3 208.4 197.8 216.4 223.5% Female 58.8% 64.3% 65.8% 65.2% 66.0%OtherTotal 562.1 558.1 621.0 649.4 663.6% Female 58.3% 57.6% 61.8% 62.9% 63.4%Total Non-Academic StaffTotal 744.3 766.5 818.8 865.9 887.1% Female 58.4% 59.4% 62.7% 63.5% 64.0%TOTAL ACADEMICORGANISATIONAL UNITSTotal 1,773.6 1,800.0 1,866.2 1,940.8 2,030.0% Female 41.7% 42.7% 45.4% 46.9% 46.7%NON-ACADEMICORGANISATIONAL UNITSTotal 628.9 647.0 693.2 703.9 761.9% Female 56.4% 55.3% 57.0% 57.3% 57.5%TOTAL UNIVERSITYTotal 2,402.5 2,447.0 2,559.4 2,644.7 2,791.9% Female 45.5% 46.1% 48.6% 49.7% 49.7%(a)Full-time equivalence <strong>of</strong> full-time and fractional full-time staff. Excludes full-time equivalence <strong>of</strong> casual staff.page 40


