Untitled - Annual Report 2004 - The University of Western Australia
Untitled - Annual Report 2004 - The University of Western Australia
Untitled - Annual Report 2004 - The University of Western Australia

You also want an ePaper? Increase the reach of your titles
YUMPU automatically turns print PDFs into web optimized ePapers that Google loves.
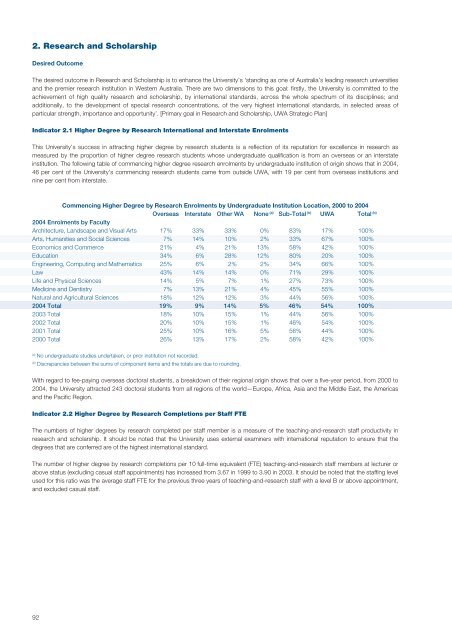
2. Research and ScholarshipDesired Outcome<strong>The</strong> desired outcome in Research and Scholarship is to enhance the <strong>University</strong>’s ‘standing as one <strong>of</strong> <strong>Australia</strong>’s leading research universitiesand the premier research institution in <strong>Western</strong> <strong>Australia</strong>. <strong>The</strong>re are two dimensions to this goal: firstly, the <strong>University</strong> is committed to theachievement <strong>of</strong> high quality research and scholarship, by international standards, across the whole spectrum <strong>of</strong> its disciplines; andadditionally, to the development <strong>of</strong> special research concentrations, <strong>of</strong> the very highest international standards, in selected areas <strong>of</strong>particular strength, importance and opportunity’. [Primary goal in Research and Scholarship, UWA Strategic Plan]Indicator 2.1 Higher Degree by Research International and Interstate EnrolmentsThis <strong>University</strong>’s success in attracting higher degree by research students is a reflection <strong>of</strong> its reputation for excellence in research asmeasured by the proportion <strong>of</strong> higher degree research students whose undergraduate qualification is from an overseas or an interstateinstitution. <strong>The</strong> following table <strong>of</strong> commencing higher degree research enrolments by undergraduate institution <strong>of</strong> origin shows that in <strong>2004</strong>,46 per cent <strong>of</strong> the <strong>University</strong>’s commencing research students came from outside UWA, with 19 per cent from overseas institutions andnine per cent from interstate.Commencing Higher Degree by Research Enrolments by Undergraduate Institution Location, 2000 to <strong>2004</strong>Overseas Interstate Other WA None (a) Sub-Total (b) UWA Total (b)<strong>2004</strong> Enrolments by FacultyArchitecture, Landscape and Visual Arts 17% 33% 33% 0% 83% 17% 100%Arts, Humanities and Social Sciences 7% 14% 10% 2% 33% 67% 100%Economics and Commerce 21% 4% 21% 13% 58% 42% 100%Education 34% 6% 28% 12% 80% 20% 100%Engineering, Computing and Mathematics 25% 6% 2% 2% 34% 66% 100%Law 43% 14% 14% 0% 71% 29% 100%Life and Physical Sciences 14% 5% 7% 1% 27% 73% 100%Medicine and Dentistry 7% 13% 21% 4% 45% 55% 100%Natural and Agricultural Sciences 18% 12% 12% 3% 44% 56% 100%<strong>2004</strong> Total 19% 9% 14% 5% 46% 54% 100%2003 Total 18% 10% 15% 1% 44% 56% 100%2002 Total 20% 10% 15% 1% 46% 54% 100%2001 Total 25% 10% 16% 5% 56% 44% 100%2000 Total 26% 13% 17% 2% 58% 42% 100%(a)No undergraduate studies undertaken, or prior institution not recorded.(b)Discrepancies between the sums <strong>of</strong> component items and the totals are due to rounding.With regard to fee-paying overseas doctoral students, a breakdown <strong>of</strong> their regional origin shows that over a five-year period, from 2000 to<strong>2004</strong>, the <strong>University</strong> attracted 243 doctoral students from all regions <strong>of</strong> the world—Europe, Africa, Asia and the Middle East, the Americasand the Pacific Region.Indicator 2.2 Higher Degree by Research Completions per Staff FTE<strong>The</strong> numbers <strong>of</strong> higher degrees by research completed per staff member is a measure <strong>of</strong> the teaching-and-research staff productivity inresearch and scholarship. It should be noted that the <strong>University</strong> uses external examiners with international reputation to ensure that thedegrees that are conferred are <strong>of</strong> the highest international standard.<strong>The</strong> number <strong>of</strong> higher degree by research completions per 10 full-time equivalent (FTE) teaching-and-research staff members at lecturer orabove status (excluding casual staff appointments) has increased from 3.67 in 1999 to 3.90 in 2003. It should be noted that the staffing levelused for this ratio was the average staff FTE for the previous three years <strong>of</strong> teaching-and-research staff with a level B or above appointment,and excluded casual staff.92