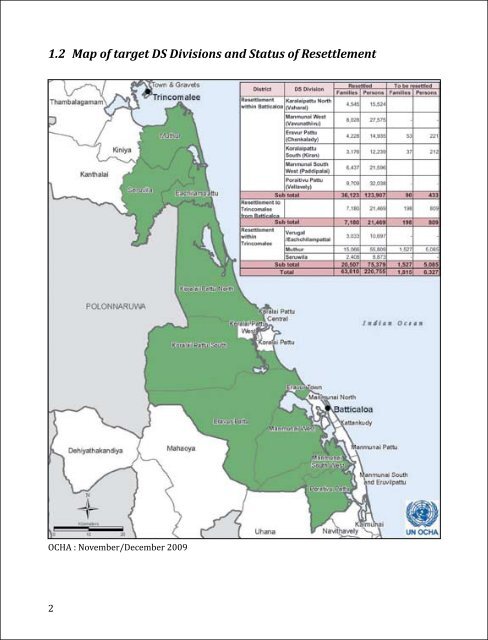
1.2 Map of target DS Divisions and Status of ResettlementOCHA : November/December 20092
1.3 Summary StatisticsNumber of Organizations andProjects by DistrictThirty three agencies participated <strong>in</strong> thisplann<strong>in</strong>g exercise, submitt<strong>in</strong>g 88 projectproposals. 41 proposals are submitted forBatticaloa District and 31 proposals have beenreceived for Tr<strong>in</strong>comalee District. 16 proposalsaddress both districts.DistrictsNumber of Projects by DistrictsBatticaloa 41Tr<strong>in</strong>comalee 31Both Districts 16Total 88Number of Projects by SectorMany projects address more than onesector. The follow<strong>in</strong>g Table shows the totalnumber of projects that impact on eachsector. For example the Livelihood Sector(LHD) <strong>in</strong> Batticaloa district is covered by31 projects, and the sectors of CommunityInfrastructure Recovery and EnvironmentalRehabilitation (CIR) and Governance(GOV) are covered by 28 projects each.In Tr<strong>in</strong>comalee, 29 projects address LHDwhile CIR and GOV are considered by 22and 16 projects respectively.DistrictsNumber of Projects bySectorsLHD CIR GOVBatticaloa 31 28 28Tr<strong>in</strong>comalee 29 22 16Total 60 50 44F<strong>in</strong>ance Required by Sector and DistrictThe follow<strong>in</strong>g table shows the f<strong>in</strong>ancial breakdown between sectors, with approximately 40% offunds requested for LHD, 50% for CIR and 10 % for GOV.ER SectorsLHD CIR GOV MSTotal (USD)Batticaloa 19,403,411 30,787,179 3,379,175 1,513,856 55,083,621% 35.23 55.89 6.13 2.75 100.00Tr<strong>in</strong>comalee 9,044,859 12,444,792 1,952,317 1,554,299 24,996,267% 36.18 49.79 7.81 6.22 100.00Both Districts Integrated 3,548,559 1,622,000 3,631,500 0 8,802,059% 40.32 18.43 41.26 0.00 100.00Total 31,996,828 44,853,971 8,962,992 3,068,155 88,881,947% 36.00 50.46 10.08 3.45 100.003