Specimen Preparation Technique for a Microstructure Analysis ...
Specimen Preparation Technique for a Microstructure Analysis ...
Specimen Preparation Technique for a Microstructure Analysis ...

Create successful ePaper yourself
Turn your PDF publications into a flip-book with our unique Google optimized e-Paper software.
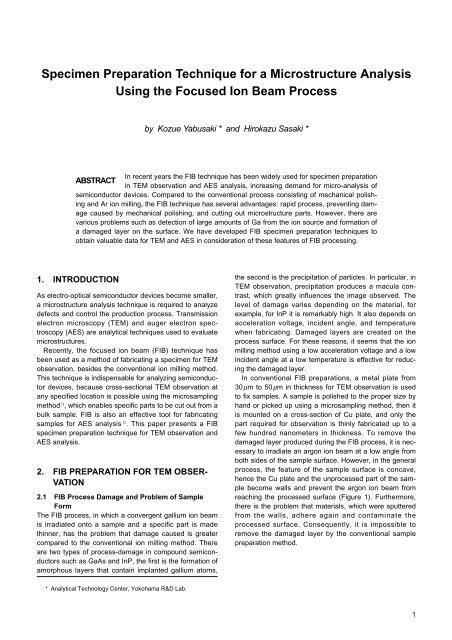
<strong>Specimen</strong> <strong>Preparation</strong> <strong>Technique</strong> <strong>for</strong> a <strong>Microstructure</strong> <strong>Analysis</strong>Using the Focused Ion Beam Processby Kozue Yabusaki * and Hirokazu Sasaki *In recent years the FIB technique has been widely used <strong>for</strong> specimen preparationABSTRACTin TEM observation and AES analysis, increasing demand <strong>for</strong> micro-analysis ofsemiconductor devices. Compared to the conventional process consisting of mechanical polishingand Ar ion milling, the FIB technique has several advantages: rapid process, preventing damagecaused by mechanical polishing, and cutting out microstructure parts. However, there arevarious problems such as detection of large amounts of Ga from the ion source and <strong>for</strong>mation ofa damaged layer on the surface. We have developed FIB specimen preparation techniques toobtain valuable data <strong>for</strong> TEM and AES in consideration of these features of FIB processing.1. INTRODUCTIONAs electro-optical semiconductor devices become smaller,a microstructure analysis technique is required to analyzedefects and control the production process. Transmissionelectron microscopy (TEM) and auger electron spectroscopy(AES) are analytical techniques used to evaluatemicrostructures.Recently, the focused ion beam (FIB) technique hasbeen used as a method of fabricating a specimen <strong>for</strong> TEMobservation, besides the conventional ion milling method.This technique is indispensable <strong>for</strong> analyzing semiconductordevices, because cross-sectional TEM observation atany specified location is possible using the microsamplingmethod 1) , which enables specific parts to be cut out from abulk sample. FIB is also an effective tool <strong>for</strong> fabricatingsamples <strong>for</strong> AES analysis 2) . This paper presents a FIBspecimen preparation technique <strong>for</strong> TEM observation andAES analysis.2. FIB PREPARATION FOR TEM OBSER-VATION2.1 FIB Process Damage and Problem of SampleFormThe FIB process, in which a convergent gallium ion beamis irradiated onto a sample and a specific part is madethinner, has the problem that damage caused is greatercompared to the conventional ion milling method. Thereare two types of process-damage in compound semiconductorssuch as GaAs and InP, the first is the <strong>for</strong>mation ofamorphous layers that contain implanted gallium atoms,the second is the precipitation of particles. In particular, inTEM observation, precipitation produces a macula contrast,which greatly influences the image observed. Thelevel of damage varies depending on the material, <strong>for</strong>example, <strong>for</strong> InP it is remarkably high. It also depends onacceleration voltage, incident angle, and temperaturewhen fabricating. Damaged layers are created on theprocess surface. For these reasons, it seems that the ionmilling method using a low acceleration voltage and a lowincident angle at a low temperature is effective <strong>for</strong> reducingthe damaged layer.In conventional FIB preparations, a metal plate from30µm to 50µm in thickness <strong>for</strong> TEM observation is usedto fix samples. A sample is polished to the proper size byhand or picked up using a microsampling method, then itis mounted on a cross-section of Cu plate, and only thepart required <strong>for</strong> observation is thinly fabricated up to afew hundred nanometers in thickness. To remove thedamaged layer produced during the FIB process, it is necessaryto irradiate an argon ion beam at a low angle fromboth sides of the sample surface. However, in the generalprocess, the feature of the sample surface is concave,hence the Cu plate and the unprocessed part of the samplebecome walls and prevent the argon ion beam fromreaching the processed surface (Figure 1). Furthermore,there is the problem that materials, which were sputteredfrom the walls, adhere again and contaminate theprocessed surface. Consequently, it is impossible toremove the damaged layer by the conventional samplepreparation method.* Analytical Technology Center, Yokohama R&D Lab.1
2.2 FIB Sample <strong>Preparation</strong> Method with LittleDamage2.2.1 Cu Half Plate with Ultra-thin Aluminum Foil andMicrosampling MethodWe developed a new specimen preparation techniqueusing the microsampling method and a Cu half plate withultra-thin aluminum foil to overcome the problem of specimen<strong>for</strong>m, and we made it possible to fabricate a FIBsample with little damage using cold ion milling. The FIBprocess conditions are shown below.FIB: Hitachi FB2000AAcceleration voltage: 30 kVIon beam: Ga +To irradiate an Ar ion beam onto the processed surfaceand prevent redeposition, it is necessary to make a thinCu half plate and reduce concavity and convexity near theprocessed surface. To fabricate the thin stand, an ultrathinaluminum foil of 2.5µm in thickness is attached to thehole of the Cu half plate using epoxy resin. The part of thesample of the same thickness as the aluminum foil waspicked up by the microsampling method, and both the leftAr +2 kVSampleAr +2 kVSampleand right sides of the sample were fixed on the cross-sectionof the aluminum foil using tungsten deposition. Notonly the observed area but also the aluminum foil wereprocessed to be thinner using the FIB method. Using thismethod, the sample became flat, and surroundings of thefabricated part were opened, there<strong>for</strong>e, an Ar ion beamirradiated at a low angle could reach the processed surfacefrom all directions (Figure 2-1, -2, -3).2.2.2 Cooling Ion MillingAfter sample preparation using the FIB method, the samplewas milled by cooling ion milling (Figure 2-4). Themilling conditions are shown below .Ion milling: GATAN600NAcceleration voltage: 2 kVIncident angle: 15 degreesIon beam: Ar +Ion milling time: 5 min.<strong>Specimen</strong> temperature: 77 K2.3 TEM Observation and Evaluation of DamagedLayers2.3.1 TEM ObservationTo confirm the effects of removing damaged layers bycooling ion milling, an observation was made using a highresolutiontransmission electron microscope (HRTEM).The sample be<strong>for</strong>e ion milling was observed <strong>for</strong> purposesof comparison. The observation condition is shown below.Half plate with single holeFigure 1Ar +2 kVFIB-TEM Sample.Half plateAr +2 kVTEM: Hitachi H9000UHRAcceleration voltage: 300 kVSample: InGaAsP/InP MQW(1) Picking upMicro probe(2) JointMicro probeW depositionW depositionBulk sampleEpoxy glueThin Al foilHalf plate with single hole(3) Thinning30 kVGa +(4) Cleaning (Ion milling)SampleDeposited W2.5 µ mAr +2 kVThin Al foilAr +2 kVFigure 2FIB sample preparation method <strong>for</strong> TEM observation with little damage.2 Furukawa Review, No. 22 2002
Photo 1Dark field image of InGaAsP/InP MQW.Photo 2Lattice image of InGaAsP/InP MQW.Photos 1 and 2 show cross-sectional TEM images(dark-field image and lattice image) of InGaAsP/InPMQW. In sample A be<strong>for</strong>e removing the damaged layers,observation was made of contrast and Moiré fringe, whichappear when crystals with a different orientation or spacingof lattice planes overlap. In addition, the lattice cannotbe observed clearly due to the thin damaged layerscaused by gallium implantation. The influence of damageto the sample caused only by FIB processing is remarkable.In contrast, in sample B after removing the damagedlayers by ion milling, the lattice is observed clearly withoutcontrast and Moiré fringe. These investigations demonstratethat the damaged layers on the processed surfaceare removed to obtain valuable data <strong>for</strong> TEM observationby cooling ion milling.2.3.2 Evaluation of Damaged LayersWe evaluated the damaged layers. Two types of samplewere prepared. In the first sample, damaged layers were<strong>for</strong>med by FIB fabrication. In the second sample, damagedlayers were <strong>for</strong>med, and then removed by coolingion milling. Figure 3 shows the sample preparation techniques.Part of bulk sample was fabricated by FIB and thedamaged layers were <strong>for</strong>med. The damaged layer of thesecond sample was then removed by cooling ion milling.Processed surfaces of both samples were coated with ametal layer to prevent re-damage due to FIB fabrication.The samples were picked up using the micro-samplingmethod, and fabricated using the method shown in Figure2. Cross-sectional TEM images of these samples areshown in Photo 3. In the FIB fabricated sample (photo-3
(1) FIB milling30 kVGa +(2) CleaningBulk sampleAr +2 kV(3) Picking up(4) Thinning and cleaningMetal coatingAr +2 kVDamaged layerThin Al foilAr +2 kVFigure 3Damaged layer evaluation sample preparation method.that the thickness of the amorphous damaged layer isapproximately 1.5 nm using cooling ion milling (photographbelow). It is understood that most of the damagedlayers <strong>for</strong>med by FIB processing are removed by coolingion milling.Photo 3Cross-sectional TEM image of damaged layer.graph above), the amorphous-like nano-crystalline damagedlayer of more than 20 nm thick is <strong>for</strong>med on theprocessed surface. Contrary to this, it should be noted2.3.3 SummaryWe developed specimen preparation FIB techniquesusing cooling ion milling to reduce damaged layers. In theconventional FIB technique, damaged layers could not beremoved because the specimen's shape prevents theargon ion beam from reaching the processed surface.This problem was solved using a new specimen preparationtechnique with Cu half plate, ultra-thin aluminum, andmicro-sampling method, which allows most of the damagedlayers to be removed. High-resolution TEM imageswere obtained. As a result of an evaluation of thickness ofdamaged layers, it is clear that a damaged layer of morethan 20 nm in thickness is <strong>for</strong>med on the processed surface.This indicates that, if a thin film sample of 100 nm in4 Furukawa Review, No. 22 2002
(1) FIB Process30 kVGa +(2) Cleaning (Ar + Sputter)4 kVAr +Surface↑ElectrodeFigure 4SampleFIB sample preparation <strong>for</strong> AES analysis.2 µm↓GaAsthickness is fabricated using a conventional FIB samplepreparation technique, about half of the thin film is a damagedlayer.Although only an InP system device was studied in thispaper, it is expected that similar effects are achieved withother materials.3. FIB PROCESS TECHNIQUE FOR AESANALYSISSputter depth profiling using AES is an effective techniquewhen multilayer films consisting of layers each with athickness of several tens of nanometers are evaluated.Since sputter depth profiling outputs one-dimensional dataonly, however, it is impossible to execute a precise analysisof complicated samples, such as particles in multilayerfilms, which require two- or three-dimensional analysis.Although there have been direct analysis techniques ofa cross-section exposed by mechanical polishing or crateredge, it is difficult to expose specified sections using thesetechniques. The FIB technique then makes it possible tofabricate and expose the specified cross-section to beobserved. In addition, several cross-sections from onesample can be fabricated. More in<strong>for</strong>mation can beobtained from the exposed section by combining qualitativeanalysis with line analysis and elemental maps usingAES.3.1 FIB ProcessIf the thickness of one layer is several tens of nanometers,it is difficult to analyze clearly the cross-sections exposedvertically by the FIB process because the AES spatial resolutionis about 15 nm. The thickness of layers areincreased by fabricating diagonally with FIB as shown inFigure 4. For instance, when a Ga ion beam is irradiatedfrom the vertical direction of 80 degrees, the exposed sectionis increased about six times, and can be analyzedusing AES.Because the sample stage in the FIB chamber could beinclined only up to 60 degrees, a sample was fixed to thesample stand with a slope of 45 degrees so that the samplecould be inclined by more than 60 degrees.The surface layer is cut down through the flare of theGa ion beam due to current density distribution in the ionbeam. To avoid this problem, we coated Pt-Pd or carbonlayer on the surface of the sample be<strong>for</strong>e the FIB process.Photo 4Cross-sectional SEM images of electrode after FIBprocessing and ion sputtering.The FIB process conditions are shown below.FIB: Hitachi FB2000AAcceleration voltage: 30 kVIon beam: Ga +Diagonal processing: 80 degreesCoating: Pt-Pd3.2 Removing Damaged LayersA damaged layer is <strong>for</strong>med on the sample surface afterthe FIB process as shown by TEM observation. Ga isdetected on the cross-section in the AES analysis afterthe FIB process because the damaged layer is implantedGa ion. Then the cross-section is sputter-cleaned using anAr ion beam in the AES chamber to remove the damagedlayer with Ga. Steps are <strong>for</strong>med because sputter ratesdepend on the material of each layer, thus SEM imagesbecome clear and specification of analysis area is facilitated.The sputtering conditions are shown below.AES: PHI670Acceleration voltage: 4 kVIon beam: Ar +Sputtering time: 3 min.3.3 ResultsThe Au/Ge/Ni multilayer film <strong>for</strong> the electrode, which isdeposited on a GaAs substrate, is processed by the procedurementioned above, and is inclined in the AESchamber so that the cross-section is vertical <strong>for</strong> the electronbeam. The AES analysis conditions are shown below.AES: PHI670Acceleration voltage: 20 kVSample current: 10 nASample: AuGeNi electrode.A SEM image of the electrode deposited on a GaAssubstrate after FIB process is shown in Photo 4. This electrodewith an AuGeNi layer is given an ohmic property byannealing. Intermetallic compounds are seen inmetal/semiconductor interface and electrode. The rougharea at the upper part of the SEM image is the samplesurface. Photo 5 shows the SEM image and results of elementalmapping of Au, Ge, and Ni in part of AuGeNi/GaAsinterface. Diffusion of Au and behavior of Ge and Ni in the5
AuBarrier layerAuGeNiGaAsA500 nmBCDPhoto 5A) SEM image of electrode/semiconductor interface.B) Au elemental map. C) Ni elemental map. D) Ge elementalmap.metal/semiconductor interface could be observed clearlyfrom the elemental mapping results. The three layers onAuGeNi layer are barrier layers to prevent diffusion of Au,Ge, and Ni, and the film thickness of the entire barrier layersis about 100 nm. These layers are seen to be about600 nm layers in Photo 5. There<strong>for</strong>e, it can be confirmedthat the layers increased in size six times.4. CONCLUSIONA method of FIB sample preparation <strong>for</strong> TEM observationand AES analysis was established. The method describedin this article is expected to contribute to the developmentof devices and materials, which involve fine structuressuch as laser devices.REFERENCES1) H.Koike, Y.Kondo: Proc. of the 56th Annual Meeting of theJapanese Society of Electron Microscopy 203, 2000 (in Japanese)2) K.Mogi, T.Iizuka and M.Suzuki: J. Surface <strong>Analysis</strong>, 7, 2000, 228(in Japanese)6 Furukawa Review, No. 22 2002