

Download pdf guide - VSN International
Download pdf guide - VSN International
Download pdf guide - VSN International

Create successful ePaper yourself
Turn your PDF publications into a flip-book with our unique Google optimized e-Paper software.
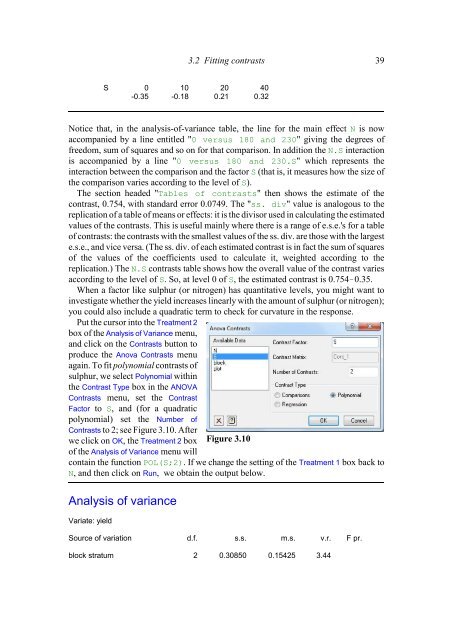
3.2 Fitting contrasts 39S 0 10 20 40-0.35 -0.18 0.21 0.32Notice that, in the analysis-of-variance table, the line for the main effect N is nowaccompanied by a line entitled "0 versus 180 and 230" giving the degrees offreedom, sum of squares and so on for that comparison. In addition the N.S interactionis accompanied by a line "0 versus 180 and 230.S" which represents theinteraction between the comparison and the factor S (that is, it measures how the size ofthe comparison varies according to the level of S).The section headed "Tables of contrasts" then shows the estimate of thecontrast, 0.754, with standard error 0.0749. The "ss. div" value is analogous to thereplication of a table of means or effects: it is the divisor used in calculating the estimatedvalues of the contrasts. This is useful mainly where there is a range of e.s.e.'s for a tableof contrasts: the contrasts with the smallest values of the ss. div. are those with the largeste.s.e., and vice versa. (The ss. div. of each estimated contrast is in fact the sum of squaresof the values of the coefficients used to calculate it, weighted according to thereplication.) The N.S contrasts table shows how the overall value of the contrast variesaccording to the level of S. So, at level 0 of S, the estimated contrast is 0.7540.35.When a factor like sulphur (or nitrogen) has quantitative levels, you might want toinvestigate whether the yield increases linearly with the amount of sulphur (or nitrogen);you could also include a quadratic term to check for curvature in the response.Put the cursor into the Treatment 2box of the Analysis of Variance menu,and click on the Contrasts button toproduce the Anova Contrasts menuagain. To fit polynomial contrasts ofsulphur, we select Polynomial withinthe Contrast Type box in the ANOVAContrasts menu, set the ContrastFactor to S, and (for a quadraticpolynomial) set the Number ofContrasts to 2; see Figure 3.10. Afterwe click on OK, the Treatment 2 boxof the Analysis of Variance menu willFigure 3.10contain the function POL(S;2). If we change the setting of the Treatment 1 box back toN, and then click on Run, we obtain the output below.Analysis of varianceVariate: yieldSource of variation d.f. s.s. m.s. v.r. F pr.block stratum 2 0.30850 0.15425 3.44


