

Download pdf guide - VSN International
Download pdf guide - VSN International
Download pdf guide - VSN International

Create successful ePaper yourself
Turn your PDF publications into a flip-book with our unique Google optimized e-Paper software.
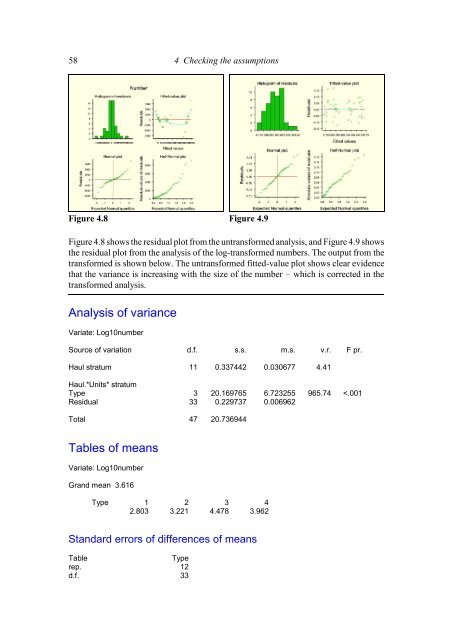
58 4 Checking the assumptionsFigure 4.8 Figure 4.9Figure 4.8 shows the residual plot from the untransformed analysis, and Figure 4.9 showsthe residual plot from the analysis of the log-transformed numbers. The output from thetransformed is shown below. The untransformed fitted-value plot shows clear evidencethat the variance is increasing with the size of the number which is corrected in thetransformed analysis.Analysis of varianceVariate: Log10numberSource of variation d.f. s.s. m.s. v.r. F pr.Haul stratum 11 0.337442 0.030677 4.41Haul.*Units* stratumType 3 20.169765 6.723255 965.74


