Annual Report 2007/2008 - Poverty Alleviation Fund, Nepal
Annual Report 2007/2008 - Poverty Alleviation Fund, Nepal
Annual Report 2007/2008 - Poverty Alleviation Fund, Nepal

You also want an ePaper? Increase the reach of your titles
YUMPU automatically turns print PDFs into web optimized ePapers that Google loves.
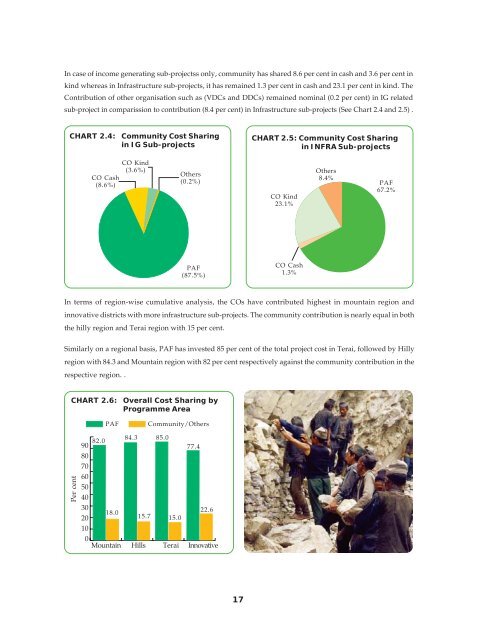
In case of income generating sub-projectss only, community has shared 8.6 per cent in cash and 3.6 per cent inkind whereas in Infrastructure sub-projects, it has remained 1.3 per cent in cash and 23.1 per cent in kind. TheContribution of other organisation such as (VDCs and DDCs) remained nominal (0.2 per cent) in IG relatedsub-project in comparission to contribution (8.4 per cent) in Infrastructure sub-projects (See Chart 2.4 and 2.5) .CHART 2.4:Community Cost Sharingin IG Sub-projectsCHART 2.5: Community Cost Sharingin INFRA Sub-projectsCO Cash(8.6%)CO Kind(3.6%)Others(0.2%)CO Kind23.1%Others8.4%PAF67.2%PAF(87.5%)CO Cash1.3%In terms of region-wise cumulative analysis, the COs have contributed highest in mountain region andinnovative districts with more infrastructure sub-projects. The community contribution is nearly equal in boththe hilly region and Terai region with 15 per cent.Similarly on a regional basis, PAF has invested 85 per cent of the total project cost in Terai, followed by Hillyregion with 84.3 and Mountain region with 82 per cent respectively against the community contribution in therespective region. .CHART 2.6:PAFOverall Cost Sharing byProgramme AreaCommunity/OthersPer cent908070605040302010082.018.084.315.785.015.077.422.6Mountain Hills Terai Innovative17