The trend of PAF investment in income generation activities is presented in graph. It shows that investment onIG sector has continuously increased up to FY 2063/64 and it suddenly decreased in FY 2064/65.2. IG Activities Investment by Sector and RegionIncome generation activities can be grouped into different sector like, agriculture, livestock, service, trading,manufacturing and others. PAF investment by sectors as well as households involved in each sector has beenpresented in table and charts below. The following data on PAF investment in income generating sub-projectsdoes not include the investment related to COs’ capacity building and CO’s institutional management cost.Table 2.9: Sector-wise Income Generation Activities by Households andPAF InvestmentS.N.SectorsFY 2064/65Cumulative AchievementsHHs Amt % of % of HHs Amt % of % of(in m) HHs Invest. (in m) HHs Invest1 Agricultureand forest related 5,496 61.7 6.9 5.4 23,207 165.1 9.7 5.82 Livestock related 62,554 803.5 78.1 69.8 172,567 2,049.1 72.1 72.03 Trade related 8,885 2,26.1 11.1 19.6 28,805 477.8 12.0 16.84 Service 1,899 39.6 2.4 3.4 7,560 102.2 3.2 3.65 Manufacturingand others 1,282 20.1 1.6 1.8 7,105 53.0 3.0 1.9Total 80,115 1,151.1 100 100 239,244 2,847.2 100 100CHART 2.20:Investment in IGAby SectorEither with marginalized land holdings or landless,the rural people, have limited access to basicinfrastructures like road, electricity, market as well asinformation. Therefore, majority of incomegeneration sub-projects are livestock related.Livestock is the largest portfolio of IG activities byinvestment as well as HHs involved. About 72 per centof PAF support is disbursed in this sector and 72.1 percent of IG beneficiaries’ households are engaged onlivestock related activities., followed by trade relatedactivities with 16.8 per cent, agriculture related with 5.8per cent service sector with 3.6 per cent, manufacturingand others activities with about 1.9 per cent.Out of total households involved in livestock, about 30 per cent is engaged in milk production through buffaloand cow raising, 64 per cent in meat production, 4 per cent in ox /he buffalo raising either to do farming orbreeding purposes and the rest 2 per cent for transportation purpose. Data interpretation and figures showthat the communities are themselves smart in selection of activities based on accessibility, existing naturalresources, and potential markets.27
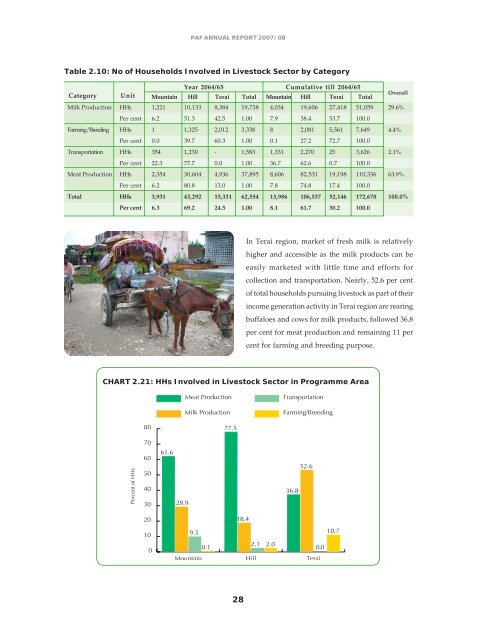
PAF ANNUAL REPORT <strong>2007</strong>/08Table 2.10: No of Households Involved in Livestock Sector by CategoryYear 2064/65 Cumulative till 2064/65Category Unit Mountain Hill Terai Total Mountain Hill Terai TotalOverallMilk Production HHs 1,221 10,133 8,384 19,738 4,034 19,606 27,418 51,059 29.6%Per cent 6.2 51.3 42.5 1.00 7.9 38.4 53.7 100.0Farming/Breeding HHs 1 1,325 2,012 3,338 8 2,081 5,561 7,649 4.4%Per cent 0.0 39.7 60.3 1.00 0.1 27.2 72.7 100.0Transportation HHs 354 1,230 - 1,583 1,331 2,270 25 3,626 2.1%Per cent 22.3 77.7 0.0 1.00 36.7 62.6 0.7 100.0Meat Production HHs 2,354 30,604 4,936 37,895 8,606 82,531 19,198 110,336 63.9%Per cent 6.2 80.8 13.0 1.00 7.8 74.8 17.4 100.0Total HHs 3,931 43,292 15,331 62,554 13,986 106,537 52,146 172,670 100.0%Per cent 6.3 69.2 24.5 1.00 8.1 61.7 30.2 100.0In Terai region, market of fresh milk is relativelyhigher and accessible as the milk products can beeasily marketed with little time and efforts forcollection and transportation. Nearly, 52.6 per centof total households pursuing livestock as part of theirincome generation activity in Terai region are rearingbuffaloes and cows for milk products, followed 36.8per cent for meat production and remaining 11 percent for farming and breeding purpose.CHART 2.21: HHs Involved in Livestock Sector in Programme Area28