COMPUTERSHARE ANNUAL REPORT 2008
COMPUTERSHARE ANNUAL REPORT 2008
COMPUTERSHARE ANNUAL REPORT 2008

You also want an ePaper? Increase the reach of your titles
YUMPU automatically turns print PDFs into web optimized ePapers that Google loves.
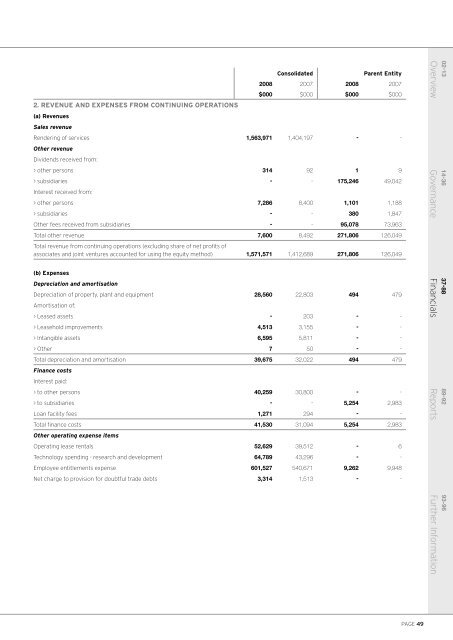
2. REVENUE AND EXPENSES FROM CONTINUING OPERATIONSConsolidatedParent Entity<strong>2008</strong> 2007 <strong>2008</strong> 2007$000 $000 $000 $000(a) RevenuesSales revenueRendering of services 1,563,971 1,404,197 - -Other revenueDividends received from:> other persons 314 92 1 9> subsidiaries - - 175,246 49,042Interest received from:> other persons 7,286 8,400 1,101 1,188> subsidiaries - - 380 1,847Other fees received from subsidiaries - - 95,078 73,963Total other revenue 7,600 8,492 271,806 126,049Total revenue from continuing operations (excluding share of net profits ofassociates and joint ventures accounted for using the equity method) 1,571,571 1,412,689 271,806 126,049(b) ExpensesDepreciation and amortisationDepreciation of property, plant and equipment 28,560 22,803 494 479Amortisation of:> Leased assets - 203 - -> Leasehold improvements 4,513 3,155 - -> Intangible assets 6,595 5,811 - -> Other 7 50 - -Total depreciation and amortisation 39,675 32,022 494 479Finance costsInterest paid:> to other persons 40,259 30,800 - -> to subsidiaries - - 5,254 2,983Loan facility fees 1,271 294 - -Total finance costs 41,530 31,094 5,254 2,983Other operating expense itemsOperating lease rentals 52,629 39,512 - 6Technology spending - research and development 64,789 43,296 - -Employee entitlements expense 601,527 540,671 9,262 9,948Net charge to provision for doubtful trade debts 3,314 1,513 - -02-13Overview14-36Governance37-88Financials89-92Reports93-96Further InformationPAGE 49