The biclust Package - NexTag Supports Open Source Initiatives
The biclust Package - NexTag Supports Open Source Initiatives
The biclust Package - NexTag Supports Open Source Initiatives
You also want an ePaper? Increase the reach of your titles
YUMPU automatically turns print PDFs into web optimized ePapers that Google loves.
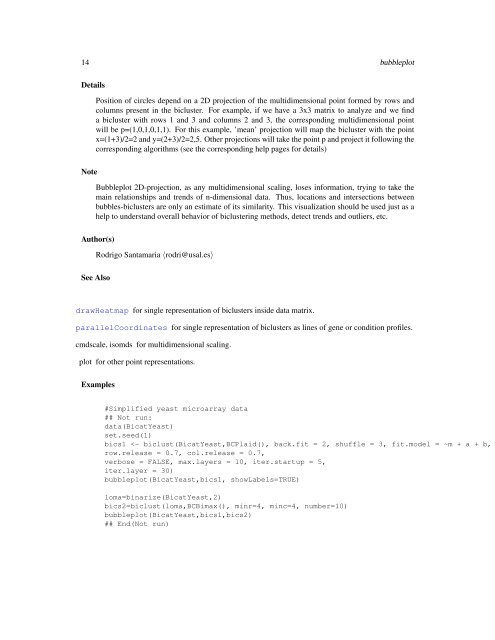
14 bubbleplotDetailsPosition of circles depend on a 2D projection of the multidimensional point formed by rows andcolumns present in the <strong>biclust</strong>er. For example, if we have a 3x3 matrix to analyze and we finda <strong>biclust</strong>er with rows 1 and 3 and columns 2 and 3, the corresponding multidimensional pointwill be p=(1,0,1,0,1,1). For this example, ’mean’ projection will map the <strong>biclust</strong>er with the pointx=(1+3)/2=2 and y=(2+3)/2=2,5. Other projections will take the point p and project it following thecorresponding algorithms (see the corresponding help pages for details)NoteBubbleplot 2D-projection, as any multidimensional scaling, loses information, trying to take themain relationships and trends of n-dimensional data. Thus, locations and intersections betweenbubbles-<strong>biclust</strong>ers are only an estimate of its similarity. This visualization should be used just as ahelp to understand overall behavior of <strong>biclust</strong>ering methods, detect trends and outliers, etc.Author(s)Rodrigo Santamaria 〈rodri@usal.es〉See AlsodrawHeatmap for single representation of <strong>biclust</strong>ers inside data matrix.parallelCoordinates for single representation of <strong>biclust</strong>ers as lines of gene or condition profiles.cmdscale, isomds for multidimensional scaling.plot for other point representations.Examples#Simplified yeast microarray data## Not run:data(BicatYeast)set.seed(1)bics1


