Math POD Student Workbook
Math POD Student Workbook
Math POD Student Workbook

Create successful ePaper yourself
Turn your PDF publications into a flip-book with our unique Google optimized e-Paper software.
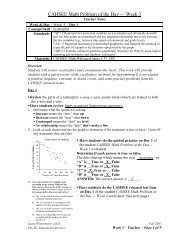
SAUSD CAHSEE <strong>Math</strong> Problem of the Day - Week 3<strong>Student</strong>Interpreting quantitative relationshipquestionsOne graph can have two correlations. The graph belowshows information for Car A and Car B.1. Find the answer for the first item.2. Find the answer for the second item.3. Subtract to find the difference.Example:Day 3(CAHSEE <strong>Math</strong> Released Item #67)ANSWER:Steps to find the answer:1. The x-axis shows the ____________ and they-axis shows the __________.2. Draw a vertical line up from the x-axis at the3 hour point to Car A. Then draw a line overto the y-axis. Car A went _________ miles.3. Draw a vertical line up from the x-axis at the3 hour point to Car B. Then draw a line overto the y-axis. Car B went _________ miles.4. The difference between Car A and Car B is_____ miles - ______ miles = ______ milesANSWER: The correct answer is ______.Laura Westermeier, Ed.D. Fall, 2007Educational Services, SAUSD Week 3 – <strong>Student</strong> - Page 4 of 6